Abstract
Immersion is an important part of reservoir engineering investigation and evaluation. Determining the reasonable and effective burial depth of the critical immersion water table is one of the key scientific issues in the impact assessment of the bearing capacity of reservoir immersion foundations. In this study, basic physical and mechanical property tests were carried out on the soil in the typical immersion area of Xiaonanhai Hydropower Station, and the influence mechanism of saturation on the mechanical properties of building foundation soil and immersion on the bearing capacity of a shallow foundation was obtained. According to the test results, the influence depth of the rising groundwater level on the stability of the building foundation is analyzed, and a method to determine the critical depth of immersion groundwater in the reservoir is proposed. Taking the typical building foundation of Luohuang Town in the immersion area of Xiaonanhai Reservoir as an example, the validity of the critical water depth is further verified. The results show that the safety limit depth of the independent foundation affected by the rise of the water table increases with the increase of the width of the foundation and decreases with the increase of the buried depth of the foundation. Considering the safety limit depth, the critical depth of building immersion is 4.830 m, and without considering the safety limit depth, the critical depth of building immersion is 4.05 m. To a certain extent, it can reduce the impact of water table changes on the bearing capacity of shallow foundations.
1. Introduction
Reservoir immersion will lead to submergence, salinization, deformation, or destruction of building foundations, water filling or gushing of underground works, and a rise in surrounding groundwater levels [1,2,3]. This is a serious environmental and geological problem. Identifying dynamic submergence processes and developing economical and scientific joint mitigation measures to control groundwater submersion is a major challenge [4,5,6], as are ways to reduce the impact of immersion conditions and understand the evolution mechanism of damage [7,8,9]. It will be of great significance to strengthen the research on soil mechanics and chemistry during reservoir impoundment [10,11,12,13]. Some scholars have paid attention to the adverse effects of reservoir immersion on the foundation, analyzed the causes of immersion, and evaluated the immersion effect [14,15,16]. A series of experimental investigations, tests, and numerical simulations have been carried out on the changes in soil water level, mechanical properties, and predicted changes in the immersion area. The research focused mainly on the bearing capacity and deformation of the foundation under the influence of the groundwater level and resulted in a series of achievements [17,18,19].
Wang et al. [20], through field tests, laboratory tests, and references to other engineering experience, comprehensively analyze and propose the recommended critical value of immersion groundwater depth in typical reservoir building areas, study the safety impact of groundwater stagnation and immersion on buildings, classify the degree of impact delineation, and put forward the corresponding engineering treatment plan. Yu et al. [21] established an elastic-plastic calculation model of foundation soil under immersion conditions through many physical and mechanical tests of soils with different saturation and proposed a calculation method for the safe burial depth of shallow foundations. Tang et al. [22] proposed a finite element formula based on effective stress to calculate the bearing capacity of shallow foundations in unsaturated soils. The results show that suction and hydraulic hysteresis directly affect the bearing capacity of unsaturated foundations.
Alencar et al. [23] studied the influence of different groundwater levels on the ultimate bearing capacity of shallow rock foundations and how the groundwater level no longer affects the bearing capacity by using the finite difference method, respectively assessing the width of the foundation, the type of rock mass, the uniaxial compressive strength, and the geological strength index. Safarzadeh and Aminfar [24] studied the effect of the groundwater table drop on the bearing capacity of shallow square model footings on compact sand by conducting plate load tests and finite element software OptumG2 under different groundwater table conditions. The experimental results show that the decrease of the groundwater level increases the matrix suction, and the ultimate bearing capacity of the soil increases nonlinearly from 2.5 times to 4 times the bearing capacity of the saturated state. Roh et al. [25] used the finite element method for the load-settlement curve and axial bearing capacity of the slab foundation with the change in the groundwater level. The results show that the axial bearing capacity changes most significantly when the depth of the water table is 0 to 1.0 times the width of the raft foundation, indicating that the depth of the influence of the water table on the raft foundation is controlled by the size of the raft.
Khan et al. [26] studied the load-settlement response and bearing capacity of ground footings above conduits embedded in soil slopes using laboratory model tests. The test results show that the buried depth of the conduit is the most important parameter affecting the settlement and bearing capacity of the ground footing. Park et al. [27] performed a series of model footing load and cone penetration tests using a hydraulic control room system, considering different groundwater levels and soil conditions. The bearing capacity of the footings decreased as the water table increased and was most pronounced at a water table depth equal to the footing width (1.0 B). The bearing capacity of loose soil with lower relative density decreases more with the groundwater level.
In most of the above studies, few scholars have studied the critical burial depth of building foundations from the perspective of safety impact depth and capillary water level rise to reduce the impact of water table rise in immersion areas on the bearing capacity of shallow foundations. In the process of reservoir survey and design, it is very important to evaluate and analyze the immersion problem. Currently, most engineering circles use the capillary rise height and the foundation depth as the standard for the critical depth of building immersion [28,29,30]. Since the influence of the rising groundwater level on the physical and mechanical properties of the foundation soil layer has not been fully considered, the evaluation of building flooding problems according to this standard is not perfect, and sometimes there are certain risks.
In this paper, natural and saturated soil samples with an area of S = 30 cm2 and a height of H = 2 cm were prepared in the laboratory by taking the low liquid limit clay in the immersion zone with a ring knife and the mechanical properties of compression and consolidation were tested [31,32,33]. The influence of saturation on the strength and deformation index of low liquid limit clay was analyzed. Based on the experimental research, the influence mechanism of immersion on the bearing capacity of the shallow buried foundation is analyzed, and the method for determining the critical burial depth of immersion groundwater in the reservoir is obtained. Taking the typical building foundation of Luohuang Town in the immersion area of Xiaonanhai Reservoir as an example, the influence of foundation width and burial depth on the safety limit depth was studied, and the final critical burial depth of the shallow foundation was determined. The research technology roadmap is as Figure 1:
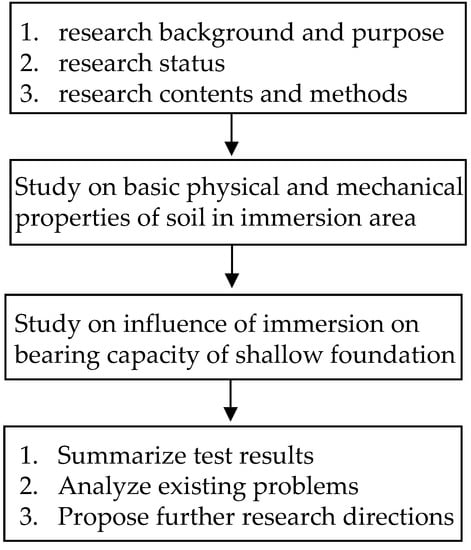
Figure 1.
The Research Roadmap of this paper.
2. Physical and Mechanical Properties Tests
2.1. Physical Properties of Soil
According to the geotechnical structure characteristics of Luohuang Town, the soil mass in Luohuang Town is mainly composed of low liquid limit clay and sand gravel. Two shallow pits were designed in Luohuang Town, and two blocks were sampled along with the depth of each pit. The soil sample numbers in Luohuang Town were LTC1−1, LTC1−2, LTC2−3, and LTC2−4. The sampling depth of LTC1−1 and LTC1−2 is 2 m, and the sampling depth of LTC1−3 and LTC1−4 is 2.5 m. According to field sampling and analysis, the soil layer affected by immersion is mainly a clay layer with a low liquid limit, and the physical properties are shown in Table 1.

Table 1.
Luohuang Town Soil Physical Test Results.
Low liquid limit clay, the particles are mainly powder, the powder content was generally more than 60%, and clay content was less than 20%. The natural density was 1.69 g/cm3~2.01 g/cm3, the average was 1.83 g/cm3, the void ratio was 0.682~0.847, moisture content was 15.8~27.9%, and the converted saturated density is 1.91 g/cm3~2.01 g/cm3, the average value was 1.94 g/cm3, the liquid limit was 27.6~31.1%, the liquid index was mostly 0.07~0.84, the plastic limit was 14.9~17.4%, and the plastic index was mostly 12.7~14.0, showing a hard plastic to a soft plastic state.
In sand and gravel, the structure was mainly loose to slightly dense and partially dense. The content of pebble and gravel was generally 50% to 70%, and the particle gradation was good. The particle size was generally 2 cm to 7 cm, and the diameter of the larger one was greater than 15 cm. Most of the particles are oval or oblate in shape, with relatively good roundness, and their components are dark gray magmatic rock, milky yellow quartzite, gray-white quartz sandstone, and a small amount of purple-red siltstone. The pebbles are filled with light gray medium-fine sand, with clay clumps interposed locally.
2.2. Mechanical Properties of Soil
The original ring-knife soil sample with area S = 30 cm2 and height H = 2 cm was prepared in the laboratory. Using the DGY-2H consolidation instrument and DJY-4 direct shearing instrument, laboratory compression and consolidation quick shear tests under natural and saturated conditions were carried out for the low liquid limit clay of the building foundation in the reservoir area. The saturation adopts the pumping saturation method. For the compression test, LTC1−1, LTC1−2, LTC1−3, and LTC1−4 samples were used. Low liquid limit clays in the natural and saturated state were taken for each sample. The loading pressures were 50 kPa, 100 kPa, 150 kPa, 200 kPa, 250 kPa, and 300 kPa, respectively. For the shear test, the selection of soil samples is the same as that of the compression test. The loading pressure is changed to the consolidation pressure of 100 kPa, 200 kPa, 300 kPa, and 400 kPa, and the shear rate is set to 0.828 mm/min. For the test operation and data arrangement, please refer to the Specification for soil test (SL 237-1999) [34]. Table 2 gives the basic mechanical properties of low-liquid limit clay in natural and saturated states.
Table 2.
Luohuang Town mechanical properties test results.
It can be seen from Table 2 that in the natural state, the compressibility av1-2 of Luohuang Town’s low liquid limit clay was 0.190 MPa−1~0.291 MPa−1, the average value was 0.254 MPa−1, the compressive modulus Es1-2 was 6.160 MPa~8.85 MPa, the average value was 7.195 MPa, Ccq was 8.9 kPa~26 kPa, the average value was 15.88 kPa, Φcq was 23.3°~27.3°, and the average value was 25.83°. Under the saturated state, its compressibility av1-2 was 0.214 MPa−1~0.399 MPa−1, the average value was 0.320 MPa−1, compressive modulus Es1-2 was 4.02 MPa~7.86 MPa, the average value was 5.67 MPa, Φcq was 3.0 kPa~11.1 kPa, the average value was 7.73 kPa, Φcq was 23.1°~29.0°, with an average value of 24.23°.
It can be seen from the above analysis that the cohesion Ccq of the low liquid limit clay in Luohuang Town has a certain discreteness under natural and saturated conditions, and the other indicators have little difference. Through the statistical analysis of the test results, it was suggested that the average value of soil mechanics parameters in Luohuang Town should be taken. The suggested values of the basic mechanical parameters of the Luohuang Town soil compression test, the average compressibility coefficients of the low liquid limit clays in the natural and the saturated state, are 0.254 MPa−1 and 0.320 MPa−1, and the average compressive moduli are 7.195 MPa and 5.67 MPa. For the shear test, the average cohesion was 0.254 kPa and 0.320 kPa, and the average internal friction angles were 25.83° and 24.23°.
Compared with the saturated moisture content, the natural moisture content of most soils in Luohuang Town was quite different, and the saturation was relatively low. Compared with the saturated state, the mechanical properties index in its natural state was smaller in compression modulus and larger in compression. The shear strength index of consolidation quick shearing strength cohesion Ccq and internal friction angle Φcq are greater than those in the saturated state. It can also be seen that in terms of the degree of influence of saturation on the mechanical property index, the influence on the cohesion was stronger than that on the internal friction angle.
2.3. Influence of Saturation on Mechanical Property of Building Foundations
To analyze the influence of reservoir water table changes on the bearing capacity of building foundations, laboratory compression and consolidation quick shear tests with different saturation levels were carried out on typical low liquid limit clay in undisturbed samples of building foundations in Luohuang Town. Using the principle of water content to control saturation, samples with different saturation were prepared by dehumidifying or adding water to the undisturbed soil in its natural state. Four kinds of saturation were prepared for typical soil samples (LTC1−1, LTC2−4), respectively, while other conditions were controlled to be as similar as possible, and the influence of saturation on the mechanical properties of building foundation soil was analyzed. For the test operation and data arrangement, please refer to Specification for soil test (SL 237-1999) [34]. Table 3 shows the basic mechanical properties of typical soil samples in Luohuang Town under different saturation conditions.
Table 3.
Effect of saturation on mechanics index of soil in Luohuang Town.
It can be seen from Table 3 that when the saturation of the LTC1−1 soil sample increased from 51.0% to 100.0%, its compressive index increased from 0.252 MPa−1 to 0.399 MPa−1, and the compressive modulus decreased from 7.24 MPa to 4.02 MPa. The cohesive force was reduced from 26.0 kPa to 6.5 kPa, and the internal friction angle was reduced from 27.3° to 24.1°. When the saturation of the LTC2−4 soil sample increased from 46.50% to 100.0%, its compressive index increased from 0.195 MPa−1 to 0.297 MPa−1, and the compressive modulus decreased from 9.28 MPa to 6.02 MPa. The cohesion force was reduced from 26.9 kPa to 11.1 kPa, and the internal friction angle was reduced from 27.8° to 23.1°.
Figure 2 and Figure 3 show the variation curves of the compressive and mechanical indexes of Luohuang Town LTC1−1 and LTC2−4 soil samples with saturation. It can be seen from the figure that under the same other conditions, with the increase of saturation, the compressive index of low liquid limit clay gradually increases, while the compressive modulus gradually decreases. At the same time, the cohesion and internal friction angle gradually decrease with the increase in saturation. The degree of influence of saturation on the compressive index and compressive modulus was almost the same, and the degree of influence on the cohesion was larger than that of the internal friction angle. It is generally believed that the properties of the soil itself, the structure and composition of the soil, and the bonding between the fine particles affect its shear strength index. The cohesion of soil [35,36,37,38] is the result of the interaction of attraction and repulsion between soil particles, which mainly comes from the mutual attraction between soil particles, the cementation between particles, the mutual connection of water films, etc., while the friction angle [39,40] mainly includes sliding friction and bite friction between solid particles. For low liquid limit clay, with the increase of water content, the lubrication effect of water between particles gradually increases, the bonding force of water film gradually decreases, and the relative motion between soil particles becomes larger. The friction resistance of the clay decreases gradually, and its ability to resist deformation gradually decreases so that the cohesion, internal friction angle, and compressive modulus of the low liquid limit clay gradually decrease, and the compressibility coefficient increases gradually. This will closely relate to the bearing capacity and burial depth of the buildings in the immersion area of the reservoir.
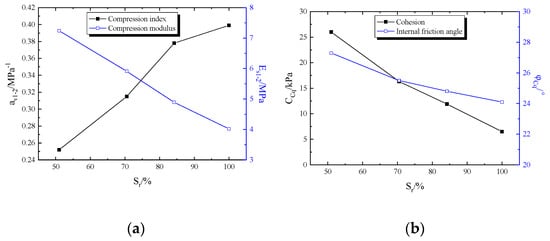
Figure 2.
Variation curve of LTC1−1 sample: (a) compression index with saturation; (b) consolidation quick shear index with saturation.
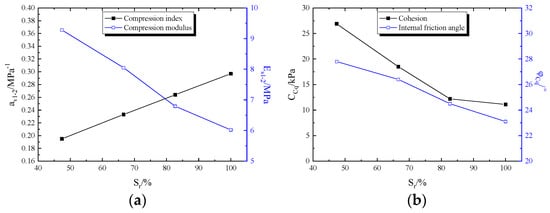
Figure 3.
Variation curve of LTC2−4 sample: (a) compression index with saturation; (b) consolidation quick shear index with saturation.
3. Influence of Immersion on the Bearing Capacity of Shallow Buried Foundation
The prediction of the immersion range of the reservoir is to calculate the stagnant groundwater height through the corresponding formula or seepage software and predict the groundwater return level elevation. The backwater elevation in a certain area is compared with the burial depth of the critical groundwater level; when the burial depth is higher than the critical groundwater level, it can be considered that the immersion phenomenon occurs. Therefore, determining a reasonable and effective immersion critical groundwater level is one of the key scientific issues in reservoir immersion impact assessment.
According to the Code for Hydropower Engineering Geological Investigation (GB50287-2006) [41], the capillary rise height plus the depth of the building foundation is used as the critical burial depth of the building immersed in groundwater. The Code for Engineering Geological Investigation of Water Resources and Hydropower (GB 50487-2008) [42] has two standards, the living environment standard and the building safety standard. When the living environment is used as the standard, the critical burial depth of immersed groundwater is equal to the capillary rise of the topsoil. When the safety of the building is taken as the standard, the value of the critical burial depth of immersion groundwater is equal to the depth of the building foundation plus the capillary rise.
From the experimental research results of the effect of different saturation on soil mechanical properties in Section 2.2, it can be seen that with the rise of the groundwater level, the water content of the soil gradually increases, and the soil changes from an unsaturated state to a saturated state. The compressive index increases, the compressive modulus, cohesion, and internal friction angle also decrease gradually, the soil gradually softens, and the shear strength decreases, which leads to the decrease in the bearing capacity of the foundation and the increase of the foundation deformation. However, the impact assessment of building immersion in the code does not consider the impact of immersion on the bearing capacity of the foundation. That is, the depth of the safe impact of groundwater level rise on the stability of the building foundation is not considered. For low liquid limit clay foundations, after the groundwater rises into the foundation bearing layer, it will impact the bearing capacity and deformation stability of the building foundation, and its degree will gradually become serious with the rise of the groundwater level.
In this section, according to the load type, foundation type, and foundation buried depth of the building, the self-weight stress, additional stress, and foundation bearing capacity of the foundation at different buried depths of groundwater are analyzed and calculated according to the different depths of the groundwater level below the base. Based on the safety sensitivity analysis of the building foundation, an appropriate method to determine the critical buried depth of groundwater is sought. The typical building foundation of Luohuang Town in the immersion area of Xiaonanhai reservoir was analyzed as an example, which provides a strong basis for the delimitation of the treatment scope of immersion buildings in the reservoir area.
3.1. Influence Mechanism of Reservoir Immersion on Bearing Capacity of Shallow Buried Foundation
After the completion of reservoir construction and water storage, the groundwater level in the foundation soil of buildings has been at a high level for a long time. Under specific geological and topographic conditions, the buildings in the reservoir area will be immersed, resulting in adverse effects. The rise of groundwater level has a particularly obvious impact on shallow foundation buildings, and the harm is relatively large.
When the groundwater level is low, the water content of the building foundation soil is small, the effective weight of the soil body is large, and the cohesion and internal friction angle are large. Thus, the bearing capacity of the foundation is high, and the bearing capacity of the building foundation is high, and deformation stability can meet the requirements. From the research on the influence of different saturation degrees on soil mechanical properties in Section 2.2, it can be seen that under the same other conditions, with the increase of saturation, the compressive index of low liquid limit clay gradually increases, while the compressive modulus gradually decreases. At the same time, the cohesion and internal friction angle gradually decrease with the increase of saturation. When the groundwater level rises, the soil changes from an unsaturated state to a saturated state. For the soil immersion below the groundwater level, due to the loss of the apparent cohesion formed by weak binding force or capillary stress, the internal friction angle of the soil gradually decreases, the compressive index increases, and the compressive modulus gradually decreases. The soil gradually softens and the shear strength decreases, resulting in a decrease in the bearing capacity of the foundation and an increase in the deformation. At the same time, due to the existence of groundwater, the effective weight of the soil decreases, which leads to a decrease in the bearing capacity of the soil. The immersion of the reservoir affects the bearing capacity of the shallow foundation in two aspects.
3.2. Depth of Safety Impact of Rising Groundwater Level on Building Foundation Stability
According to the test and analysis of the influence of different saturation degrees on soil mechanical properties, it can be seen that the bearing capacity and strength characteristics of clay foundations with a low liquid limit are highly correlated with their moisture content. After the groundwater rises into the foundation bearing layer, it will impact the bearing capacity and deformation stability of the building foundation, and its degree will gradually become serious with the rise of the groundwater level. Therefore, it is necessary to conduct an in-depth analysis of the depth of the safety impact of the rise of the groundwater level on the stability of the low liquid limit clay foundation to provide a basis for the definition of the immersion affected area. According to the analysis of the immersion mechanism of buildings in Section 3.1, combined with the physical and mechanical properties test of low liquid limit clay in typical immersion areas in Section 2, when the distance from the groundwater level to the bottom of the foundation is at a certain value, the bearing capacity of the foundation is equal to the sum of the additional stress of the building and the self-weight stress of the soil. This value is the safe depth affected by the rise of the groundwater level, as shown in Figure 4. The following will detail the method to obtain the foundation bearing capacity of the soil layer at the groundwater level and the additional stress of the building there.
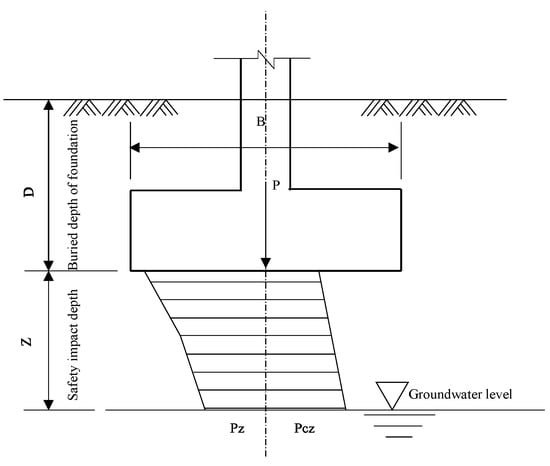
Figure 4.
Safe depth for the impact of groundwater level rise.
According to article 5.2.7 of the Code for Design of Building Foundations (GB50007-2011) [43], the sum of additional stress and self-weight stress at the groundwater table should satisfy the following formula:
where Fk is the vertical force value transmitted from the superstructure to the top surface of the foundation corresponding to the standard combination of the load-open effect. Gk is the sum of the foundation and the soil self-weight on the foundation. A is the foundation bottom area. fac is the corrected eigenvalues of foundation bearing capacity.
Pk = ((Fk + Gk)/A) ≤ fac
The Pz value in the figure can be solved by the corner point method according to the additional stress under the corner points of the rectangular uniform load, that is, Pz = 4, which is the additional stress coefficient of the corner point of the 1/4 rectangle of the foundation bottom. The value in the table in Appendix K.0.1-1 of Code for Design of Building Foundations (GB50007-2011) [43], and is the additional stress of the base.
Different groundwater levels are set along the base. The additional stress, self-weight stress, and foundation bearing capacity are calculated according to the methods in the Code for Design of Building Foundations (GB50007-2011) [43]. Generally speaking, when the size and burial depth of the foundation are constant, the additional stress below the bottom surface of the foundation gradually decreases, the self-weight stress gradually increases, and the bearing capacity of the foundation increases gradually. When the sum of the self-weight stress and additional stress at the groundwater level is equal to the bearing capacity of the foundation, the distance from the groundwater level to the basement at this time is the safe depth affected by the rise of the groundwater level.
3.3. Determination of Immersion Critical Groundwater Depth
Determining the immersion critical groundwater depth is the basis for judging the impact of immersion and the boundary conditions for determining the scope of the immersion area. When the burial depth of the critical groundwater is greater than the predicted burial depth of the diving backwater, the area is determined to be an immersion zone. The burial depth of immersion critical groundwater should be determined through field observation and local production practice experience according to soil properties, groundwater salinity, the height of soil capillary water rising zone, or the depth of building foundations.
For low liquid limit clay and silt foundations, after groundwater enters the foundation bearing layer, it will affect the bearing capacity and deformation stability of the building foundation, and the degree of influence will increase with the rise of groundwater. According to the load type of the building, the type of foundation, the depth of the foundation, and the different depths of the groundwater table below the base, the additional stress, self-weight stress, and foundation bearing capacity of the foundation soil of the shallow-buried foundation are calculated. Sensitivity analysis is carried out on the safety of the building to determine the safety impact depth z of the groundwater level rise on the stability of the building foundation. At the same time, considering the rising height of capillary water, the critical groundwater level buried depth of this kind of foundation soil is determined as the foundation buried depth plus the rising height of capillary water and the safety influence depth z, as shown in Figure 5. However, the impact of the security impact depth z is not considered in the current specifications.
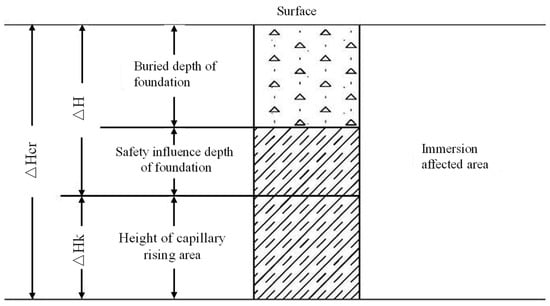
Figure 5.
Schematic diagram of immersion critical groundwater depth (Hcr) in the construction area.
The height of the capillary water rising area of the soil layer above the groundwater level can be directly measured in test pits and exploratory wells. Or it can be measured according to the appropriate water content of the soil layer during the growing period of crops, and the relationship curve of the soil layer water content above the groundwater level measured on-site with depth selected. Urban residential areas can be determined by comparing the relationship curve of soil moisture content above the groundwater level with the natural moisture content of the foundation-bearing layer before the reservoir is impounded.
3.4. Immersion Prediction Engineering Example
For an independent foundation in the urban area of Luohuang Town, the structure type is shown in Figure 6, and the size of the bottom surface of the foundation is shown in Table 4. The foundation was placed in a low liquid limit clay layer, and the basic physical and mechanical parameters of the soil are shown in Table 5. The capillary water rise height of the low liquid limit clay was 1.3 m, the base pressure was 150 kPa, and the foundation bearing capacity of the low liquid limit clay in the saturated state was 105 kPa. The influence of different foundation widths and foundation burial depths on the safe depth of groundwater was studied through the calculation method of the safe depth of the groundwater level rise on the stability of the building foundation in Section 2.2. The specific calculation results are shown in Table 6, Table 7, Table 8, Table 9, Table 10, Table 11 and Table 12.
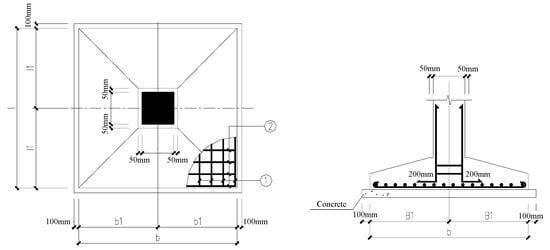
Figure 6.
Foundation structure type.
Table 4.
Dimensions of foundation bottom.
Table 5.
Calculation parameters of the soil mass.
Table 6.
Calculation results of foundation bearing capacity (b = 1.5 m, d = 2.5 m).
Table 7.
Calculation results of foundation bearing capacity (b = 2.0 m, d = 2.5 m).
Table 8.
Calculation results of foundation bearing capacity (b = 2.5 m, d = 2.5 m).
Table 9.
Calculation results of foundation bearing capacity (b = 3 m, d = 2.5 m).
Table 10.
Calculation results of foundation bearing capacity (b = 2.0 m, d = 2.0 m).
Table 11.
Calculation results of foundation bearing capacity (b = 2.0 m, d = 2.25 m).
Table 12.
Calculation results of foundation bearing capacity (b = 2.0 m, d = 2.75 m).
Among them, according to the mechanical parameters of the low liquid limit clay obtained from the reservoir immersion geotechnical test, and through the calculation formula of the characteristic value of the foundation bearing capacity, the characteristic value fac of the foundation bearing capacity of the saturated soil with various groundwater levels can be calculated separately. The revised formula for the critical load P1/4 of Code for Design of Building Foundations (GB50007-2011) [43]:
where is the modified foundation bearing capacity characteristic value determined by the shear strength index of the soil, is the standard value of soil cohesion in the depth of one time of the width of the short side under the foundation, and is the weight of the foundation soil below the bottom of the foundation, and the buoyant unit weight below groundwater level. is the width of the bottom surface of the foundation. When it is greater than 6 m, it is considered as 6 m. For sandy soil less than 3 m, it is considered as 3 m. is the overload on both sides of the foundation ( is the weighted average weight of the soil layer within the range of the foundation buried depth . , and are the bearing capacity coefficients according to the standard value of the internal friction angle of the soil , is the standard value of the internal friction angle of soil in the depth of one time of the width of the short side under the base (°). It can be seen that the bearing capacity of the foundation is related to the cohesion, internal friction angle of the foundation soil, and the weight of soil mass above and below the foundation bottom. Therefore, the storage state and dynamic changes of groundwater have a significant impact on the bearing capacity of the foundation.
Figure 7 is a schematic diagram of the safe depth affected by the groundwater level rise. It can be seen from the figure that Pz + Pcz decreases with the increase of z, and increases with the increase of z. The x-axis coordinate of the intersection is the safe depth affected by the groundwater level rise. When b = 1.5 m and d = 2.5 m, the limit depth is 0.40 for the influence of groundwater level rise. When b = 2.0 m and d = 2.5 m, the limit depth of the impact of groundwater level rise was 0.520. When b = 2.5 m and d = 2.5 m, the limit depth of the impact of groundwater level rise was 0.650. When b = 3.0 m and d = 2.5 m, the limit depth was 0.780 for the impact of groundwater level rise. When b = 2.0 m and d = 2.0 m, the limit depth for the impact of groundwater level rise was 0.70. When b = 2.0 m and d = 2.25 m, the limit depth was 0.625 for the impact of groundwater level rise. When b = 2.0 m and d = 2.75 m, the limit depth for the impact of groundwater level rise was 0.398. When the water level rises, the cohesion force and the internal friction angle gradually decrease with the increase of saturation, the effective weight of the soil decreases, and the pore water pressure gradually increases. Therefore, with the rise of the water table, the bearing capacity of the groundwater table shows a decreasing trend.
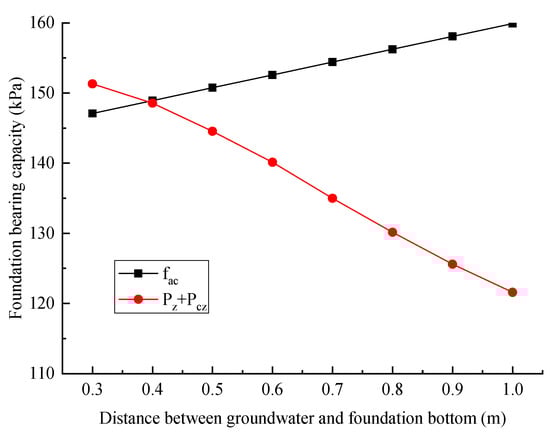
Figure 7.
Schematic diagram of the influence of the rising groundwater level on the safe depth.
Figure 8 and Figure 9 show the variation curves of the limit depth affected by the rise of the groundwater level with the width and burial depth of the basement. It can be seen that under generally similar other conditions, the limit depth of the influence of the rise of the groundwater level on the independent foundation increases with the increase of the width of the foundation and decreases with the increase of the buried depth of the foundation. According to Formula (3), when the foundation width increases, the ultimate bearing capacity of the foundation also increases. As the burial depth increases and the foundation width remains unchanged, it can be seen from (Fk + Gk)/A that the sum of the additional stress and self-weight stress at the groundwater table will gradually decrease. Therefore, the bearing capacity of the foundation will also gradually decrease, and the allowable safety depth will decrease with the increase of the buried depth of the foundation.
where , , and are the bearing capacity coefficients, their magnitudes only depend on the size of the internal friction angle, c is the cohesive force, represents the resistance force generated by the self-weight of the sliding soil, and represents the resistance due to the side load , represents the resistance due to the cohesion on the slip surface.
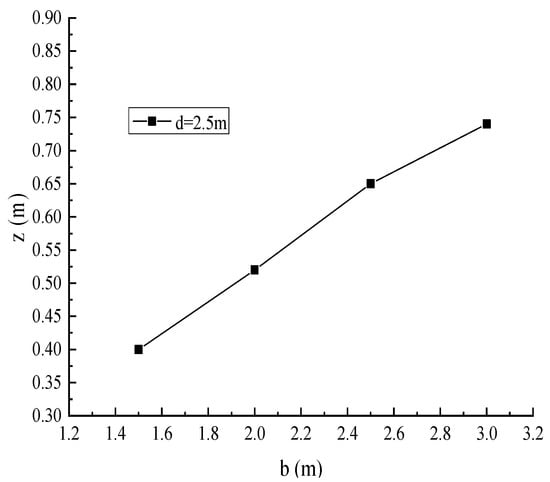
Figure 8.
Influence of foundation width on safety depth.
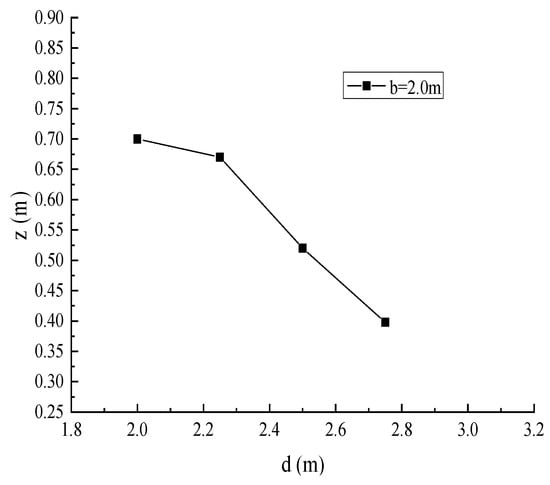
Figure 9.
Influence of foundation burial depth on safe depth.
It can be seen from Section 2.3 that when the foundation depth, width, impact safety depth, and capillary water rise height of the building are known, the corresponding critical burial depth of groundwater immersion can be determined. From the perspective of safety, in this example, the building foundation in the Luohuang reservoir area was buried with a depth of 2.75 m and a width of 3.0 m, and the critical value of the effects of the safety depth was 0.780 m. Therefore, the critical immersion depth of buildings in this area was 4.830 m.
4. Discussion
According to the Code for hydropower engineering geological investigation (GB50287-2006) [41], the capillary rise height plus the depth of the building foundation is used as the critical burial depth of the building immersed in groundwater. The safe depth of the impact of the building is not considered, and the critical standard for immersion in this area is 4.05 m. After considering the safe depth of groundwater rise, the predicted range of the immersion area will increase to a certain extent. There is a certain degree of safety risk in delineating the scope of the building immersion area using the normative method. As a result, the bearing capacity of the shallow foundation considered is smaller than the actual demand. The influence of the safe depth of groundwater rise should be considered in the actual immersion prediction.
In addition, it is possible to study the influence of porosity and permeability [44], different foundation types, and the reinforcement of the foundation in the immersion area, to more accurately calculate the appropriate burial depth of the foundation in the immersion area and reduce the risk and loss of immersion.
5. Conclusions
The following main conclusions are drawn from this study:
- (1)
- Through the sampling analysis of drilling holes and pits, the foundation soil layer affected by immersion is mainly a low-liquid-limit clay layer. The physical mechanics of the main soil layers of the building foundation in the typical immersion area in the natural and saturated state are carried out, and the geotechnical test parameters for evaluating the impact of reservoir submersion are obtained.
- (2)
- The results show that the compressive index of low liquid limit clay increases gradually with the increase of saturation, while the compressive modulus decreases gradually. At the same time, the cohesion and internal friction angle gradually decrease with the increase of saturation.
- (3)
- Based on the relevant specifications for the critical burial depth of submerged groundwater for buildings and the research on the immersion mechanism of reservoirs, a method for determining the critical burial depth of submerged buildings was proposed. Among them, the influence of the rising groundwater level on the stability of the building foundation can be considered, and the method and process of determining the depth of the safety influence limit are given.
- (4)
- The immersion example of typical building foundations in Luohuang Town, Xiaonanhai Reservoir immersion area was analyzed, and the influence of foundation width and burial depth on the safety limit depth was studied. Other conditions being the same, the limit depth of independent foundation groundwater level rise varies with the width of the foundation increases and decreases with the increase of the depth of the foundation.
- (5)
- The effects of porosity, permeability, different foundation types, and reinforcement measures can also be studied. Thereby increasing the bearing capacity of the building foundation, reducing the influence of the rising water table in the immersion area, and ensuring the safe use of the building.
Author Contributions
Data curation, W.C.; Investigation, W.C.; Methodology, E.W.; Project administration, Q.L.; Resources, E.W.; Writing—review & editing, Q.L. All authors have read and agreed to the published version of the manuscript.
Funding
This research received no external funding.
Institutional Review Board Statement
Not applicable for studies not involving humans or animals.
Informed Consent Statement
Not applicable for studies not involving humans.
Conflicts of Interest
The authors declare no conflict of interest.
References
- Wang, Y.; Qin, X.R.; Feng, X. Analysis on the Effect of Reservoir Immersion in Yanqing New Town. Adv. Mater. Res. 2014, 1010, 1317–1321. [Google Scholar] [CrossRef]
- Xu, D.S.; Chen, W.; Fan, X. Experimental investigation of particle size effect on the self-healing performance of microcapsule for cemented coral sand. Constr. Build. Mater. 2020, 256, 119343. [Google Scholar] [CrossRef]
- Lin, P.; Zhao, S.L.; Li, A.; Li, M.H. Effect of Infiltration into cliff debris on the stability of slope. Geotech. Investig. Surv. 2002, 1, 26–28. [Google Scholar]
- Yang, Y.; Nan, W.; Guo, S.; Jin, D.; Wu, J.H.; Zhang, Y.; Dou, Z.; Zhou, Z.F. Application of numerical modeling to reservoir immersion assessment and control in dual-formation hydrogeological unit. Water Supply 2021, 21, 2357–2373. [Google Scholar] [CrossRef]
- Dos Santos, J.S.; De Oliveira, E.; Bruns, R.E.; Gennari, R.F. Evaluation of the salt accumulation process during inundation in water resource of Contas river basin (Bahia Brazil) applying principal component analysis. Water Res. 2004, 38, 1579–1585. [Google Scholar] [CrossRef]
- Xu, D.S.; Liu, H.B.; Luo, W.L. Development of a novel settlement monitoring system using fiber-optic liquid-level transducers with automatic temperature compensation. IEEE Trans. Instrum. Meas. 2018, 67, 2214–2222. [Google Scholar] [CrossRef]
- Wang, F.; Liang, N.; Li, G. Damage and failure evolution mechanism for coal pillar dams affected by water immersion in underground reservoirs. Geofluids 2019, 2019, 2985691. [Google Scholar] [CrossRef]
- Fang, M. Analysis on subsidence of roadbed effect with the high water level in reservoir area. Highw. Eng. 2009, 34, 118–121. [Google Scholar]
- Xu, D.S.; Liu, Q.; Qin, Y.; Chen, B. Analytical approach for crack identification of glass fiber reinforced polymer–sea sand concrete composite structures based on strain dissipations. Struct. Health Monit. 2020. [Google Scholar] [CrossRef]
- Ying, C.; Hu, X.; Zhou, C.; Siddiqua, S.; Makeen, G.M.H.; Wang, Q.; Xu, C. Analysis of chemo-mechanical behavior of silty soil under long-term immersion in saline reservoir water. Bull. Eng. Geol. Environ. 2021, 80, 627–640. [Google Scholar] [CrossRef]
- Qin, Y.; Wang, Q.K.; Xu, D.S.; Yan, J.M.; Zhang, S.S. A FBG based earth and water pressure transducer with 3D fused deposition modeling approach for soil mass. J. Rock Mech. Geotech. 2022, 14, 663–669. [Google Scholar] [CrossRef]
- Gao, H.X.; Shi, P. Study on Bearing capacity and settlement of shallow foundation with underground water. J. Shandong Univ. Technol. 2017, 31, 22–25. [Google Scholar]
- Nieć, J.; Zawadzki, P.; Kaluża, T. Numerical Simulation of Groundwater Level Changes: A Case Study of the Struzyna Reservoir. Rocz. Ochr. Śr. 2019, 21, 141–156. [Google Scholar]
- Fowler, D.K.; Maddox, J.B. Habitat improvement along reservoir inundation zones by barge hydroseeding. J. Soil Water Conserv. 1974, 29, 263–265. [Google Scholar]
- Chen, J.; Huang, Y.; Yang, Y.; Wang, J. Evaluation of the influence of Jiangxiang reservoir immersion on corp and residential areas. Geofluids 2018, 2018, 9720970. [Google Scholar] [CrossRef] [Green Version]
- Xu, D.S.; Huang, M.; Zhou, Y. One-dimensional compression behavior of calcareous sand and marine clay mixtures. Int. J. Geomech. 2020, 20, 04020137. [Google Scholar] [CrossRef]
- Zheng, X.; Zhang, B.X.; Deng, Z.R.; Cao, D.N. Judgment method and inundation degree evaluation for inundation area of Danjiangkou Reservoir. Yangtze River 2011, 42, 19–23. [Google Scholar]
- Qin, Y.; Wang, Q.; Xu, D.S.; Chen, W. Mechanical behavior and healing efficiency of microcapsule-based cemented coral sand under various water environments. Materials 2021, 14, 5571. [Google Scholar] [CrossRef]
- Wang, Q.H.; Tao, L.J.; Han, Y.X. Study on the characteristics of rock mass and stability of the Liujiaxia bridge abutment at reservoir bank. Highw. Eng. 2013, 38, 52–66. [Google Scholar]
- Wang, B.; Bai, C.F.; Jia, J.H. Influence of reservoir inundation on structures area and treatment measures. Yangtze River 2013, 44, 75–78. [Google Scholar]
- Yu, Z.L.; Wang, Y.L. Calculation method for critical depth of a shallow foundation building in reservoir immersion area. J. Yangtze River Sci. Res. Inst. 2014, 31, 53–56. [Google Scholar]
- Tang, Y.; Taiebat, H.A.; Russell, A.R. Bearing capacity of shallow foundations in unsaturated soil considering hydraulic hysteresis and three drainage conditions. Int. J. Geomech. 2017, 17, 04016142. [Google Scholar] [CrossRef]
- Alencar, A.; Galindo, R.; Melentijevic, S. Influence of the groundwater level on the bearing capacity of shallow foundations on the rock mass. Bull. Eng. Geol. Environ. 2021, 80, 6769–6779. [Google Scholar] [CrossRef]
- Safarzadeh, Z.; Aminfar, M.H. Experimental and numerical modeling of the effect of groundwater table lowering on bearing capacity of shallow square footings. Int. J. Eng. 2019, 32, 1429–1436. [Google Scholar]
- Roh, Y.; Kim, I.; Kim, G.; Junhwan, L. Comparative analysis of axial load capacity for piled-raft foundation with changes in groundwater level. KSCE J. Civ. Eng. 2019, 23, 4250–4258. [Google Scholar] [CrossRef]
- Khan, M.U.A.; Shukla, S.K. Load–Settlement Response and Bearing Capacity of a Surface Footing Located Over a Conduit Buried Within a Soil Slope. Int. J. Geomech. 2020, 20, 04020173. [Google Scholar] [CrossRef]
- Park, D.; Kim, I.; Kim, G.; Lee, J. Groundwater effect factors for the load-carrying behavior of footings from hydraulic chamber load tests. Geotech. Test. J. 2017, 40, 440–451. [Google Scholar] [CrossRef]
- Yang, J.X.; Li, F.J.; Chen, T.H. The Influence about water table rise on bearing capacity of shallow foundations. Constr. Des. Proj. 2010, 6, 95–99. [Google Scholar]
- Xu, D.S.; Zhang, Z.; Qin, Y.; Yang, Y. Effect of particle size on the failure behavior of cemented coral sand under impact loading. Soil Dyn. Earthq. Eng. 2021, 149, 106884. [Google Scholar] [CrossRef]
- Zhang, Y.; Yao, Z.G.; Liu, Z.H. Study on impact of reservoir immersion on buildings and its evaluation standard. Yangtze River 2014, 45, 74–77. [Google Scholar]
- Wan, J.; Zhu, J.; Xiao, H.; Ma, Q. Study on mechanical and ecological properties of fly ash substrate for ecological slope protection. Adv. Civ. Eng. 2019, 2019, 8095219. [Google Scholar] [CrossRef] [Green Version]
- Li, G.R.; Li, X.L.; Chen, W.T.; Li, J.F.; Zhu, H.L.; Hu, X.S.; Zhou, H.K.; Sun, H.Q. Effects of degradation severity on the physical, chemical and mechanical properties of topsoil in alpine meadow on the Qinghai-Tibet Plateau, west China. Catena 2020, 187, 104370. [Google Scholar] [CrossRef]
- Wei, H.Z.; Xu, D.S.; Meng, Q.S. A newly designed fiber-optic based earth pressure transducer with adjustable measurement range. Sensors 2018, 18, 932. [Google Scholar] [CrossRef] [Green Version]
- SL237-1999; Specific Cation of Soil Test. China Water Power Press: Beijing, China, 1999.
- Noroozi, A.G.; Hajiannia, A. The effect of cohesion and level of groundwater on the slope instability using finite element method. Int. J. Sci. Eng. Res. 2015, 6, 96–99. [Google Scholar]
- Shen, J.; Xu, D.S.; Liu, Z.; Wei, H. Effect of particle characteristics stress on the mechanical properties of cement mortar with coral sand. Constr. Build. Mater. 2020, 260, 119836. [Google Scholar] [CrossRef]
- Xu, D.S.; Zhao, Y.M.; Liu, H.B.; Zhu, H.H. Deformation monitoring of metro tunnel with a new ultrasonic-based system. Sensors 2017, 17, 1758. [Google Scholar] [CrossRef] [Green Version]
- Xu, D.S.; Su, Z.Q.; Lalit, B.; Qin, Y. A hybrid FBG-based load and vibration transducer with a 3D fused deposition modelling approach. Meas. Sci. Technol. 2022, 33, 065106. [Google Scholar] [CrossRef]
- Rasti, A.; Adarmanabadi, H.; Pineda, M.; Reinikainen, J. Evaluating the effect of soil particle characterization on internal friction angle. Am. J. Eng. Appl. Sci. 2021, 14, 129–138. [Google Scholar] [CrossRef]
- Chen, Z.X.; Wang, R.; Hu, M.J.; Wang, Z.B.; Xu, D.S. Study of content of clay particles for debris flow occurrence in Jiangjia Ravine. Rock Soil Mech. 2010, 31, 2197–2201. [Google Scholar]
- GB50287-2006; Code for Hydropower Engineering Geological Investigation. China Planning Press: Beijing, China, 2006.
- GB 50487-2008; Code for Engineering Geological Investigation of Water Resources and Hydropower. China Planning Press: Beijing, China, 2009.
- GB50007-2011; Code for Design of Building Foundation. China Architecture and Building Press: Beijing, China, 2012.
- Zheng, G.; Sun, B.; Lv, D.W.; Pan, Z.J.; Lian, H.Q. Study on reservoir properties and critical depth in deep coal seams in Qinshui Basin, China. Adv. Civ. Eng. 2019, 2019, 1683413. [Google Scholar] [CrossRef]
Publisher’s Note: MDPI stays neutral with regard to jurisdictional claims in published maps and institutional affiliations. |
© 2022 by the authors. Licensee MDPI, Basel, Switzerland. This article is an open access article distributed under the terms and conditions of the Creative Commons Attribution (CC BY) license (https://creativecommons.org/licenses/by/4.0/).