Abstract
As one of the most important components within a vehicle, diesel engines have high requirements for reliability due to the harsh operating environments. However, previous studies have mainly focused on the reliability assessment of diesel engines, while less research has been conducted on the modeling of the diesel engine reliability analysis and its management. For this reason, this paper proposes a comprehensive method for reliability analysis and its management based on the use of 4F integration technology in the early stages of diesel engine design. First of all, an expert group used FEMCA (failure mode, effects and criticality analysis) and FHA (functional hazard analysis) to find the most harmful level of fault mode. At the same time, a new method for the repair of dynamic fault trees to find the weak links at the component level was developed. Finally, a FRACAS (fracture report analysis and corrective action system) was used during the above analysis process. By applying this method to the reliability assessment of a diesel engine in the design stage, the problems of failure information feedback and the reuse of failure information in the actual reliability assessment can be solved.
1. Introduction
Vehicle diesel engines [1] are mainly used in the transportation industry and represent the main driving force for heavy vehicles. A variety of factors are considered when selecting a diesel engine for a heavy vehicle, including the reliability and availability of the engine, the maintenance and installation costs of the engine, and the running costs of the engine. However, the operating and maintenance costs of each diesel engine are very important for vehicle operation. This is why transport companies are committed to developing and improving engine performance to suit their operations and optimize engine performance control. Improving engine performance is the key to ensuring the best results during use and predicting faults in time to extend the service life of the vehicle. Therefore, it is necessary to focus on improving the reliability of vehicle diesel engines. The most effective way to improve the working reliability of a diesel engine is to introduce the concept of reliability at the design stage [2] and to prevent potential hazards by using the corresponding reliability calculations and analyses (reducing the costs of product manufacture and improving the reliability of the product life cycle in the process). In this regard, the reliability analysis and its management at the design stage are particularly important. Therefore, in this study, 4F integration technology was used to control the reliability of a diesel engine at the design stage.
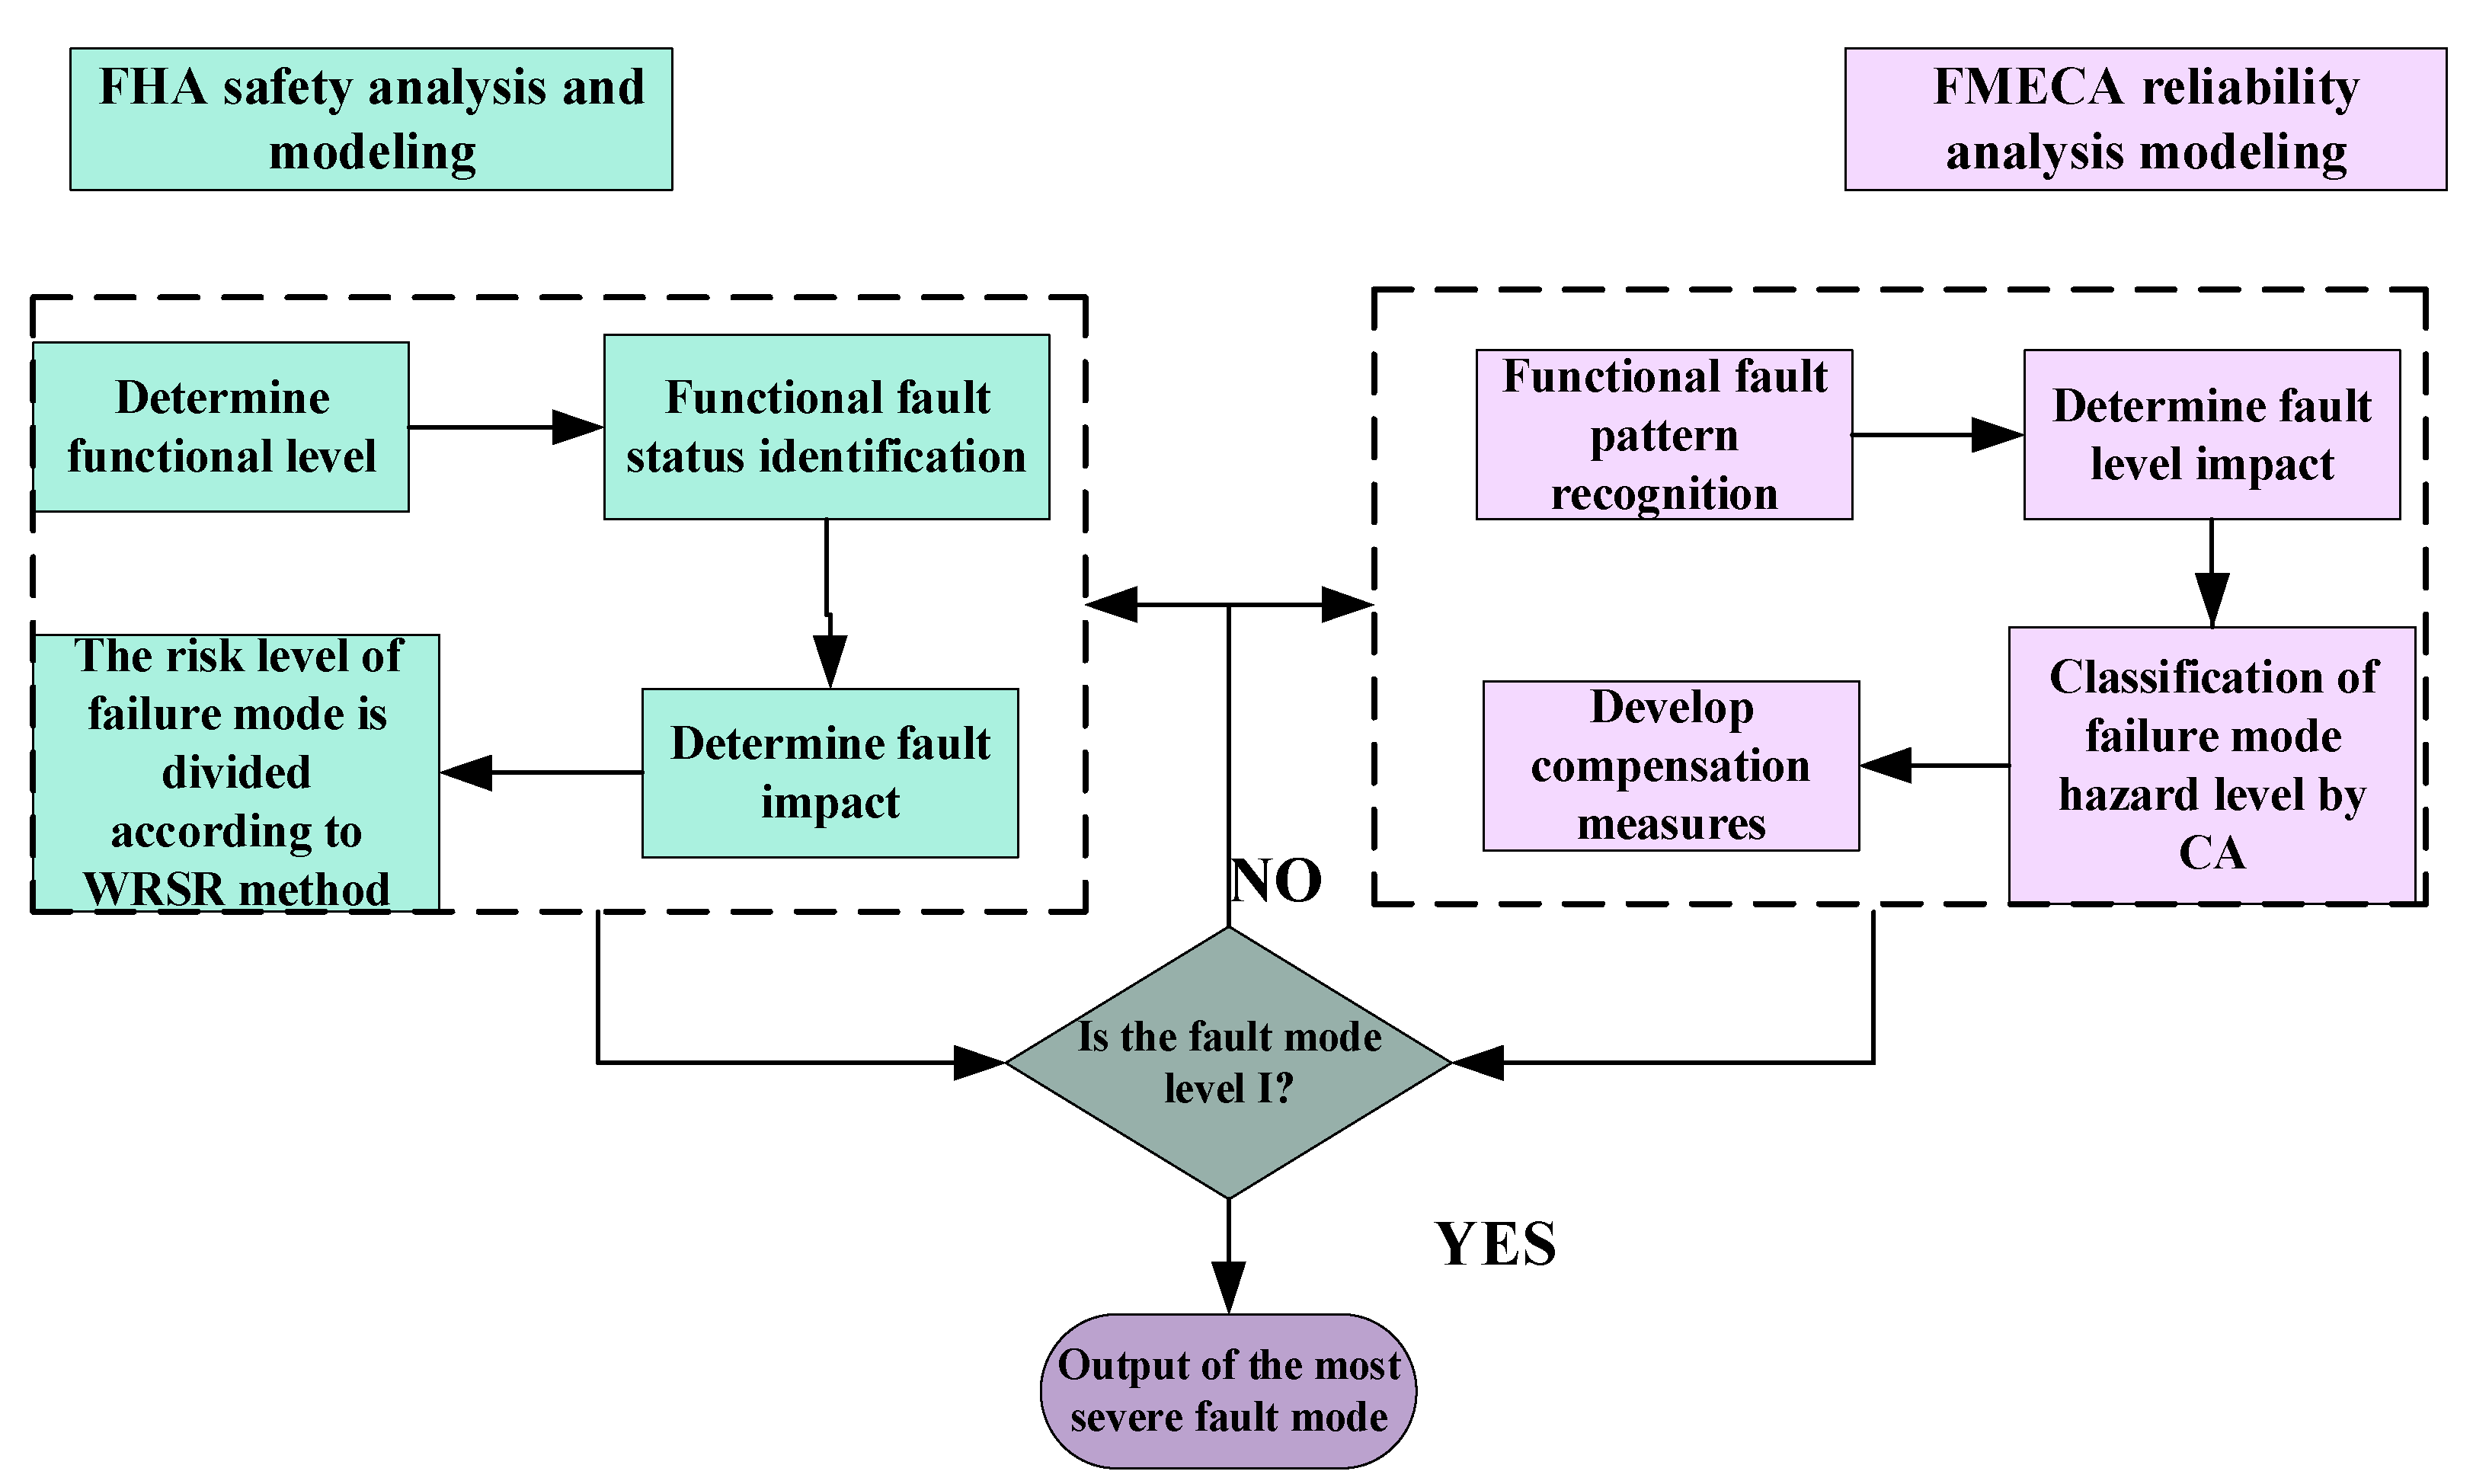
Various methods for evaluating the qualitative analyses of faults in new systems exist in the literature. The most commonly used qualitative fault analysis methods are FMECA and FHA [3,4], which help analysts to systematically identify fault modes and assess their hazards. These two methods usually rely on the experience of the researchers who are involved in the development of new systems to determine the degree of damage that is caused by new system failure modes. FMECA is an inductive and unstructured method for identifying failure modes and design weaknesses [5], while FHA is a method for identifying the fault effects of each function at each operational stage and classifying the severity of those fault effects [6]. Therefore, FMECA conducts a failure hazard analysis for the design phase of new systems, while FHA focuses on assessing the hazards that are associated with the system operations.
On the other hand, FTA and FRACAS [7] are also commonly used tools for the reliability evaluation of new systems. The former is a bottom-up approach that uses logic gates and event causes to simulate failure relationships between the entire system and its components [8]. This enables the determination of the time at which the entire system least expects to suffer a fault, using quantitative reliability information (e.g., failure rate) for each component as the input. A FRACAS [
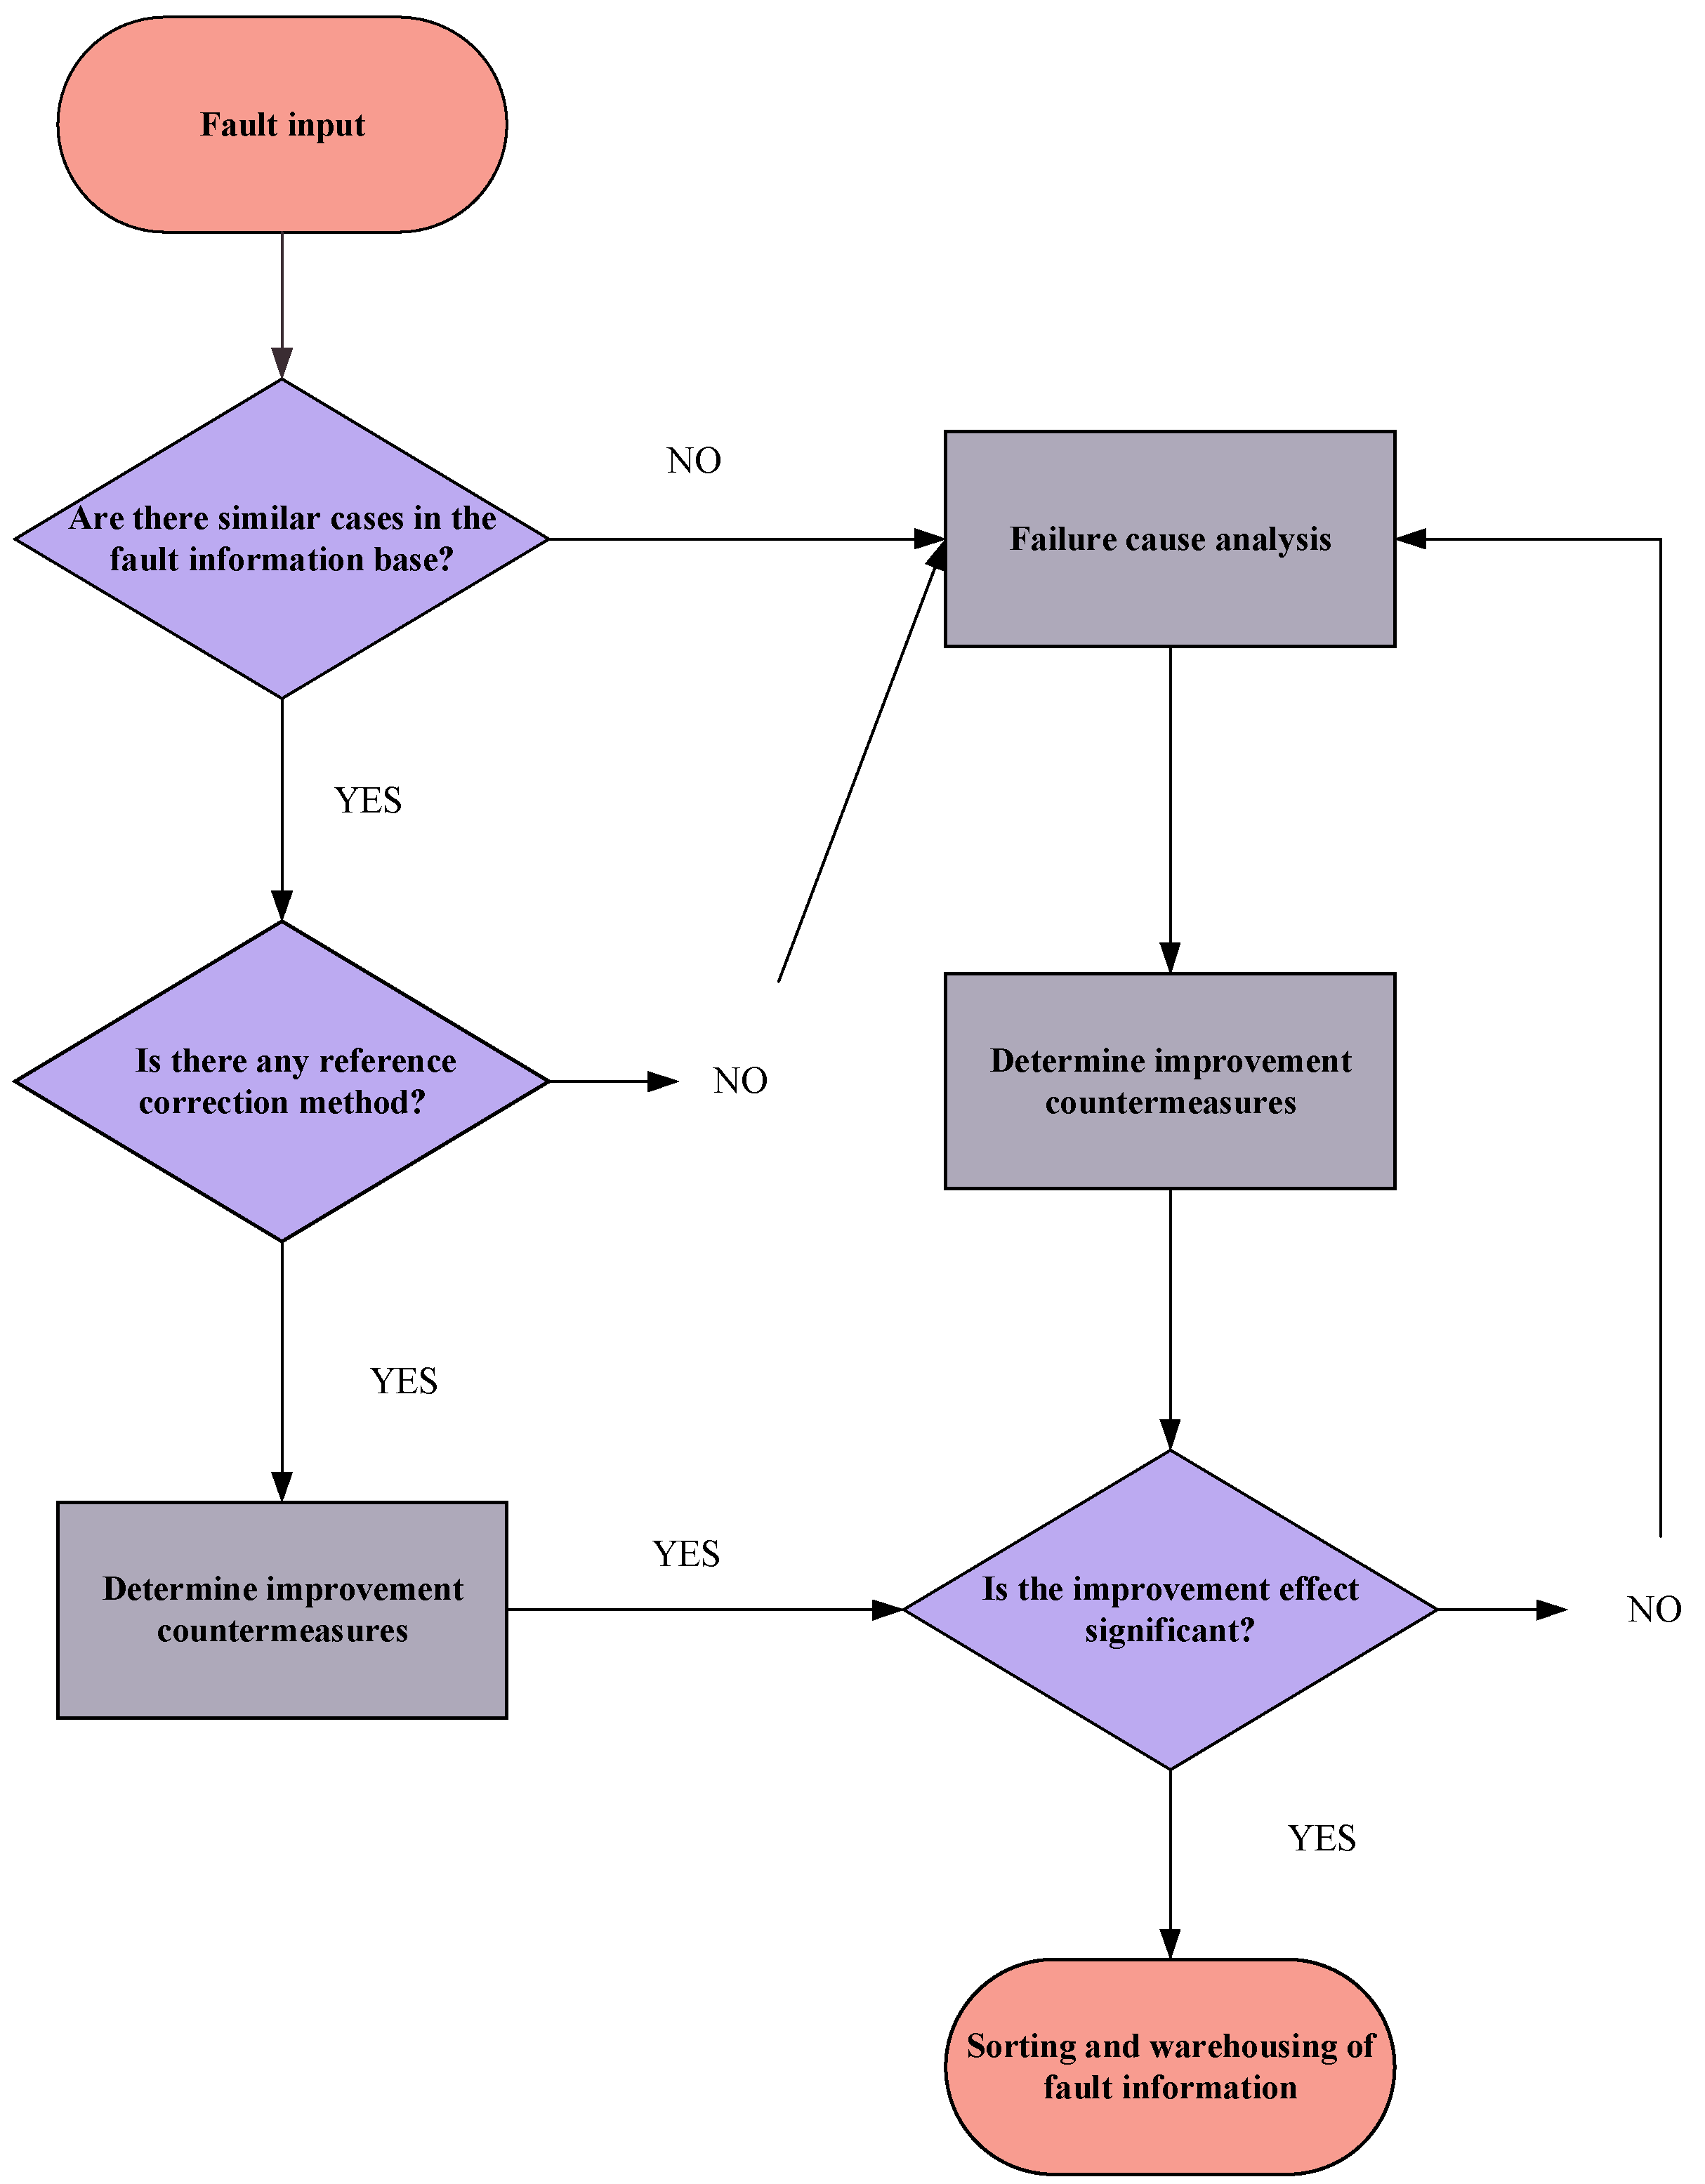
9], however, is a reliability technology that plans, organizes, and procedurally investigates, verifies, analyzes, and corrects faults after system failures, guarantees the accuracy of fault cause analyses and the effectiveness of corrective measures, implements closed-loop controls for faults, and completely eliminates the causes of the faults. The essence of a FRACAS is to report product faults accurately, identify the cause of the faults through analysis, and determine, implement, and verify corrective measures in time to reduce or prevent the recurrence of the faults. Therefore, the purpose of establishing a [10] FRACAS is to carry out strict zero management for faults that occur during product development and production. Reporting, finding the cause, and correcting and preventing duplication are required in time to increase product reliability and ensure that product reliability and maintainability.
Different applications of FMECA within vehicle system reliability assessment can be found in the relevant literature. Among them, Sharma presented a literature review on the application development of FMECA [11]. In particular, an excellent FMECA team was mentioned in the paper who efficiently identified the faults in a new system design. As mentioned earlier, the advantages of using FMECA in the reliability evaluation process are that it can identify the root causes of the failures and develop corrective actions, as well as helping the reliability analysis to be conducted efficiently through interventions at the system design stage. For example, in the failure analysis of a heavy-duty diesel engine piston [12], the use of FMECA to identify the piston failure modes reduced the engine maintenance costs. In addition, scholars [13] have also assessed the risks of vehicles in operation. Scholars have also used fuzzy FMECA to identify the potential failure modes and hazards of a vehicle turbocharger [14] and a fighter engine [15]. Lastly, FMECA was applied to identify the failure modes and hazards of key components in an automotive diesel engine [16].
FHA is widely used for the risk assessment of new systems [17]. The authors of [18,19] summarized the advantages and disadvantages of using FHA in the application process. In air transportation, it provides reliable references for civil aviation flight safety to improve the safety and reliability of aircraft resistance runway mechanisms [20] and aviation aircraft systems [21]. Similarly, FHA can minimize the time that is required for civil aircraft airworthiness qualification and improve safety [22]. In addition, combined with gray system theory [23], FHA was used to establish a comprehensive application method for the safety assessment of aircraft landing gear. Lastly, the combination of FHA and system theoretical process analysis (STPA) was applied to the risk assessment of new electric vertical lift vehicles [24] in the operational stage.
FTA has a wide range of applicability within the existing literature [25]. Many studies have described the applicability of this method [26,27]. In the field of road traffic, FTA was used for the risk assessment of a gantry crane system [28], including the power system of the crane, to meet the safety requirements of the vehicle during operation. Others have also combined FTA with the Monte Carlo algorithm [29] for the risk assessment of rail vehicles, thereby minimizing the stopping time and improving the reliability of the rail vehicles. In [30], Huang analyzed the reliability of unmanned vehicles by combining state transition diagrams with FTA in order to solve the problems that are encountered in the concept design stage of unmanned vehicles, which provided some references for the design and analysis of unmanned vehicle systems. Lastly, Hu [31] used FTA to assess the potential failure risks of key power equipment in EVs and put forward comprehensive and forward-looking development recommendations for improving the safety of EVs.
In the existing studies, a FRACAS has often been used in the development and design of new complex systems [32] to facilitate fault management during system operation or maintenance. The FRACAS has often been used in combination with other reliability assessment methods in many of the existing studies and its compatibility has been documented in many references [33,34]. In the aerospace industry, a FRACAS was used to control the reliability of unmanned aerial vehicles [35] throughout their life cycle. In addition, the reliability control of locomotives and vehicles was carried out by combining a FRACAS with the FMECA method [36]. As a result, the surface method provided an increase in true reliability with the best turnaround time. Lastly, a FRACAS was combined with the FTA–FMECA method to control the reliability of a vehicle power system [37]. The test showed that this method provides a theoretical basis and technical support for the elimination of early faults in electromechanical products.
As shown in Table 1, when evaluating the safety and reliability of a new system, the combination of FTA and FMECA has been a necessary step at the design stage, but this technology has only been applied at the “primary stage”. In another study, when the comprehensive application method of FTA–FMECA was used to evaluate the reliability of a robot system [38], it could not be fed back in time in the later reliability analysis, thus highlighting the reliability problem of the system throughout its whole life cycle. In addition, this technology lacks comprehensiveness in terms of all of the risks in the analysis of different safety and risk assessments [39].
Table 1.
Assessment tools for system safety and reliability.
It can be inferred from the literature that the design stage of a new vehicle diesel engine needs to systematically identify risks and provide timely feedback across its whole life cycle. For the fault analysis of newly developed highly complex systems, only using a single “F” technology often leads to the following difficulties: when FMEA is applied to a complete system, it may be difficult to achieve a sufficient analysis depth to fully understand the fault behaviors; FHA pays too much attention to functions and often ignores other types of hazards; FTA has a heavy workload when analyzing a complete system; FTA relies too much on expert experience when setting top events; and a FRACAS is inefficient at evaluating failures when analyzing new systems. Therefore, the fault analysis of newly developed highly complex systems requires a more integrated hybrid method. In terms of the application of the existing “4F” technology, Zhang [40] expounded its necessity for the reliability analysis of new systems.
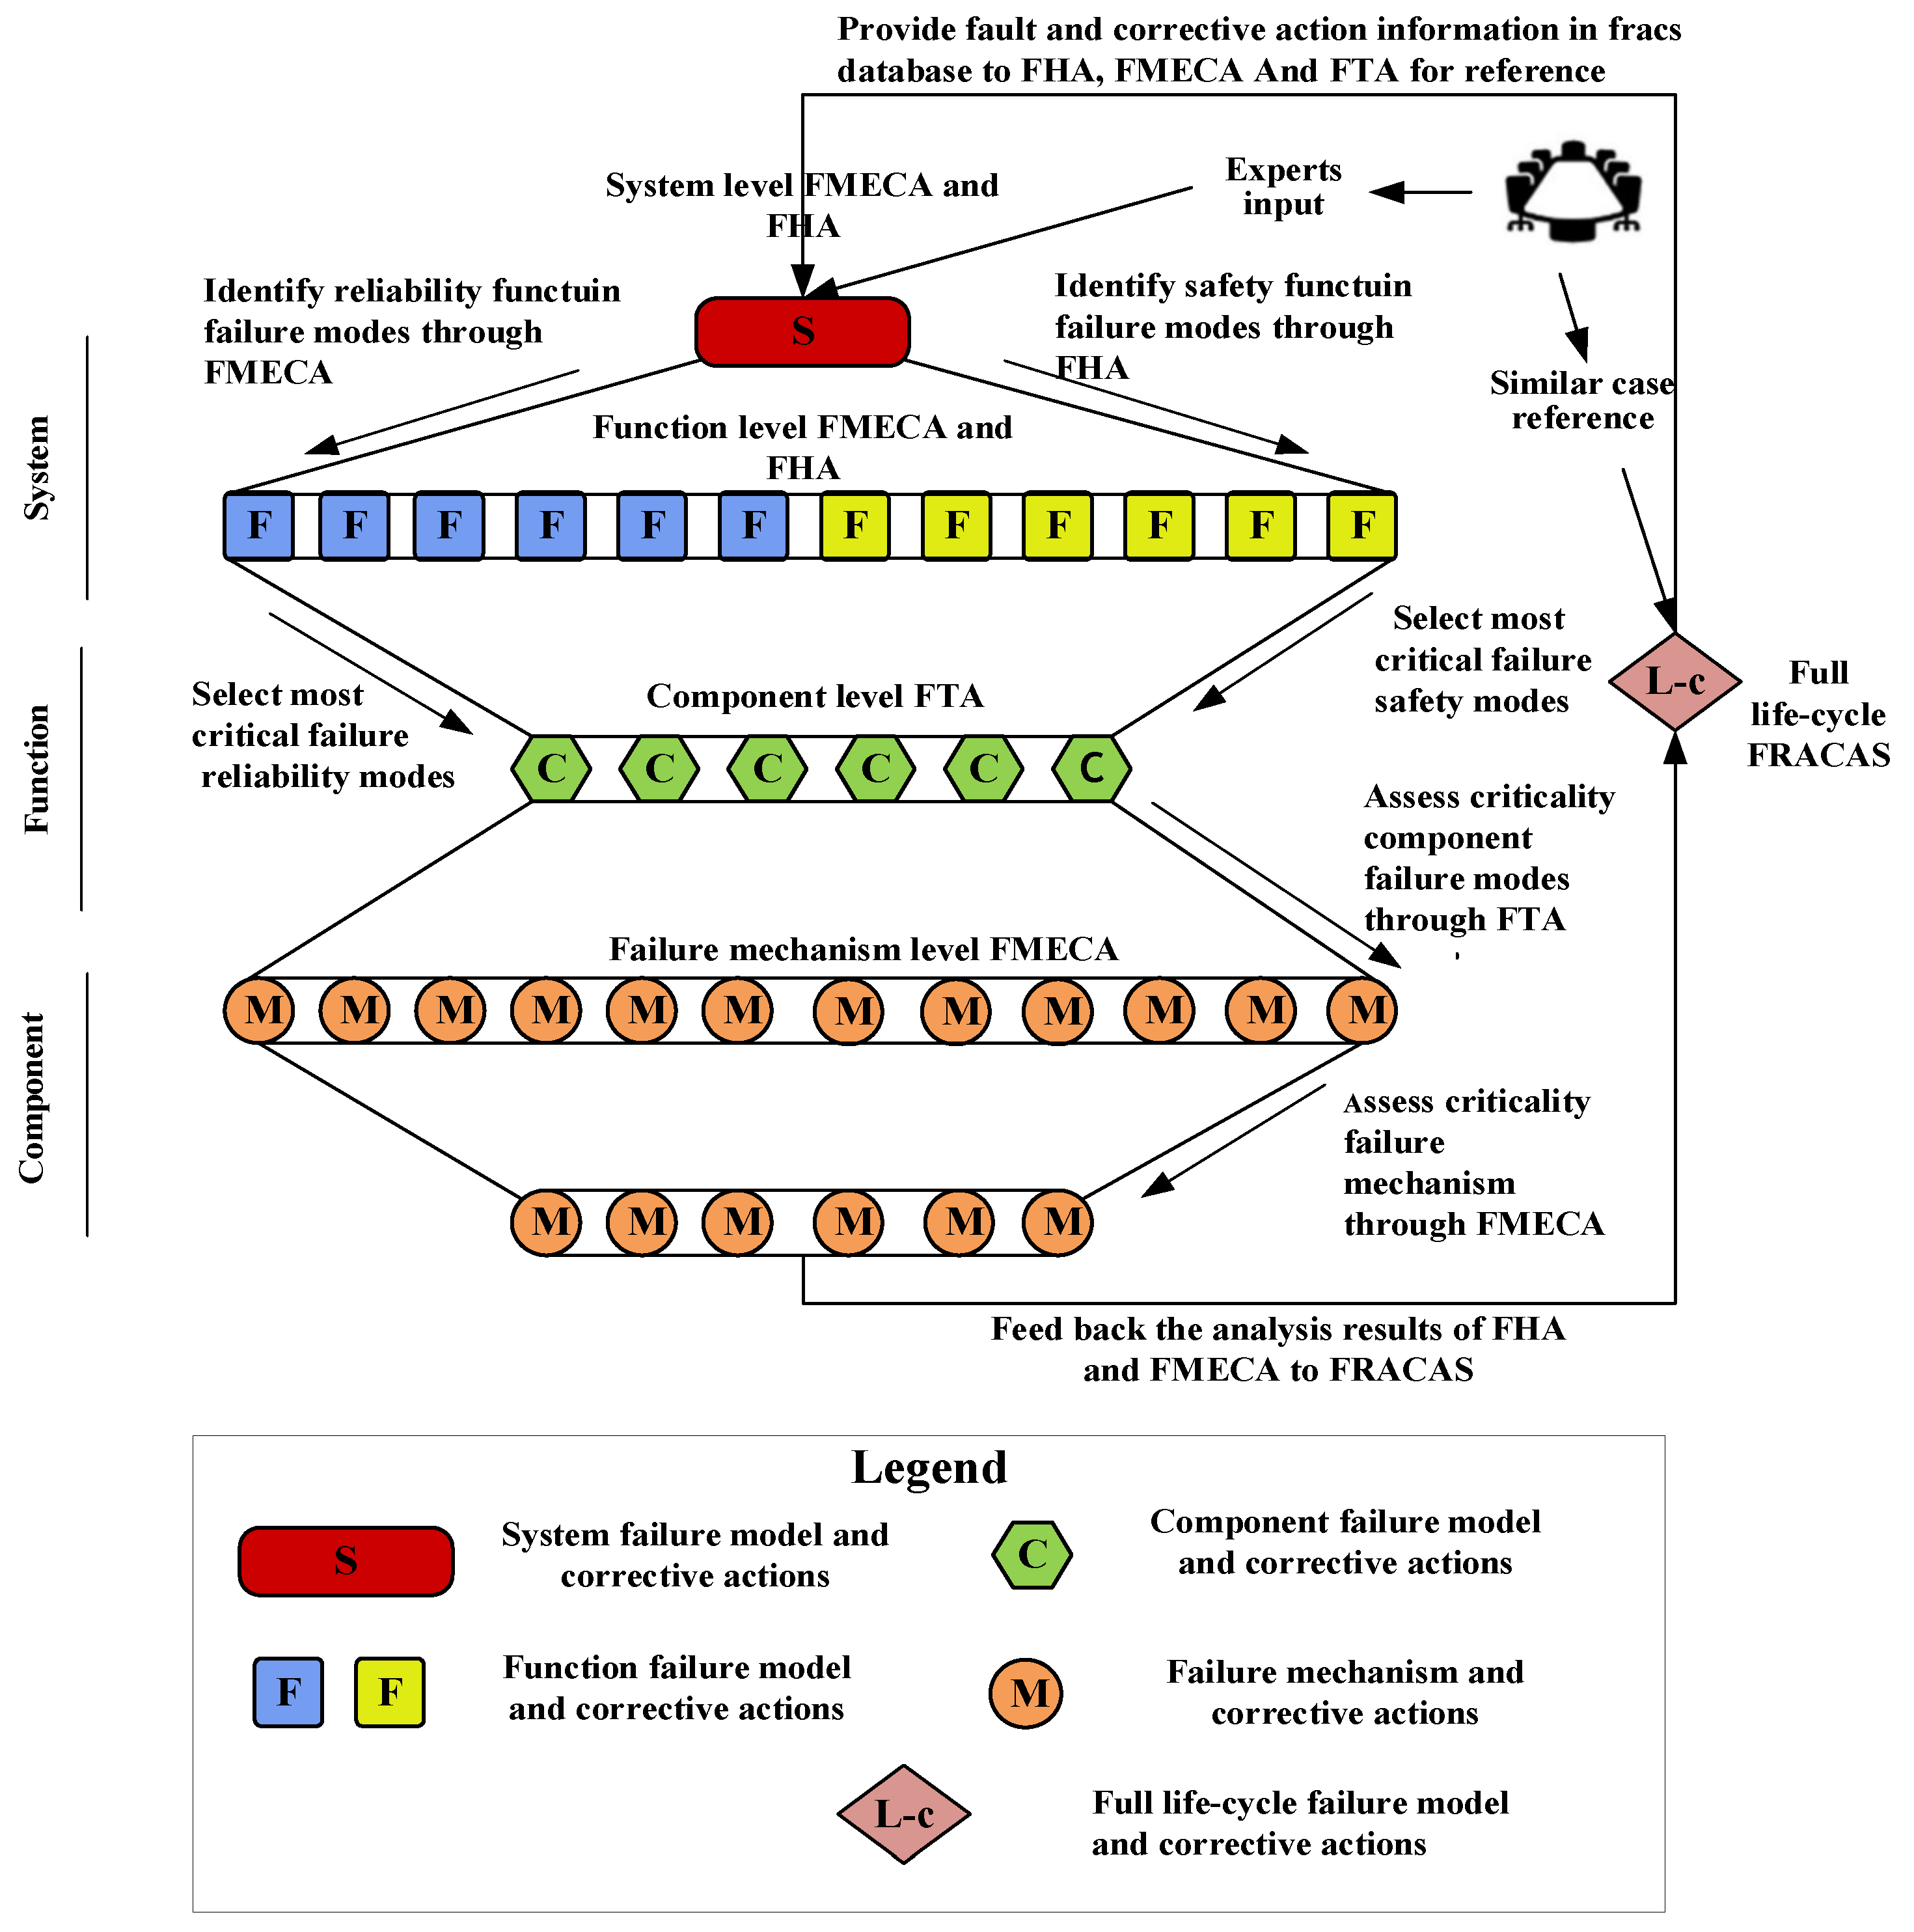
Therefore, in this study, 4F integration technology was adopted for the reliability analysis of a new diesel engine in the design stage. This paper is the first to use 4F integrated technology to evaluate the reliability of a vehicle diesel engine. FMECA was used to identify the functional hazards of the diesel engine, FHA was used to evaluate the failure mode analysis of the diesel engine, the failure mode was quantified by FTA, and a FRACAS was used to manage the analysis conclusions of the above technologies. The purpose of this study was to evaluate the fault hazards of the diesel engine so as to formulate corrective measures to prevent accidents. In the upcoming sections, the methods that were used in the diesel engine reliability analysis are described and the main research results are introduced and then discussed.
2. RDFTA (Repairable Dynamic Fault Tree Analysis)
This section discusses the reliability analysis of a repairable system using FTA, deduces new qualitative and quantitative RDFTA formulae on the basis of previous equations, and provides the specific process of the RDFTA reliability analysis. Bobbio et al. [41] proposed the concept of a “repair box” on the basis of a Dugan dynamic fault tree for system reliability analysis. The authors of [42,43] introduced the repair rate into the repair box and used it for the reliability analysis of mechanical and software systems, but the repair box only established a delayed FTA mechanism for the repair and maintenance time of a single component within the system and did not consider the equivalent repair rate. The RDFTA proposed in this section considers the failure rate and maintenance rate (following the index distribution) of a repairable system at the same time, which is consistent with the life cycle of a repairable system in practice.
2.1. OR Logic Gate of RDFTA
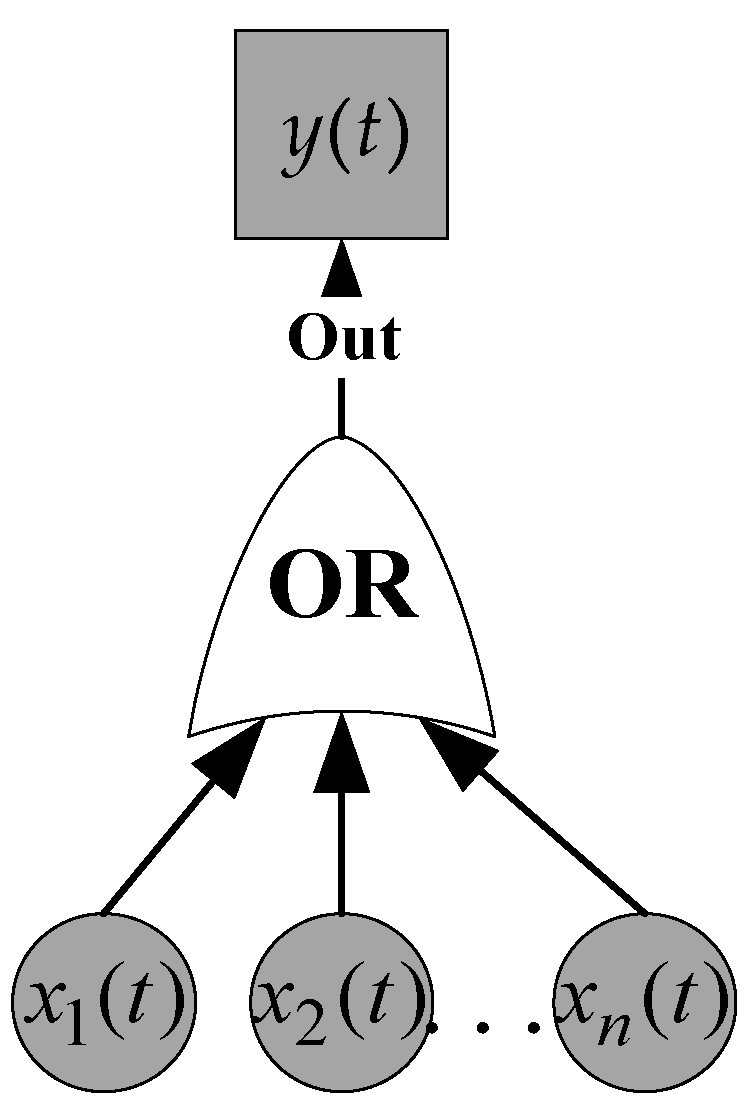
In the modeling of a repairable system, the reliability calculation formulae of the OR gate and the AND gate of a general repairable system are temporarily adopted [44]. represents the normal working probability of the OR gate input event at time t, is the failure state probability of the OR gate input event at time t, is the maintenance rate of the input event , and is the failure rate of the input event . represents the normal working probability of the OR gate output event at time t, is the failure state probability of the OR gate output event at time t, is the maintenance rate of the output event , and is the failure rate of the output event (Figure 1).
Figure 1.
The RDFTA OR logic gate.
- Quantitative operation rule
In the OR logic gate, the input event and output event have two states: state 0 is the normal working state, while state 1 is the fault state. According to the relationship between the input and output events and , a list of the quantitative operation rules of the OR gate can be obtained, as shown in Table 2.
Table 2.
The quantitative operation rules of the OR gate.
- 2.
- The quantitative calculation formula of the OR gate is as follows:
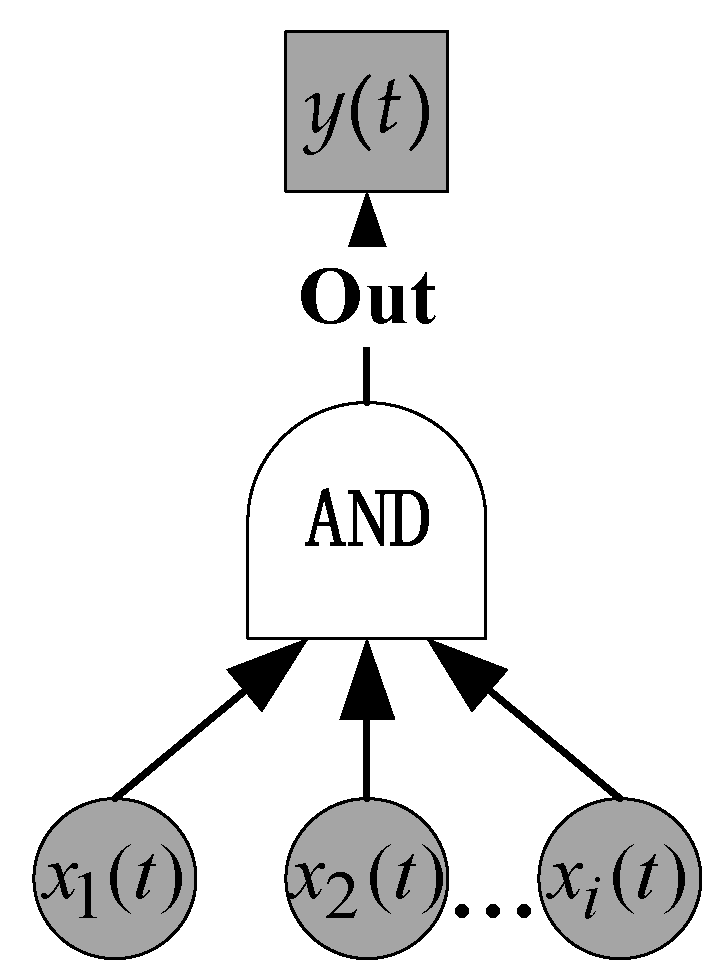
2.2. AND Logic Gate of RDFTA
represents the normal working probability of the AND gate input event at time t, is the failure state probability of the AND gate input event at time t, is the maintenance rate of the input event , and is the failure rate of input event . represents the normal working probability of the AND gate output event at time t, is the failure state probability of the AND gate output event at time t, is the maintenance rate of the output event , and is the failure rate of the input event (Figure 2).
Figure 2.
The RDFTA AND logic gate.
- Quantitative operation rule
In the AND logic gate, the input event and output event have two states: state 0 is the normal working state, while state 1 is the fault state. According to the relationship between the input and output events and , a list of the quantitative operation rules of the AND gate can be obtained, as shown in Table 3.
Table 3.
The quantitative operation rules of the AND gate.
- 2.
- The quantitative calculation formula of the AND gate is as follows:
When the AND and OR logic gates of the RDFTA are quantitatively calculated, the failure rate and maintenance rate of the corresponding components are imported into Formula (3) for pretreatment:
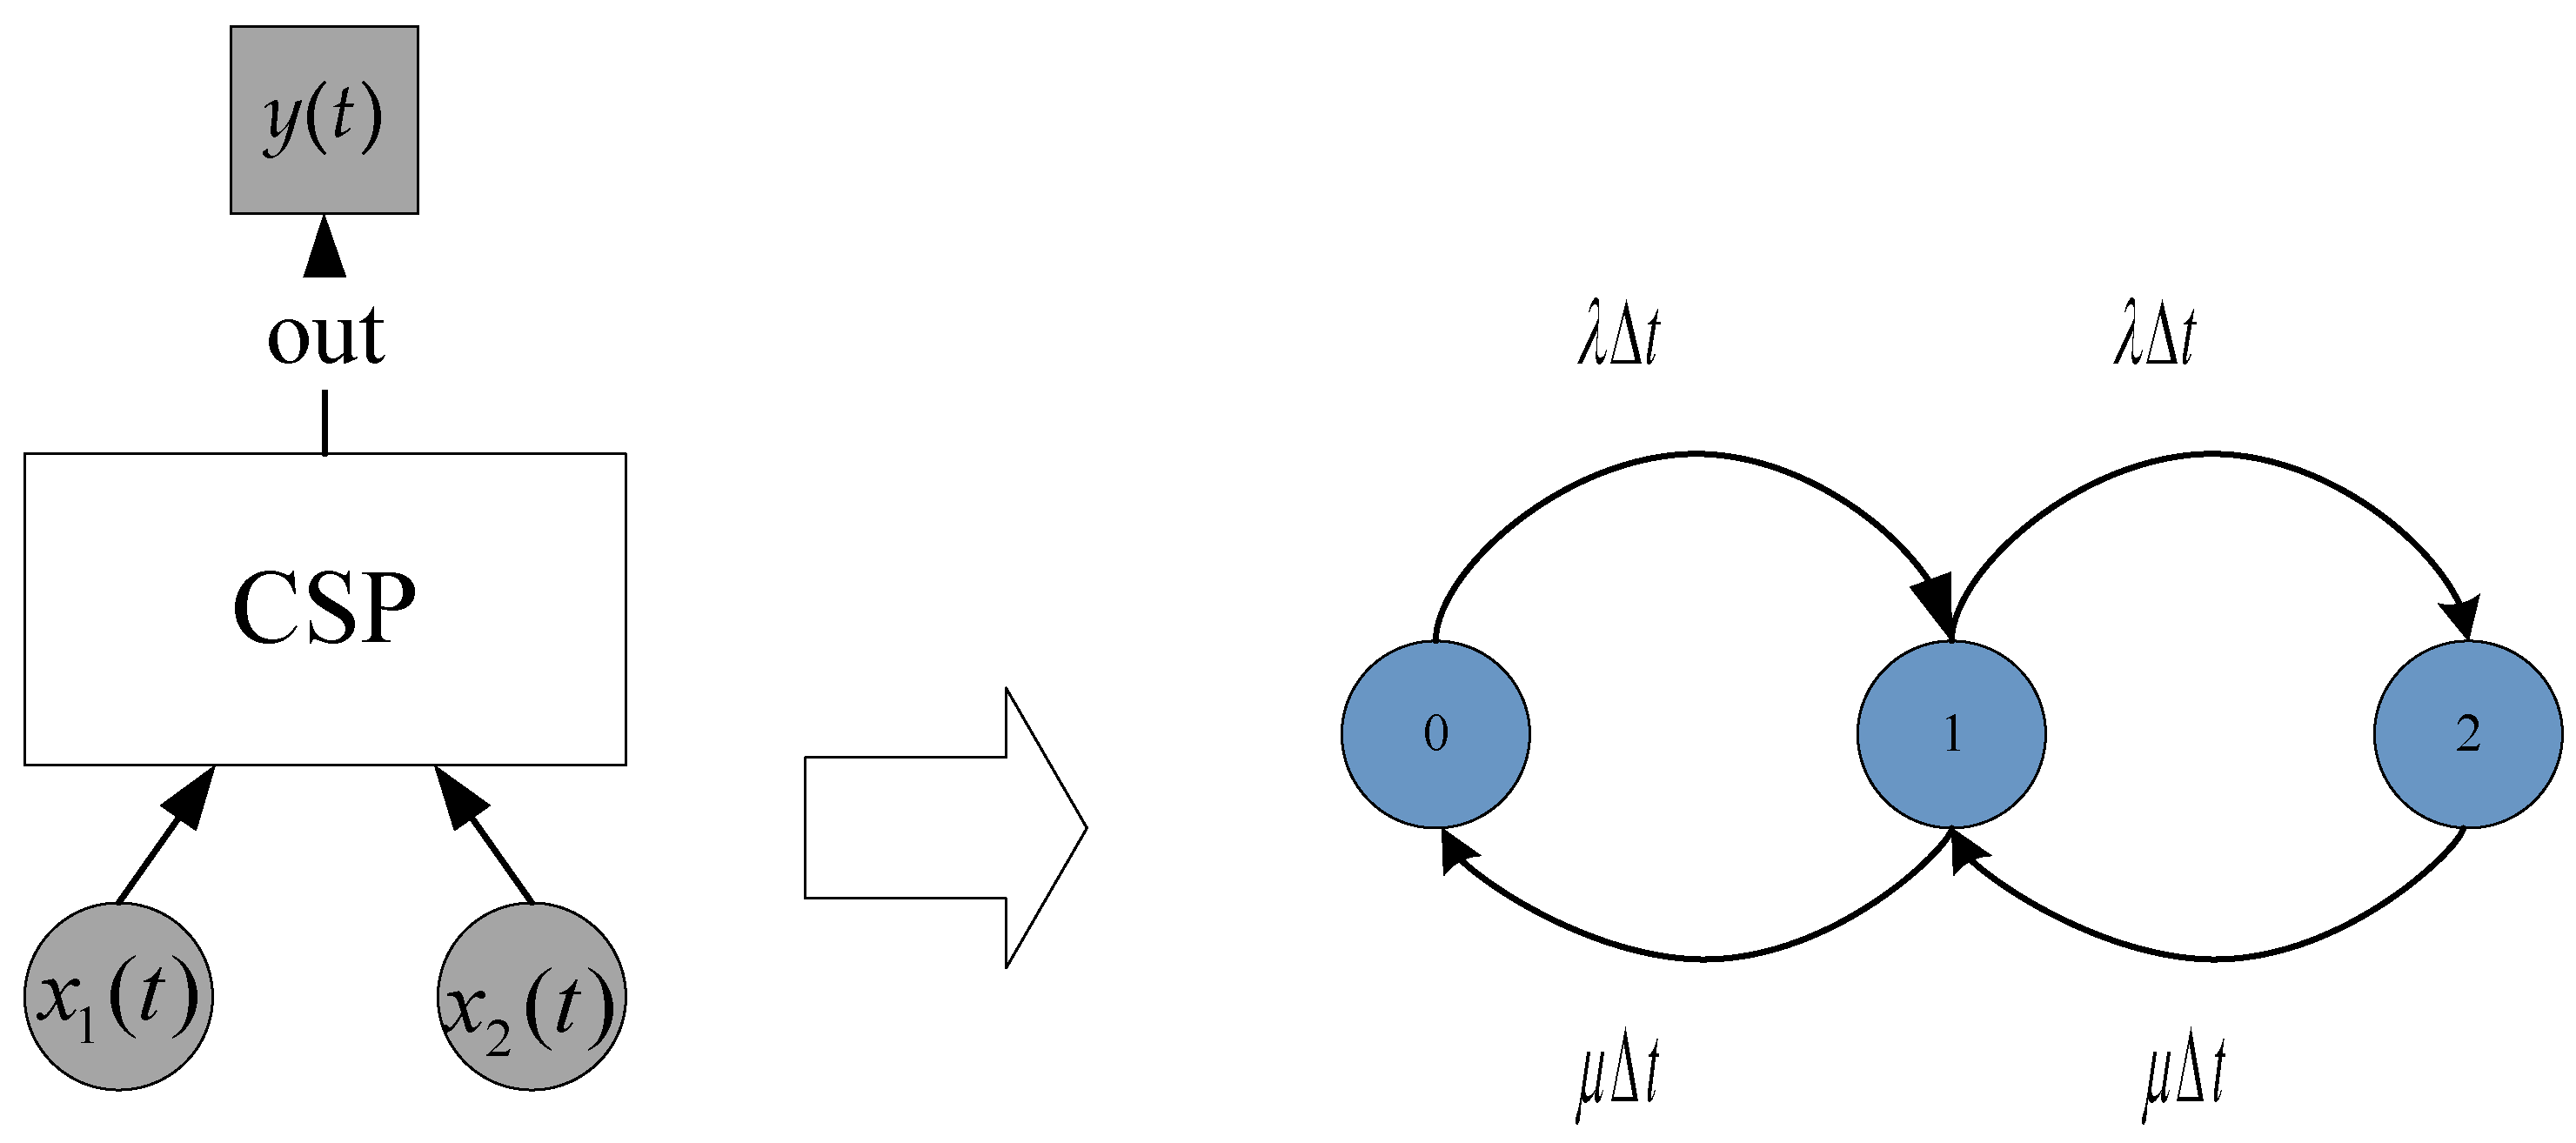
2.3. CSP Logic Gate of RDFTA
represents the normal working probability of the CSP gate input event at time t, is the failure state probability of the CSP gate input event at time t, is the maintenance rate of the input event , and is the failure rate of the input event . represents the normal working probability of the CSP gate output event at time t, is the failure state probability of the CSP gate output event at time t, is the maintenance rate of the output event , and is the failure rate of the output event .
A conversion rate matrix can be derived from Figure 3 as follows:
Figure 3.
The transformation of the CSP gate into a Markov model.
According to the Formula State Matrix (4), the differential Equation (5) can be solved:
where is the derivative of .
As can be seen from Figure 3, .
- Quantitative operation rule
In the CSP logic gate, the input event and output event have two states: state 0 is the normal working state, while state 1 is the fault state. According to the relationship between the input and output events and , a list of the quantitative operation rules of the CSP gate can be obtained, as shown in Table 4.
Table 4.
The quantitative operation rules of the CSP gate.
- 2.
- The quantitative calculation formula of the CSP gate is as follows:
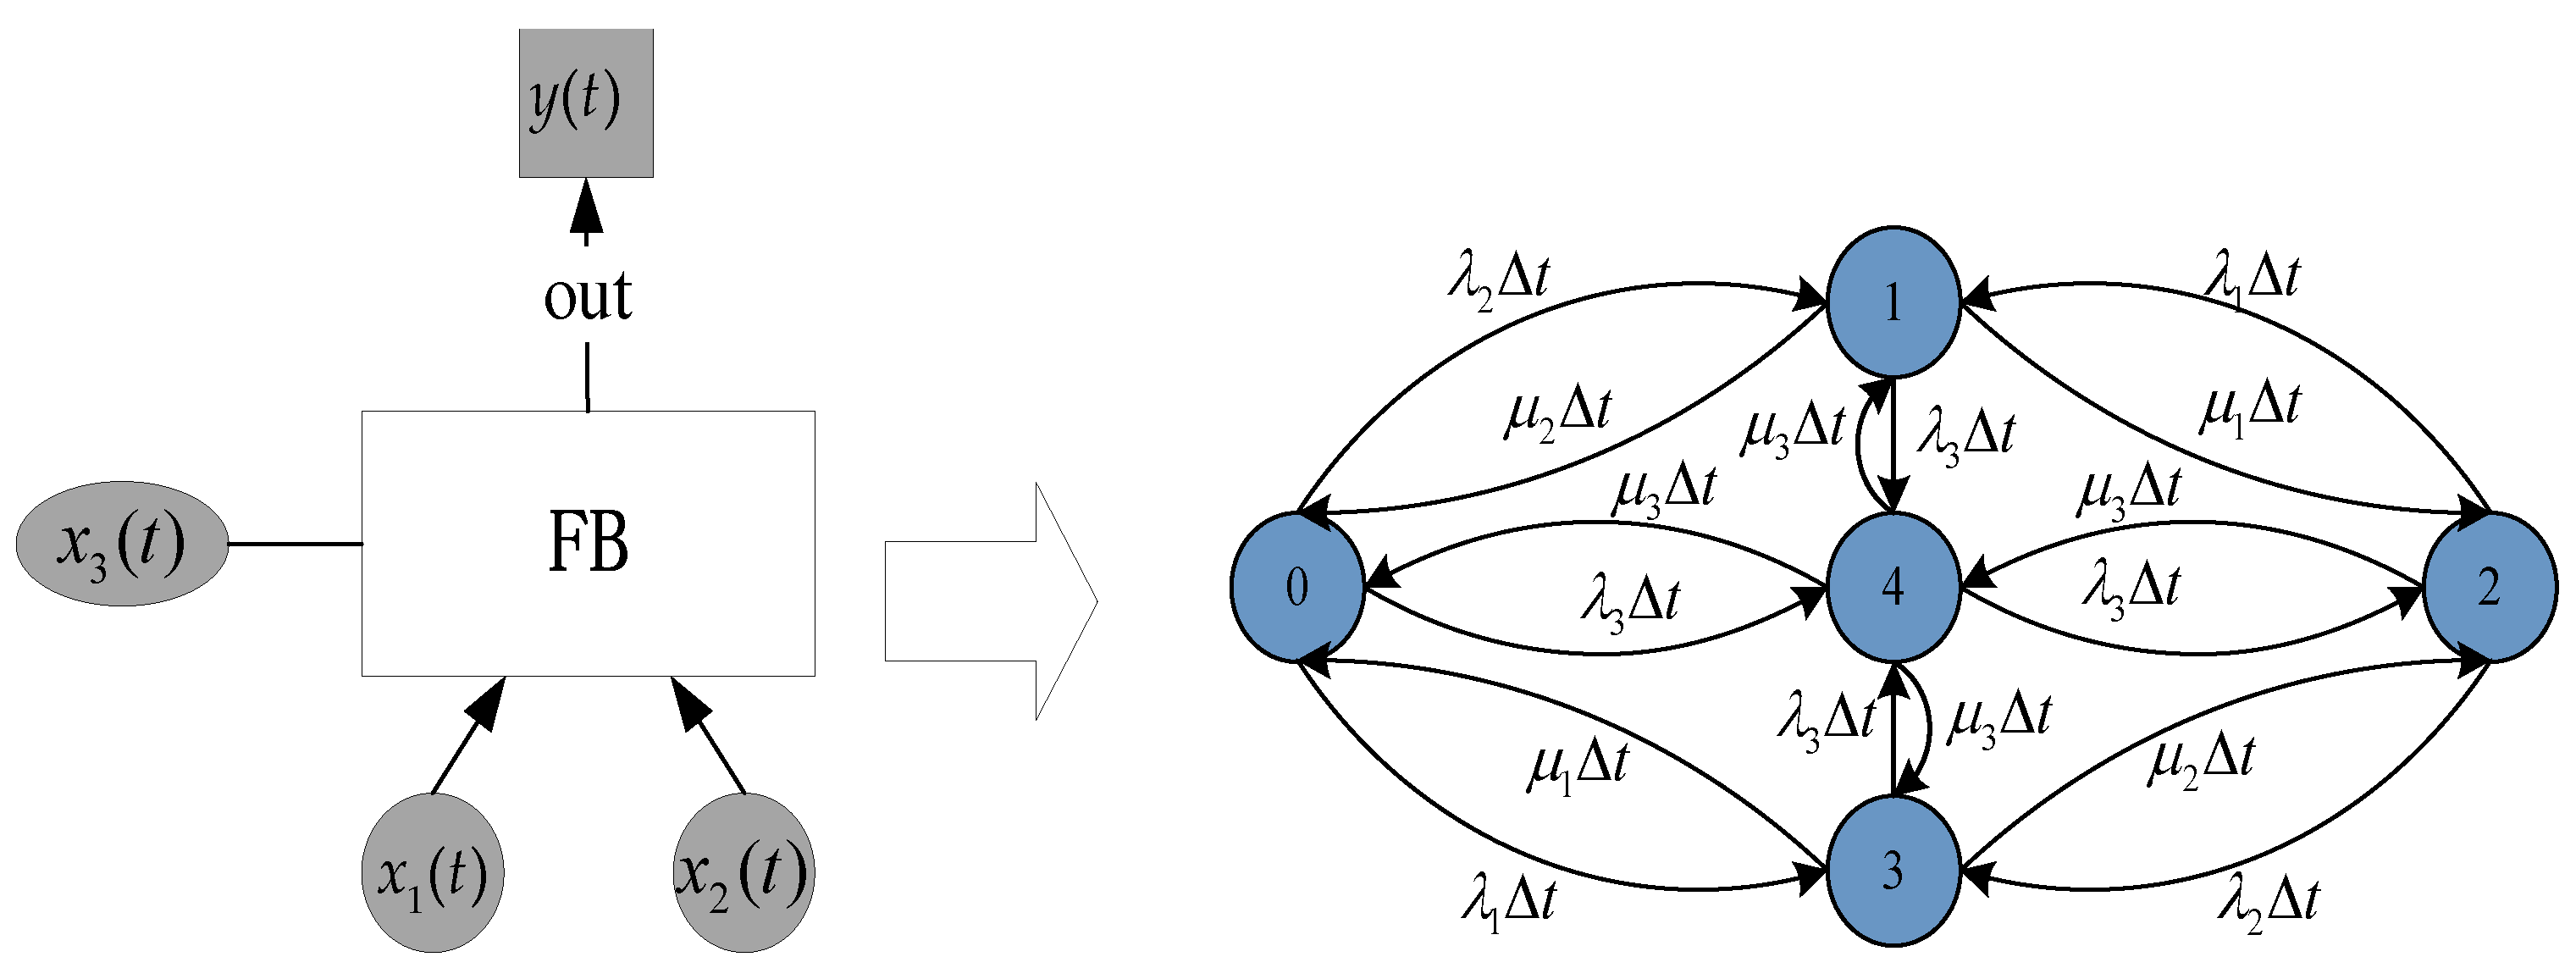
2.4. Feedback Logic Gate of RDFTA
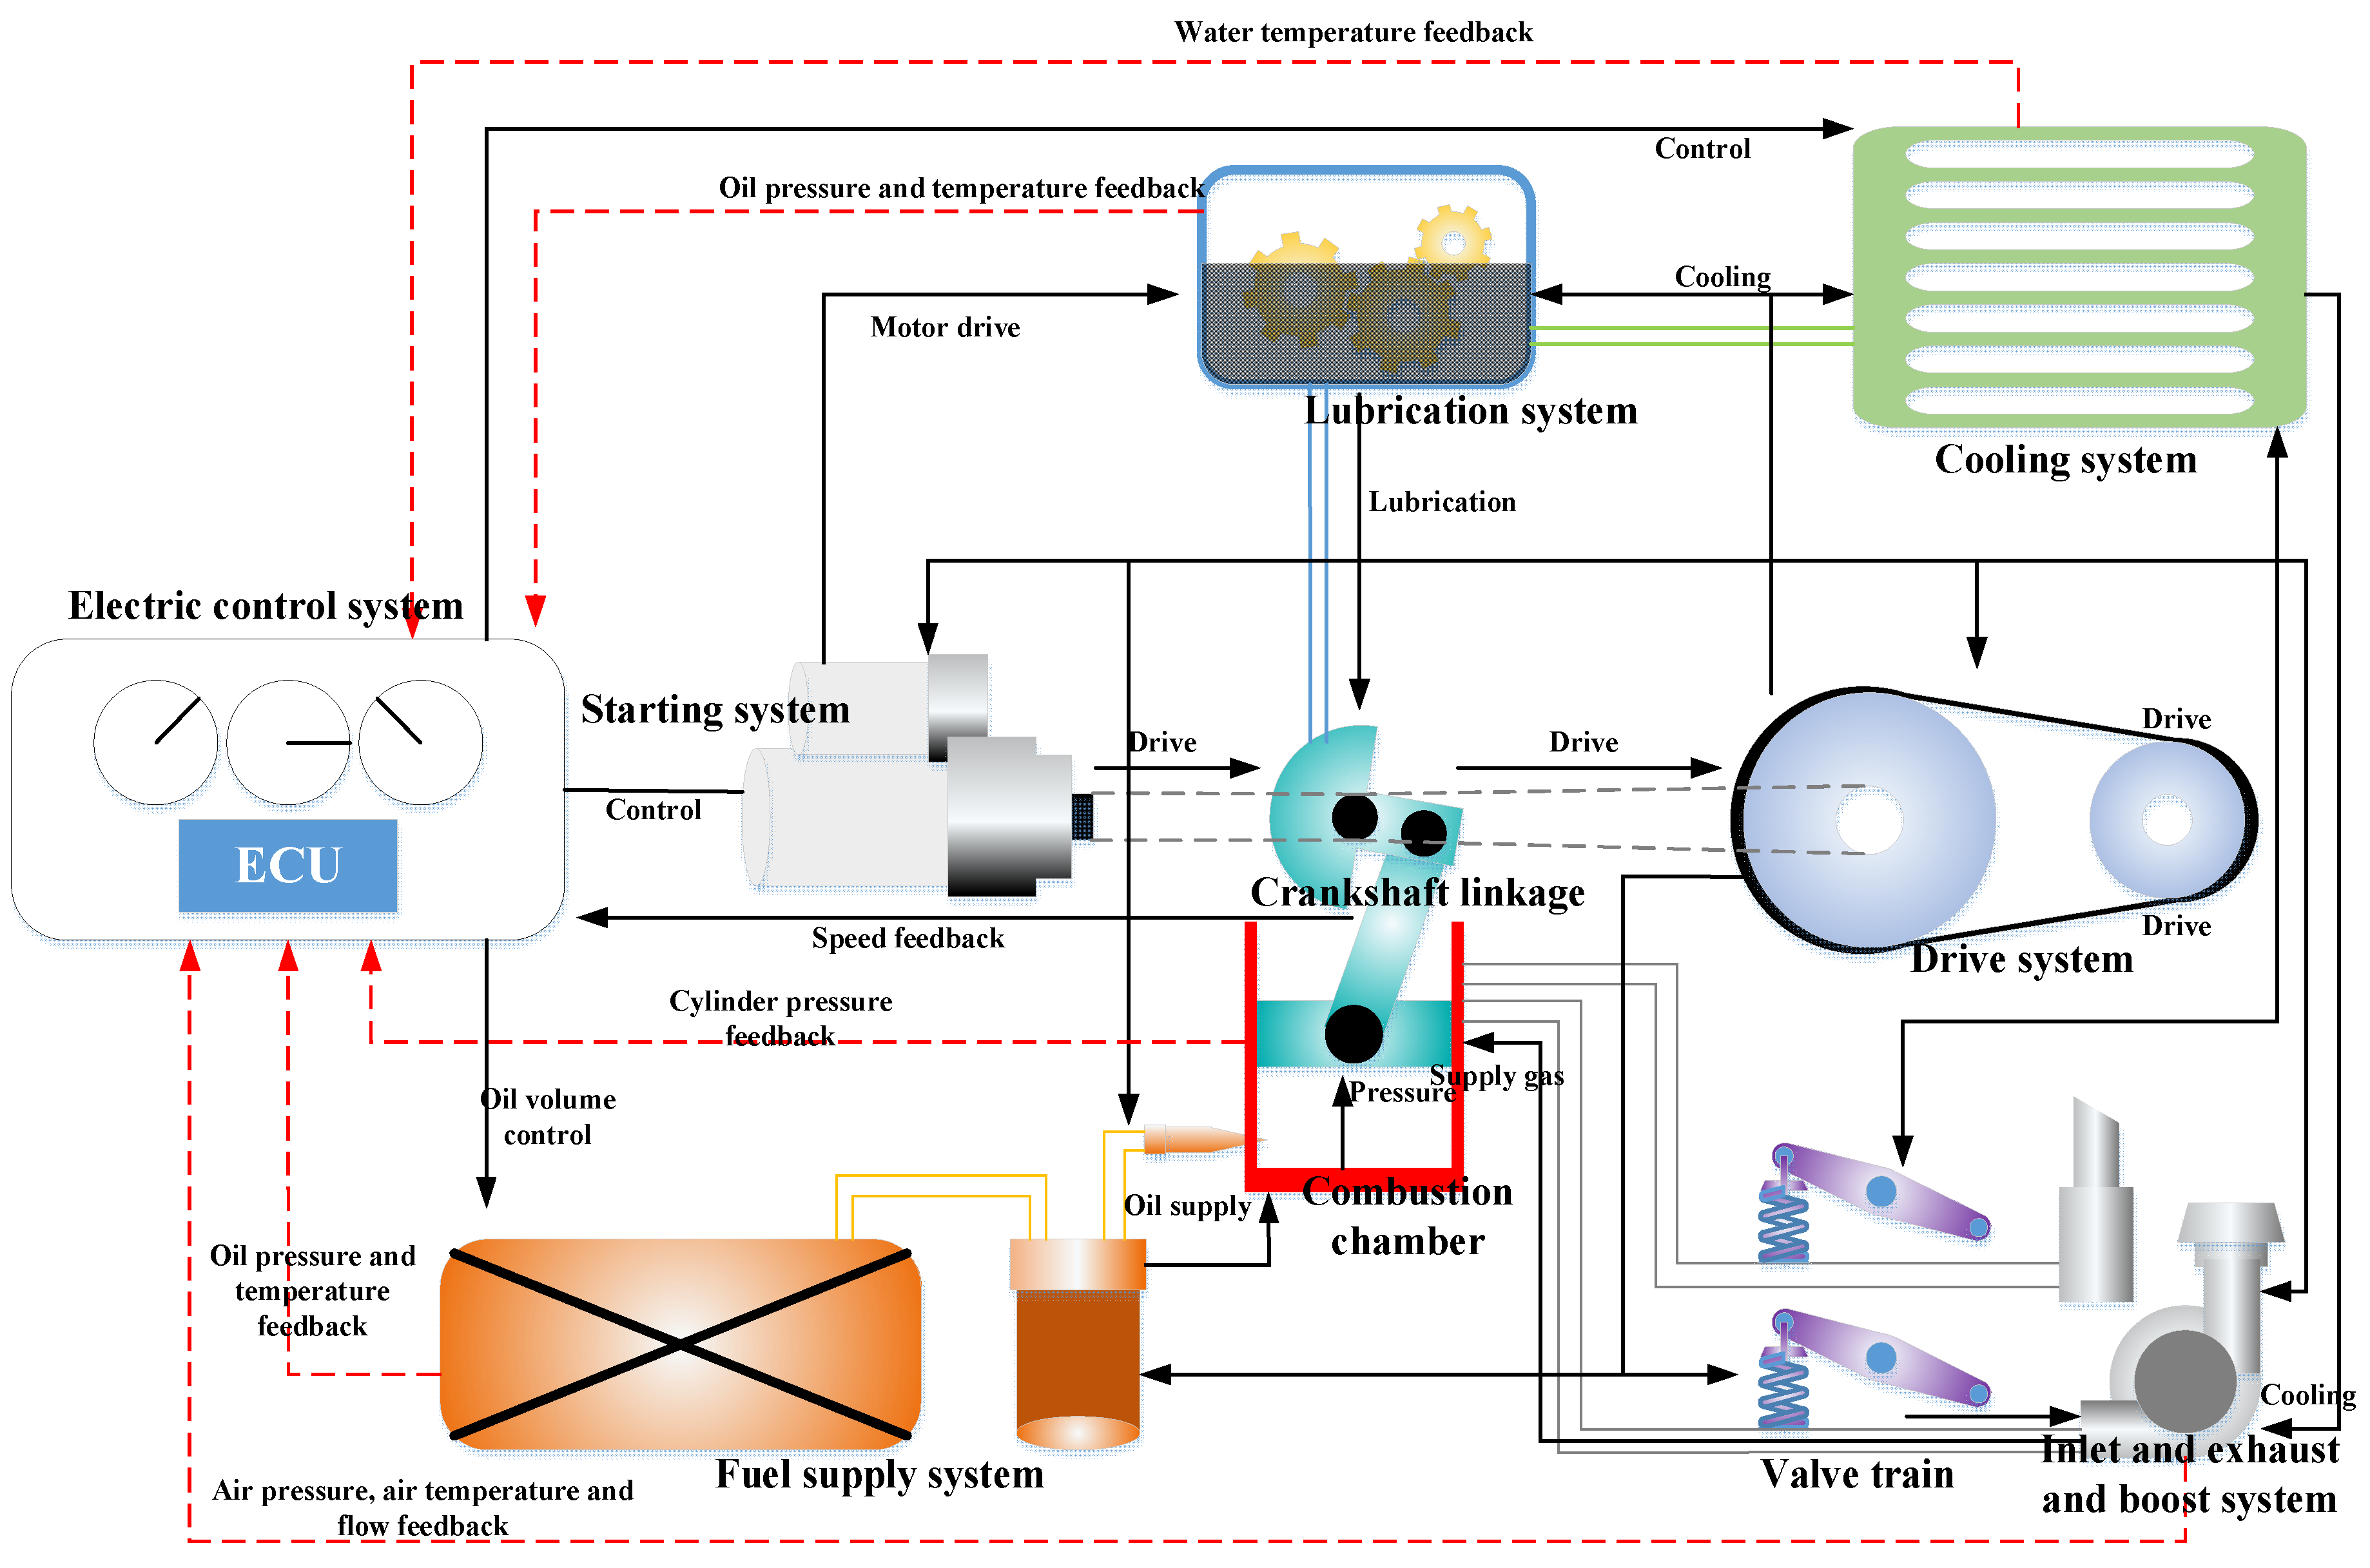
The failure of a component within a diesel engine system occurs and triggers event , i.e., when event occurs, the failure of components and also occurs. This is generally used to describe the relationship between the feedback link and the failure of components in the pathway. For example, in a diesel engine system, the feedback control relationship between the electronic control system and each subsystem of the diesel engine uses a feedback logic gate. The electronic control system is represented by event , while the subsystem is represented by events such as and .
represents the normal working probability of the FB gate input event at time t, is the failure state probability of the FB gate input event at time t, is the maintenance rate of the input event , and is the failure rate of the input event . represents the normal working probability of the FB gate output event at time t, is the failure state probability of the FB gate output event at time t, is the maintenance rate of the output event , and is the failure rate of the output event .
A conversion rate matrix can be derived from Figure 4 as follows:
Figure 4.
The transformation of the feedback gate into a Markov model.
According to the Formula State Matrix (7), the differential Equation (8) can be solved:
According to the definition of availability, the system fault status is , i.e., only can be solved:
- Quantitative operation rule
In the FB logic gate, the input event and output event have two states: state 0 is the normal working state, while state 1 is the fault state. According to the relationship between the input and output events and , a list of the quantitative operation rules of the FB gate can be obtained, as shown in Table 5.
Table 5.
The quantitative operation rules of the FB gate.
- 2.
- The quantitative calculation formula of the FB gate is as follows:
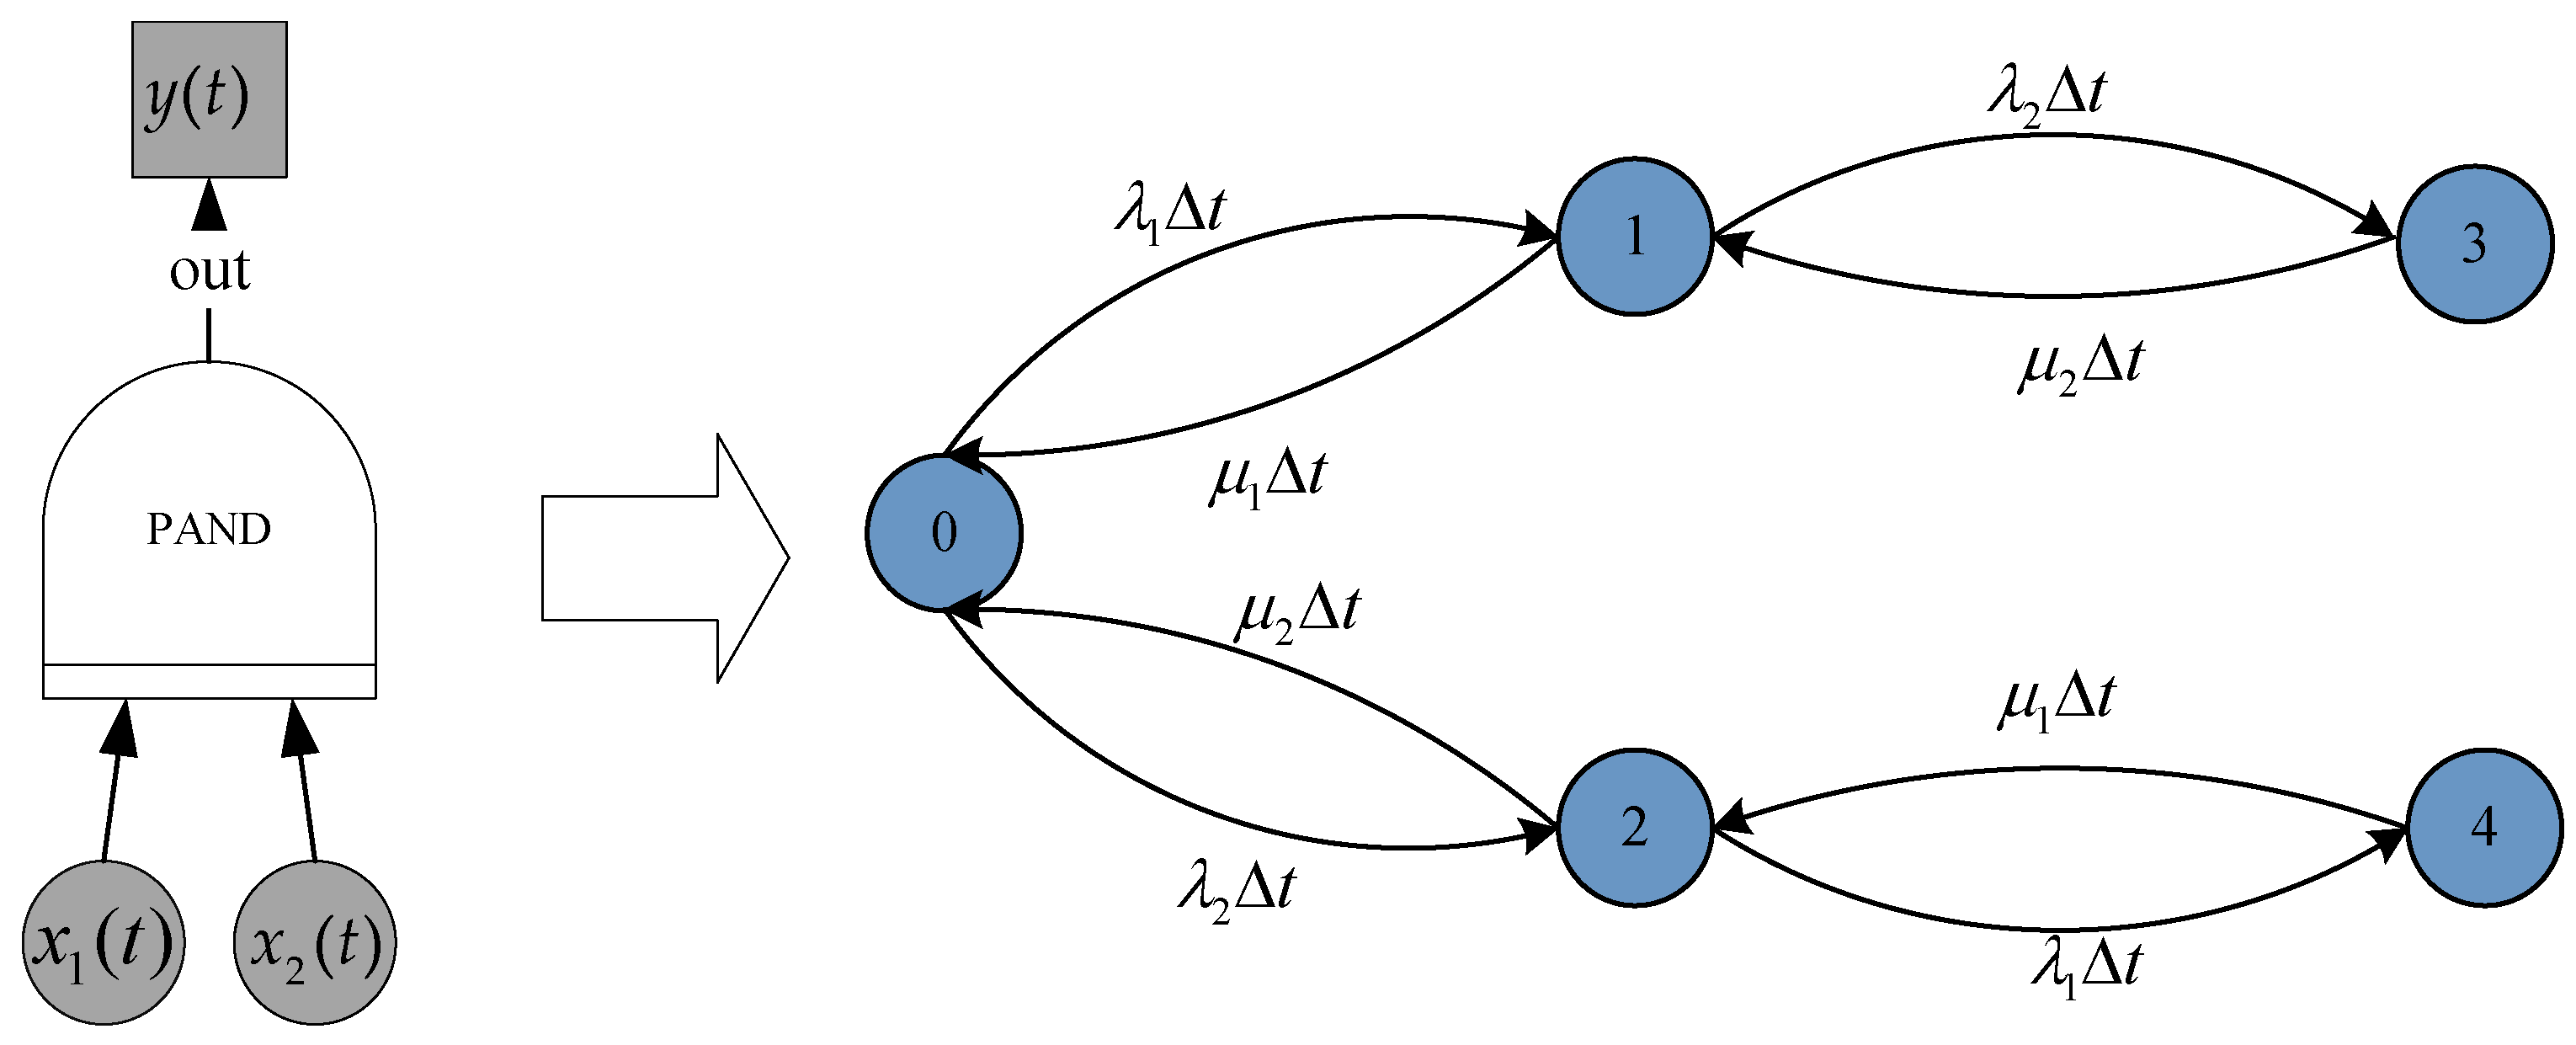
2.5. RDFTA Priority AND Logic Gate
The priority AND gate logically conforms to the AND gate, but the events occur in a certain order. As can be seen from Figure 5, state 4 represents the output event fault and only the success probability of state 4. The output event only occurs when the basic events and occur and when event occurs before event .
Figure 5.
The transformation of the priority AND logic gate into Markov models.
In Figure 5, represents the normal working probability of the PAND gate input event at time t, is the failure state probability of the PAND gate input event at time t, is the maintenance rate of the input event , and is the failure rate of the input event . represents the normal working probability of the PAND gate output event at time t, is the failure state probability of the PAND gate output event at time t, is the maintenance rate of the output event , and is the failure rate of the output event .
A conversion rate matrix can be derived from Figure 5 as follows:
According to the Formula State Matrix (11), the differential Equation (12) can be solved:
- Quantitative operation rule
In the priority AND logic gate, the input event and output event have two states: state 0 is the normal working state, while state 1 is the fault state. The state in which fails before is recorded as 2. According to the relationship between the input and output events and , a list of the quantitative operation rules of the priority AND can be obtained, as shown in Table 6.
Table 6.
The quantitative operation rules of the priority AND gate.
- 2.
- The quantitative calculation formula of the priority AND gate is as follows:
2.6. FTA Qualitative Analysis of Repairable Systems
2.6.1. Minimum Cut Set Algorithm for RDFTA
The minimum cut set algorithm for RDFTA aims to find the sets of all failure event combinations in the RDFTA, including the static and dynamic transformation method, the uplink and downlink method, the binary decision diagram transformation method, the sequence operator method, and the topological sorting method [45]. The static and dynamic transformation method is usually selected for calculation using the following formula:
where is the number of vectors of the basic event , is the number of minimum cut sets, is the minimum cut set of , and is the structure function of the RDFTA.
2.6.2. Component Importance for RDFTA
The component importance for RDFTA is the quantification of the importance of each component within the system, including the probability importance and structural importance [46]. Generally, the probability importance is calculated using Equation (15):
where is the probability importance of component , is the reliability function of component , and is the minimal path set of component .
Through the probability importance ranking results, the weak links of reliability in the system design scheme can be found and hence, corresponding compensation measures can be put forward to support the formulation of a reliability growth scheme.
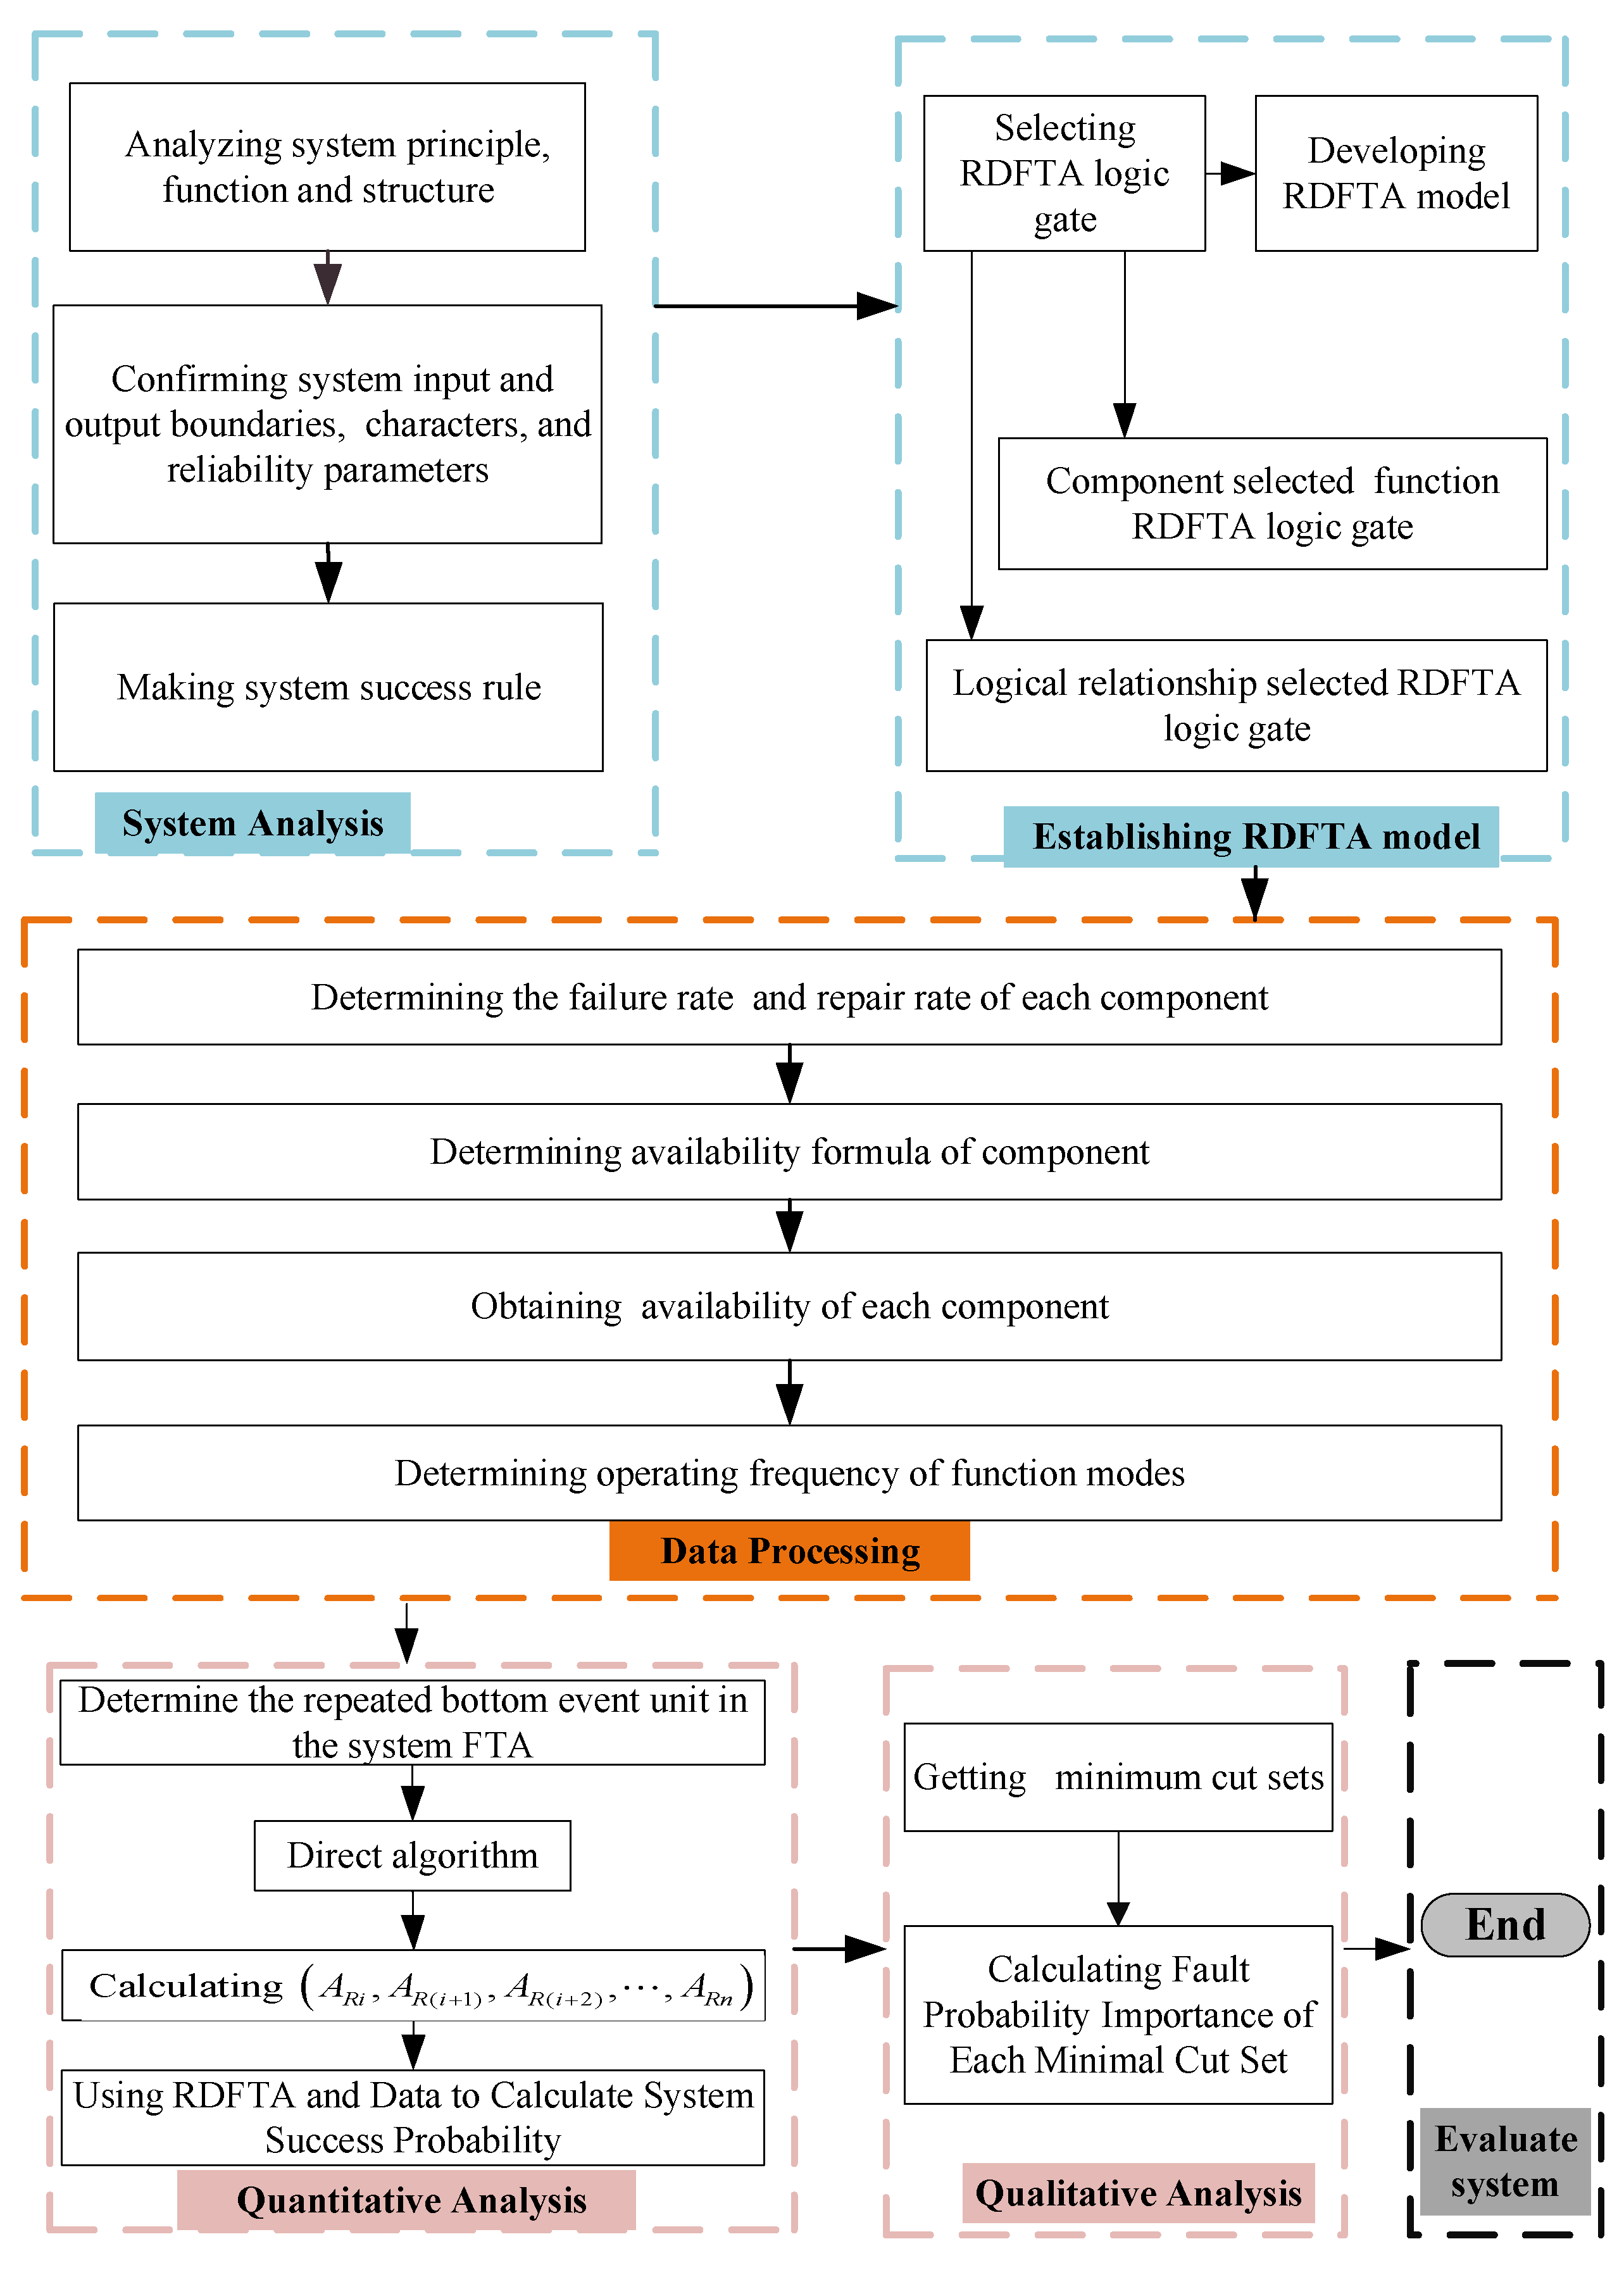
2.7. Reliability Analysis Process of RDFTA
In the reliability analysis process of RDFTA, the quantitative and qualitative analysis results of the RDFTA are obtained. The existing RDFTA reliability analysis process is not suitable for considering the failure rate and maintenance correlation of repairable systems at the same time. Therefore, using the new RDFTA logic gate, a new RDFTA reliability analysis process framework for repairable systems was proposed, as shown in Figure 6.
Figure 6.
The reliability analysis process framework of the RDFTA method.
In the next section, the application of 4F integration technology to the reliability analysis of a diesel engine at the design stage is introduced.
3. 4F Integration Technology
This section introduces the reliability analysis method that is based on 4F integrated technology. Section 3.1 explains the application process of 4F integrated technology to the reliability assessment of diesel engines, redefining the depth of various technical analyses of the diesel engine and the harsh definitions of the fault modes. Subsequently, the application process of a FRACAS to 4F integration technology is introduced in Section 3.2. Finally, the FMECA–FHA model is introduced in Section 3.3 and the harmfulness of the fault modes is evaluated using the prefabrication of the preliminary comparison method within the FHA. The 4F integration technology proposed in this section is mainly controlled by the reliability issues that are encountered by new model equipment during the design phase of planning and ensures that the quality retrospective is available throughout the full life cycle.
3.1. Application Process of 4F Integration Technology
The developed reliability evaluation method for diesel engine systems that is based on 4F includes four steps, as shown in Figure 7. These steps ensure that the method identifies the fault hazards of the reliability and safety of the system, in addition to evaluating the functional faults with high hazards and the availability of key components. The fault physics of the key fault components are analyzed and a FRACAS puts forward corresponding compensation measures. First, experts meet to discuss the implementation of the FMECA–FHA model, in which the FMECA evaluates the system-level reliability function failures and the FHA evaluates the system-level safety function failures to identify all function failure modes. At the same time, the fault information base is compared using a FRACAS to see whether there are similar fault modes. When there are similar cases, the existing fault handling cases are evaluated to simplify the analysis process. When there are no similar cases, the second step is performed. In the second step, the failure modes that are classified as severity I or II are taken as the top events of the FTA for a component-level fault quantitative analysis. In the third step, after obtaining the minimum cut set at the component level according to the new FTA, the FMECA is used to analyze the fault mechanisms of key components. In the fourth step, the FRACAS conducts the fault management and control of the FMECA, FHA, and FTA–FMECA models across the whole life cycle of the system. To report all faults within the system in time at the design stage, effective corrective measures are formulated and implemented, the effectiveness of those corrective measures is verified, the recurrence of faults is prevented, major hidden dangers are eliminated, and the zero control of faults is realized. In short, the stages and the analysis depth that are used to evaluate the safety and reliability of diesel engines at the early stages of design are shown in Figure 7.
Figure 7.
The 4F integration technology analysis process.
3.2. Application of a FRACAS to 4F Integration Technology
As shown in Figure 8, the purpose of the FRACAS is to ensure that any failure modes that are generated in the design stage of a diesel engine are controlled and that there are sufficient safeguarding measures in place to reduce the harm that could be caused by those failure modes. The failure modes in the manufacturing process and the product use process were not within the scope of this paper. A seminar was held with vehicle drivers, diesel engine manufacturers, and scholars within this field and the failure modes of previous generation models were also considered. On the basis of the original fault database, it can filter out the repetitive known faults, thereby improving the working efficiency of analysts. According to [47], Figure 8 is the application process of the FRACAS method.
Figure 8.
The FRACAS analysis process within 4F integration technology.
3.3. FMECA–FHA Integration Model
Due to the existence of safety failure modes and reliability failure modes in diesel engine systems, the previous fault input of this method is the FMECA–FHA analysis result at the system level. The FMECA describes the structure and function of the whole system. In addition, the FMECA can identify system-level reliability failure modes and evaluate the criticality of each failure mode. The failure modes are quantified by a risk priority number (RPN). In Formula (16), the RPN [48] is the product of three indicators (usually rated from 1 to 10): (1) severity S, (2) the possibility of occurrence O, and (3) fault detection D. From a comparison of the PRN of each failure mode, the key failure modes are obtained. Therefore, this can be used as the basis for a system-level reliability evaluation of diesel engines.
On the basis of the FMECA, the FHA of the FMECA–FHA model uses the rank comparability method [49] to rank the hazard degree of the diesel engine safety failure modes. According to MIL-STD-1180 (the US Army ground vehicle safety standard) [50], the following parameters are selected: is the injury degree caused by the failure, is the economic loss caused by the failure, and is the maintenance cost caused by the failure. The frequency of failure is taken as the index of the safety assessment. The score of each index is determined according to the scores from experts and the weight of the score is distributed according to the experience of the experts. The rank is calculated according to evaluation indices (), from which the of M failure modes is obtained. The RSR of each failure mode is calculated using Equation (17) and the cumulative frequency of each failure mode can be obtained. Finally, the ranking value of the hazard degree of the failure modes is calculated using Equation (18).
where a and b are constants.
Finally, according to the analysis results of the FMECA–FHA integrated model, the most severe fault mode is used as the input for the FRACAS to judge the worst fault mode. The FMECA–FHA integrated model can simultaneously consider the reliability and safety problems in the primary stages of diesel engine design, making the system-level fault analysis of diesel engines more comprehensive. As shown in the schematic diagram of the FMECA–FHA model in Figure 9, the FHA carries out the safety analysis and modeling at the system/function level, while the FMECA carries out the reliability analysis and modeling at the system/function level. Finally, according to the severity principle, the severity of the fault mode is redivided. The failure modes of severity I and II are used as the input of the FIF.
Figure 9.
A schematic diagram of the FMECA–FHA integrated model.
The fault cause analysis module in the FRACAS uses the FMECA–FHA model to replace the causes of the faults. The purpose of the FTA is to express the components within each subsystem graphically and quantitatively, while the FMECA conducts a fault cause analysis at the physical level for key components according to the quantitative results of the FTA. Section 2 proposed that an RDFTA can be applied as an alternative to an FTA in order to overcome the disadvantage of the maintenance rate not being considered in the analysis of repairable systems by a traditional dynamic FTA, thus bringing the calculation results of the RDFTA more in line with the actual situations of repairable systems. In the next section, the key findings of an application of 4F integration technology to the diesel engine reliability analysis method are introduced.
4. Case Study: Reliability Analysis of a Diesel Engine
4.1. Diesel Engine System Analysis
The complex system that was analyzed in this case study was a diesel engine in a harsh environment. The diesel engine consisted of several important subsystems: a fixed parts system, motion system, fuel supply system, intake and exhaust system, lubrication system, cooling system, starting system, and electric control system. The motion system was composed of a crankshaft mechanism, piston mechanism, connecting rod mechanism, valve mechanism, and transmission. Figure 10 shows the interaction relationships among the diesel engine subsystems and Figure 11 shows the corresponding relationships between the diesel engine function levels and result levels. When even one of the seven subsystems failed, the whole system failed; hence, the reliability relationships among the subsystems could be considered as a series (as shown in Figure 11).
Figure 10.
A schematic diagram of the diesel engine composition system.
Figure 11.
The corresponding relationships between the product function level and the structure level of diesel engines.
In the next section, the FMECA–FHA analysis was conducted first and then the FTA method was applied to deal with the fault mode of hazard 1 and its evaluation. The key components in the minimum cut set that was obtained from the FTA analysis were used in the FMECA physical fault analysis.
4.2. FMECA–FHA Analysis Results
Once all system functions were determined, the functional failure of each subsystem could be judged. Firstly, a system-level FMECA was executed to identify the functional failure modes, which could be defined as the failures of main system functions, and to estimate their impacts, causes, and risks. Then, a system-level FHA was performed to identify the impacts of the functional failure modes on safety. Table 7 reports the quantitative evaluation of the FMECA of each subsystem in the diesel engine, which was analyzed by experts as being responsible for diesel engine maintenance. In particular, the input data collection stage was judged in a meeting with relevant experts. The expert group conducted a quantitative evaluation of the FMECA factors of each subsystem. Three experts who had been working in this field for 15, 10, and 5 years were invited and the scoring weights of the three experts were 0.4, 0.3, and 0.3, respectively. The expert group scored the system-level failure modes to determine their priority.
Table 7.
The FMECA system-level results.
As shown in Table 7, the subsystem with the most serious functional failure at the system level was the pressurization and intake and exhaust system. Thus, the failure impacts of the components in that subsystem were further investigated. In the next step, a system-level safety analysis was carried out. The combination of the FHA and RSR in Section 3 was used to score the degree of injury that would be caused to personnel by each failure mode, the economic loss that would be caused by each failure, the maintenance cost that would be caused by failure, and the frequency of the failure according to the expert group.
As shown in Table 8, the expert group evaluated the impacts of the system-level failure modes on safety and the ranking results of the risk assessment of each failure mode was obtained at the system level using the FHA evaluation method that was discussed in Section 3.
Table 8.
The expert evaluation results of each failure mode.
By comparing the analysis results of the FMECA–FHA model in Table 7 and Table 9, the severity of the failure modes of each subsystem could be determined. It can be seen that the comprehensive severity of the failure of the control system, as well as those of the supercharger and the intake and exhaust systems, of the diesel engine was the highest. In order to reduce the workload, the RDFTA model of the faults in the control system, as well as those of the pressurization and intake and exhaust systems, was established as the top event.
Table 9.
The FHA sorting results.
4.3. Establishment of RDFTA for the Diesel Engine at the Component Level
The electronic control system of a diesel engine is a device that monitors its operational state. During the operation of a diesel engine, the electronic control system can monitor changes in the diesel engine operation in real time, provide timely feedback on the conditions that are caused by the diesel engine, and take corresponding measures to alleviate those conditions. The working principles of the intake and exhaust and supercharger systems are as follows: the exhaust pipe is connected to the turbine shell and high-temperature exhaust gas that has a certain pressure and flow rate and is discharged from the engine impacts the turbine in a certain direction through the turbine shell, causing the turbine to rotate at a high speed. Higher pressures lead to greater temperatures and speeds of the exhaust gas, as well as a higher turbine speed. The exhaust gas is then finally discharged into the atmosphere. The compressor impeller that is coaxial with the turbine shaft also sucks the air that is passing through the air filter into the compressor at the same speed. The interactions between the pressurization and electronic control system components are shown in Figure 12.
Figure 12.
A schematic diagram of the pressurization and electronic control systems.
According to the comprehensive severity score of the FMECA–FHA model, the RDFTA (with the diesel engine supercharger and electronic control system failures as the top events) was produced. Figure 12 indicates the following faults: a system fault T; an output fault of the pressurization and intake and exhaust systems T_1; an exhaust manifold fault A; a fault in the exhaust bypass valve B; an exhaust system failure C; a turbine failure D; a compressor failure E; an air filter failure F; a pressurization system failure G; an air intake system failure H; a control system failure T_2; a power failure I; a startup fault J; a controller failure K; and an actuator failure 50. Table 10 shows the reliability parameters of the pressurization, intake and exhaust, and control systems.
Table 10.
The RDFTA reliability parameters of the pressurization and control system components.
The quantitative reliability analysis of the supercharger, intake and exhaust, and control systems was carried out using the Monte Carlo simulation method [51]. In Formula (19), the availability formula of each unit within the system was obtained according to the failure rate and maintenance rate of the constituent units in the system, which were then input into the simulation to generate a 0–1 evenly distributed random number array. It was then judged whether each unit had failed, according to the unit availability and the random number group. According to the minimum cut set and the minimum path set of the system and the fault condition of the system unit, it was determined whether the system was faulty. The system was simulated m times and the number of times that the system was in a successful state was recorded. When the number of simulations was large enough, the calculation of the reliability and availability of the system was closer to reality.
where t is the time variable (h).
In , the simulation times of and were set per hour to obtain the simulated availability of the FTA’s top events. A comparison between the RTFA and the MC–FTA is shown in Figure 11 and Figure 12.
Figure 13 and Figure 14 show that the probability of the RDFTA and Monte Carlo calculation outputs was similar and that their reliability conclusions were basically the same. This showed that the reliability analysis method of RDFTA is feasible and correct. From the RDFTA minimum cut set algorithm (Equation (13)), the following could be established: K1 = {}; K2 = {}; K3 = {}; K4 = {}; K5 = {}; K6 = {}; K7 = {}; K8 = {}; K9 = {}; K10 = {,}; K11 = {,}; K12 = {,}; K13 = {,}; K14 = {,}; K15 = {,}; K16 = {,}; K17 = {,, }; K18 = {,,}; and K19 = {,,,}.
Figure 13.
A comparison to the Monte Carlo algorithm.
Figure 14.
A comparison to the Monte Carlo algorithm.
The probability importance of each minimum cut set could be obtained from the RDFTA probability importance algorithm (Equation (16)) as follows: K1 = 0.0368; K2 = 0.0392; K3 = 0.898; K4 = 0.023; K5 = 0.000806; K6 = 0.000253; K7 = 0.000944; K8 = 0.000576; K9 = 0.0000647; K10 = 0.0000216; K11 = 0.0000647; K12 = 0.0000242; K13 = 0.00000806; K14 = 0.0000242; K15 = 1.84 × 10⁻⁹; K16 = 1.62 × 10⁻⁹; K17 = 2.9 × 10⁻⁹; K18 = 1.27 × 10⁻¹⁵; and K19 = 4.54 × 10⁻¹⁶.
Compared to the results of the minimum cut set importance, the K3 minimum cut set was the weak link at the diesel engine component level. The FMECA physical fault analysis was used for K3.
4.4. FMECA Physical Fault Analysis
In this section (the third and deepest analysis), a physical analysis of the failures was performed. According to the results of the RDFTA analysis, the turbine was the most critical part of the engine. The FMECA of the failing physical level of the turbine was carried out as described below and the results are shown in Table 11.
Table 11.
The physical-level failures according to the FMECA.
During the operation of a turbocharger, the blades of the turbine are subjected to the action of periodic forces, i.e., the exciting forces that cause the blades to vibrate. When the frequency of the exciting force is equal to or is an integer multiple of the natural frequency of the blade, the blade resonates. When the blade resonates, the stress increases sharply and the blade eventually breaks due to fatigue. When one of the blades of a turbine breaks, the adjacent blades (or even all of the blades) can become damaged in a short period of time, causing the whole turbocharger to fail.
5. Conclusions
In this paper, we put forward a reliable analysis method that is based on 4F integrated technology, according to the characteristics of the four reliability analysis methods of FHA, FTA, FTA, and FRACAS. We conducted systematic research on a new type of diesel engine in terms of a reliability analysis of the design stage of the planning. The 4F integration framework improved efficiency in the following ways: first, it determined the priority of each failure mode according to the RPN in the FMECA and the RSR in the FHA; at the component level, the RDFTA model could be used to identify the worst component, according to the characteristics of the repairable system; at the physical level of failure, an FMECA was used to assess the root cause of the failure and its hazard level; a FRACAS was used to control the faults that were identified by the above methods throughout the design phase cycle and propose compensation measures to facilitate the continuous optimization of the reliability of the new system. The FRACAS results are shown in Appendix A. The advantages of this approach are that the analysis process is simple, it does not take much time (i.e., it is efficient), and it enables users to find all of the relevant failure modes (i.e., it is effective).
In future work on the analysis of fault data, the fuzzy set theory could be combined to reduce the uncertainty of the subjective evaluation. In addition, only cold logic doors have been derived in the RDFTA method and the reserve system also has two parts: warm spare parts and hot spare parts. The next step is to conduct corresponding research on the reliability analysis of mildly hot storage agencies.
Author Contributions
Conceptualization, M.Z. and S.L.; methodology, M.Z. and C.C.; software, M.Z.; validation, M.Z. and X.H.; formal analysis, Y.L.; investigation, M.Z. and C.C.; resources, M.Z. and X.H.; data curation, X.H. and Y.L.; writing—original draft preparation, M.Z. and S.L.; writing—review and editing, S.L. and C.C.; visualization, M.Z.; supervision, H.D. and X.H.; project administration, H.D. and X.H.; funding acquisition, S.L. and H.D. All authors have read and agreed to the published version of the manuscript.
Funding
This research was funded by the Ministry of Industry and Information Technology of the People’s Republic of China.
Institutional Review Board Statement
Not applicable.
Informed Consent Statement
Not applicable.
Data Availability Statement
Not applicable.
Conflicts of Interest
The authors declare no conflict of interest.
Appendix A
Table A1.
The FRACAS results.
Table A1.
The FRACAS results.
| Analysis | Failure Mode | Fault System | Fault Severity Index | Cause of Failure | Corrective Measures | Effect of Corrective Measures |
|---|---|---|---|---|---|---|
| FMECA | Compressor impeller blade damaged | Supercharger system | 108 (RPN) | High-temperature degradation | Increase blade thickness, improve blade profile structure, and improve blade strength | Corrected |
| FMECA | Sensor failure | Control system | 90 (RPN) | Sensitive device failure | Use the preferred sensor | Corrected |
| FMECA | Cylinder head cracked | Fastener system | 49 (RPN) | Insufficient material strength | Optimize the material composition and improve the mechanical properties | Corrected |
| FMECA | Fracture of moving connector | Moving parts system | 70 (RPN) | Insufficient cooling and lubrication | Optimize the cooling and lubrication system and reasonably distribute the lubricating oil of each component | Corrected |
| FMECA | Poor atomization quality | Fuel supply system | 72 (RPN) | Injector failure | Improve fuel quality | Corrected |
| FMECA | Leakage of water pump volute | Cooling system | 24 (RPN) | Casting defects of water pump volute | Control casting quality | Corrected |
| FMECA | Oil filter failure | Lubrication system | 40 (RPN) | Oil leakage of oil filter seat | Improve the structure of oil filter cartridge and increase bolt compression | Corrected |
| FHA | Supercharger function failure | Supercharger system | 0.06818 (RSR) | Impeller flying | Increase the overspeed margin of turbine impeller | Corrected |
| FHA | Diesel engine start failure | Control system | 0.05618 (RSR) | High accelerator pedal zero output voltage | Use the preferred potentiometer | Corrected |
| FHA | Abnormal wear of valve seat ring | Fastener system | 0.03409 (RSR) | Coaxiality of the valve guide and the valve seat ring not up to standard | Increase the design accuracy of coaxiality between the conduit and seat ring | Corrected |
| FHA | Failure of transmission mechanism | Moving parts system | 0.02273 (RSR) | Camshaft fracture | Change the transmission direction of the camshaft gear to reduce stress | Corrected |
| FHA | Failure of fuel supply system | Fuel supply system | 0.0273 (RSR) | High-pressure oil pump failure | Improve fuel quality and clean regularly | Corrected |
| FHA | Pump failure | Cooling system | 0.01136 (RSR) | Mechanical seal damaged | Optimize the design of the structural size of the mounting hole of the water seal stationary ring to ensure that the stationary ring is installed in place | Corrected |
| FHA | Function failure of heat exchanger | Lubrication system | 0.01136 (RSR) | Oil leakage of oil filter seat | Improve the structure of oil filter cartridge and increase bolt compression | Corrected |
| FTA | Turbocharger failure | Turbocharger and intake and exhaust system | 0.898 (F–V) | Turbocharger failure | Optimize the working environment of the supercharger | Corrected |
| FMECA | Resonance fracture of turbine blade | Supercharger system | 128 (RPN) | Aerodynamic load instability | Replace with a more suitable nozzle ring | Corrected |
| FMECA | Fatigue creep fracture of impeller blade root | Supercharger system | 72 (RPN) | High-temperature creep fracture | Shot peen the turbine surface to reduce turbine stress | Corrected |
References
- Daneshfar, R.; Bemani, A.; Hadipoor, M.; Sharifpur, M.; Ali, H.; Mahariq, I.; Abdeljawad, T. Estimating the heat capacity of non-Newtonian ionanofluid systems using ANN, ANFIS, and SGB tree algorithms. Appl. Sci. 2020, 10, 6432. [Google Scholar] [CrossRef]
- Píštěk, V.; Kučera, P.; Fomin, O.; Lovska, A.; Prokop, A. Acoustic identification of turbocharger impeller mistuning—A new tool for low emission engine development. Appl. Sci. 2020, 10, 6394. [Google Scholar] [CrossRef]
- Wang, L.; Yan, F.; Wang, F.; Li, Z. FMEA-CM based quantitative risk assessment for process industries—A case study of coal-to-methanol plant in China. Process Saf. Environ. Prot. 2021, 149, 299–311. [Google Scholar] [CrossRef]
- Klimaszewski, S.; Sajda, K.; Szawłowski, S. Small UAV SHM System Functional Hazard Analysis. J. KONBiN 2021, 51, 33–41. [Google Scholar] [CrossRef]
- Emovon, I.; Mgbemena, C.O. Enhancing the FMEA technique using a combination of Expectation interval, TAGUCHI, MOORA and Geometric mean methods. J. Eng. Res. 2019, 7, 238–260. [Google Scholar]
- Sun, R.; Zhong, D.; Li, W.; Lu, M.; Ding, Y.; Xu, Z.; Gong, H.; Zha, Y. A Safety Analysis Method of Airborne Software Based on ARP4761. J. Phys. Conf. Ser. 2020, 1673, 012045. [Google Scholar] [CrossRef]
- Freeman, R.R. A novel method for fault tree uncertainty analysis using error propagation methods. Process Saf. Prog. 2021, 40, 50–62. [Google Scholar] [CrossRef]
- Gjorgiev, B.; Antenucci, A.; Volkanovski, A.; Sansavini, G. An FTA method for the unavailability of supply in gas networks supported by physical models. IEEE Trans. Reliab. 2019, 69, 740–753. [Google Scholar] [CrossRef]
- Jo, J.H.; Song, H.S.; Kim, B.H. Development of TLCSM Based Integrated Architecture for Applying FRACAS to Defense Systems. J. Korea Acad. Ind. Coop. Soc. 2020, 21, 190–196. [Google Scholar]
- Tanner, J. Agile FRACAS in Production Manufacturing. In Proceedings of the IEEE 2020 Annual Reliability and Maintainability Symposium (RAMS), Palm Springs, CA, USA, 27–30 January 2020; pp. 1–6. [Google Scholar]
- Sharma, K.D.; Srivastava, S. Failure mode and effect analysis (FMEA) implementation: A literature review. J. Adv. Res. Aeronaut. Space Sci. 2018, 5, 1–17. [Google Scholar]
- Deulgaonkar, V.R.; Ingolikar, N.; Borkar, A.; Ghute, S.; Awate, N. Failure analysis of diesel engine piston in transport utility vehicles. Eng. Fail. Anal. 2021, 120, 105008. [Google Scholar] [CrossRef]
- Aized, T.; Ahmad, M.; Jamal, M.H.; Mahmood, A.; Rehman, S.U.U.; Srai, J.S. Automotive leaf spring design and manufacturing process improvement using failure mode and effects analysis (FMEA). Int. J. Eng. Bus. Manag. 2020, 12, 1847979020942438. [Google Scholar] [CrossRef]
- Filo, G.; Fabiś-Domagała, J.; Domagała, M.; Lisowski, E.; Momen, H. The idea of fuzzy logic usage in a sheet-based FMEA analysis of mechanical systems. MATEC Web Conf. 2018, 183, 03009. [Google Scholar] [CrossRef] [Green Version]
- Ayber, S.; Erginel, N. Developing the neutrosophic fuzzy FMEA method as evaluating risk assessment tool. In Proceedings of the International Conference on Intelligent and Fuzzy Systems, Istanbul, Turkey, 23–25 July 2019; Springer: Cham, Switzerland, 2019; pp. 1130–1137. [Google Scholar]
- Barozzi, M.; Contini, S.; Raboni, M.; Torretta, V.; Moreno, V.C.; Copelli, C. Integration of Recursive Operability Analysis, FMECA and FTA for the Quantitative Risk Assessment in biogas plants: Role of procedural errors and components failures. J. Loss Prev. Process Ind. 2021, 71, 104468. [Google Scholar] [CrossRef]
- Khandan, M.; Koohpaei, A.; Hosseinzadeh, Z.; Sadeghi, A. Application of Functional Hazard Analysis Technique (FuHA) in the risk as-sessment and accident management: A case study in a textile industry. J. Inj. Violence Res. 2019, 11 (Suppl. S2), 40. [Google Scholar]
- Zikrullah, N.A.; Kim, H.; van der Meulen, M.J.P.; Skofteland, G.; Lundteigen, M.A. A comparison of hazard analysis methods capability for safety requirements generation. Proc. Inst. Mech. Eng. Part O J. Risk Reliab. 2021, 235, 1132–1153. [Google Scholar] [CrossRef]
- Markov, A.; Bendarkar, M.V.; Mavris, D.N. Improved Hazard Analysis for Novel Vehicle Configurations Using the Sys-tems-Theoretic Process Analysis. In Proceedings of the AIAA Scitech 2022 Forum, San Diego, CA, USA, 3–7 January 2022. [Google Scholar] [CrossRef]
- Hao, H.; Yi-Fan, D.U.; Cao, H.B. Functional Hazard and Fault Tree Analysis for Airplane Drag Chute Mechanism. Aeronaut. Comput. Tech. 2018, 48, 37–43. [Google Scholar]
- Chen, Z.; Fielding, J.P. A zonal safety analysis methodology for preliminary aircraft systems and structural design. Aeronaut. J. 2018, 122, 1330–1351. [Google Scholar] [CrossRef] [Green Version]
- Arena, M.; Concilio, A.; Pecora, R. Aero-servo-elastic design of a morphing wing trailing edge system for en-hanced cruise performance. Aerosp. Sci. Technol. 2019, 86, 215–235. [Google Scholar] [CrossRef]
- Zhang, Y.; Liu, C.; Xu, T.; Huang, Y.; Tao, L. Impact analysis and classification of aircraft functional failures using improved FHA based on grey evaluation. Grey Syst. Theory Appl. 2020, 10, 159–171. [Google Scholar] [CrossRef]
- Graydon, M.; Neogi, N.A.; Wasson, K. Guidance for designing safety into urban air mobility: Hazard analysis tech-niques. In Proceedings of the AIAA Scitech 2020 Forum, Orlando, FL, USA, 6–10 January 2020. [Google Scholar] [CrossRef]
- Yazdi, M.; Kabir, S.; Walker, M. Uncertainty handling in fault tree based risk assessment: State of the art and future perspectives. Process Saf. Environ. Prot. 2019, 131, 89–104. [Google Scholar] [CrossRef]
- Maurya, A.; Kumar, D. Reliability of safety-critical systems: A state-of-the-art review. Qual. Reliab. Eng. Int. 2020, 36, 2547–2568. [Google Scholar] [CrossRef]
- Yin, H.; Ma, S.; Li, H.; Wen, G.; Santhanagopalan, S.; Zhang, C. Modeling strategy for progressive failure prediction in lithium-ion batteries under mechanical abuse. ETransportation 2021, 7, 100098. [Google Scholar] [CrossRef]
- Feng, X.; Jiang, J.; Feng, Y. Reliability evaluation of gantry cranes based on fault tree analysis and Bayesian network. J. Intell. Fuzzy Syst. 2020, 38, 3129–3139. [Google Scholar] [CrossRef]
- Szkoda, M.; Kaczor, G. Reliability and availability assessment of diesel locomotive using fault tree analysis. Arch. Transp. 2016, 40, 65–75. [Google Scholar] [CrossRef] [Green Version]
- Huang, C.; Li, L. Architectural design and analysis of a steer-by-wire system in view of functional safety concept. Reliab. Eng. Syst. Saf. 2020, 198, 106822. [Google Scholar] [CrossRef]
- Hu, G.; Huang, P.; Bai, Z.; Wang, Q.; Qi, K. Comprehensively analysis the failure evolution and safety evaluation of automotive lithium ion battery. eTransportation 2021, 10, 100140. [Google Scholar] [CrossRef]
- Yusufa, K.; Hadiy, S.; Olanipekuns, A. Sources of failures of engineering systems. Villanova J. Sci. Technol. Manag. 2019, 1, 69–76. [Google Scholar]
- Chang, J.; Yoo, S.J.; Kim, S. Development and Application of Computerized Risk Registry and Management Tool Based on FMEA and FRACAS for Total Testing Process. Medicina 2021, 57, 477. [Google Scholar] [CrossRef]
- Xia, Y.; Wang, X.; Yan, C.; Wu, J.; Xue, H.; Li, M.; Lin, Y.; Li, J.; Ji, L. Risk assessment of the total testing process based on quality indicators with the Sigma metrics. Clin. Chem. Lab. Med. CCLM 2020, 58, 1223–1231. [Google Scholar] [CrossRef]
- Cai, S.; Jiang, G. Reliability Analysis of Unmanned Aerial Vehicles Flight Control System Based on Reliability Analysis Technologies. J. Donghua Univ. 2018. [Google Scholar] [CrossRef]
- Appoh, F.; Yunusa-Kaltungo, A.; Sinha, J.K.; Kidd, M. A Hybrid Framework for a Reliability Improvement of a Rolling Stock Door Subsystem. In Proceedings of the International Conference on Maintenance Engineering, Zhuhai, China, 15–17 April 2020; Springer: Cham, Switzerland, 2020; pp. 100–107. [Google Scholar]
- Li, Y.; Wen, S.; Liu, S.; Zhao, L.; Wang, Q.; Zhang, G. Early failure active elimination system research for electromechanical product based on meta-action. Qual. Reliab. Eng. Int. 2021, 37, 2305–2324. [Google Scholar] [CrossRef]
- Kawazoe, C.; McDougle, K.; Miro, J.; Skinner, T. A RAMS Life Support Model Through Design Optimization. In Proceedings of the IEEE 2018 Annual Reliability and Maintainability Symposium (RAMS), Reno, NV, USA, 22–25 January 2018; pp. 1–5. [Google Scholar]
- Ali, N.; Hussain, M.; Hong, J.E. Analyzing safety of collaborative cyber-physical systems considering variability. IEEE Access 2020, 8, 162701–162713. [Google Scholar] [CrossRef]
- Zhang, M.; Cui, C.; Liu, S.; Yi, X. Reliability technology using FTA, FMECA, FHA and FRACAS: A review. In Proceedings of the 2021 IEEE Interna-tional Conference on Sensing, Diagnostics, Prognostics, and Control (SDPC), Weihai, China, 13–15 August 2021; pp. 282–291. [Google Scholar]
- Bobbio, A.; Raiteri, D.C. Parametric fault trees with dynamic gates and repair boxes. In Proceedings of the IEEE Annual Symposium Reliability and Maintainability, Los Angeles, CA, USA, 26–29 January 2004. [Google Scholar]
- Codetta-Raiteri, D. Generalized fault trees: From reliability to security. In Proceedings of the International Workshop on Quantitative Aspects in Security Assurance, London, UK, 12 September 2013. [Google Scholar]
- Chen, D.; Xu, J.; Yao, C.; Pan, H.; Hu, Y. Continuous-time multi-dimensional T-S dynamic fault tree analysis method. J. Mech. Eng. 2021, 57, 231–244. [Google Scholar]
- Yi, X.J.; Shi, J.; Dhillon, B.S.; Hou, P.; Dong, H.P. A new reliability analysis method for repairable systems with closed-loop feedback links. Qual. Reliab. Eng. Int. 2018, 34, 298–332. [Google Scholar] [CrossRef]
- Godiganur, V.S.; Nayaka, S.; Kumar, G.N. Thermal barrier coating for diesel engine application—A review. Mater. Today Proc. 2020, 45, 133–137. [Google Scholar] [CrossRef]
- Dinkar, B.K.; Mukhopadhyay, A.K.; Chattopadhyaya, S.; Sharma, S.; Alam, F.; Machado, J. Statistical Reliability Assessment for Small Sample of Failure Data of Dumper Diesel Engines Based on Power Law Process and Maximum Likelihood Estimation. Appl. Sci. 2021, 11, 5387. [Google Scholar] [CrossRef]
- Zhao, Z.; Song, X.; Jin, B. In order to apply the national defense weapon system fracas, an integrated archi-tecture based on tlcsm is established. J. Pap. Korea Inst. Technol. 2020, 21, 190–196. [Google Scholar]
- Fabis-Domagala, J.; Domagala, M.; Momeni, H. A Matrix FMEA Analysis of Variable Delivery Vane Pumps. Energies 2021, 14, 1741. [Google Scholar] [CrossRef]
- Yu, B. Computer Dynamic Forecast Model with Adaptability through the Method of Rank-Sum Ratio. J. Phys. Conf. Ser. 2021, 2033, 012017. [Google Scholar] [CrossRef]
- Walz, M.C. Trends in the Static Stability Factor of Passenger Cars, Light Trucks and Vans; DOT HS 809 868 NHTSA Technical Report; National Highway Traffic Safety Administration: Washington, DC, USA, 2005.
- Chiacchio, F.; Aizpurua, J.I.; Compagno, L.; D’Urso, D. SHyFTOO, an object-oriented Monte Carlo simulation library for the mod-eling of Stochastic Hybrid Fault Tree Automaton. Expert Syst. Appl. 2020, 146, 113139. [Google Scholar] [CrossRef]
Publisher’s Note: MDPI stays neutral with regard to jurisdictional claims in published maps and institutional affiliations. |
© 2022 by the authors. Licensee MDPI, Basel, Switzerland. This article is an open access article distributed under the terms and conditions of the Creative Commons Attribution (CC BY) license (https://creativecommons.org/licenses/by/4.0/).