Article

Research on the Application of the Dynamic Assisted Sleep Light to Smart Mobile Devices

1
Graduate Institute of Colour & Illumination Technology National Taiwan University of Science and Technology, Taipei City 106335, Taiwan
2
OSENSE TECHNOLOGY CO., LTD. 8F., No.325, Sec. 4, Zhongxiao E. Rd., Da’an Dist., Taipei City 106449, Taiwan
*
Author to whom correspondence should be addressed.
Appl. Sci. 2022, 12(10), 5191; https://doi.org/10.3390/app12105191
Submission received: 13 April 2022 / Revised: 12 May 2022 / Accepted: 17 May 2022 / Published: 20 May 2022
(This article belongs to the Section Biomedical Engineering)

Abstract

:
With the rapid development of science and technology, social competition becomes more and more fierce, and work pressure becomes more and more intense. The problem of sleep has become a disease of modern civilization, and in order to alleviate sleep problems and improve sleep quality, related research methods are constantly updated, and there are more and more ways to address these problems. In this paper, we propose a dynamic assisted sleep light that adjusts the color temperature, illuminance, and frequency of change by controlling the backlight of the smart mobile device, so that the user experiences an improved quality of sleep. In this study, the methods of subjective questionnaire survey and non-subjective physiological parameter measurement were adopted for analysis. The results showed that the continuous use of the light source could continuously enhance the user’s delta energy during sleep and promote the improvement of sleep quality.

1. Introduction

Sleep is the most basic need of human beings every day. Sleep allows the brain to rest and carry out the learning work of memory reorganization, storage, body relaxation, etc. Most human beings gain external experience and knowledge through vision, as an important way of obtaining external information. In the process of visual access to external information, it is necessary to rely on the interaction between light and objects in the physical world, light which then reaches the retina through the refraction and reflection effects of light. Then, the information is stored and transmitted to the brain by neurons in the retina [1]. However, there are many regions and neurons in the human brain which process information related to vision, analyzing the optical information obtained by vision and converting it into neural signals that the brain can understand, and then storing that information in the memory through sleep. However, the optical information that human vision can detect is only a small part of the light spectrum, and the wavelength ranges from 380–780 nm.
It was previously understood that the photoreceptor cells in people’s eyes were composed of rod cells and cone cells, which, respectively, controlled the storage and analysis of external light intensity and color texture changes. In 2002, however, with the continuous progress of medical and scientific technology, scientists in the United States discovered a third kind of special photosensitive cell [2,3,4]: intrinsically photosensitive retinal ganglion cells (ipRGC). These ipRGC do not rely on cone-shaped and rod-shaped cells for sensitization, but rather melanopsin, thus breaking with the traditional concept of visual photosensitive organs. As a result, the discovery of ipRGC changed the long-term understanding of photobiology, and at the same time, it was known that illumination would have other effects on the human body.
In the discovery of the third kind of intrinsically photosensitive retinal ganglion cells (ipRGC), it was revealed that this cell receives light through melanopsin and then influences various physiological adjustments and reactions, such as melatonin secretion, circadian rhythm phase shift, sleep time, etc. [5,6]. In 2005, Kozaki et al. used light sources with different color temperatures to study sleep, and conducted sleep experiments at 3000 K, 5000 K and 6700 K with illumination of less than 10 lx. The experimental results show that the total sleep time at 6700 K is less than that at 3000 K [7]. The research results of Chellappa SL et al. in 2013 also showed that melatonin was obviously inhibited at the color temperature of 6500 K two hours before going to bed under the illumination of a light source with a color temperature of 3000 K and illumination of 40 lx at 6500 K; meanwhile, alertness increased, happiness increased, and visual comfort increased, but slow wave sleep without rapid eye movement decreased in the first sleep cycle [8]. In 2017, the research of Smolders et al. also found that in people who were deprived of sleep at night, after being stimulated by 2700 K, 500 lx illumination and 6000 K, 500 lx light, all the subject’s showed emotions of high excitement and alertness at 6000 K color temperature [9]. For the dynamic color temperature, in the research of Canazei, M., et al. in 2013, physiological experiments were conducted by means of dynamic illumination, and Canazei et al. conducted experiments for female employees who worked shifts. Because the shift workers’ sleep quality, mood, and stress are worse than those of people with normal daily routines and rest, in order to adjust the circadian rhythm of the workers, the dynamic changes of the light source in the working environment are used in the experiment. The experimental results show that the workers who use the dynamic light source at work see a significant improvement in mood and sleep quality compared with those who use the general lighting. Additionally, in terms of productivity, the workers who use the dynamic light source are also more efficient, and the circadian rhythm of the shift workers is adjusted [10]. In a practical working environment, Kort et al. [11] also studied the effect of a fluorescent lamp dynamic light with a color temperature changing from 3000 K to 4700 K, which was irradiated for 10 h (8:00~18:00) in a working day. Although 83 subjects expressed more satisfaction with the dynamic light, there was no obvious statistically significant difference in alertness and subjective performance compared with static light. According to the literature studied by Kathleen E. West et al., the effects on melatonin under exposure to a light source below 4000 K are not significant, and the phenomenon of melatonin suppression is obvious at a color temperature above 4000 K, which means that a light source below 4000 K has no obvious effect on melatonin [12]. Through the research, it is evident that the human eye affects the physiological secretion of melatonin and cortisol after receiving short wavelength blue light exposure, resulting in sleep disorder.
With the rapid development of science and technology in recent years, people’s lives are becoming more and more convenient and comfortable. Still, it also brings people a lot of indirect hazards, meaning that health issues are receiving more and more attention. Because people come into contact with light every day in any job, and light is a necessity of daily life, there has been much research on the influence of light on the human body, and in recent years, the most discussed question is whether light affects sleep quality. However, the results of the study [13] found that exposure to too many indirect light sources can lead to imbalances in the biological clock, circadian rhythm disorders, and delayed melatonin secretion, leading to sleep disorders, which in turn lead to insomnia and other problems. The occurrence of insomnia and sleep disorders also brings a series of serious consequences [13,14,15,16,17].
In addition, reading, relaxing, and working with electronic devices before going to bed has become a common feature of modern lifestyles. In several studies, the time spent watching the screen has an effect on attention and sleep time. In 2015, in the research of AM Chang et al., it was found that looking at an E-book e-reader for 4 h before going to sleep would reduce the melatonin secretion of the subjects, delay the biological clock time, and significantly reduce the REM time of the subjects [18]. The results of this study confirm that the longer one uses electronic devices, the more serious the impact on sleep. In 2016, in the research results of Vanessa C Brunetti and others, it was also found that the average teenager looked at a computer screen and played games for more than 2 h continuously, and therefore sleep time would be significantly shortened [19]. In general, the research report of Brunetti, V.C. pointed out that reading e-books or physical books for 2 h at night would not have any additional influence on melatonin secretion under the influence of a day’s exposure to sunlight and artificial light [20]. However, in 2013, the scientific research of Heath, M. and others pointed out that when the brightness of a flat screen is below 80 lux and the use time is below one hour, the sleep time of the flat screen user is not significantly different from that of someone using a screen with 1 lux filtered blue light [21]. This is different from other scientific studies where there is significant melatonin suppression in the continuous viewing of electronic devices for more than 2 h and exposure to human light [22,23,24].
Following our understanding that the reception of light will affect the circadian rhythm and shift the sleep phase, more literature about the influence of light on sleep and the fact that illumination affects the circadian rhythm is beginning to appear. The light is not only sunlight and indoor lighting but also that from mobile devices. At first, mobile devices were only used as an important method of telephone contact, but now they cover many important tasks in life, such as online meetings, calendar records, network data query and update, cloud printing, payment, etc. According to the international IDC market survey report and the results of the Digital 2020: Global Digital Overview on mobile phone users and internet users, the annual growth rate of the global wearable device market in the fourth quarter of 2019 increased to 92.3%, reaching a new high of 118.9 million units, and the shipment rate of wearable devices in 2019 reached 336.5 million units, which was 89% higher than the 178 million units in 2018 [25]. In the survey of global internet users in 2020, the number of users increased from 4.22 billion to 4.54 billion, an increase of 7%, and the number of newly added users accounted for 298 million. At the same time, the number of mobile phones in the world has exceeded 5.19 billion, an increase of 124 million compared with 2019, with a growth rate of 2.4%. In addition, it takes an average of 6 h and 43 min for everyone in the world to use the internet every day [26]. According to the results of the IDC market survey and Digital 2020 survey report, we can understand the inseparability of modern people and smart mobile devices, demonstrating that smart mobile devices are becoming more and more important and indispensable under the constant development of technology.
Therefore, based on the concept that people’s needs are closely related to daily life, and through the previous experimental results [27,28,29], an algorithm was developed using an intelligent actuator as a platform to control the backlight device of the intelligent actuator to reproduce its correlated color temperature, frequency, and illumination. The methods of subjective questionnaire and non-subjective physiological data measurement were used to conduct analysis experiments to verify the effects of the spectra emitted from different devices on people’s sleep.

2. Materials and Methods

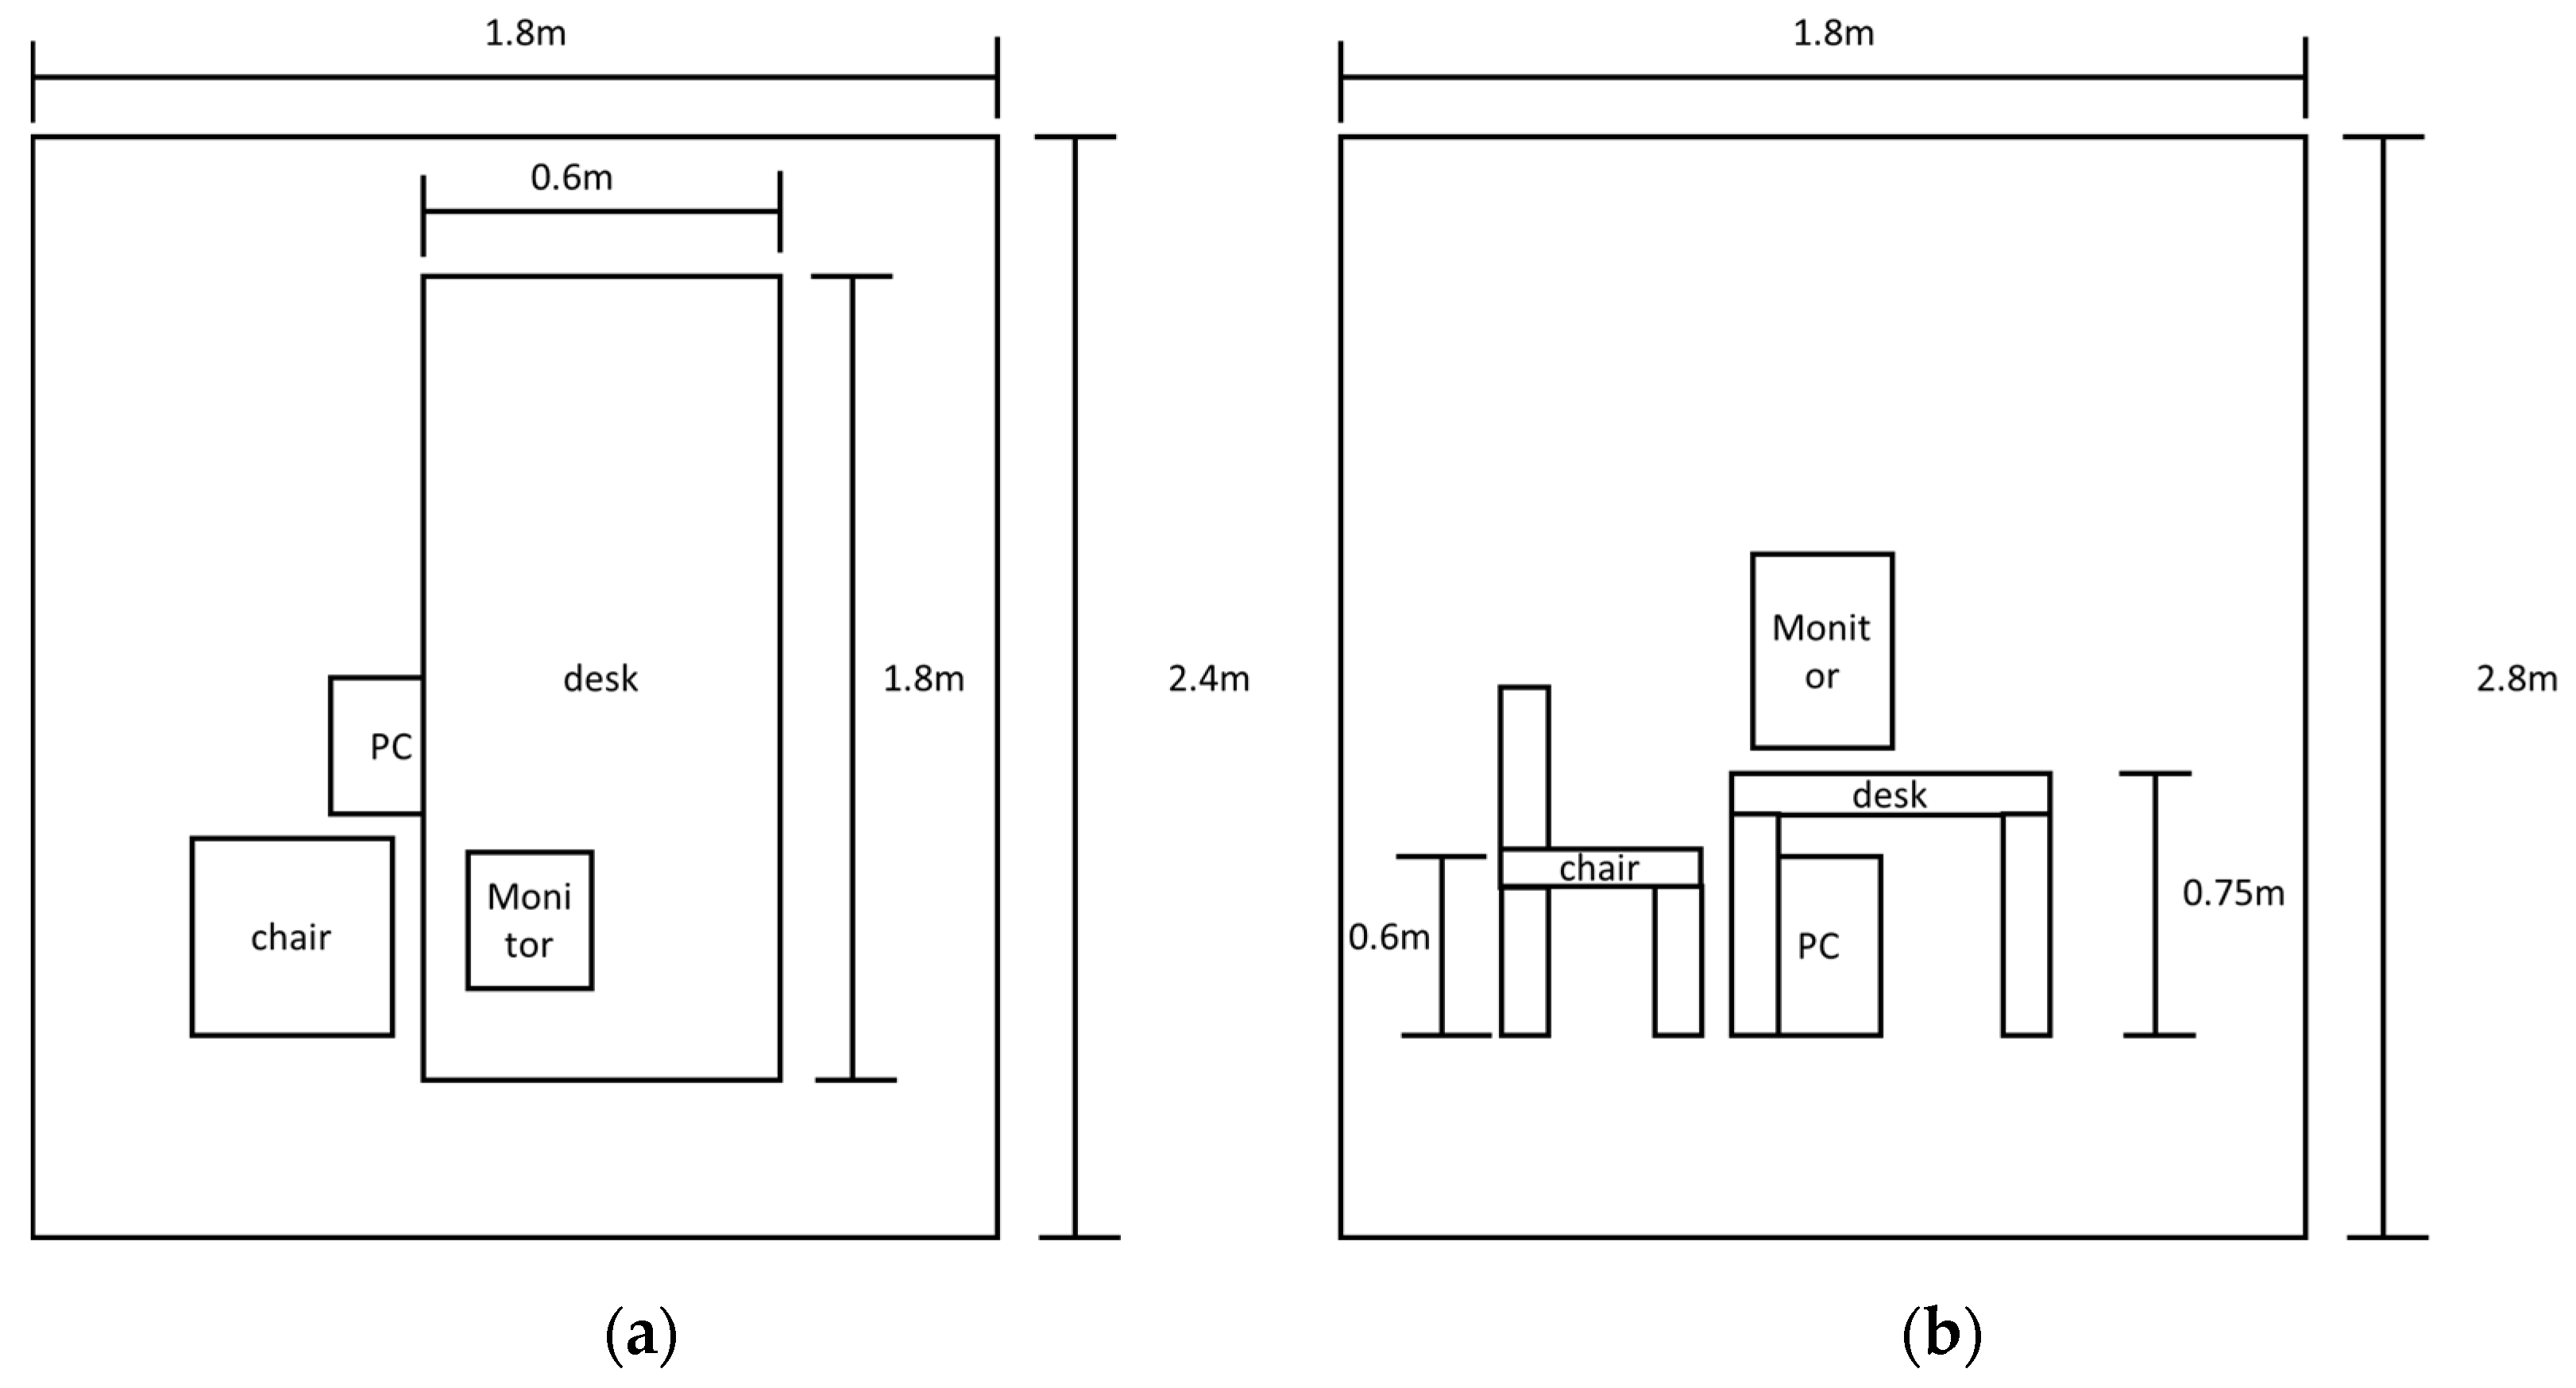
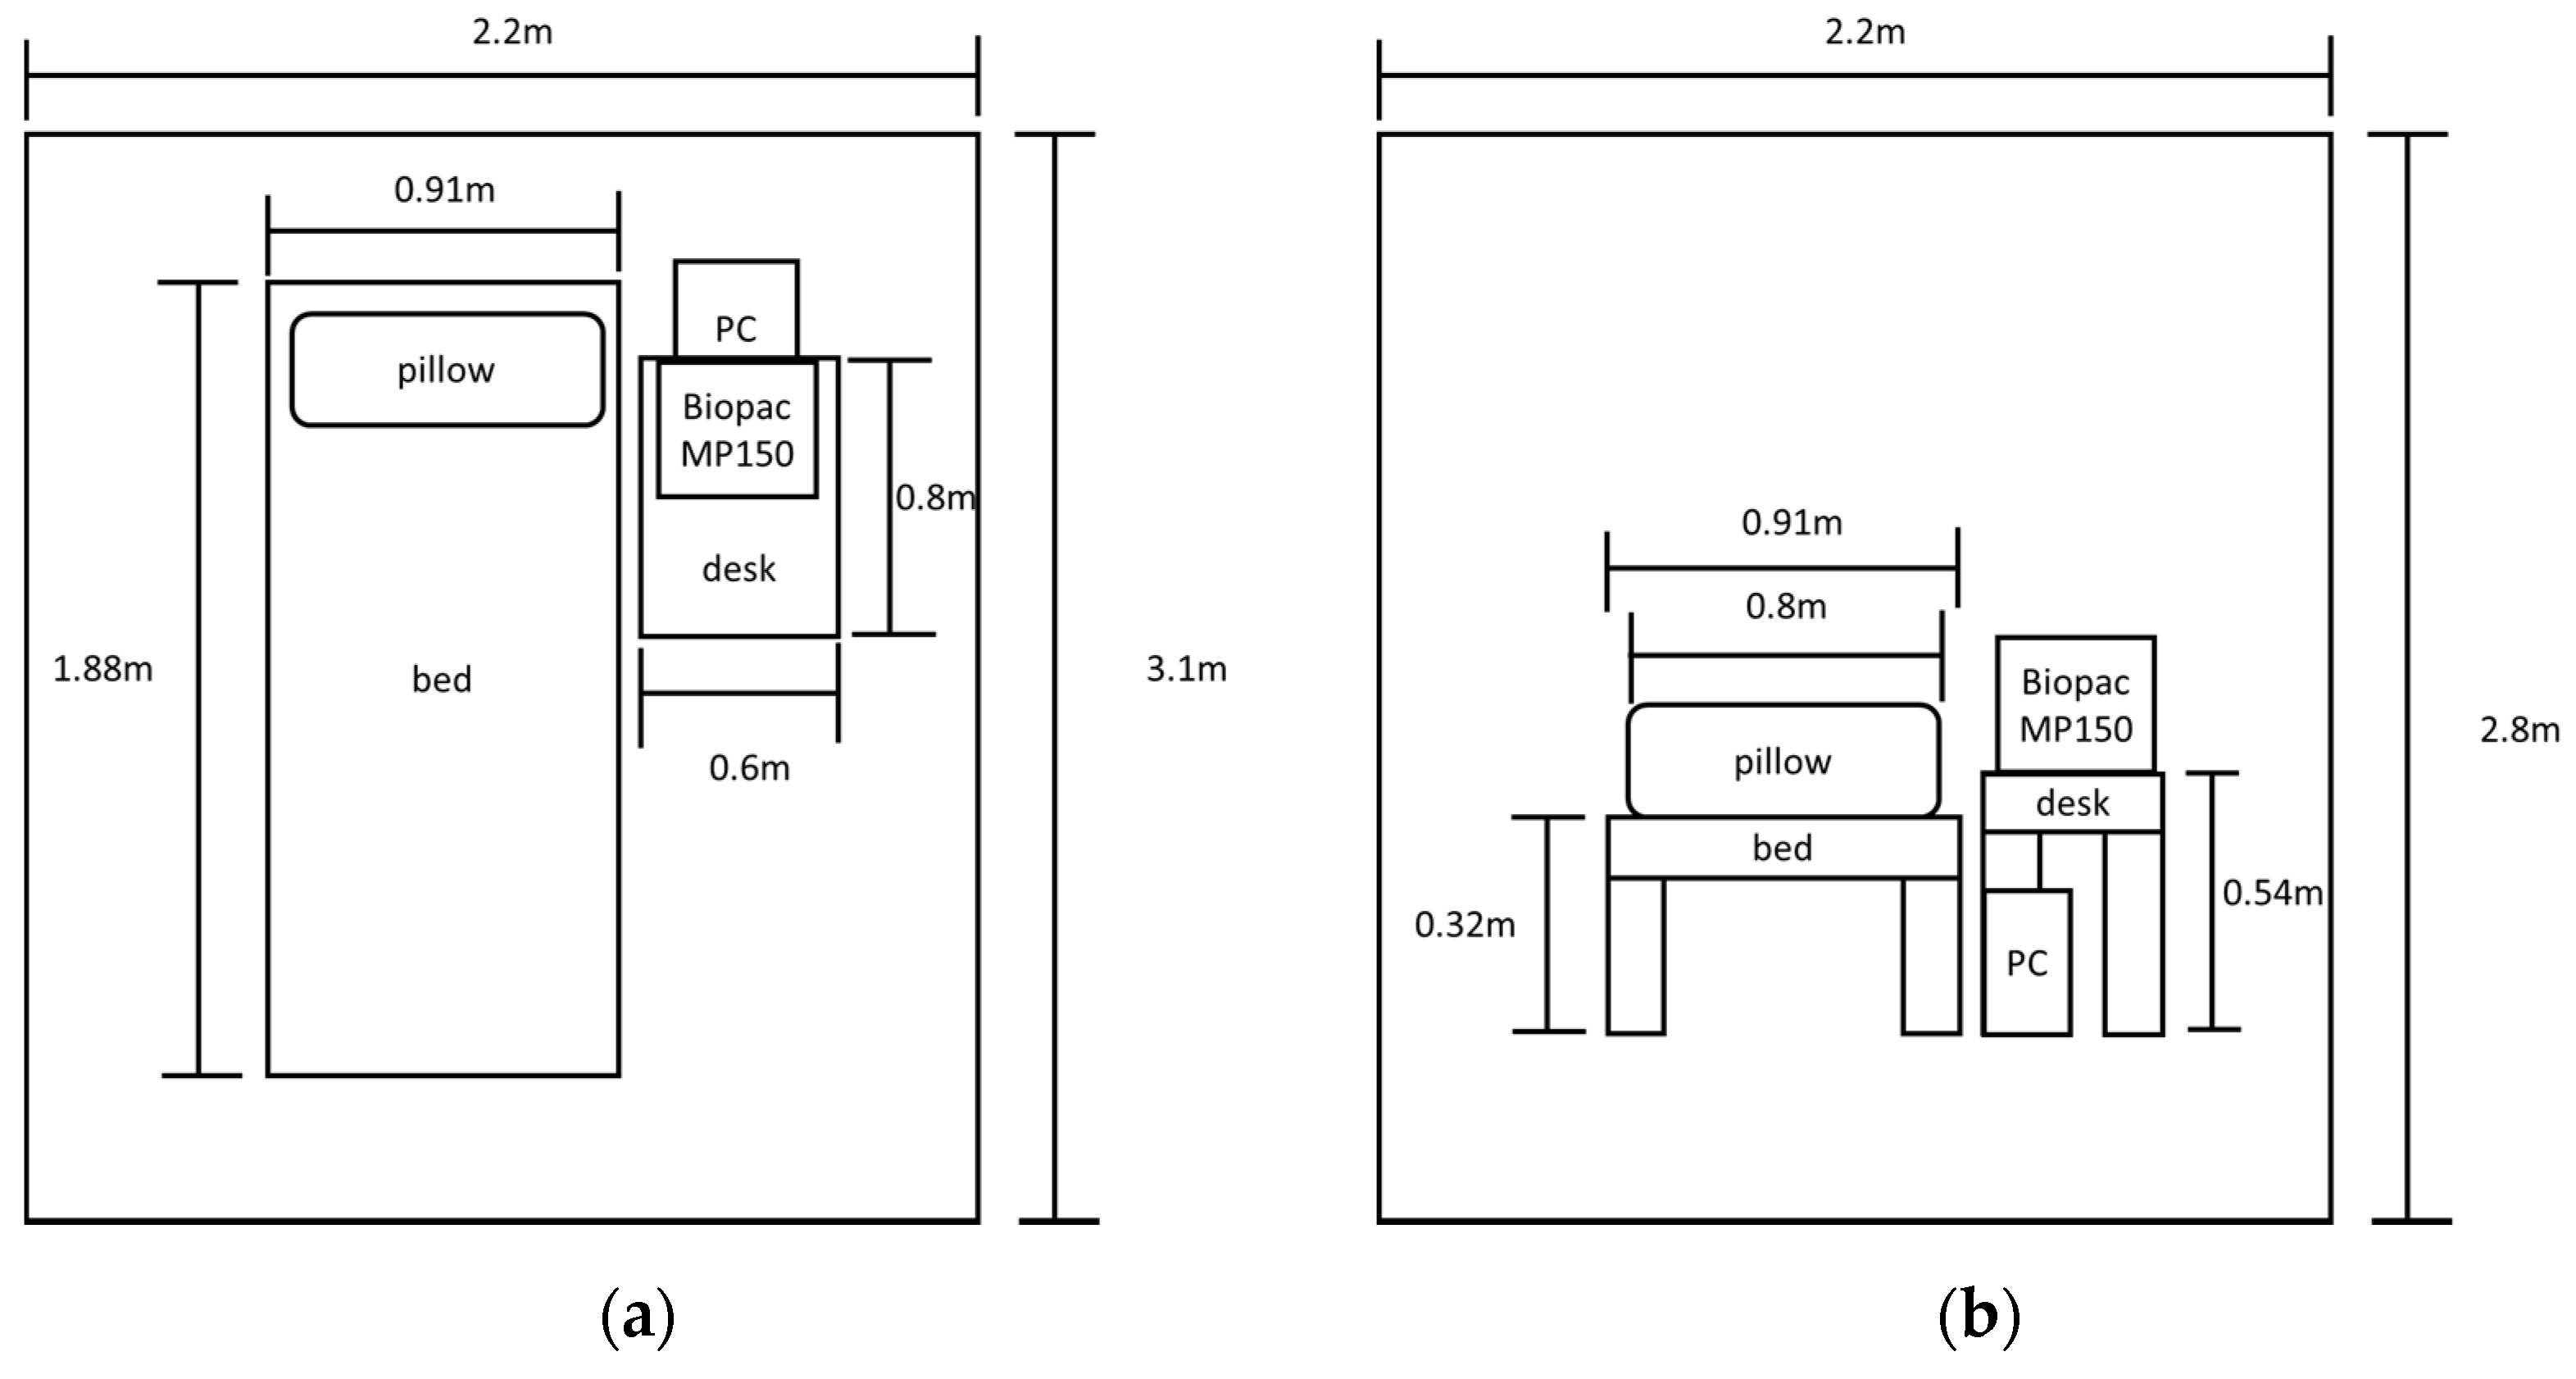
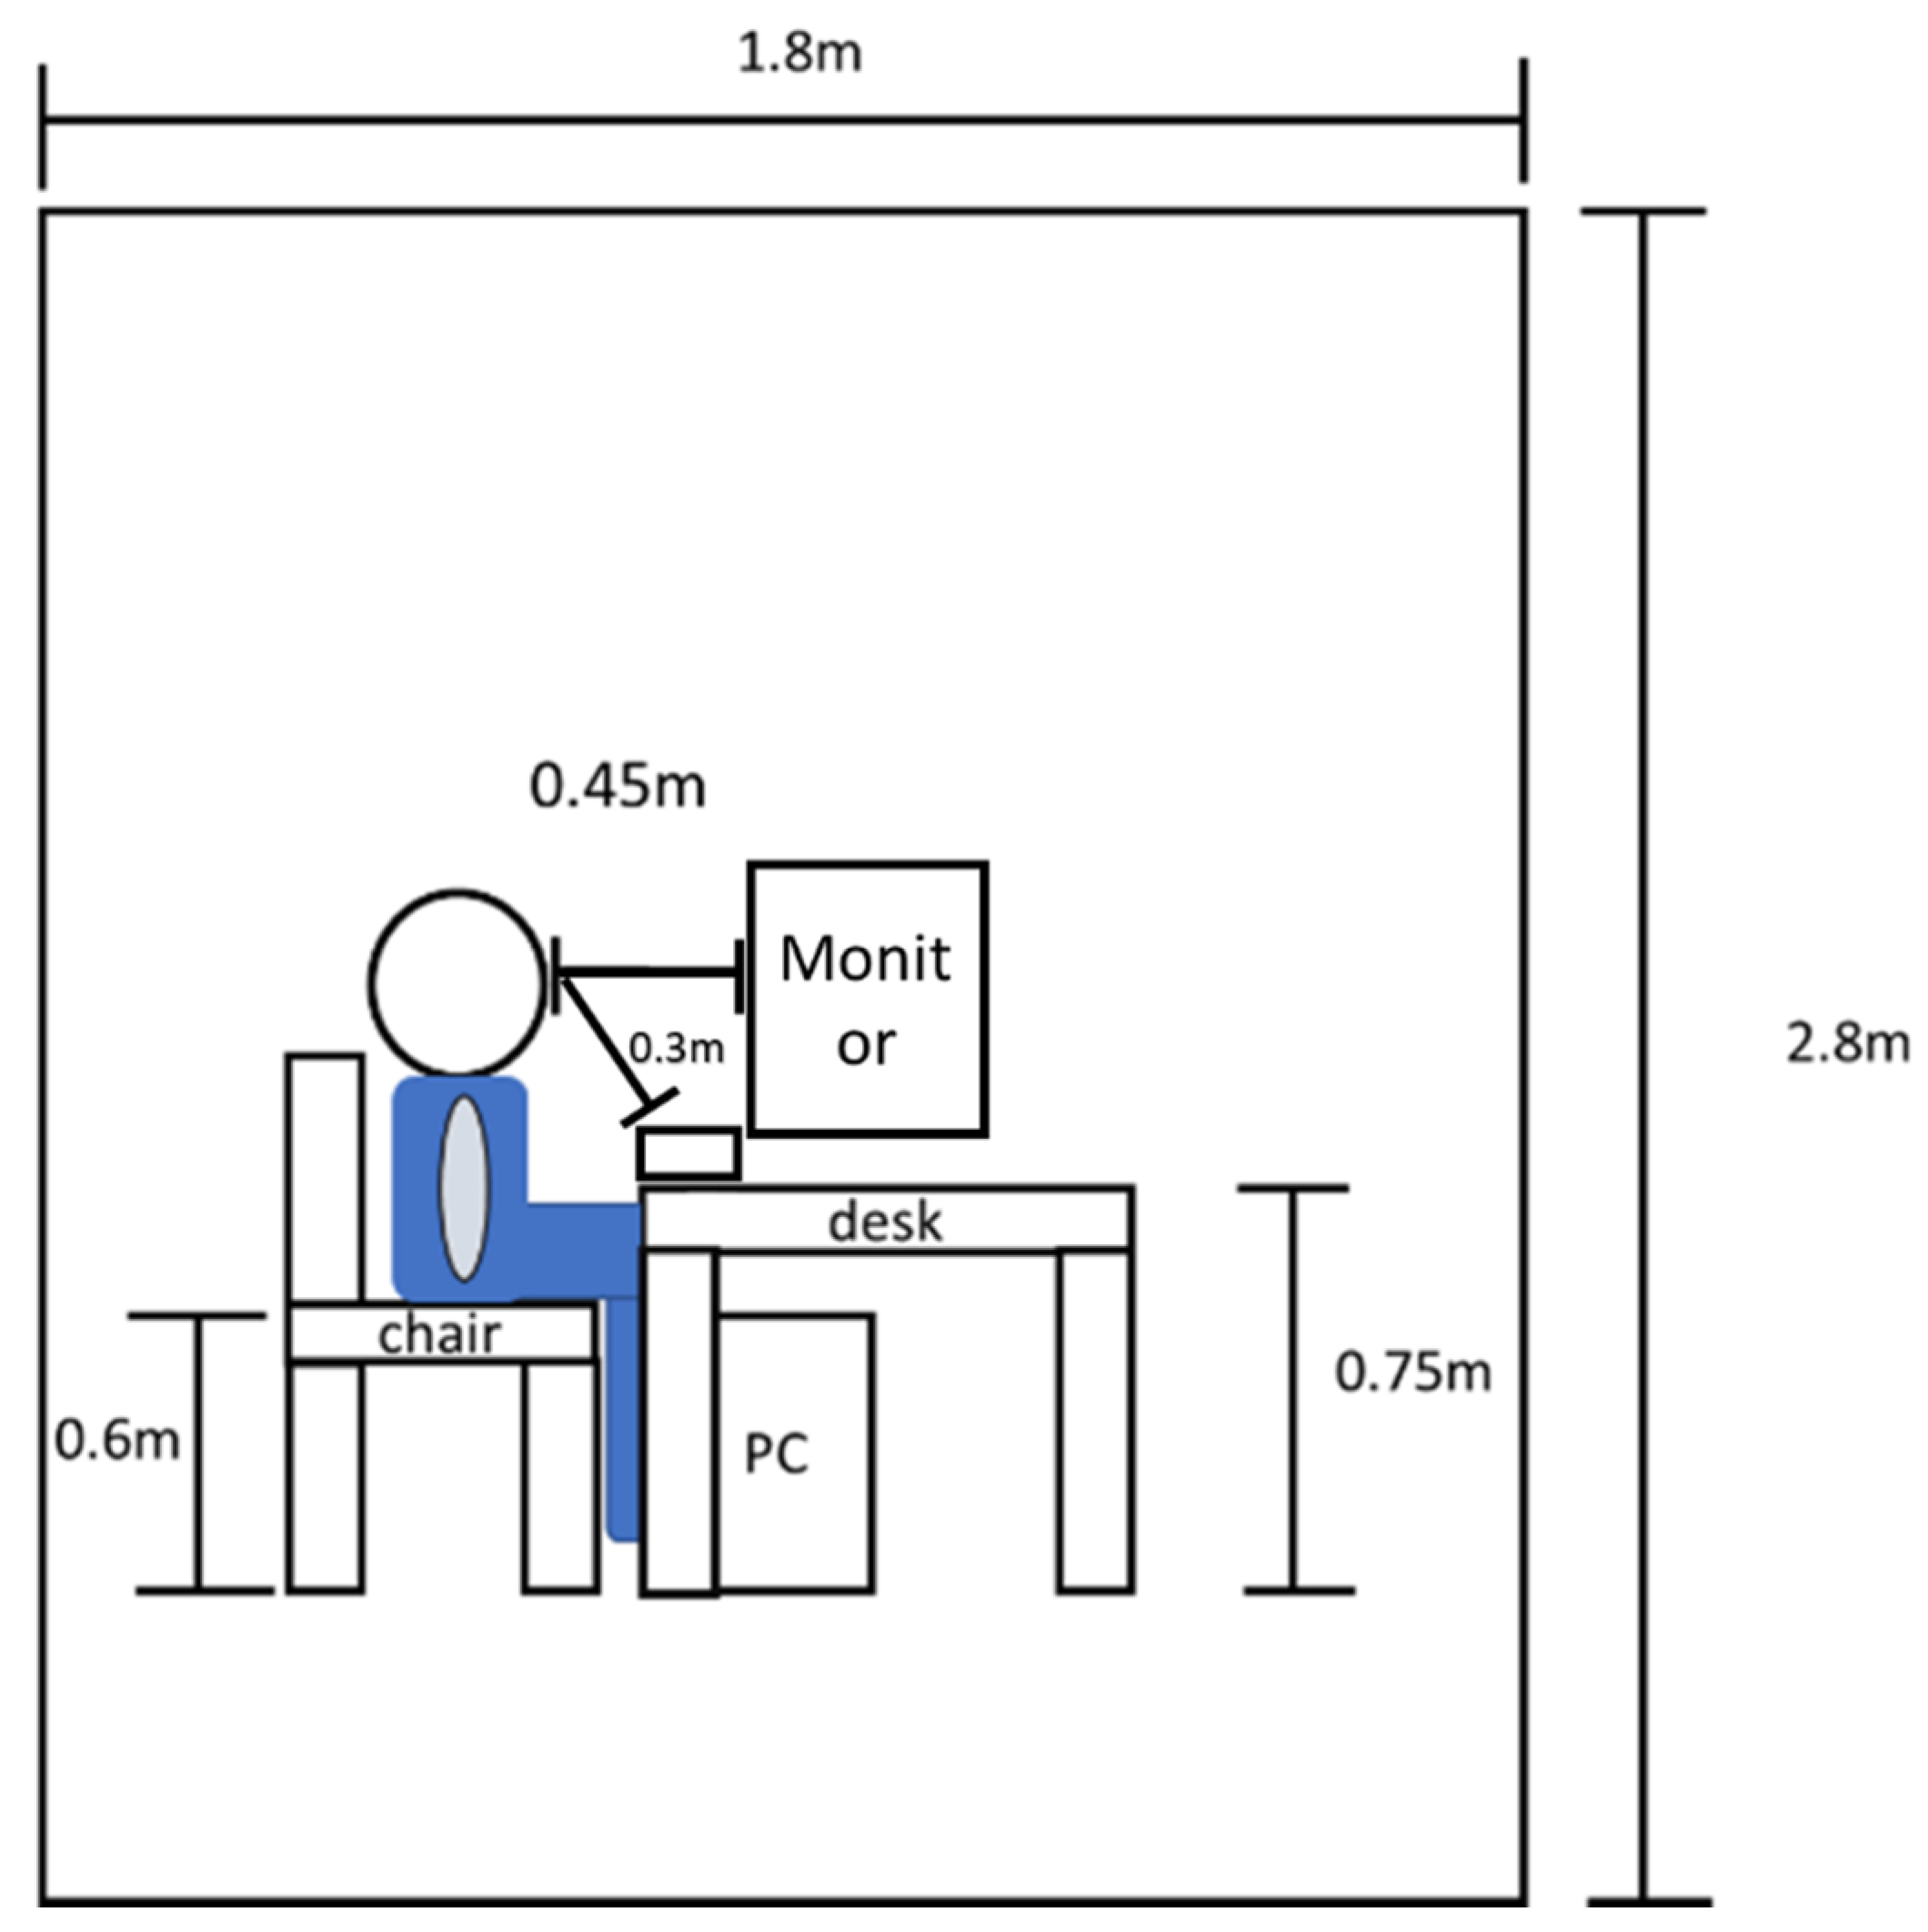
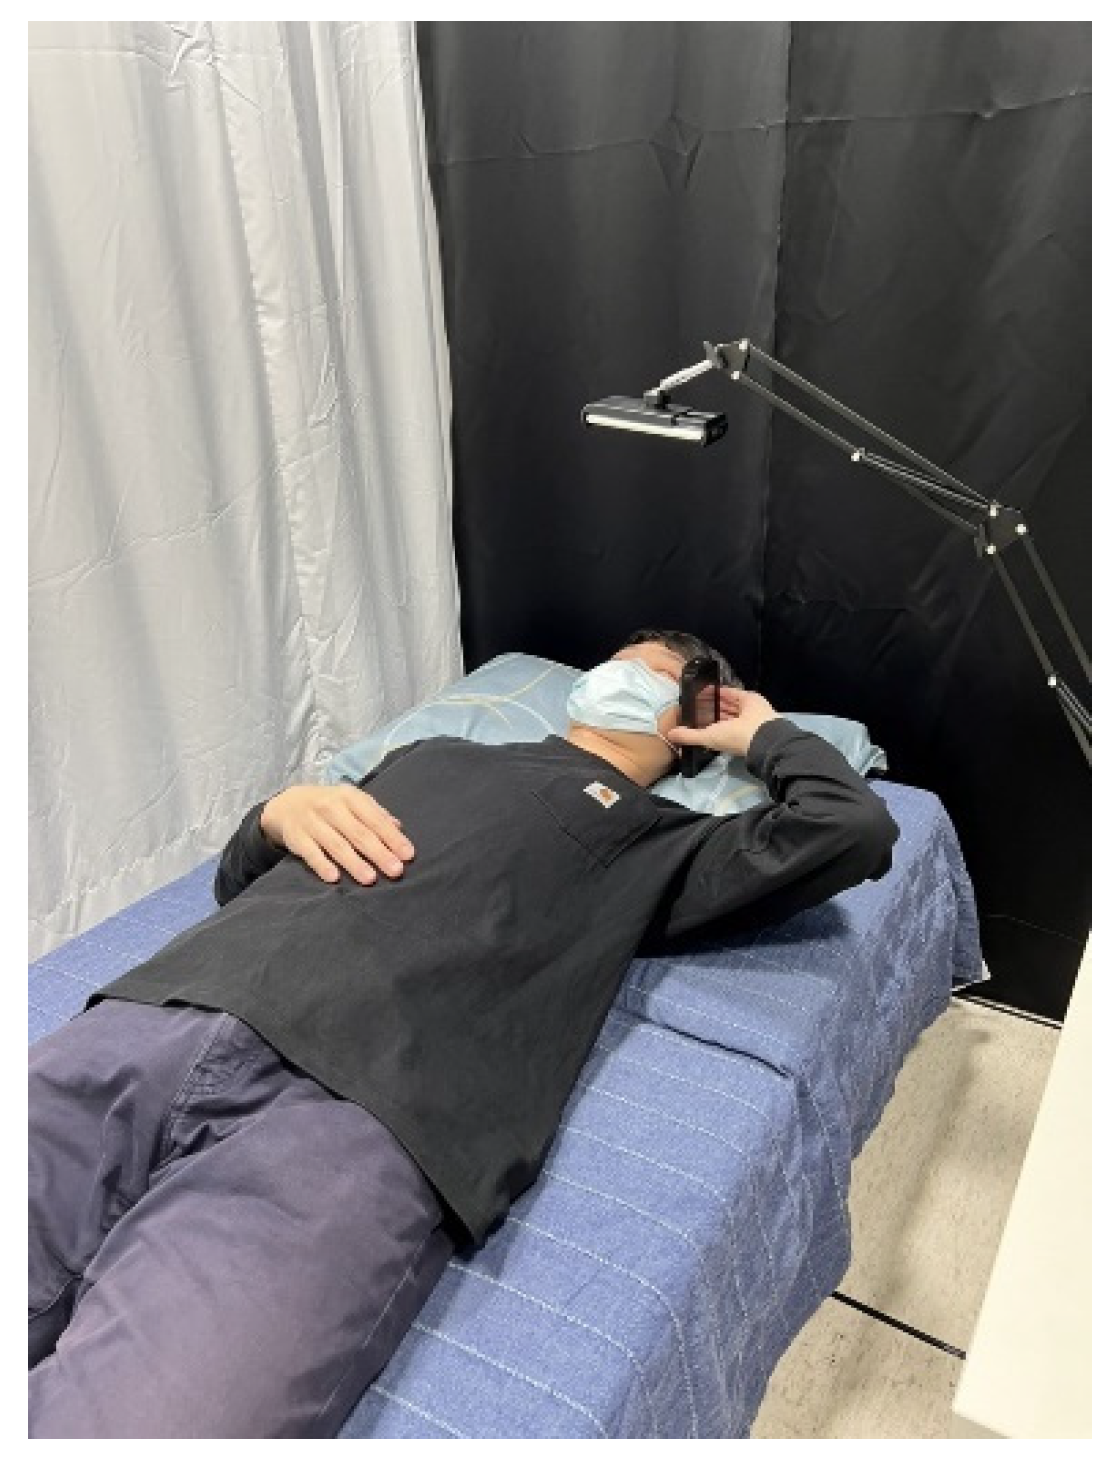
2.1. Experiemental Environment

In this study, we provided an office experimental environment for typing tests and a sleeping space for sleeping experiments, The sleeping environment was a dark room surrounded by black flannel without lighting equipment. The office environment included a computer, a 1.8 m × 0.6 m × 0.75 m desk, and the computer system was Windows10, as shown in Figure 1. In the sleeping space, a 1.8 m × 0.6 m bed was provided, and a Biopac MP150 was set beside the bed to collect the data of brain waves and electrocardiogram, as shown in Figure 2. The typing test environment and the physiological information collection equipment were carried out by different computers. The working environment configuration was the same as the sleeping environment. The distance between the subjects and the screen and keyboard was 0.45 m and 0.3 m, respectively, as shown in Figure 3.

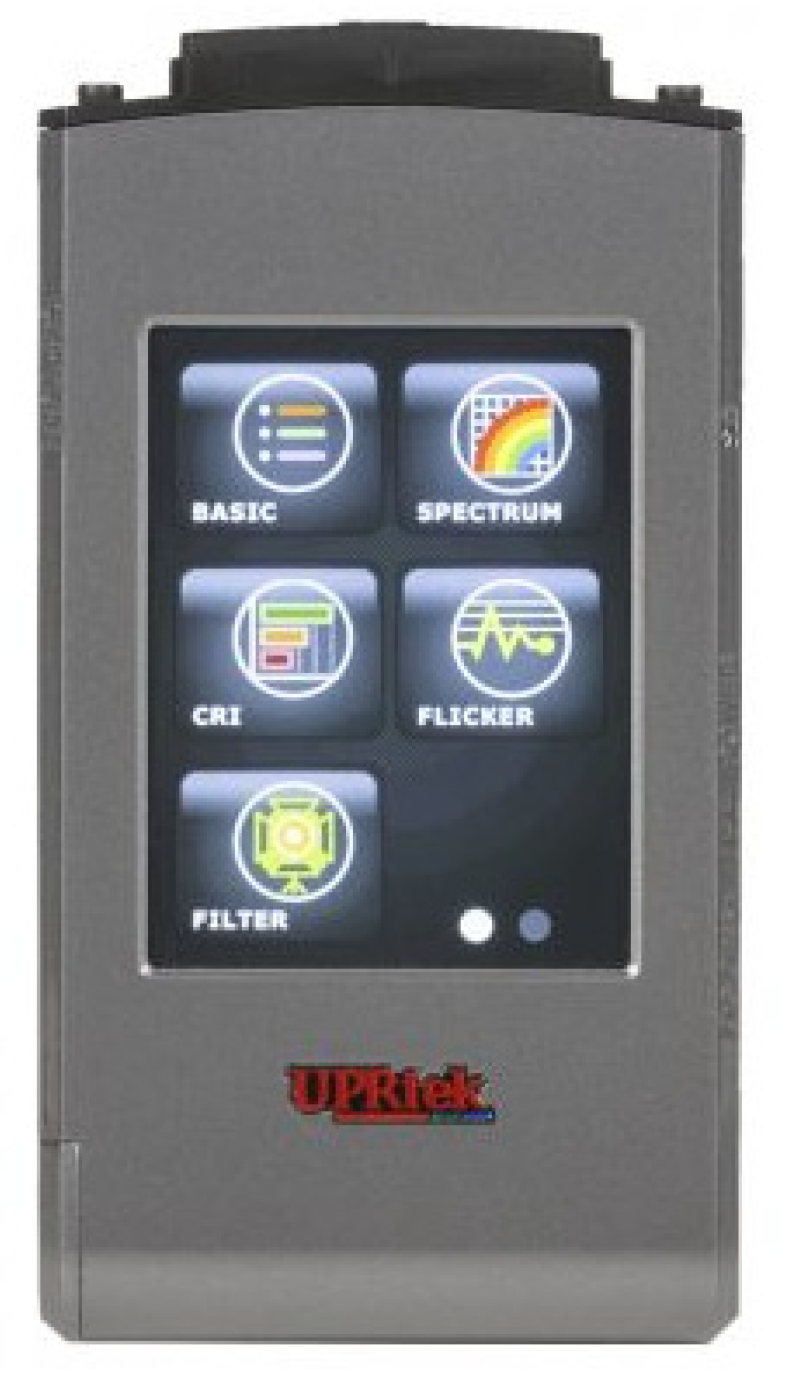
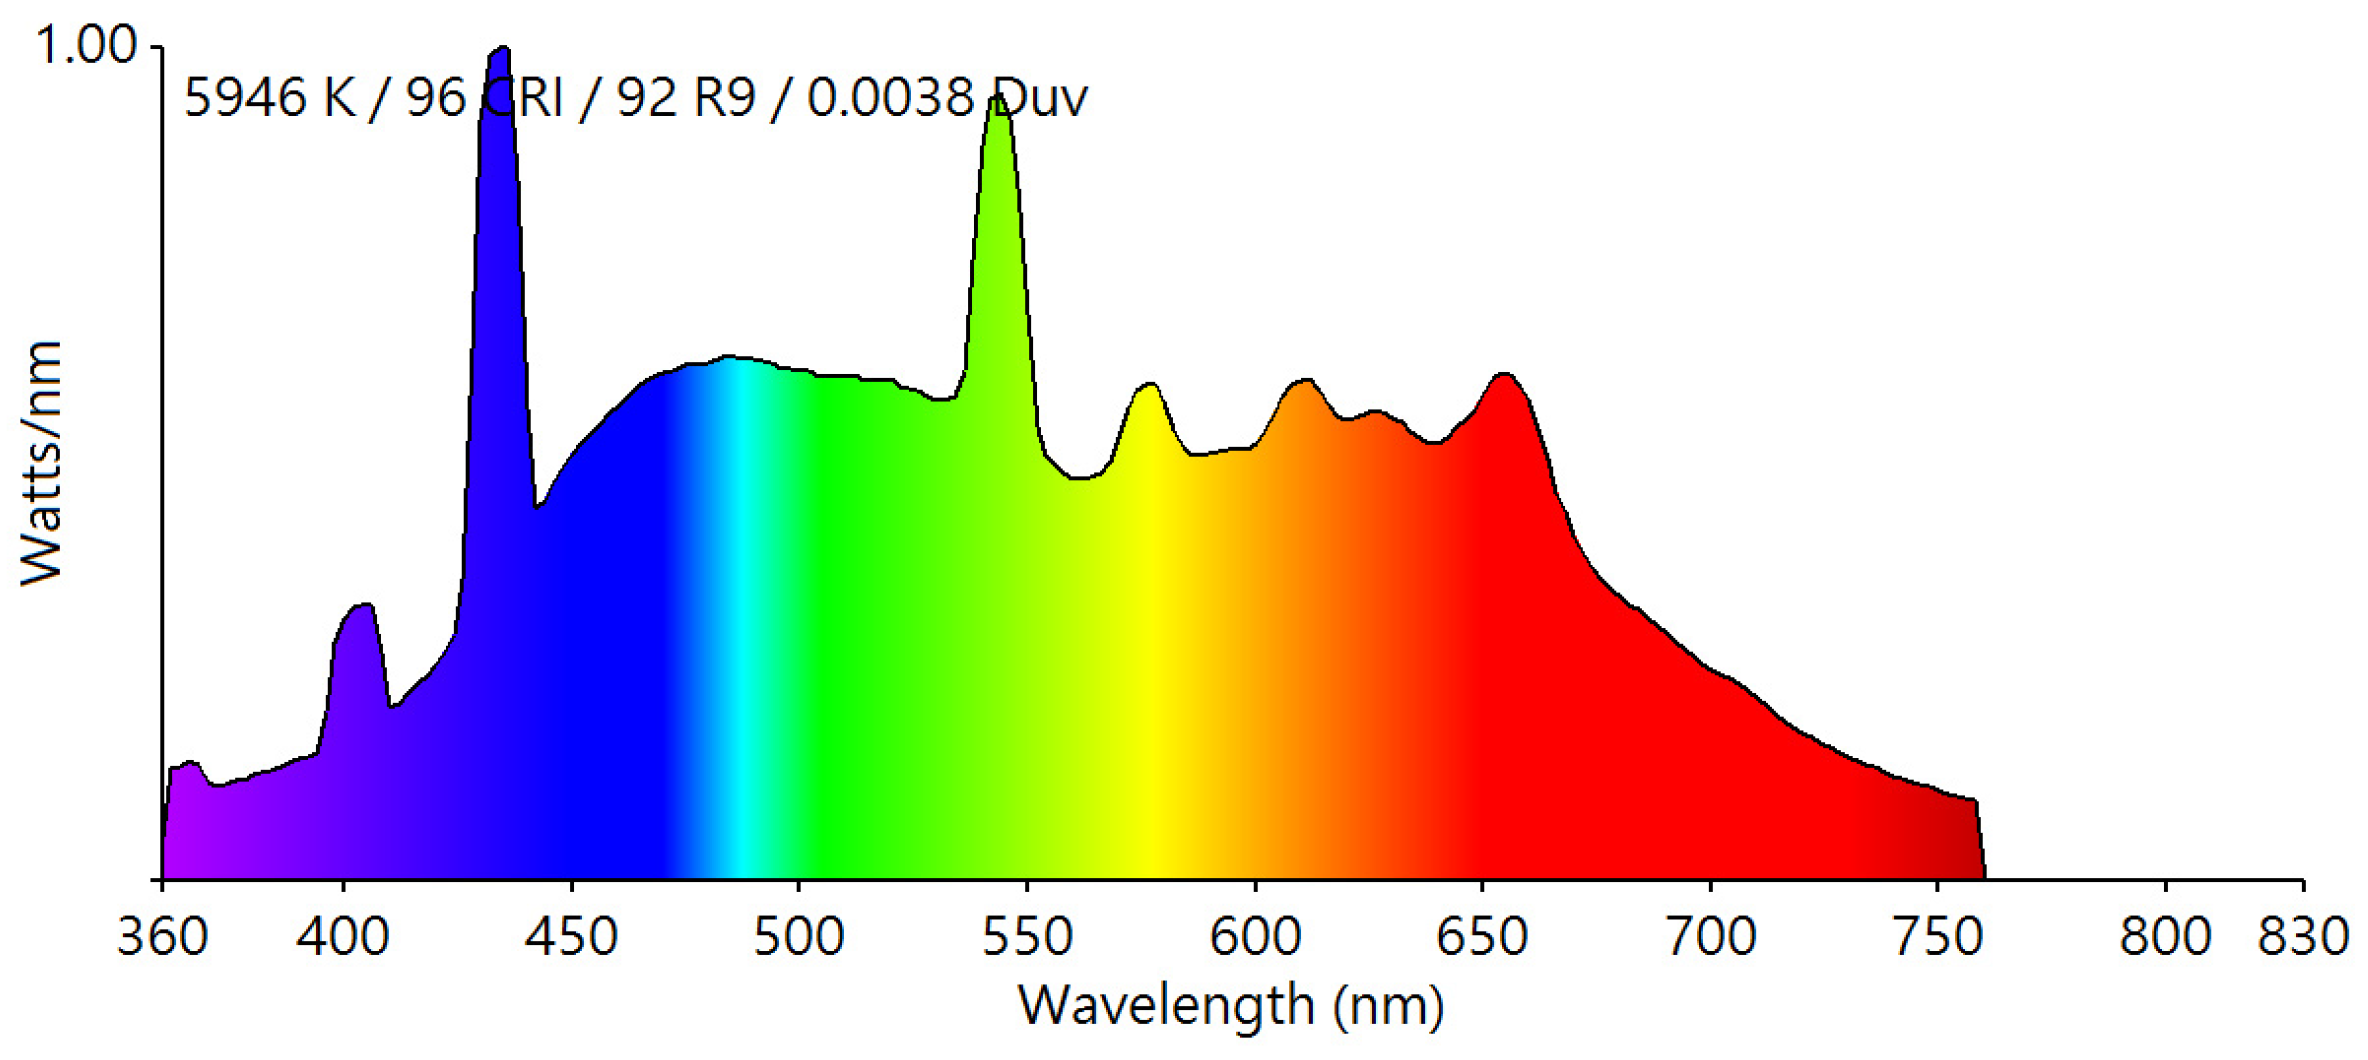
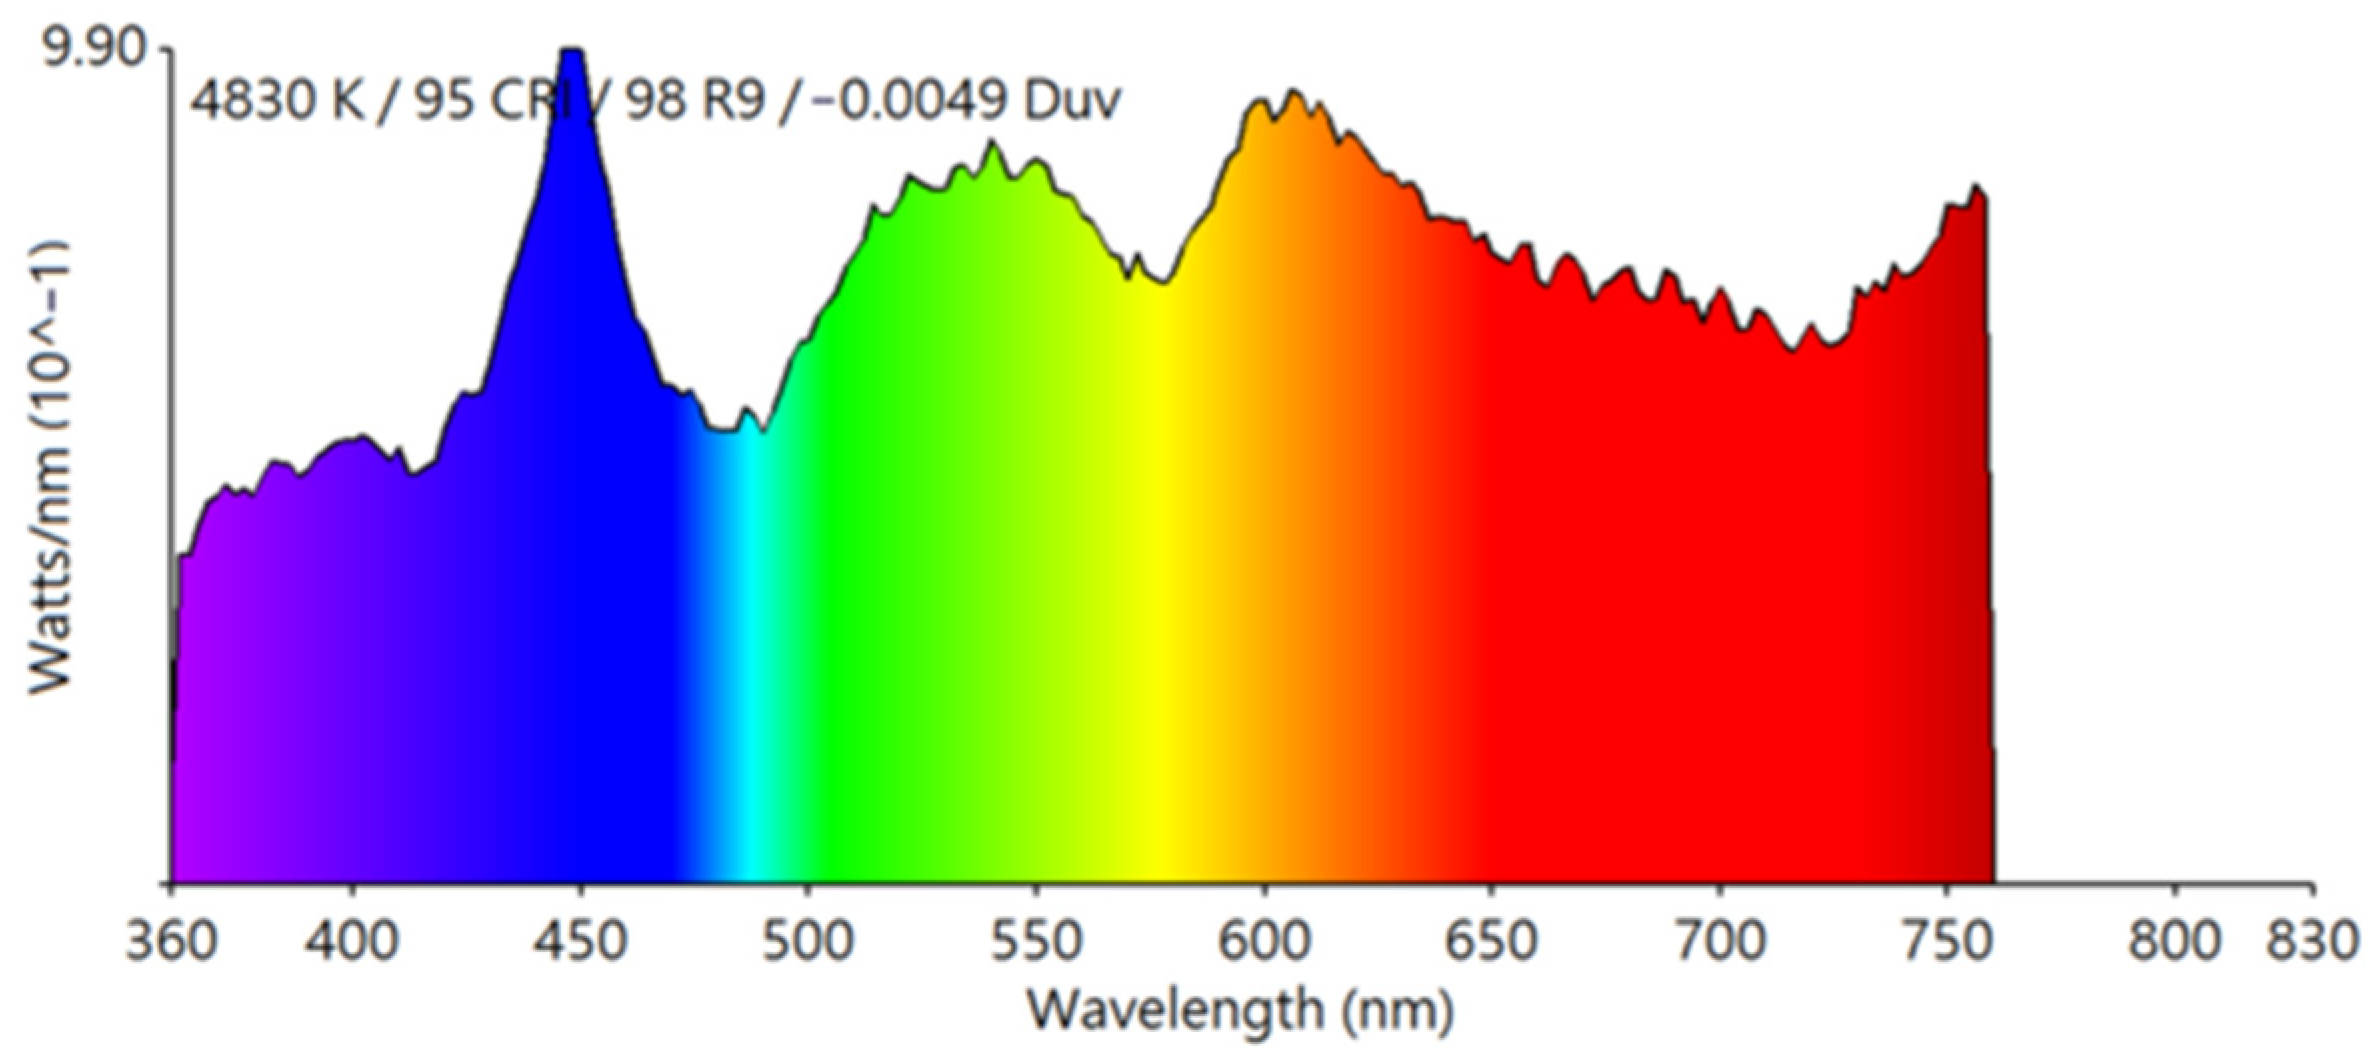
2.2. Experimental Equipment

The experimental equipment used in this study can be divided into three categories, namely: experimental light source measurement equipment, biological physiological characteristic information collection equipment, and computer software for the concentration test of subjects. The experimental light source measurement equipment was a MK350N PLUS handheld spectroscope produced by UPRtek, which is an LED measurement analyzer specially designed for LED manufacturers. Up to 40 measurement indexes are provided, such as CCT, CRI, CIE1931/1976, LUX, TLCI, etc., as shown in Figure 4. There were two kinds of equipment for collecting information on physiological characteristics, one is the MP150 produced by Biopac Student Lab in the United States and the wGT3X-BT wrist meter produced by ActiGraph, among which the MP150 produced by Biopac Student Lab has the function of multi-channel physiological recording. Physiological signals such as brain waves, electrocardiogram, electromyography, and electrooculogram can be captured and recorded in ACQKNOWLEDGE software, jointly developed by the equipment, which can be analyzed by the software itself or used by externally developed software, as shown in Figure 5. The wGT3X-BT wrist meter is a record for monitoring the physiological information such as movement threshold and turning over during the daily routine and sleep of the user, and is accompanied with ActiLife software developed by ActiGraph. It can also analyze and normalize information such as movement law and intensity when worn by the user, and can analyze the frequency of turning over and swinging during the sleep of the subject, as well as obtaining the results of its sleep cycle, latent time, and sleep efficiency, as shown in Figure 6. The computer software in the concentration test used TQC enterprise talent skill verification Chinese practice software, which can evaluate typing speed and error rate, and discover the average number of typed words and accuracy before and after sleeping, so as to analyze work efficiency and concentration, as shown in Figure 7.
The monitor used for the typing test in this study was ASUS VE247H display (23.6 inch, FHD, Panel Backlight: LED, Brightness: 300 cd/m2). The indoor ambient light spectrum of its typing test is shown in Figure 8. The light source emitted by the display reaches a peak value of corneal illumination measurement of 11 lux, and the frequency spectrum was measured in a dark room, as shown in Figure 9, according to the standard of ITU-R BT.500-13 [30].
In the smart mobile device used in the research equipment, the iPhone X with ios system with a high compatibility of universal version development was selected as the research and experimental light source design, and the backlight color control was implemented by installing the Macbook Pro 13-inch version of Xcode 12.5 and writing swift code for APP development. First, the APP controlled the output of each solid color of the backlight device to the maximum illumination, and then measured it by the UPRtek MK350N PLUS handheld spectrometer. In the measurement process, the panel of the smart mobile device was divided into 9 blocks, and each block was measured 3 times; the results of the 3 measurements were then averaged to obtain the accurate parameters of this block, so as to reduce errors in calculation, as shown in Figure 10. The measured backlight spectrum results are shown in Figure 11. Meanwhile, the color temperatures from 1900 K to 3800 K, correlated for the experimental light source, were adjusted in illuminance in the frequency spectra of 1900 K and 3800 K; the frequency spectra of 1900 K and 3800 k are shown in Figure 12.

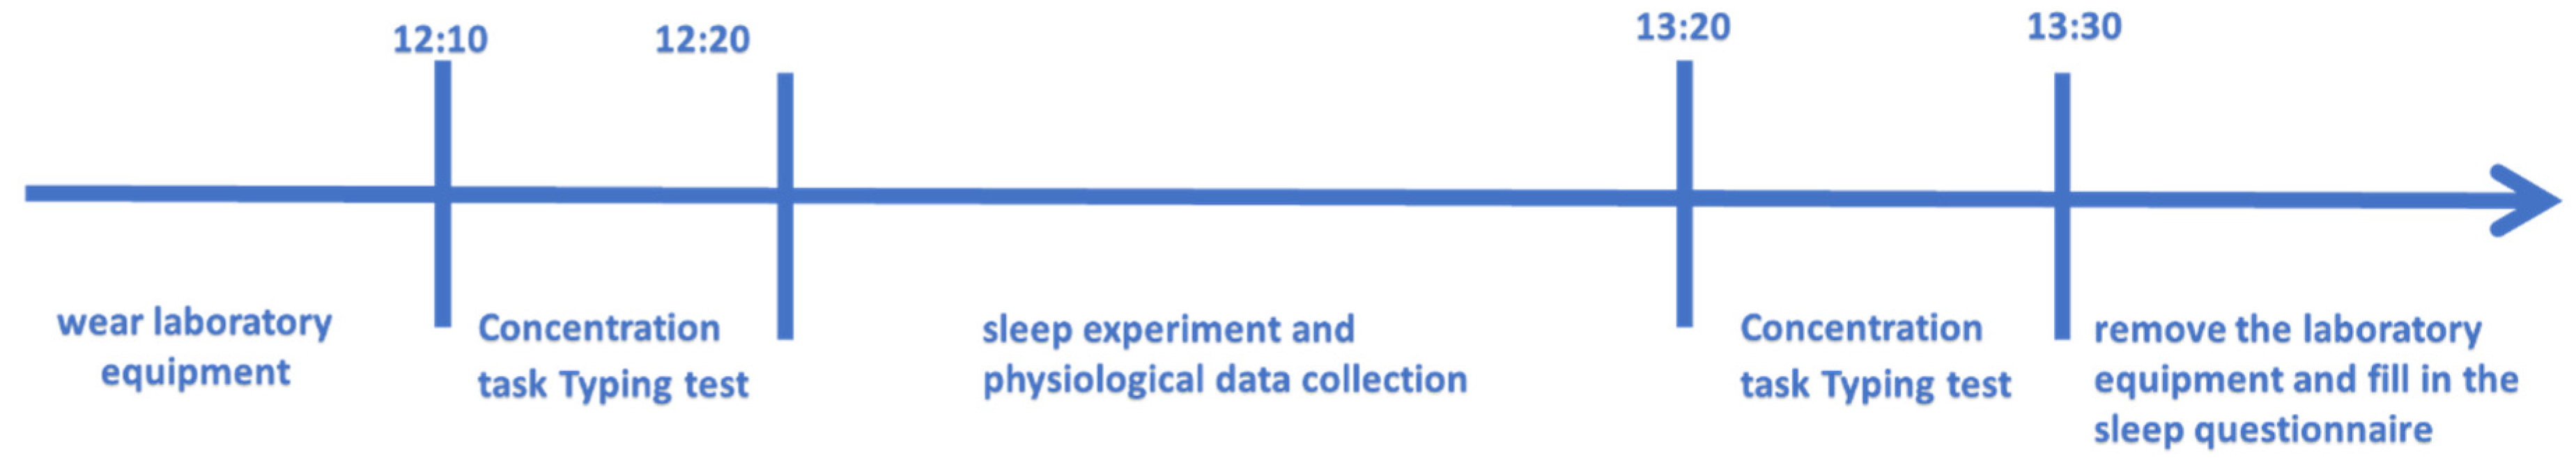
2.3. Experiment Process

Because the purpose of this study is to evaluate the effect of generating dynamic sleep assist light in smart mobile devices without considering the influence of blue light on sleep in metamerism, the experimental method was the same as that of previous dynamic sleep assist lamps in most experimental controls.
This study was divided into three sections, and each section had three parts, as shown in Figure 13. The first and third parts were tests of work efficiency, and the second part was the sleep experiment. At the end of the sleep experiment, a self-evaluation questionnaire was filled out, then all subjects slept in a dark environment in sequence, then in a dynamic light environment, and finally in a fixed color temperature 1900 K environment The work efficiency test takes common clerical work in the office as the experimental test method and adopts TQC Chinese typing verification practice software for typing tasks, and the test time of typing tasks was 10 min.
The sleep test lasted for 1 h, and the sleep experimental light source came from an iPhone X, in which the backlight module unit is controlled. In each experiment, three different test light sources were respectively emitted, which were no light (dark), dynamic light, and fixed color temperature of 1900 K. The dark environment is an environment in which the backlight was turned off. In the dynamic light environment, we controlled the backlight module to set it at a fixed illumination of 5 lux, and the fixed color temperature was initially set at 1900 K and increased by 50 K every 0.5 s until 3800 K was maintained for 30 s, and then decreased by 50 K every 0.5 s until 1900 K was maintained for 60 s as a cycle. The effect of its dynamic light environment on melatonin is shown in Table 1. In the fixed color temperature of 1900 K environment, the light had a fixed illumination of 5 Lux and a color temperature of 1900 K, as shown in Figure 14.
The subjective questionnaire scale of the experiment is shown in Table 2. ‘I think the space is comfortable’ indicates that subject’s feelings about the environment and the comfort of the bed: very uncomfortable 1 point to very comfortable 5 points. ‘The space is too bright to fall asleep’: the subject cannot feel the light for 1 point, and can fully feel the light for 5 points. ‘I can sleep better in the experiment’: poor sleep indicated by 1 point and good sleep by 5 points. ‘I feel refresh after I wake up’: the subject’s mood is bad, 1 point, or is good, 5 points. ‘I hope I can continue to sleep’: the subject wishes to stop sleeping for 1 point, or wishes to continue sleeping for 5 point.
Before the start of each experiment, the researchers set up a smart mobile device rack at the edge of the bed around the sleeping environment, placed the phone on the phone rack, and then adjusted it. Each time, according to the control of illuminance, researchers reconfirmed before entering the sleeping experiment, referring to the data on human head circumference in the anthropometric database of the Ministry of Labor of Taiwan Province, the illuminance of the smart mobile device to the human eye is measured to be 5 Lux [31], the measurement method is shown in Figure 15.
Table 1. Dynamic color temperature affects the measurement results of melatonin. The spectrum is calculated by the CIE 2020 S 026 2020 tool library and its alpha-opic irradiance results [32].
Color TemperatureS-Cone-OpicM-Cone-OpicL-Cone-OpicRhodopicMelanopic
1900 K0.000.010.010.000.00
1950 K0.000.000.010.000.00
2000 K0.000.000.010.000.00
2050 K0.000.010.010.000.00
2100 K0.000.010.010.000.00
2150 K0.000.010.010.000.00
2200 K0.000.010.010.000.00
2250 K0.000.010.010.000.00
2300 K0.000.010.010.000.00
2350 K0.000.010.010.000.00
2400 K0.000.010.010.000.00
2450 K0.000.010.010.000.00
2500 K0.000.010.010.000.00
2550 K0.000.010.010.000.00
2600 K0.000.010.010.010.00
2750 K0.000.010.010.010.00
2800 K0.000.010.010.010.00
2950 K0.000.010.010.010.00
3000 K0.000.010.010.010.00
3050 K0.000.010.010.010.00
3100 K0.000.010.010.010.00
3150 K0.000.010.010.010.00
3200 K0.000.010.010.010.00
3250 K0.000.010.010.010.01
3300 K0.000.010.010.010.01
3350 K0.000.010.010.010.01
3400 K0.000.010.010.010.01
3450 K0.000.010.010.010.01
3500 K0.000.010.010.010.01
3550 K0.000.010.010.010.01
3600 K0.000.010.010.010.01
3650 K0.000.010.010.010.01
3700 K0.000.010.010.010.01
3750 K0.000.010.010.010.01
3800 K0.000.010.010.010.01
Table 2. Subjective questionnaire.
ItemScore
I think the space is comfortable. 123456
The space is too bright to fall asleep.123456
I can sleep better in the experiment. 123456
I feel refresh after I wake up.123456
I hope I can continue to sleep.123456

2.4. Experimental Subjects

This study recruited 30 subjects, consisting of 22 office workers (8 males and 14 females) and 8 students (8 males). The average age was 30.33 years, the standard deviation was 6.98 years, and the age ranged from 24 to 50 years. The subjects had known the specific content of the experiment before participating, and were instructed to go to the designated place to receive the actigraphy and wear it one day before the experiment. They were reminded of the content of the experiment and had to sleep for 6–8 h at night before the experiment. On the day before the experiment, the subjects were not allowed to drink coffee, tea, and other caffeinated drinks and foods. In addition, the experimental subjects recruited in this study are non-color blind and blind people without visual defects.

2.5. Analytical Method

In this study, SPSS 22.0 was used for the statistical analysis of brain wave intensity and heart rate variability. In the analysis, we first checked whether the normal distribution and homogeneity test pass the standard, and then used paired t-test [33,34] and ANOVA [35,36] to confirm whether there are statistical differences in sleep in different environments. (p < 0.05). When the normal distribution and homogeneity test failed the standard, we used Kruskal–Wallis motherless analysis to see if there was a statistical difference in the average of different sleep ratings.

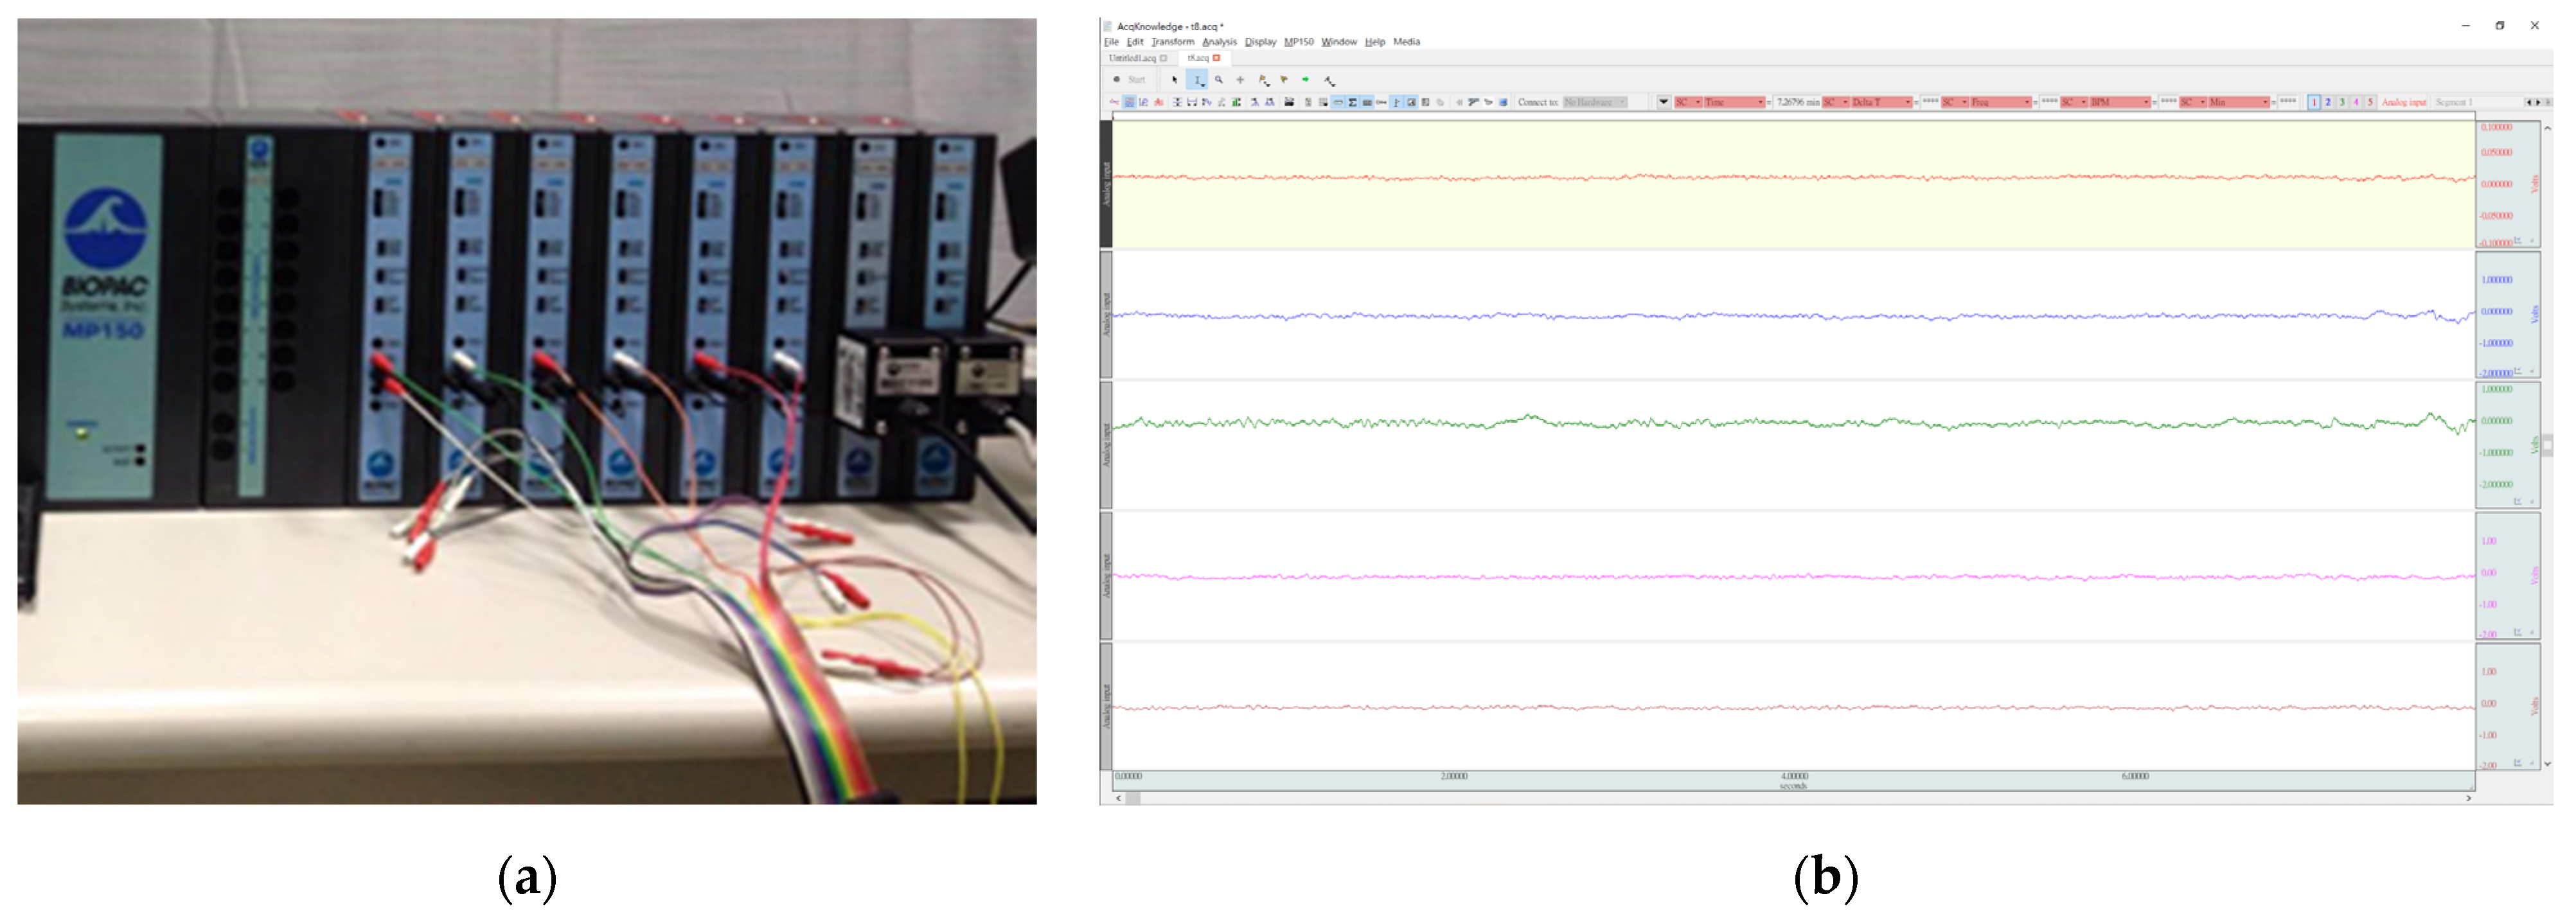
2.5.1. Brain Wave Analysis

The Biopac MP-150 equipment was connected with the EEG signal amplifier and brain wave cap, and the cap was worn on the head of the subject, capturing the EEG signal of the subject. By analyzing the collected brain electrical signals, we can distinguish the time and amplitude of different brain electrical signals. The common brain electrical signals can be divided into four types: β, α, θ and δ. When you go to sleep, the brain wave β appears first, which represents the clearest focus; then the α wave, which represents relaxation; and finally the δ wave, which represents deep sleep [37]. Sleep can be divided into rapid eye movement (REM) and non-rapid eye movement (NREM). Sleep in non-rapid eye movement can be divided into three stages. Generally, in the absence of insomnia, you will enter the first stage of sleep (NREM1 or N1) within about 10 min, which is a stage between waking and sleeping. When we lie in bed, close our eyes, relax, and get ready to fall asleep, although our consciousness is still clear, our body has entered a relaxed state, and the brain wave pattern presented on EEG is α wave (8–13 Hz). Second-stage sleep (NREM2 or N2) is really regarded as sleep at the beginning of this stage. At this time, the brain and body are more relaxed and gradually lose their response to the outside world. Brain waves emit two modes: sleep spindle and K-complex, and EEG is mainly θ wave (4–7 Hz). The third stage of sleep (NREM3 or N3) is called deep sleep, delta sleep, or slow-wave sleep, SWS), because the brain wave mode at this time belongs to delta wave (0.5~4 Hz), and the respiration, heartbeat, and blood pressure during deep sleep are all the lowest in the day, along with the blood flow and energy consumption of the brain [38].

2.5.2. ECG Analysis

Similarly, by connecting the subjects to a Biopac MP-150 and ECG amplifier, the measured PQRS wave of the heartbeat was analyzed, the information of R-R interval was extracted, fast Fourier analysis was carried out, and the heartbeat interval was converted into the spectrum of heart rate variability. The total power (TP) is the sum of the areas under the power spectrum density curve of 0.01~0.4 Hz. Low-frequency power (LFP) is the sum of areas under the power spectral density curve of 0.04~0.15 Hz, and high-frequency power (HFP) is the sum of areas under the power spectral density curve of 0.15~0.4 Hz. Normalized low-frequency power (nLFP) ((LFP/TP) × 100) is usually used to represent sympathetic nerve activity, and normalized high-frequency power (nHFP)((HPF/TP) × 100) is usually used to represent parasympathetic nerve activity. LFP/HFP usually represents the index of the sympathetic/parasympathetic nerve activity balance [39,40].

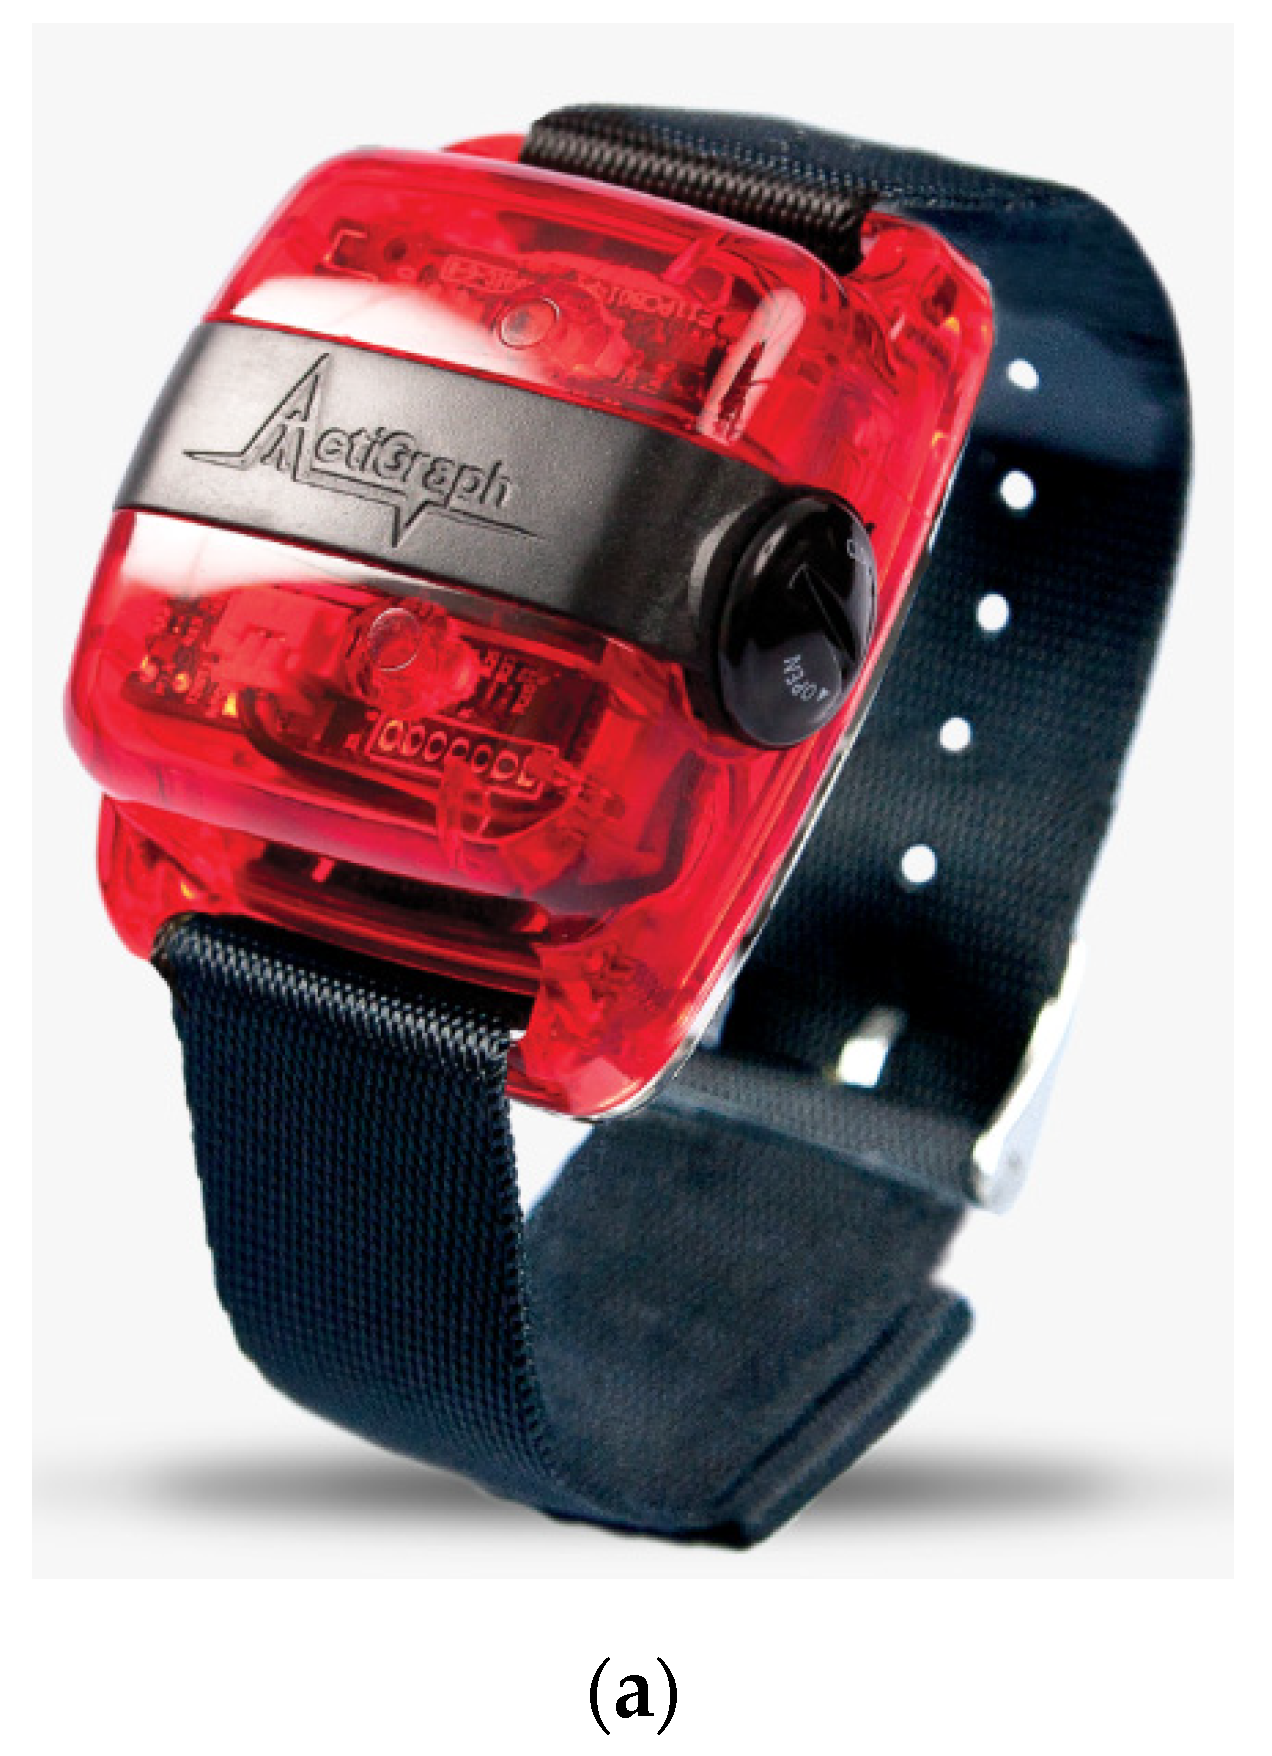
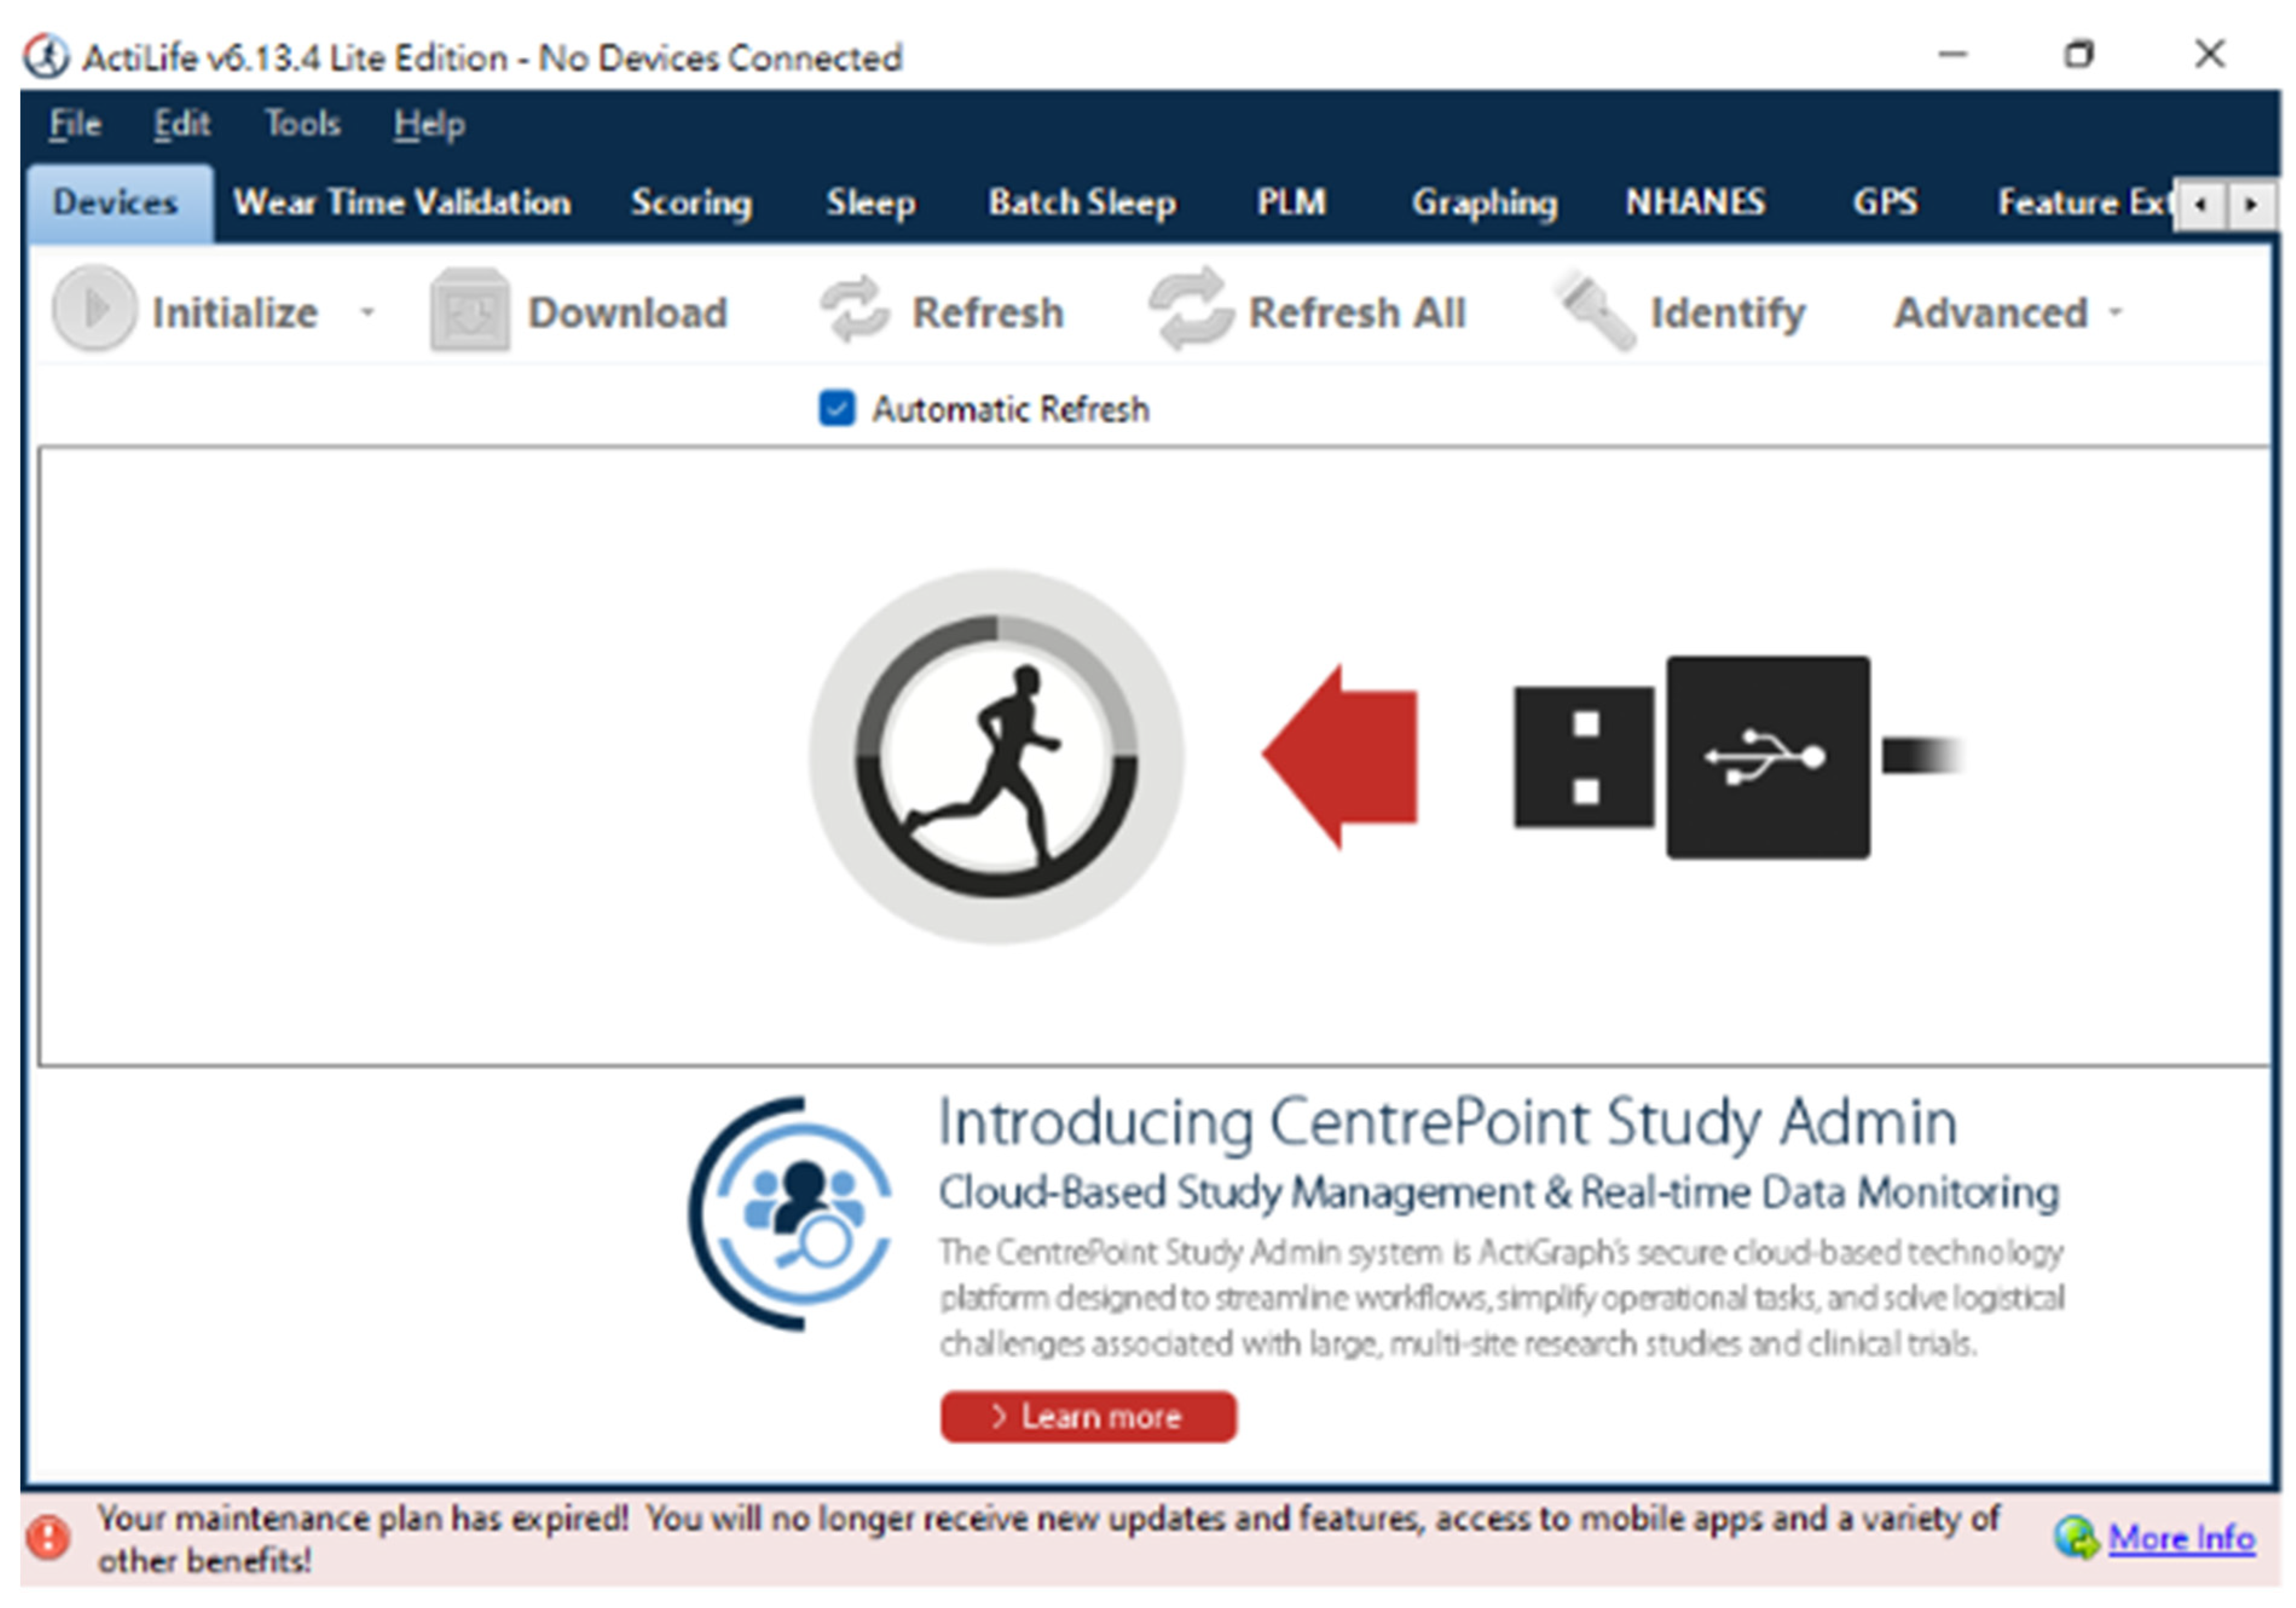
2.5.3. Sleep Bracelet
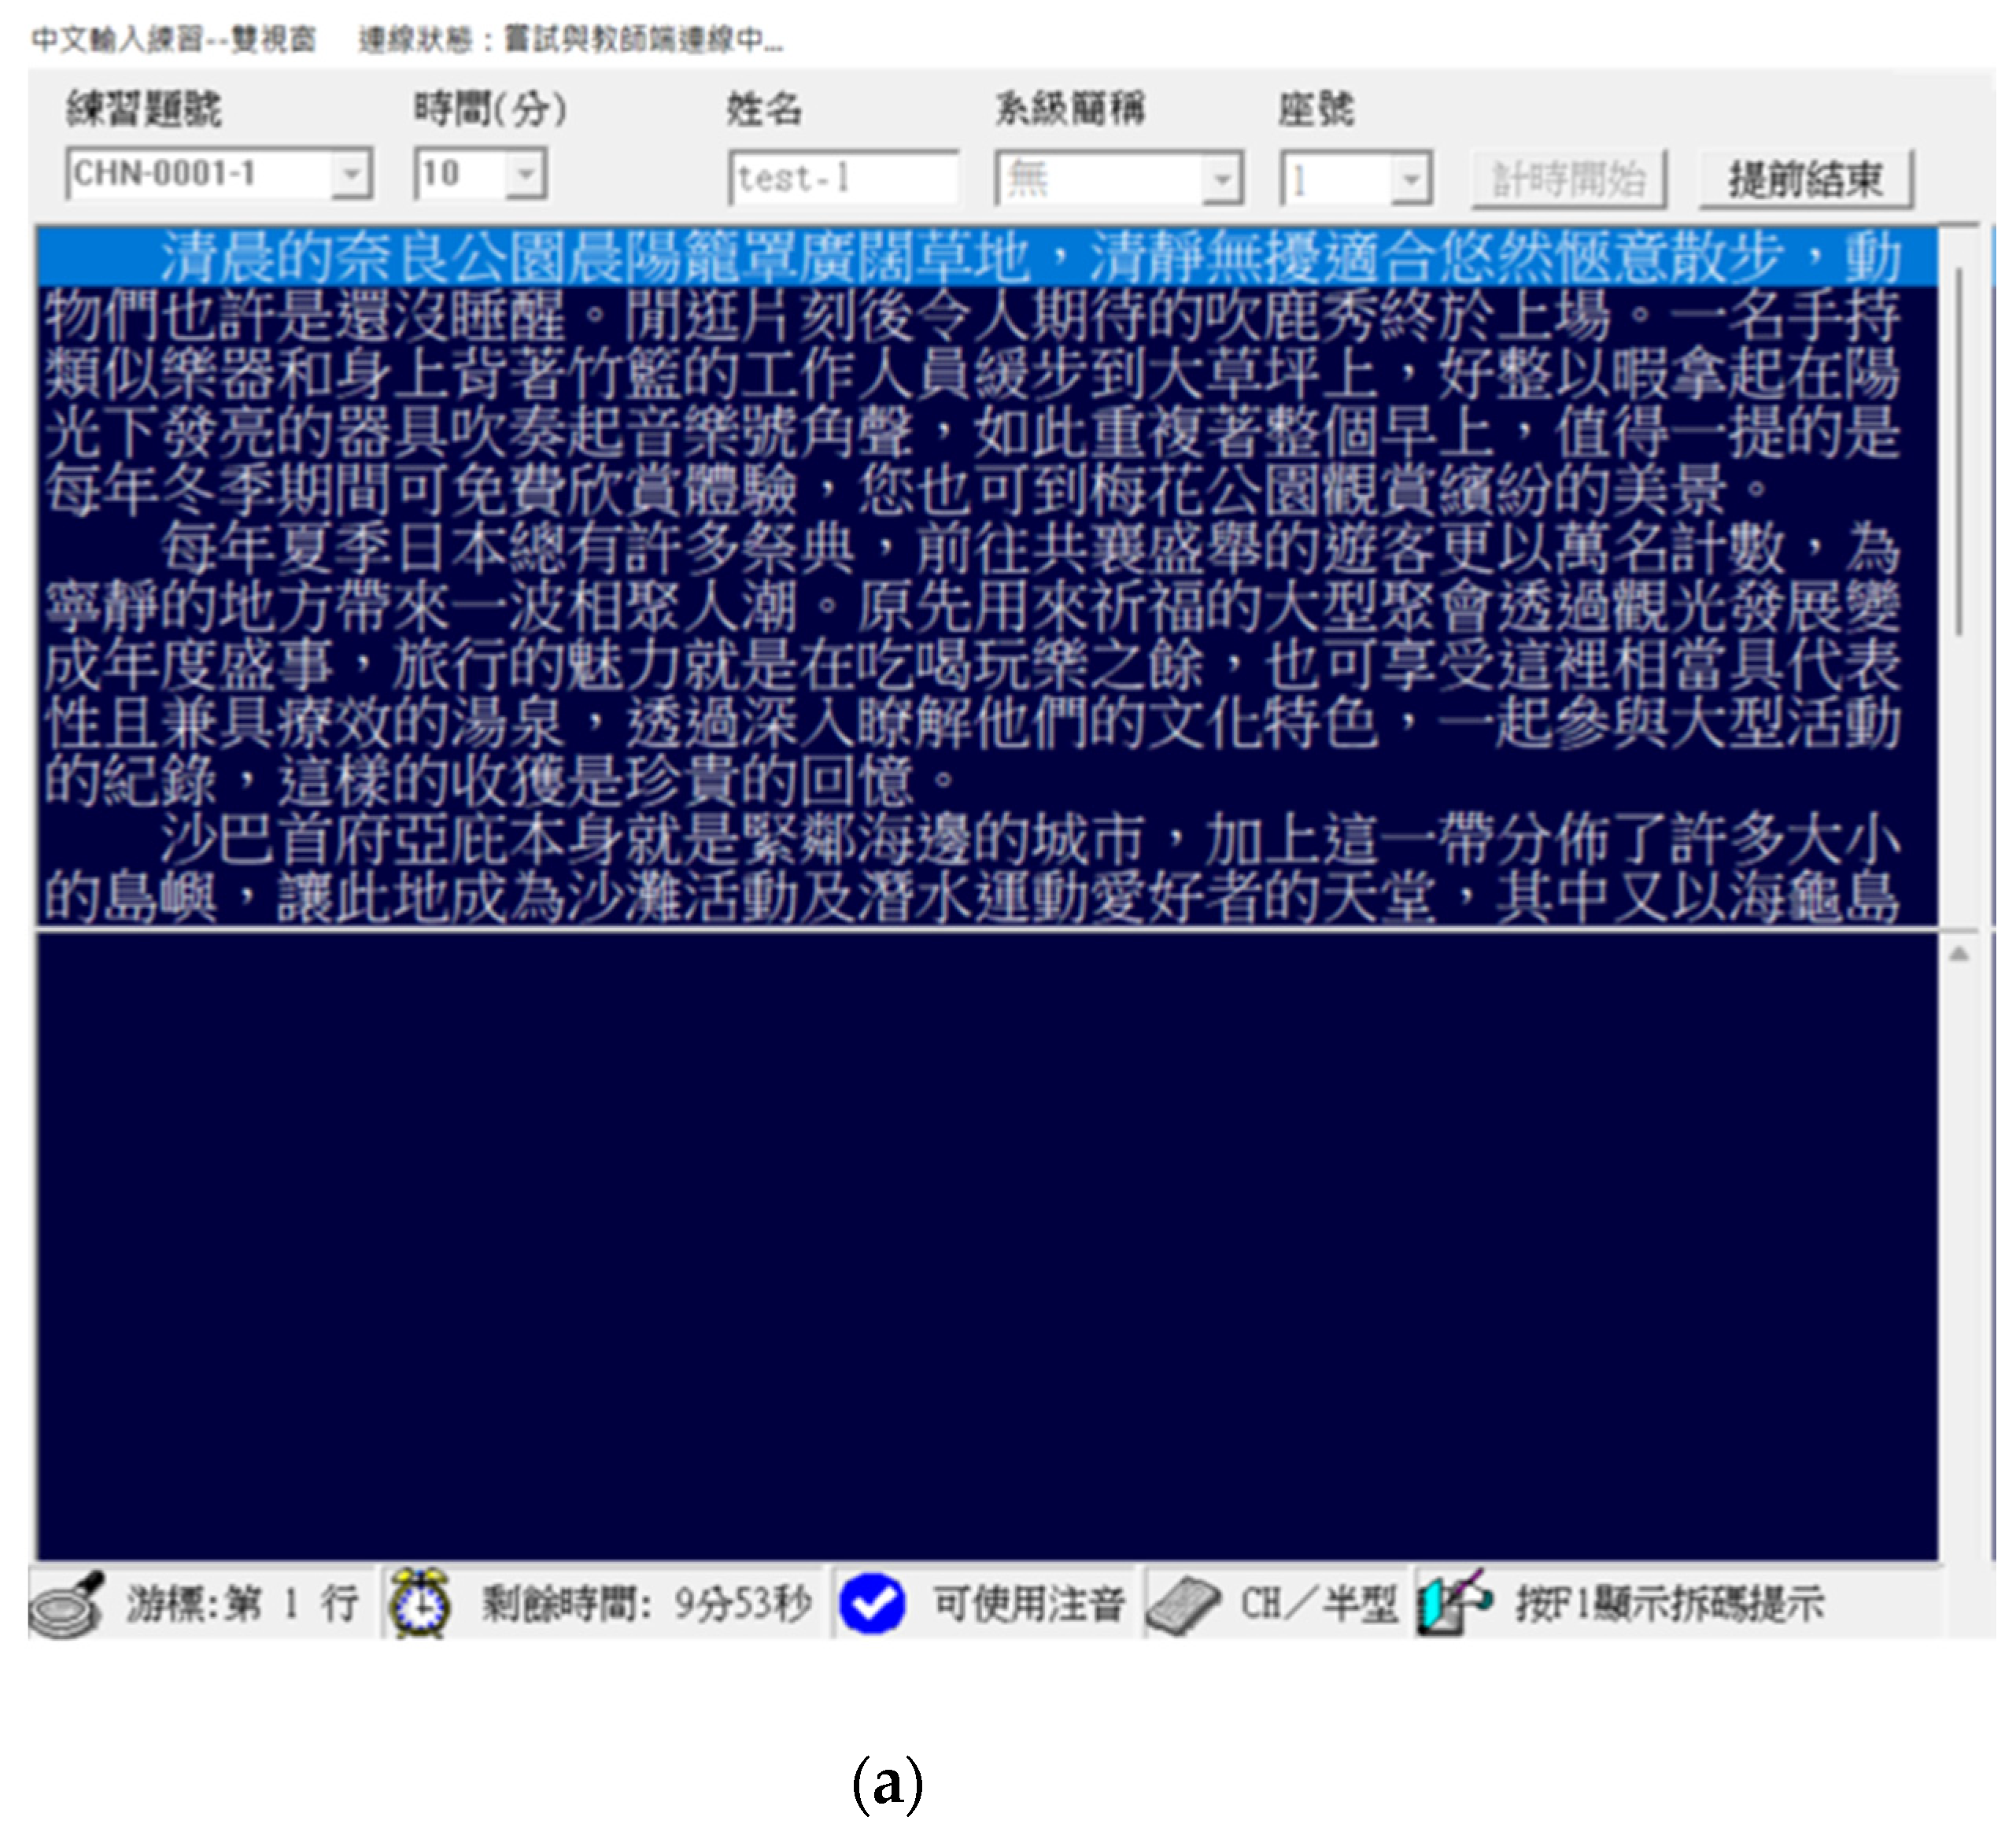
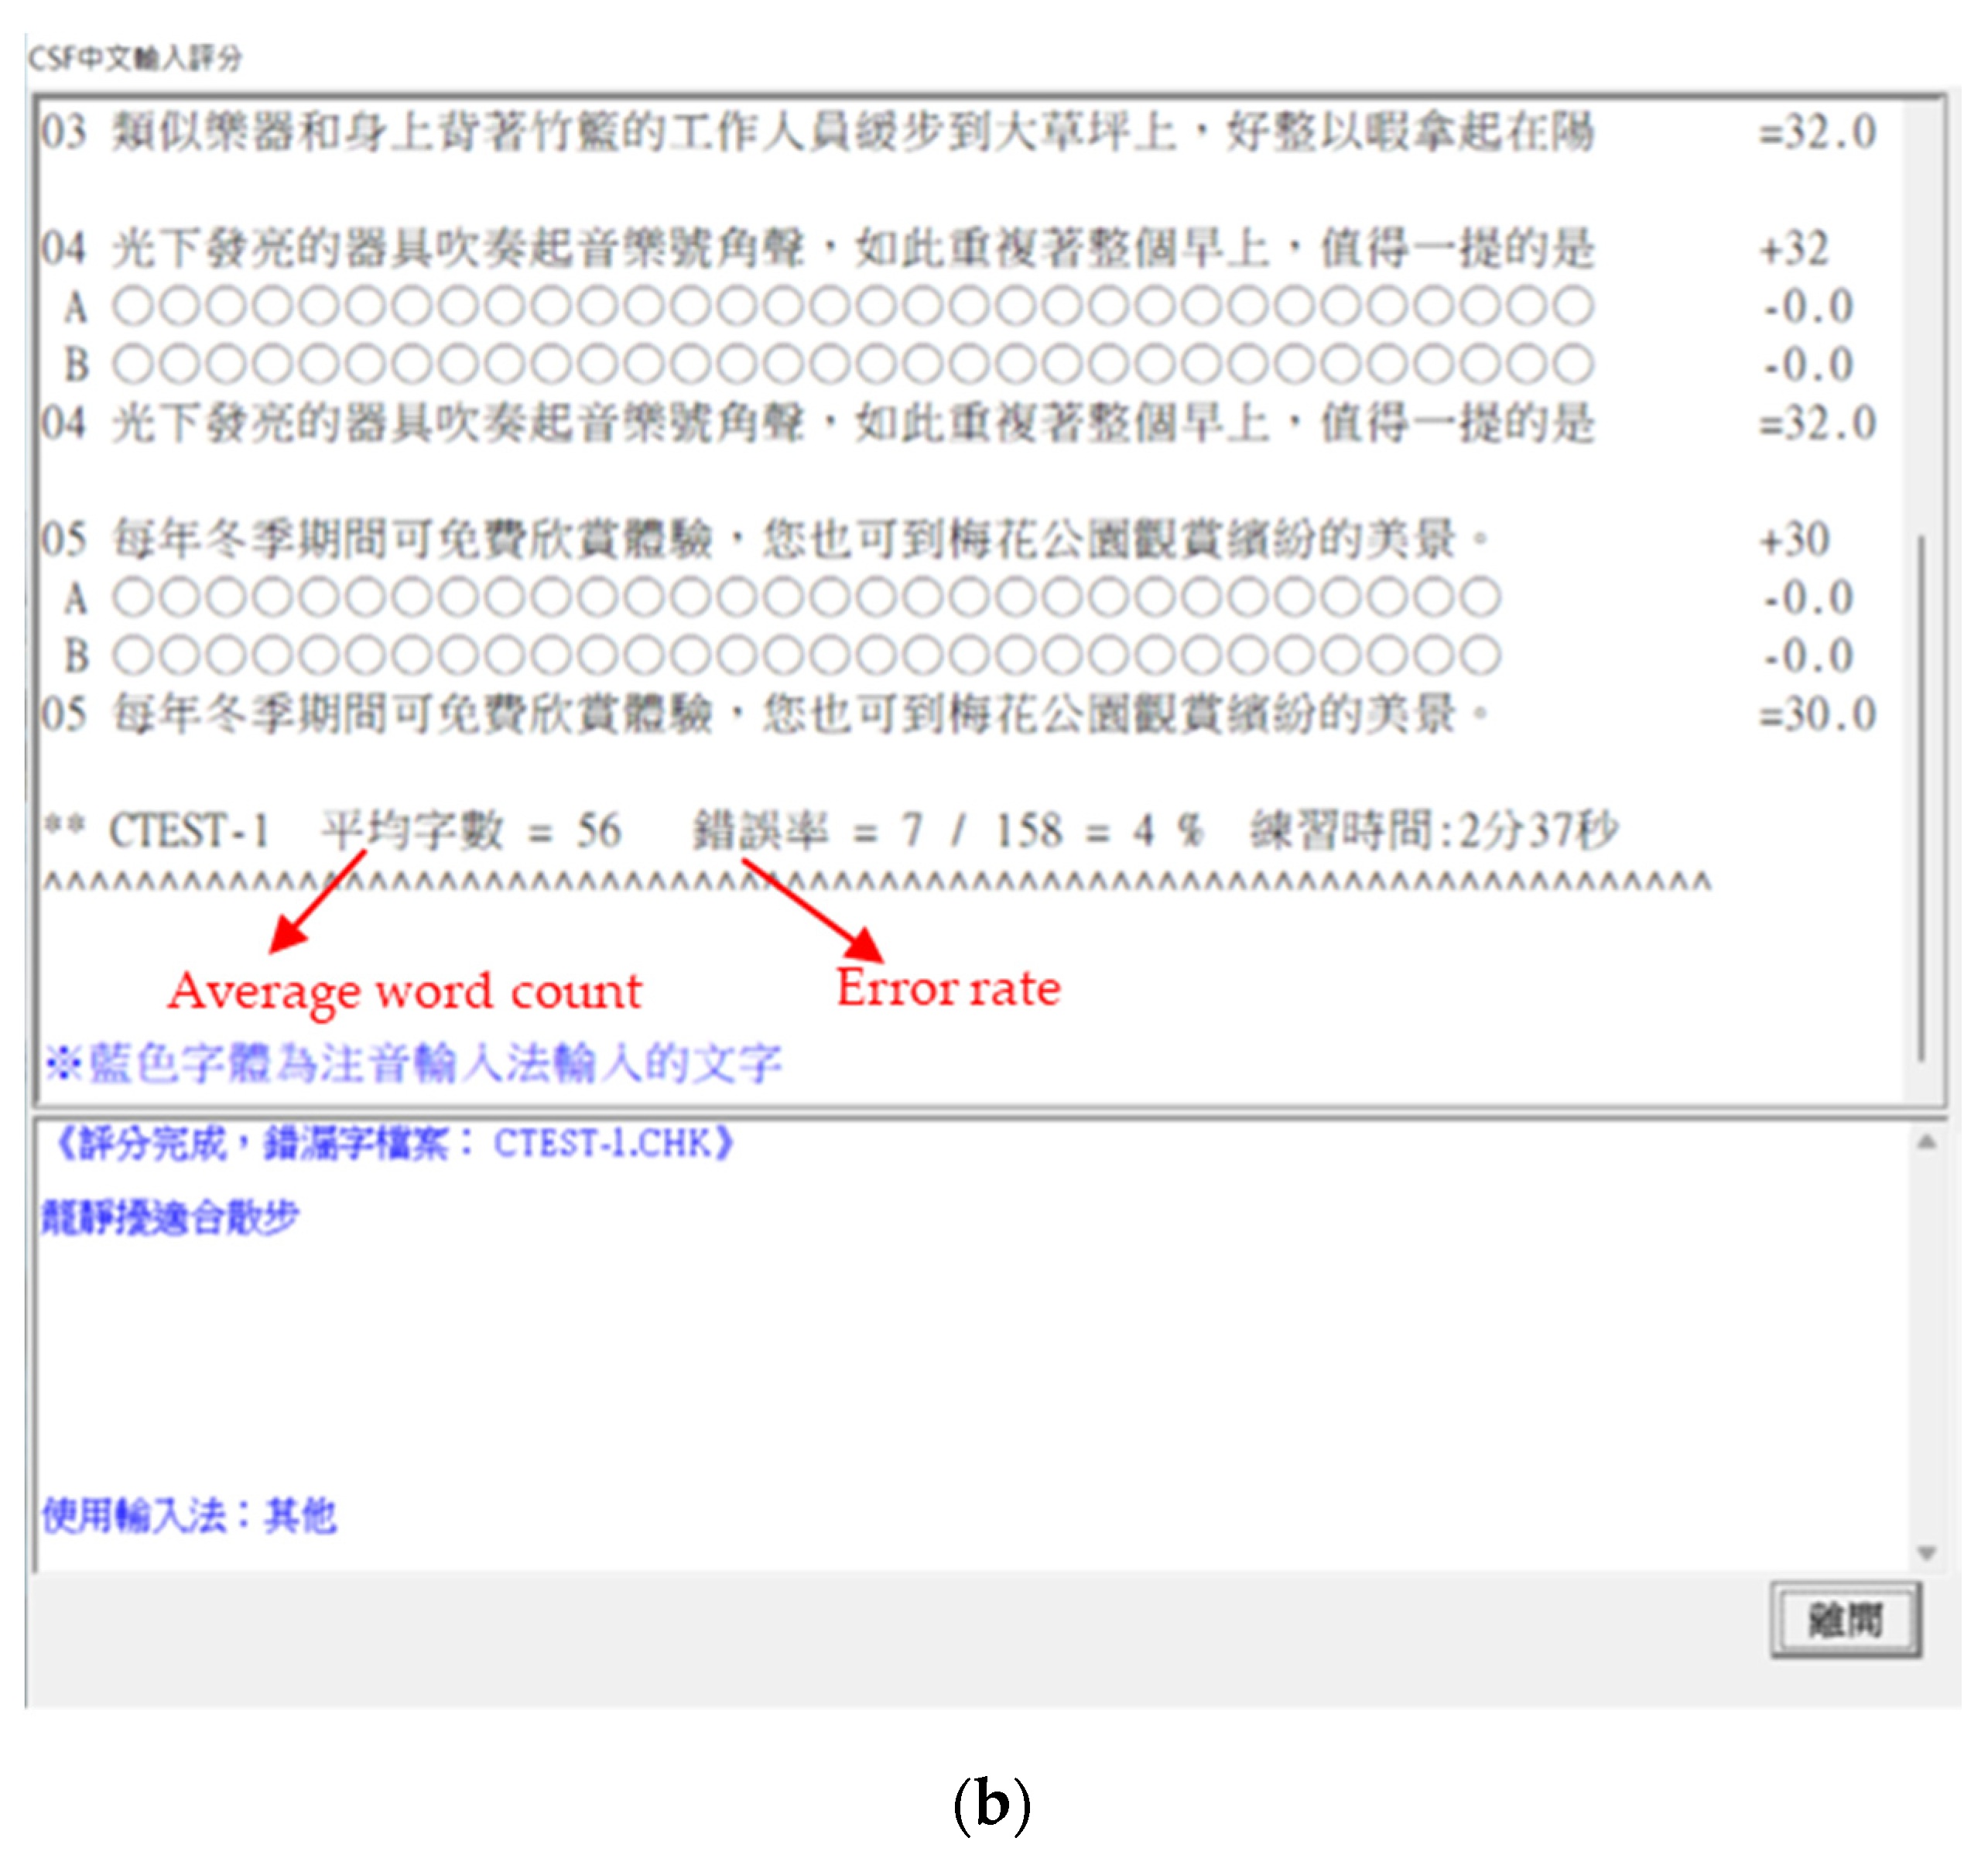
WGT3X-BT is ActiGraph’s best actigraphy, which is used by researchers all over the world to capture and continuously record physical activity and sleep/wake-up signals. Bluetooth intelligent wGT3X-BT is equipped with a 3-axis accelerometer and activity change recorder digital filtering technology, and includes an ambient light sensor, which can observe the relationship between environment, behavior, and sleep.
The activity detection data analysis platform ActiLife ensures the security of data collection and download. ActiLife can analyze and record the average metabolic rate at each time point every day, and can identify low exercise and sudden activity behavior. The calculated heart rate variables include ADL heart rate, average activity heart rate, heart rate delta, average activity energy expenditure, and RR interval. This enabled us to determine whether the subject is standing, sitting, or lying down, and whether to account for the exercise. It also enabled us to view the graphics of sleep activities, such as sleep and wakefulness; calculate and count data, such as falling asleep; sleep delay; sleep time and sleep efficiency, and use several algorithms to score [41].

2.5.4. Typing Test

Our typing test software was TQC professional enterprise talent verification Chinese typing software. The test software sets the duration of each typing test at 10 min. This software provided an article at the beginning, and the examinee must focus on typing this article, including paragraphs, words, punctuation marks, and spaces, which must be identical to the original. It took 10 min for compulsory settlement, and papers could be handed in in advance if finished early. After the test, information such as error rate, average word count, and typing errors were provided to the researchers.

3. Results

In order to explore the influence of light sources generated by non-sleep-aiding lamps on sleep, the smart mobile device used in this study generates dynamic light from an iPhone X. In order to verify the effect of sleep assistance light generated by its backlight module, a subjective evaluation questionnaire and non-subjective physiological parameter measurements were used, including heart rate variability (HRV), brain waves (O1, O2), sleep efficiency (sleep bracelet), sleep time, and a typing test before and after sleep.

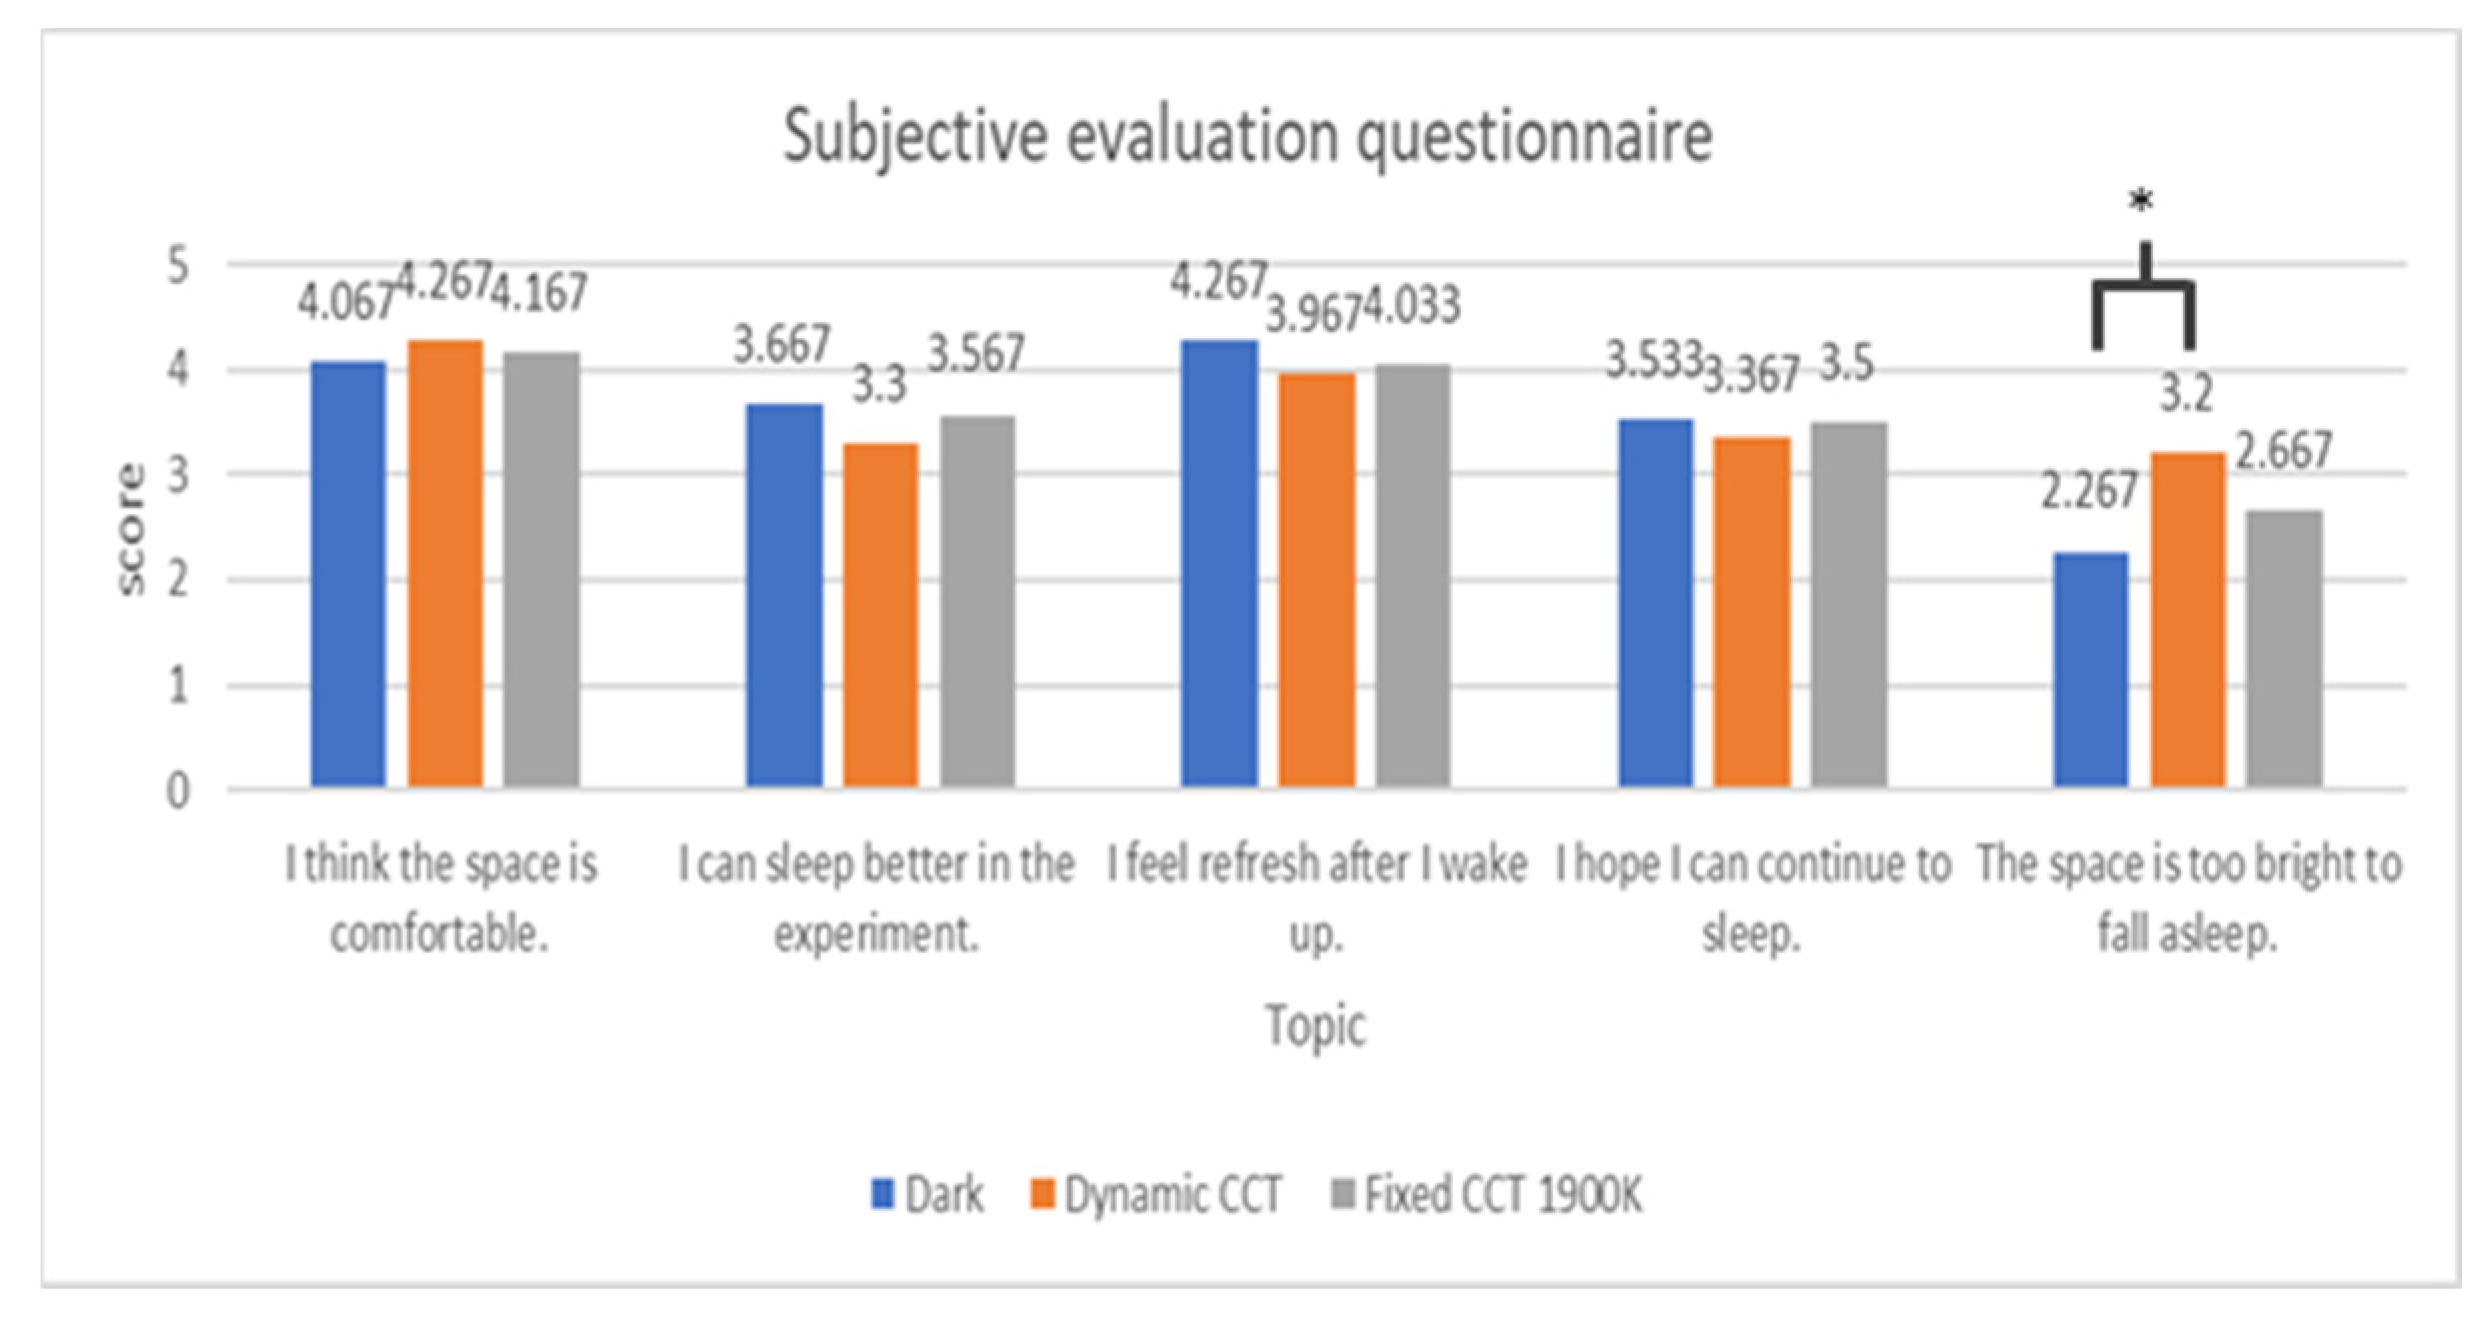
3.1. Subjective Evaluation Questionnaire

After the sleep experiment, each subject is required to fill in the subjective evaluation questionnaire as the experimental environment evaluation and subjective sleep quality index. The statistical results show that there is no significant difference in comfort, sleep quality, better mood, and hope to continue sleeping under the three light sources, but there is significant a difference in feeling too bright for subjective questionnaire evaluation, as shown in Figure 16.

3.2. Heart Rate Variability

In order to evaluate the differences between subjects in different stages of sleep, the depth analysis of HRV was conducted every 5 min after falling asleep for 10 min. When the nHFP increased, it indicated that the subjects were relaxed at this time, and vice versa. The nHFP of each period is shown in Figure 17.
As shown in the following table, in the sleep experiment, the nHFP showed no significant difference.
When analyzing sympathetic and parasympathetic active nerve index (nLFP), it is important to consider the disturbance of parasympathetic activity, which cannot be directly used as a sympathetic activity index to indicate whether subjects are excited or relaxed; therefore, it needs to be compared with low frequency/high frequency (LF/HF) component of the autonomic nerve activity balance [42]. If there are statistical differences between nLFP and LH/HF, it means that it is sympathetic activity at this time. The values of the sympathetic and parasympathetic nerve activity index (nLFP) and autonomic nerve and sexual balance index (LF/HF) in each period are shown in Figure 18 and Figure 19.
According to the statistical analysis results of nLFP and LH, there is no significant difference between nLFP and LH.

3.3. Brain Wave Analysis

In this section, the brain wave signals in time domain are extracted and analyzed in the frequency domain. The brain wave signal results in 60 min during the experiment are analyzed every 10 min and every 5 min, and the differences in brain wave changes in each minute are recorded in detail, in order to discover the differences of brain wave changes from fast wave to slow wave, or slow wave to fast wave, in the process of sleeping. The analysis is divided into 10 stages.

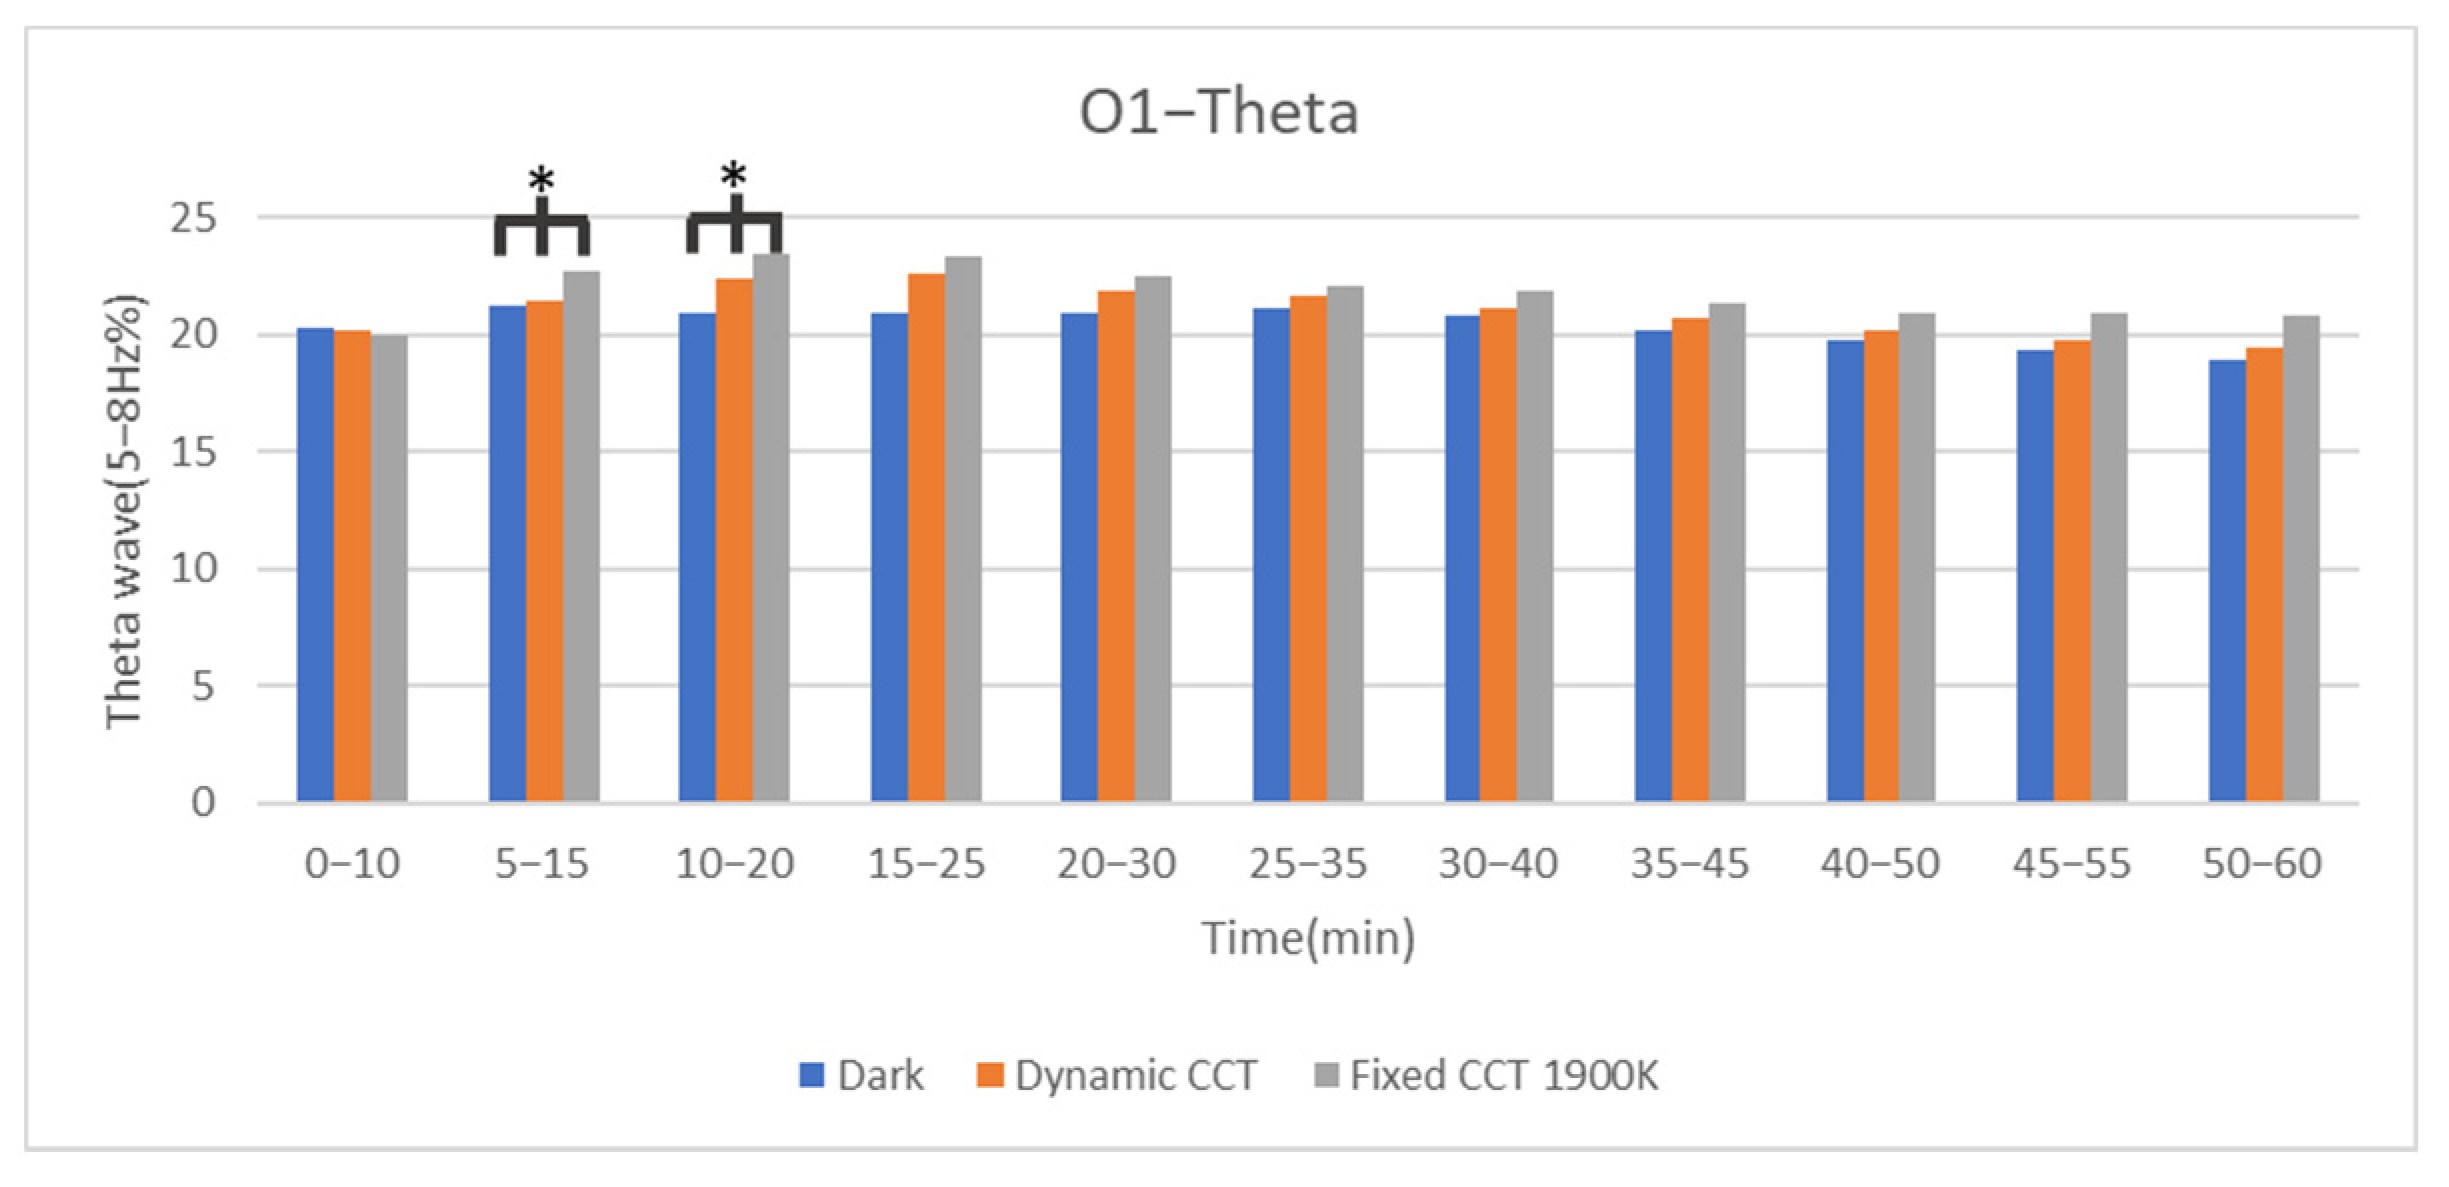
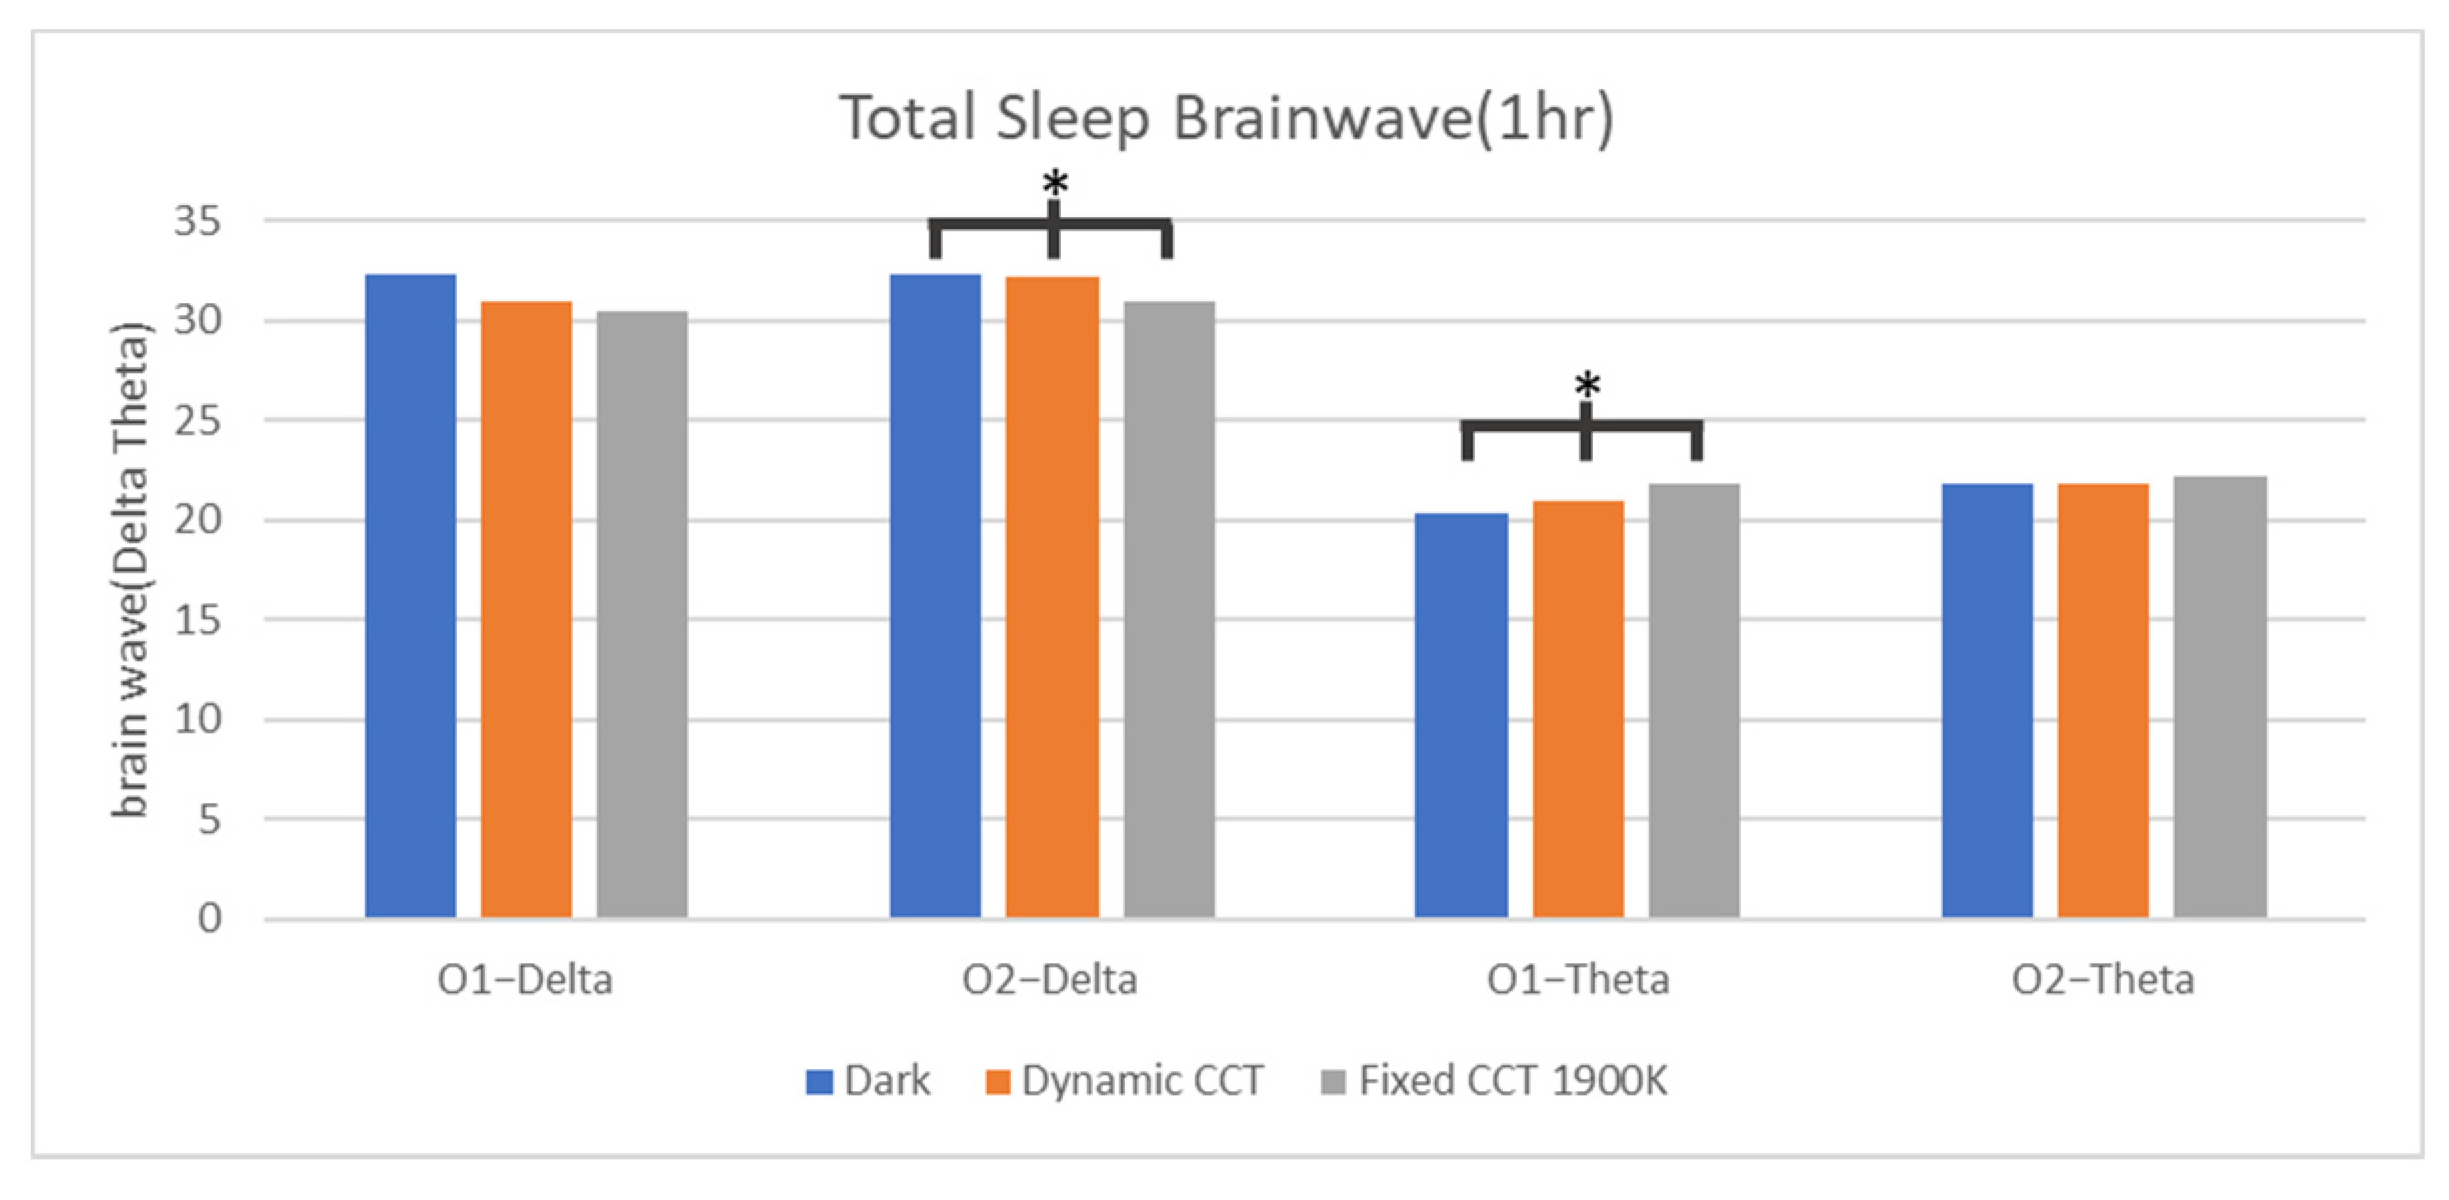
3.3.1. θ(Theta) Wave

The frequency range is approximately 4~8 Hz. The adult is in deep relaxation before falling asleep or getting up, meditating, or sleeping, but this does not include deep sleep. It is necessary to trigger deep memory and strengthen long-term memory, which belongs to a state of shallow consciousness.

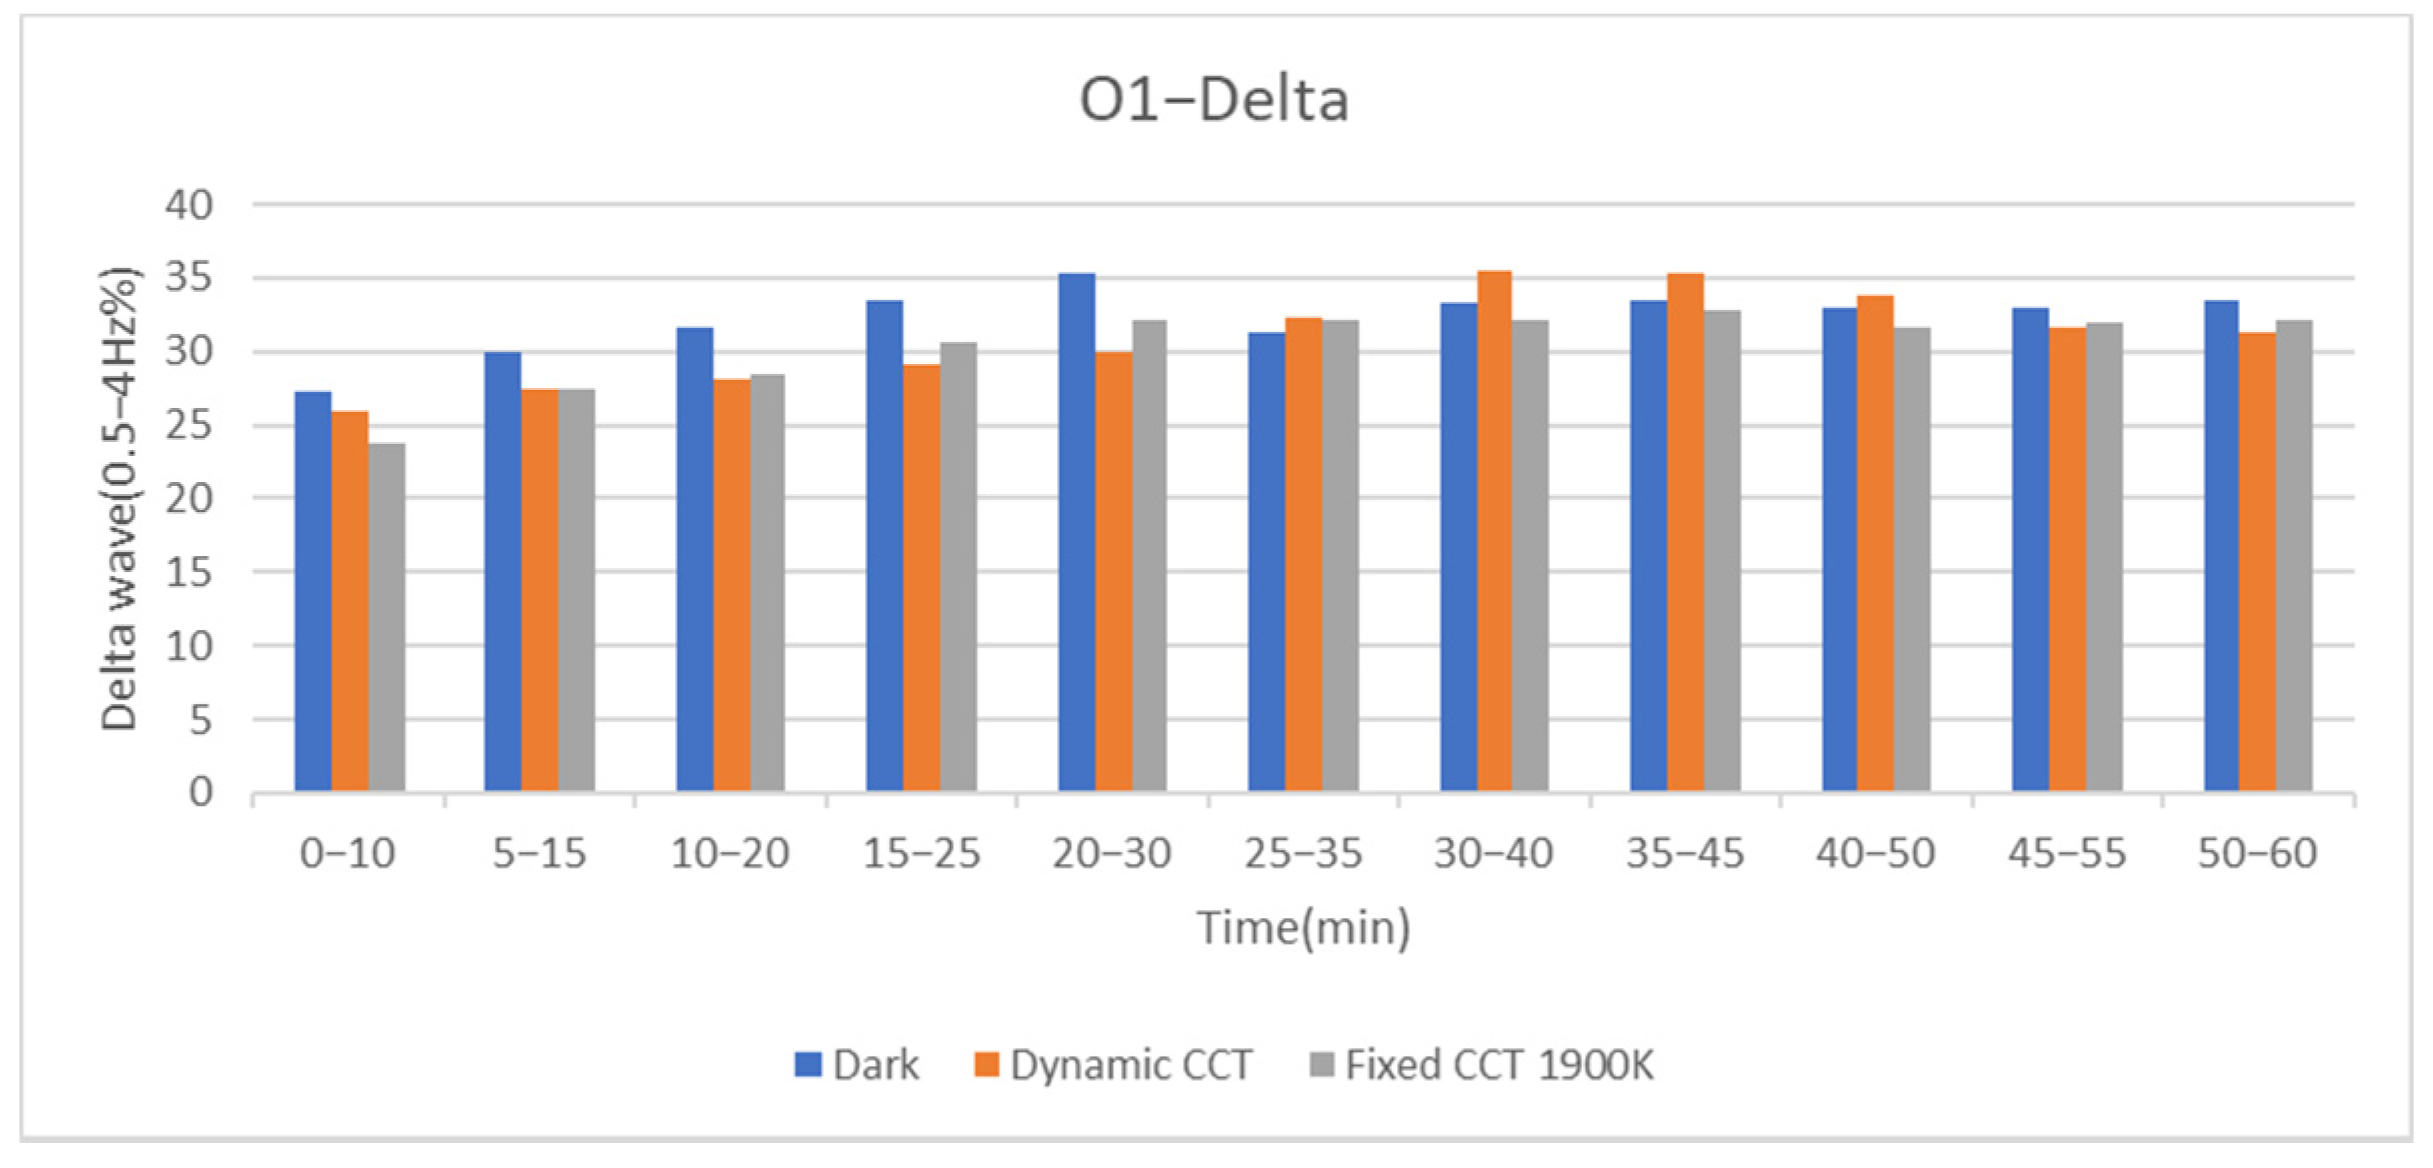
3.3.2. δ(Delta) Wave

The frequency range is below 4 Hz, which is the slowest wave. It is especially obvious when infants sleep, but also appears in the deep sleep of adults, who are in a dreamless and deep sleep state, which is an unconscious state. It is commonly known as the sleep brain wave.
According to the energy statistics of brain wave O1_Theta, there are statistical differences in both durations of 15–20 min and 20–30 min, which are all fixed color temperature 1900 K > dynamic light > no light environment, as shown in Figure 20.
The energy of brain wave O2_Theta wave has no significant differences in statistics, but in terms of trend, it can be found that the energy trend of theta is gradually increasing before falling asleep. Thus, it can be seen that the subject has entered relaxation during the sleep experiment, as shown in Figure 21.
There is no significant difference (* p < 0.05) in the statistical results of brain wave O1_Delta, as shown in Figure 22.
There is no difference in the statistical results of brain wave O2_Delta, but the results of O2_Delta are similar to those of O1_Delta. After 25–35 min, the delta brain wave energy shows a strong trend under the sleeping environment with dynamic sleep aid light, as shown in Figure 23.
According to the analysis of the total energy results of theta and delta of O1 and O2, O1_Theta and O2_Delta show statistical differences. O1_Theta electroencephalogram energy has a fixed color temperature of 1900 K higher than the dynamic color temperature and higher than the non-light environment, and O2_Delta electroencephalogram energy has a non-light value higher than the dynamic color temperature and higher than the fixed color temperature of 1900 K. However, a fixed color temperature of 1900 K can only relax, and there is no way to assist in deep sleep in delta energy, while dynamic light and no light can make the brain generate more delta energy, and the delta energy intensity of dynamic light and no light is also closer, as shown in Figure 24.

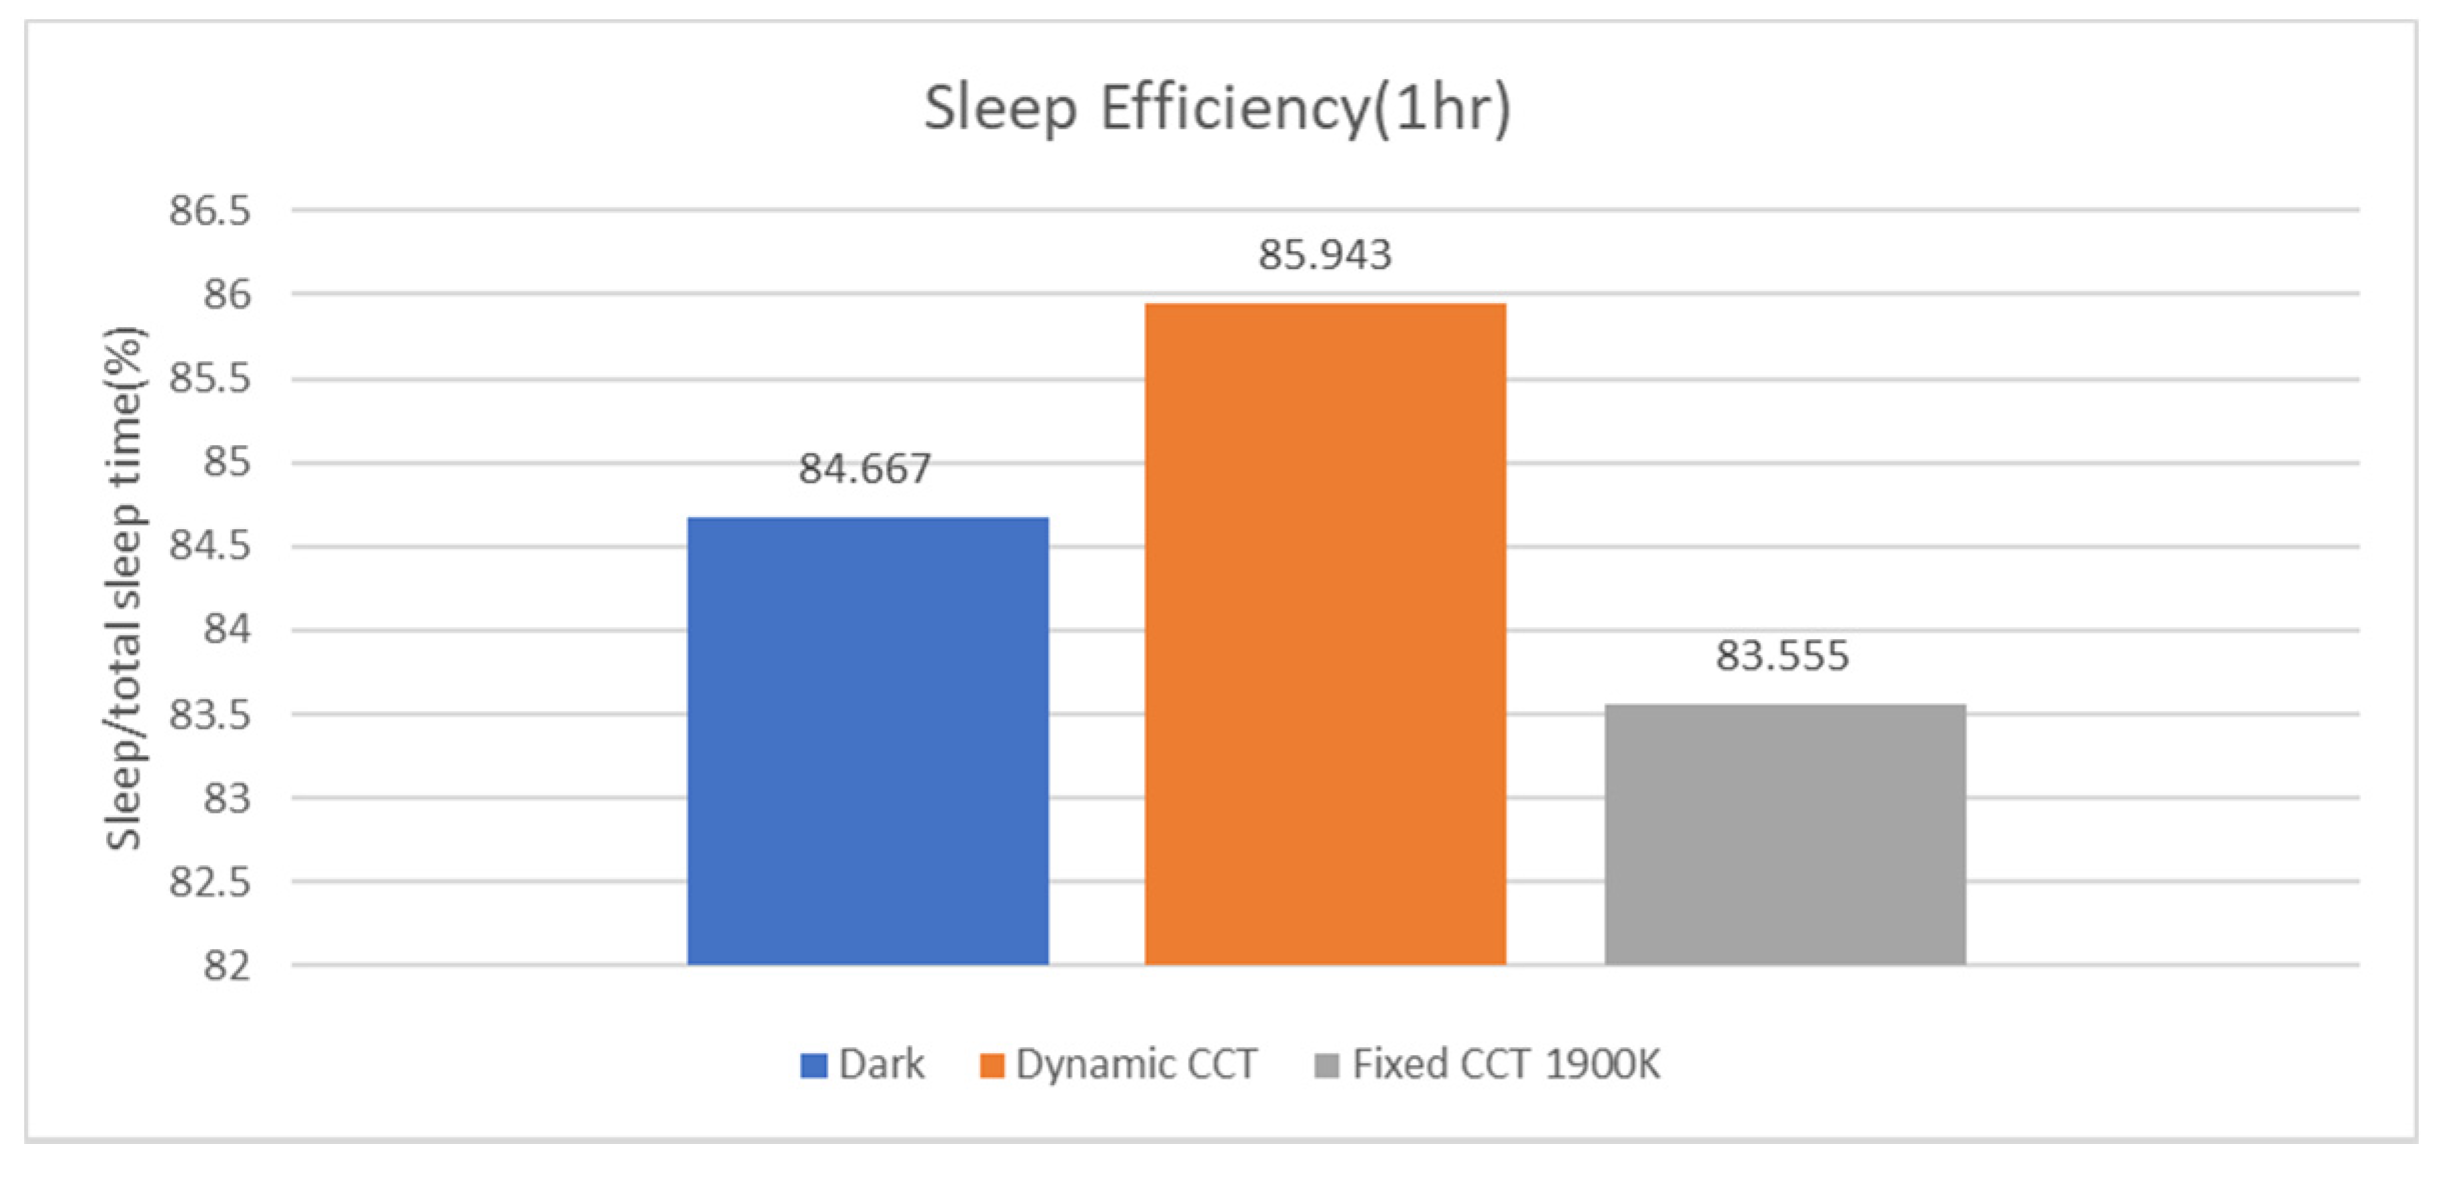
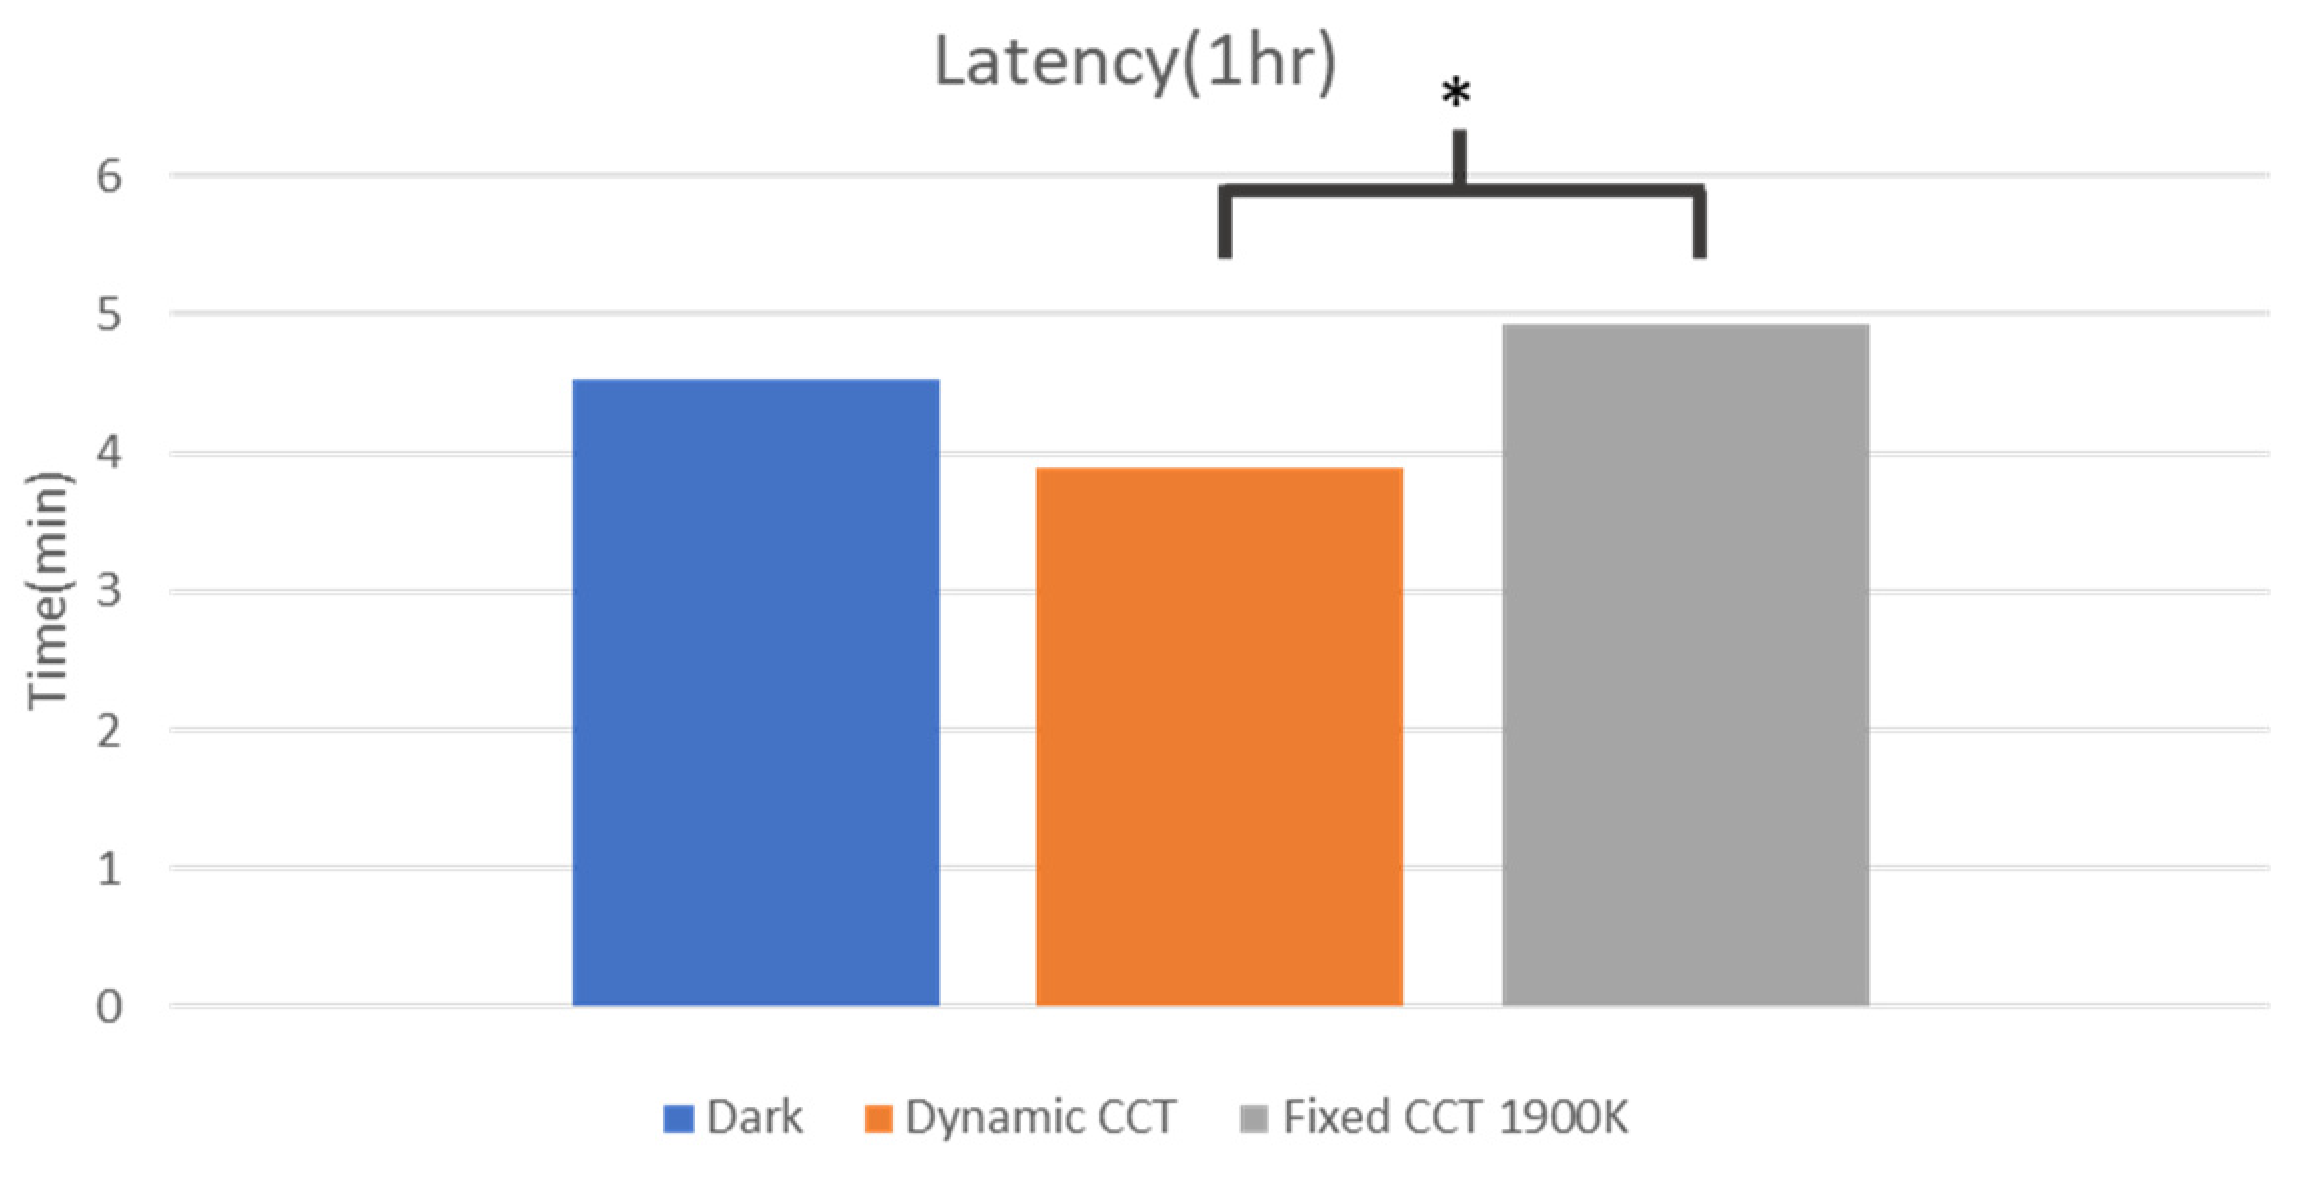
3.4. Analysis of Sleep Bracelet
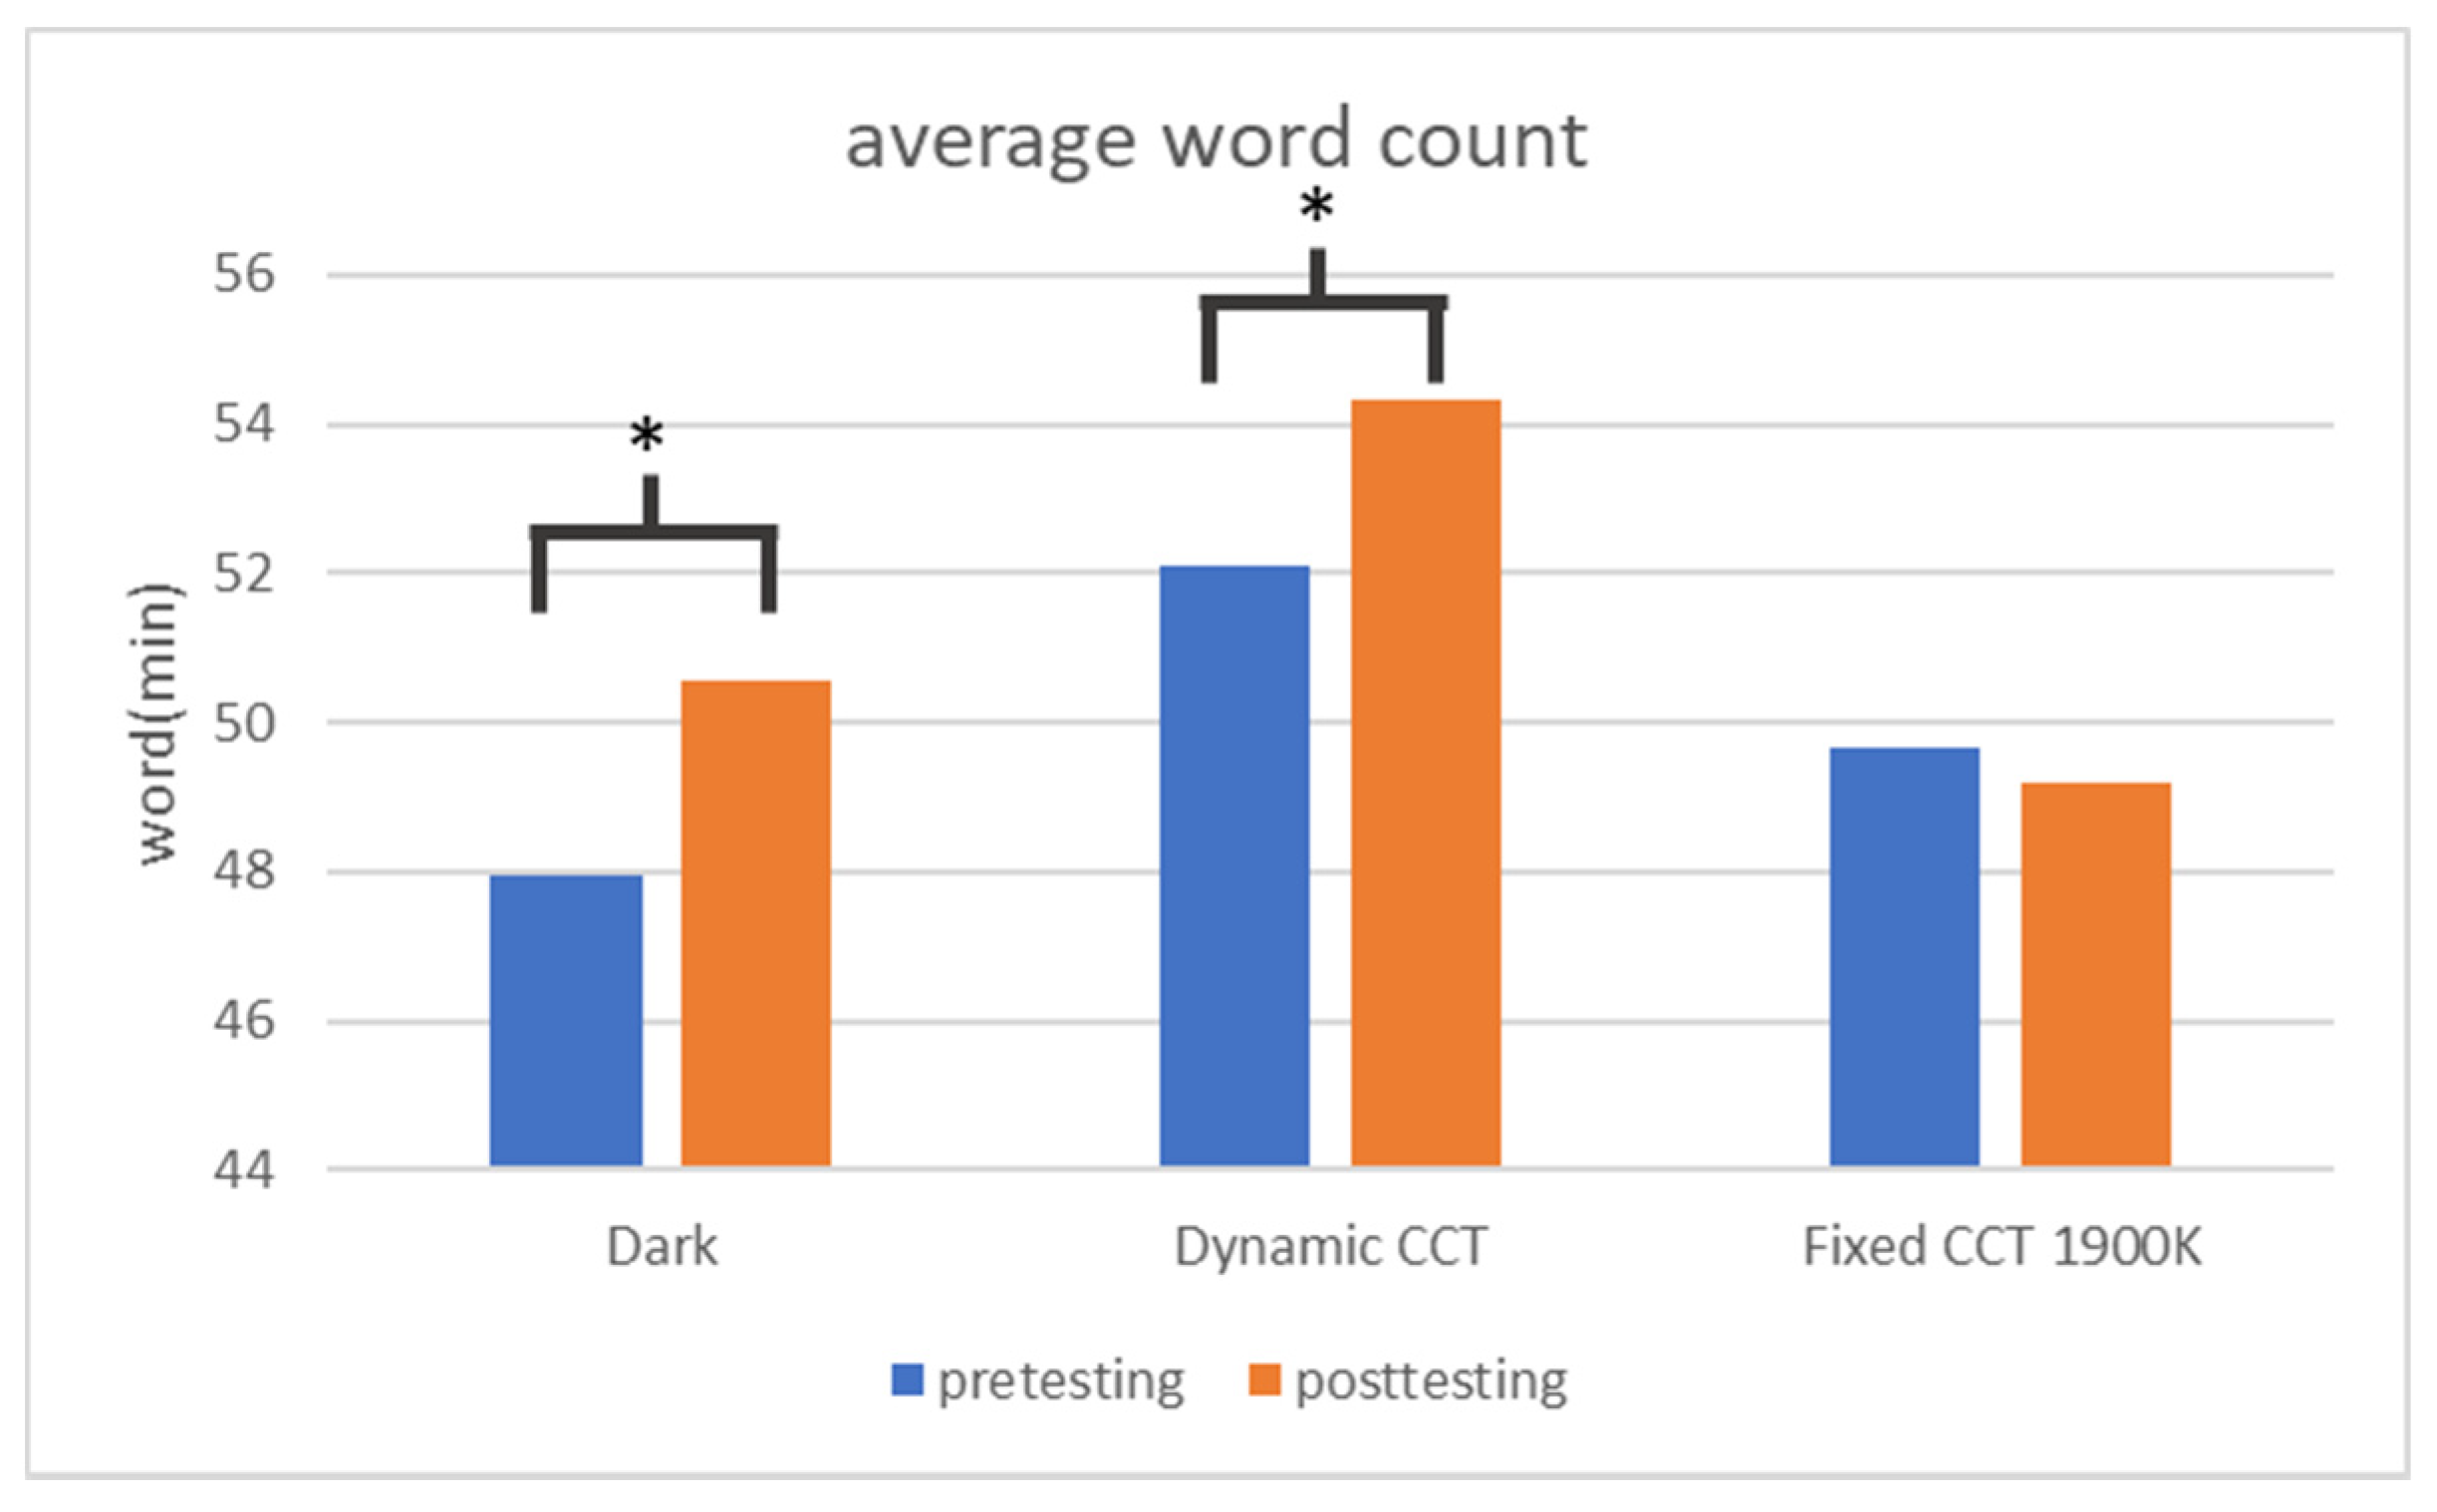
The results of the analysis of sleep efficiency show that there is no statistically significant difference among the three sleeping environments, i.e., without light, with dynamic color temperature, and with fixed color temperature of 1900 K. See Figure 25.
The results of latency analysis showed that there were significant differences in dynamic color temperature and fixed color temperature 1900 K, and the dynamic color temperature was significantly lower than the fixed color temperature in the sleep environment. See Figure 26.

3.5. Typing Test

There is a statistically significant difference in the average number of words after sleep in a dynamic color temperature environment and after sleep in a no light environment Sleep in a both a dynamic color temperature environment and in a no light environment significantly increases the number of typed words, see Figure 27.
There is no significant difference in the error rate in the statistics see Figure 28.

4. Discussion

Because the frequency spectrum of the light source emitted by the backlight element of a smart mobile device is different from that of the sleep assistant light, the correlated color temperature effect using a different color temperature spectrum can be achieved in the light regulation of the light source, as shown in Figure 29 [43]. In addition, the luminous flux of light emitted by the backlight element is also limited. In order to set the requirements of fixed correlated color temperature and fixed illumination, it is necessary to make the decoration distance closer to the user, so the setting distance from the lamp is different, and there are some different types of decoration in the experimental environment.
Lighting plays an important role in our life, which is indispensable in both sleep and daily life. For sleep, the light sources emitted by different lighting devices will have different effects on melatonin [7,8,9,12,13]. A light source with low color temperature can slow down the influence on melatonin [7,8,9], while dynamic lighting can not only adjust the sleep phase, but also improve alertness and sleep quality [10,11].
In the results of our subjective questionnaire, there is a statistical difference (p < 0.05) in the perception of the existence of a light source during sleep, which means that even during sleep, the subjects can still perceive the dim light, but there is no significant difference in comfort, inability to fall asleep due to the light source, and desire to continue to sleeping after sleep.
There is no significant difference in the analysis of heart rate variability (p < 0.05), but according to the results of energy trend, the nHFP, which represents the degree of sleep relaxation in three environments, gradually increases, and after 30 min, the degree of sleep relaxation in dynamic color temperature exceeds that in a no light environment and a fixed color temperature environment. At the same time, nLFP and LH, which represent the degree of excitement, are lower in the dynamic color temperature environment than in the light-free and fixed color temperature environment of 1900 K.
In the analysis of brain wave research results, only O1_Theta has statistical difference in 10–25 min (p < 0.05), and the result is that the fixed color temperature is 1900 K > the dynamic color temperature > the light-free environment, while the delta has no statistical difference. However, from Figure 16, Figure 17, Figure 18, Figure 19 and Figure 20, it can be found that after 30 min, the delta wave of dynamic light gradually surpasses the sleep in the dark environment and the fixed color temperature of 1900 K, while the theta wave is still at the fixed color temperature of 1900 K with the strongest energy. Therefore, we can determine that sleeping with a fixed color temperature of 1900 K has a significant effect on relaxation. However, in the index of deep sleep, the energy trend of delta is less than that of the dynamic color temperature and no light environments, so the sleep environment with a fixed color temperature of 1900 K may only achieve relaxation, but not deep sleep. According to the energy trend of delta, the dynamic color temperature gradually exceeds the environment with no light and fixed color temperature of 1900 K after 30 min.
According to the analysis results of the sleep bracelet in Figure 21 and Figure 22, there is a statistical difference between the dynamic color temperature in the incubation period and the fixed color temperature environment of 1900 K, and the sleep latency of dynamic color temperature is significantly less than that of fixed color temperature of 1900 K. On the other hand, the latent period of dynamic color temperature is also less than that of a no light environment, and the results show that the sleep efficiency of dynamic color temperature is higher than that of a no light environment and also higher than that of a fixed color temperature environment. This means that dynamic light can provide better sleep efficiency during long-term sleep.
In the results of the typing test, the average number of words typed by the subjects after sleeping in a no light environment and a dynamic light environment is significantly improved, while there is no statistical difference at the fixed color temperature of 1900 K. From the results, it can be established that sleeping in no light environment and dynamic light environment can contribute to the improvement of typing learning efficiency.
Through our research results, we found that the longer the sleep time, the more sleep EEG signals can be generated by dynamic color temperature. According to the analysis results of the total EEG time, there are statistical differences between O1_Theta and O2_Delta (p < 0.05), O2_Delta is no light > dynamic light > fixed color temperature 1900 K, while O1_Theta is fixed color temperature 1900 K > dynamic light. In the distribution of total energy, the fixed color temperature of 1900 K is only significant in sleep, while the light-free environment is more effective in deep sleep. However, from the trend, the energy of dynamic light is not far from that of a light-free environment. According to the comprehensive subjective questionnaire, non-subjective physiological information, and typing test, in the analysis of the variability of brain waves and heart rate, the sleep results of dynamic light and light-free environment are similar, and are both better than that of fixed color temperature of 1900 K. However, the sleep result of dynamic color temperature is not initially better than that of unlicensed light environment, but after 30 min, the relaxation and deep sleep effect of dynamic light gradually improves, and it is better than that of no light environment. However, the results of the typing test and sleep bracelet show that the trend of sleep efficiency demonstrates that dynamic light is better than no light and fixed color temperature 1900 K, and there is a statistical difference between the average number of words without light and with dynamic light. From these two indicators, dynamic color temperature significantly helps to improve typing efficiency after sleep. Dynamic color temperature not only refers to the research of dynamic lighting and color temperature, but also takes sound frequency into consideration as the basis of influencing sleep [44,45,46,47]. If the frequency and color temperature combination are adjusted later, people’s sleep quality can be improved.

5. Conclusions

After 30 min, the dynamic sleep light emitted by the intelligent mobile device can generate delta energy to a greater degree than that in the lightless sleep environment, and the stronger the delta wave energy, the deeper the sleep level.
After sleeping, the dynamic sleep-aiding light emitted by smart mobile devices is beneficial to increasing the average number of words after sleeping compared with the average number of words before sleeping.
The results of using dynamic sleep-assisting light from smart mobile devices to assist sleep show that people can relax more and more if they use this light for a long time. The indexes of heart rhythm variability and the relaxation degree of brain wave theta wave are all after 30 min, and the physiological parameter energy of dynamic sleep aid light tends to be increasingly stronger, which is more effective than that of no light and fixed color temperature of 1900 K.
The experimental results show that light does not cause exclusively poor sleep quality. Rather, the proper use of light can help improve sleep quality. At the same time, this paper verifies that a dynamic light can achieve similar effects when applied to intelligent mobile devices in addition to lighting equipment. In the future, light applications can be used as a basis to continue deep plowing and explore more dynamic light or frequency spectrum that is conducive to sleep.

Author Contributions

Conceptualization, C.-Y.C.; methodology, C.-Y.C. and Y.-K.W.; software, C.-Y.C., Y.-K.W. and Z.-W.W.; validations, Y.-K.W.; formal analysis, Y.-K.W. and Z.-W.W.; data curation, C.-Y.C., Y.-K.W. and Z.-W.W.; writing—original draft preparation, C.-Y.C., Y.-K.W. and Z.-W.W.; writing—review and editing, C.-Y.C. and Y.-K.W.; supervision, C.-Y.C.; project administration, C.-Y.C., Y.-K.W. and Z.-W.W. All authors have read and agreed to the published version of the manuscript.

Funding

This research was funded by the Ministry of Science and Technology of Taiwan. Research project name: Dynamic Color Temperature Sleep Assitant Light Implemented on the Mobile Device, project number: 110-2622-E-011-021-.

Institutional Review Board Statement

This study passed the Institutional Review Boards of National Taiwan University, and approved the human factor experiment, with the experiment number. 202007EM041.

Informed Consent Statement

Informed consent was obtained from all volunteerss involved in the study. Written informed consent has been obtained from the patient(s) to publish this paper.

Data Availability Statement

All data generated or analyzed to support the findings of the present study are included this article. The raw data can be obtained from the authors, upon reasonable request.

Conflicts of Interest

The authors declare no conflict of interest.

References

  1. Solso, R.L. The Psychology of Art and the Evolution of the Conscious Brain; MIT Press: Cambridge, MA, USA, 2003; p. 57. [Google Scholar]
  2. Hattar, S.; Liao, H.W.; Takao, M.; Berson, D.M.; Yau, K.W. Phototransduction by Retinal Ganglion Cells That Set the Circadian Clock. Science 2002, 295, 1070–1073. [Google Scholar]
  3. Berson, D.M. Strange vision: Ganglion cells as circadian photoreceptors. Trends Neurosci. 2003, 26, 314–320. [Google Scholar] [CrossRef]
  4. IES. TM-18-18-Light and Human Health: An Overview of the Impact of Optical Radiation on Visual, Circadian, Neuroendocrine and Neurobehavioral Responses; IES: New York, NY, USA, 2018. [Google Scholar]
  5. Morin, L.P. The circadian visual system. Brain Res. Rev. 1994, 19, 102–127. [Google Scholar] [CrossRef]
  6. Axelrod, J. The Pineal Gland: A Neurochemical Transducer. Science 1974, 184, 1341–1348. [Google Scholar] [CrossRef] [PubMed]
  7. Kozaki, T.; Kitamura, S.; Higashihara, Y.; Ishibashi, K.; Noguchi, H.; Yasukouchi, A. Effect of color temperature of light sources on slow-wave sleep. J. Physiol. Anthropol. Appl. Hum. Sci. 2005, 24, 183–186. [Google Scholar] [CrossRef] [Green Version]
  8. Chellappa, S.L.; Steiner, R.; Oelhafen, P.; Lang, D.; Götz, T.; Krebs, J.; Cajochen, C. Acute exposure to evening blue-enriched light impacts on human sleep. J. Sleep Res. 2013, 22, 573580. [Google Scholar] [CrossRef] [Green Version]
  9. Smolders, K.C.; De Kort, Y.A. Investigating daytime effects of correlated colour temperature on experiences, performance, and arousal. J. Environ. Psychol. 2017, 50, 80. [Google Scholar] [CrossRef]
  10. Canazei, M.; Dehoff, P.; Staggl, S.; Pohl, W. Effects of dynamic ambient lighting on female permanent morning shift workers. Lighting Res. Technol. 2013, 46, 140–156. [Google Scholar] [CrossRef]
  11. De Kort, Y.A.W.; Smolders, K.C.H.J. Effects of dynamic lighting on office workers: First results of a field study with monthly alternating settings. Lighting Res. Technol. 2010, 42, 345–360. [Google Scholar] [CrossRef]
  12. West, K.E.; Jablonski, M.R.; Warfield, B.; Cecil, K.S.; James, M.; Ayers, M.A.; Maida, J.; Bowen, C.; Sliney, D.H.; Rollag, M.D.; et al. Blue light from light-emitting diodes elicits a dose-dependent suppression of melatonin in humans. J. Appl. Physiol. 2011, 110, 619–626. [Google Scholar] [CrossRef] [Green Version]
  13. Harper, K. So Tired in the Morning…The Science of Sleep; ChemMatters: Washington, DC, USA, 2015. [Google Scholar]
  14. Taiwan Society of Sleep Medicine. Available online: https://worldsleepsociety.org/membership/societymembership/membersocieties/taiwan-society-of-sleep-medicine/ (accessed on 30 March 2019).
  15. Klink, M.E. Risk factors associated with complaints of insomnia in a general adult population: Influence of previous complaints of insomnia. Arch. Intern. Med. 1992, 152, 1634–1637. [Google Scholar] [CrossRef] [PubMed]
  16. Ohayon, M.M. Epidemiology of insomnia: What we know and what we still need to learn. Sleep Med. Rev. 2002, 6, 97–111. [Google Scholar] [CrossRef] [PubMed]
  17. Roth, T.; Ancoli-Israel, S. Daytime consequences and correlates of insomnia in the United States: Results of the 1991 National Sleep Foundation Survey. II. Sleep J. Sleep Res. Sleep Med. 1999, 22, S354–S358. [Google Scholar]
  18. Chang, A.-M.; Aeschbach, D.; Duffy, J.F.; Czeisler, C.A. Evening use of light-emitting eReaders negatively affects sleep, circadian timing, and next-morning alertness. Proc. Natl. Acad. Sci. USA 2014, 112, 1232–1237. [Google Scholar] [CrossRef] [PubMed] [Green Version]
  19. Brunetti, V.C.; O’Loughlin, E.K.; O’Loughlin, J.; Constantin, E.; Pigeon, É. Screen and nonscreen sedentary behavior and sleep in adolescents. Sleep Health 2016, 2, 335–340. [Google Scholar] [CrossRef]
  20. Rångtell, F.H.; Ekstrand, E.; Rapp, L.; Lagermalm, A.; Liethof, L.; Búcaro, M.O.; Lingfors, D.; Broman, J.-E.; Schiöth, H.B.; Benedict, C. Two hours of evening reading on a self-luminous tablet vs. reading a physical book does not alter sleep after daytime bright light exposure. Sleep Med. 2016, 23, 111–118. [Google Scholar] [CrossRef]
  21. Heath, M.; Sutherland, C.; Bartel, K.; Gradisar, M.; Williamson, P.; Lovato, N.; Micic, G. Does one hour of bright or short-wavelength filtered tablet screenlight have a meaningful effect on adolescents’ pre-bedtime alertness, sleep, and daytime functioning? Chronobiol. Int. 2014, 31, 496–505. [Google Scholar] [CrossRef]
  22. Lockley, S.W.; Evans, E.E.; Scheer, F.A.; Brainard, G.C.; Czeisler, C.A.; Aeschbach, D. Short-wavelength sensitivity for the direct effects of light on alertness, vigilance, and the waking electroencephalogram in humans. Sleep 2006, 29, 161–168. [Google Scholar]
  23. Cajochen, C.; Munch, M.; Kobialka, S.; Krauchi, K.; Steiner, R.; Oelhafen, P.; Orgül, S.; Wirz-Justice, A. High sensitivity of human melatonin, alertness, thermoregulation, and heart rate to short wavelength light. J. Clin. Endocrinol. Metab. 2005, 90, 1311–1316. [Google Scholar] [CrossRef] [Green Version]
  24. Chellappa, S.L.; Steiner, R.; Blattner, P.; Oelhafen, P.; Götz, T.; Cajochen, C. Non-visual effects of light on melatonin, alertness and cognitive performance: Can blue-enriched light keep us alert? PLoS ONE 2011, 6, e16429. [Google Scholar] [CrossRef]
  25. International Data Corporation (IDC). Worldwide Wearables Shipments Surge 94.6% in 3Q 2019 Led by Expanding Hearables Market, Says IDC. Available online: https://www.idc.com/getdoc.jsp?containerId=prUS45712619 (accessed on 24 March 2020).
  26. Kemp, S. Digital 2020: Global Digital Overview. 2020. Available online: https://datareportalcom/reports/digital-2020-global-digital-overview (accessed on 24 March 2020).
  27. Wang, Z.W. The Design and Verifcation Sleep Assistant of Light System for Lunch Break. 2019. Available online: https://hdl.handle.net/11296/2wn6r5 (accessed on 27 September 2019).
  28. Hsieh, P.H. The Influence of Dynamic Lighting on Human Sleep. 2018. Available online: https://hdl.handle.net/11296/39v97h (accessed on 30 August 2019).
  29. Tai, W.Y. The Influence of Lighting on Human Circadian Rhythms. 2016. Available online: https://hdl.handle.net/11296/qn6nb2 (accessed on 30 August 2020).
  30. Recommendation ITU-R BT.500-13. Methodology for the Subjective Assessment of the Quality of Television Pictures; BT Series; Electronic Publication: Geneva, Switzerland, 2012.
  31. Institute of Labor, Occupational Safety and Health, MOL. Introduction to the Human Body Measurement Database and Important Measurement Value. 2014. Available online: https://www.ilosh.gov.tw/menu/1188/1201/%E4%BA%BA%E9%AB%94%E8%A8%88%E6%B8%AC%E8%B3%87%E6%96%99%E5%BA%AB/%E4%BA%BA%E9%AB%94%E8%A8%88%E6%B8%AC%E8%B3%87%E6%96%99%E5%BA%AB%E7%B0%A1%E4%BB%8B%E5%8F%8A%E9%87%8D%E8%A6%81%E8%A8%88%E6%B8%AC%E5%80%BC/ (accessed on 12 April 2022).
  32. Commission Internationale de l’Eclairage. CIE System for Metrology of Optical Radiation for ipRGC-Influenced Responses to Light; CIE: Vienna, Austria, 2018; Available online: https://cie.co.at/publications/cie-system-metrology-optical-radiation-iprgc-influenced-responses-light-0 (accessed on 12 April 2022).
  33. Zimmerman, D.W. Teacher’s corner: A note on interpretation of the paired-samples t test. J. Educ. Behav. Stat. 2017, 22, 349–360. [Google Scholar] [CrossRef]
  34. Fradette, K.; Keselman, H.J.; Lix, L.; Algina, J.; Wilcox, R.R. Conventional and robust paired and independent-samples t tests: Type I error and power rates. J. Mod. Appl. Stat. Methods 2003, 2, 22. [Google Scholar] [CrossRef]
  35. Wilcox, R.R. ANOVA: A paradigm for low power and misleading measures of effect size? Rev. Educ. Res. 1995, 65, 51–77. [Google Scholar] [CrossRef]
  36. St, L.; Wold, S. Analysis of variance (ANOVA). Chemom. Intell. Lab. Syst. 1989, 6, 259–272. [Google Scholar]
  37. Koudelková, Z.; Strmiska, M. Introduction to the identification of brain waves based on their frequency. In MATEC Web of Conferences; EDP Sciences: Les Ulis, France, 2018; Available online: https://www.matec-conferences.org/articles/matecconf/pdf/2018/69/matecconf_cscc2018_05012.pdf (accessed on 12 April 2022).
  38. Sih, G.C.; Tang, K.K. On-off switching of theta–delta brain waves related to falling asleep and awakening. Theor. Appl. Fract. Mech. 2013, 63, 1–17. [Google Scholar] [CrossRef]
  39. Lombardi, F. Clinical implications of present physiological understanding of HRV components. Card. Electrophysiol. Rev. 2002, 6, 245–249. [Google Scholar] [CrossRef]
  40. Saul, J.P.; Arai, Y.; Berger, R.D.; Lilly, L.S.; Colucci, W.S.; Cohen, R.J. Assessment of autonomic regulation in chronic congestive heart failure by heart rate spectral analysis. Am. J. Cardiol. 1988, 61, 1292–1299. [Google Scholar] [CrossRef]
  41. Marino, M.; Li, Y.; Rueschman, M.N.; Winkelman, J.W.; Ellenbogen, J.M.; Solet, J.M.; Dulin, H.; Berkman, L.F.; Buxton, O.M. Measuring sleep: Accuracy, sensitivity, and specificity of wrist actigraphy compared to polysomnography. Sleep 2013, 36, 1747–1755. [Google Scholar] [CrossRef]
  42. US Department of Health and Human Services. Physical Activity and Health. A Rreport of the Surgeon General; US Department of Health and Human Services, Centers for Disease Control and Prevention: Atlanta, GA, USA, 1996. [Google Scholar]
  43. Finlayson, G.D.; Morovic, P.M. Metamer constrained color correction. J. Imaging Sci. Technol. 2000, 44, 295–300. [Google Scholar]
  44. Farokhnezhad Afshar, P.; Bahramnezhad, F.; Asgari, P.; Shiri, M. Effect of White Noise on Sleep in Patients Admitted to a Coronary Care. J. Caring Sci. 2016, 5, 103–109. [Google Scholar] [CrossRef]
  45. Zhou, J.; Liu, D.; Li, X.; Ma, J.; Zhang, J.; Fang, J. Pink noise: Effect on complexity synchronization of brain activity and sleep consolidation. J. Theor. Biol. 2012, 306, 68–72. [Google Scholar] [CrossRef] [PubMed]
  46. Huotilainen, M.; Gröhn, M.; Yli-Kyyny, I.; Virkkala, J.; Paunio, T. Sleep Enhancement by Sound Stimulation; Georgia Institute of Technology: Atlanta, GA, USA, 2015; Available online: http://hdl.handle.net/1853/54210 (accessed on 12 April 2022).
  47. Golrou, A.; Sheikhani, A.; Nasrabadi, A.M.; Saebipour, M.R. Enhancement of sleep quality and stability using acoustic stimulation during slow wave sleep. Int. Clin. Neurosci. J. 2018, 5, 126. [Google Scholar] [CrossRef] [Green Version]
Figure 1. Office experimental environment (a) plan; (b) cutaway view.
Applsci 12 05191 g001
Figure 2. Sleep experimental environment (a) plan; (b) cutaway view.
Applsci 12 05191 g002
Figure 3. Schematic diagram of subjects during typing test.
Applsci 12 05191 g003
Figure 4. Experimental light source measuring equipment UPRtek MK350N PLUS.
Applsci 12 05191 g004
Figure 5. Bio-physiological characteristic information collection equipment MP150 (a) Biopac MP-150 and EEG and ECG physiological signal amplifier host; (b) ACQKNOWLEDGE physiological signal capture record and analysis software, Schematic diagram of physiological signal measurement.
Applsci 12 05191 g005
Figure 6. Biological physiological characteristic information collection equipment wGT3X-BT (a) The WGT3x-BT wrist meter host of ActiGraph; (b) ActiLife analysis software provided by ActiGraph.
Applsci 12 05191 g006aApplsci 12 05191 g006b
Figure 7. TQC Chinese typing test software (a) For typing software interface, the text displayed at the top of the interface should be entered into the blue box at the bottom; (b) At the end of the typing test, the result screen will provide the average word count and error rate at the end of the text.
Applsci 12 05191 g007aApplsci 12 05191 g007b
Figure 8. Ambient light spectrum for the typing test.
Applsci 12 05191 g008
Figure 9. The corneal illuminance spectrum measured by the monitor.
Applsci 12 05191 g009
Figure 10. Segmentation diagram of the backlight panel measurement mode of iPhone X smart mobile device, and measured by UPRtek MK350N Plus, and then further corrected the color.
Applsci 12 05191 g010
Figure 11. Spectrum of backlight element of the smart mobile device iPhone X (a) red light (b) green light (c) blue light.
Applsci 12 05191 g011
Figure 12. Sleeping light spectrum generated by smart mobile devices (a) 1900 K correlated color temperature spectrum (b) 3800 K correlated color temperature spectrum.
Applsci 12 05191 g012
Figure 13. Experimental process. (The typing content topic is different every time, and each subject’s topic is random).
Applsci 12 05191 g013
Figure 14. Dynamic color temperature.
Applsci 12 05191 g014
Figure 15. Schematic diagram of the measurement before the subject’s sleep experiment.
Applsci 12 05191 g015
Figure 16. Subjective questionnaire (* p < 0.05).
Applsci 12 05191 g016
Figure 17. nHFP analysis.
Applsci 12 05191 g017
Figure 18. nLFP analysis.
Applsci 12 05191 g018
Figure 19. LH analysis.
Applsci 12 05191 g019
Figure 20. O1 θ wave analysis (* p < 0.05).
Applsci 12 05191 g020
Figure 21. O2 θ wave analysis.
Applsci 12 05191 g021
Figure 22. O1 δ wave analysis.
Applsci 12 05191 g022
Figure 23. O2 δ wave analysis.
Applsci 12 05191 g023
Figure 24. O1 and O2 energy distribution analysis (* p < 0.05).
Applsci 12 05191 g024
Figure 25. Bracelet sleep efficiency analysis.
Applsci 12 05191 g025
Figure 26. Bracelet sleep latency analysis (* p < 0.05).
Applsci 12 05191 g026
Figure 27. Typing test average word count analysis (* p < 0.05).
Applsci 12 05191 g027
Figure 28. Typing test error rate analysis.
Applsci 12 05191 g028
Figure 29. (a) Lighten Corp. Hi-COB LED 2850 K (b) iPhone X panel light source 2850 K.
Applsci 12 05191 g029
Publisher’s Note: MDPI stays neutral with regard to jurisdictional claims in published maps and institutional affiliations.

