Abstract
In this study, a novel hybrid material based on Polyvinyl Alcohol-Chitosan (PVA-Chi) was made, reinforced with conductive fillers such as the polypyrrole (PPy), Poly(3,4-ethylenedioxythiophene)-poly(styrenesulfonate) (PEDOT: PSS), carbon black (CB), and multi-wall carbon nanotube (MWCNT). In order to observe the mechanical and electrical responses of this composite material, for obtaining composite materials, and to characterize them for the development of applications in engineering, FTIR analysis made clear the different functional groups present in the matrix and the fillers used. Using quaternary mixtures (4 fillers) increased the contact angle, which increased hydrophobicity of the biocomposite. The Nyquist diagram of the analyzed samples showed a decrease in resistance and energy diffusion; the latter because of transferring electrons caused by the conductive polymers CB and the MWCNT. In the mechanical tension tests, Young’s modulus values of 18.386 MPa were obtained, in contrast with the material matrix of PVA-Chi, which showed values of 11.628 MPa. Morphological analysis by SEM showed the materials got were homogeneous. The materials got showed higher electrical conductivity in the OH’s presence and NH2 groups, which could have possible applications in biopolymer electrodes.
1. Introduction
There has been a growing interest in recent years in the development of films based on conductive polymers because of the inherent properties of these materials, such as electrical conductivity and to form composite materials [1,2,3]. Poly vinyl alcohol (PVA) is a material with good structural properties but poor mechanical properties. For this reason, it is usually mixed with biopolymer chitosan (Chi), which, besides improving the mechanical properties of the material, has amino (−NH2) groups, which makes its charge more positive [3,4,5,6,7,8,9]. Recent discoveries associated with conductive polymers have generated great interest recently. One of the most outstanding polymers is the derivative of Poly (3,4-ethylenedioxythiophene) -poly (styrenesulfonate) (PEDOT: PSS); its excellent thermal and electrochemical stability makes it a versatile polymer that can used in supercapacitors, solar cells, and sensors [10,11,12,13,14,15,16]. Besides PEDOT: PSS, there are other conductive polymers of great importance, such as polypyrrole (PPy), which has been widely studied because they have used its good mechanical and electrical properties as a coating for corrosion protection [16,17].
Conductive properties, such as size, flexibility, relatively weak damage in the pro-cessing process, and the ability to maintain their high aspect ratio, have a wide range of applications in the reinforcement of polymers and preparing conductive functional mate-rials [3]. Multi-wall carbon nanotubes (MWCNT), which have very good mechanical properties compared to conventional materials, have been used recently in the manufacturing of composite materials because of their low ratio, since no sizeable amount of reinforcement is needed to achieve significant changes. [18,19]. Carbon black (CB) is carbon allotropy, another conductive material, which has properties that change the mechanical, electrical, thermal, and optical characteristics of the materials over which they dispersed; in addition, these materials benefit from the unique properties of CB, acquiring UV protection, electrical conductivity, opacity, and mechanical reinforcement [20,21]. In 2016, Zhou et al. investigated flexible ternary composite electrodes, in which highly conductive carbon nanotube (CNT) films made with graphene oxide (GO)/polypyrrole (PPy). Electrochemical measurements show that CNT doping in compounds significantly improves the electrochemical performances of GO/PPy electrodes. In addition, they made two symmetrical electrodes with CNT-GO/PPy composite materials coated in carbon nanofibers (CNF), to manufacture a solid-state supercapacitor device, which presented a lightweight, an ultra-fine appearance and great flexibility [19]. In 2018, Wang et al. investigated a novel flexible dielectric compound with carbon nanotube (CNT) and poly (3,4-ethylenedioxythiophene) (PEDOT) through thermo-pressing [22].
The present work aims to get and characterize composite films (not reported) based on a matrix of Polyvinyl Alcohol-Chitosan (PVA-Chi) reinforced with fillers of conductive polymers such as poly pyrrole (PPy), poly (3,4 ethylenedioxythiophene), or PEDOT, carbon black (CB), and multi-wall carbon nanotube (MWCNT). We base the hypothesis on the compatibility of the PVA-Chi matrix with the conductive fillers and the synergetic properties that could arise from the interaction between them. The results of the electrical tests show the acquiring of a material with good conductive properties and, besides this, the mechanical properties allow the material to a biosensor or an electrode [23]. Therefore, it allows this type of conductive composite materials to have a wide range of applications in engineering, such as microelectronic, in the aerospace and automotive industries, etc.
2. Materials and Methods
2.1. Materials
Polyvinyl Alcohol (PVA), ALDRICH (Santa Clara, CA 95054, USA), CAS:9002–89–5, average Mw 8500–124000, 87–89% hydrolyzed. Chitosan (Chi), ALDRICH (Santa Clara, CA 95054, USA), CAS: 9012–89–5, medium molecular weight. Polypyrrole (PPy), ALDRICH (Santa Clara, CA 95054, USA), CAS:30604–81–0, conductivity 10–50 S/cm. Poly(3,4-ethylenedioxythiophene)-poly(styrenesulfonate) (PEDOT: PSS), ALDRICH (Santa Clara, CA 95054, USA), CAS:155090–83–8, 3.0–4.0% of H2O, high degree of conductivity. Multi-wall carbon nanotubes (MWCNT), ALDRICH (Santa Clara, CA 95054, USA), CAS:308068–56–6, >90% carbon-based D × L (110 × 170) nm × 5.9 μm. Carbon black (CB), Chemical MEYER (Tlahuac, 12370 Mexico City, Mexico), CAS: 1333–86–41 with a superficial area of 85 m2/g and 5% moisture. Acetic acid, ALDRICH (Santa Clara, CA 95054, USA), CAS: 64–19–7.
2.2. Methods
Preparation of the PVA-Chi matrix solution
Two grams of PVA were mixed with 20 ml of distilled water. They kept the solution under magnetic stirring at a temperature of 75 °C for 25 min until homogenization; they then added 3 mL of Chi solution to this solution. The Chi solution was prepared by mixing of Chi with a previously prepared solution of 100 ml of acetic acid and distilled water (2% v/v) that was subjected to sonication (ultrasonic homogenization) for 20 h.
PPy filler dispersion
To achieve a good dispersion of PPy particles in the matrix, PPy added in three concentrations (0.1, 0.2 and 0.3 g) to 3 ml of concentrated acetic acid and sonicated for 4 h (ultrasonic homogenization). After sonication, they incorporated it into the PVA-Chi solution by magnetic stirring for 10 min at room temperature.
CB filler dispersion.
It added Carbon black in 2 concentrations (0.1 and 0.2 g), sonicating for 3 h to disperse the particles in the PVA-Chi solution.
PEDOT: PSS and MWCNT dispersion.
The PEDOT: PSS and MWCNT fillers added in two concentrations (0.1 g and 0.2 g in both cases) and incorporated into the PVA-Chi solution by magnetic stirring at a temperature of 40 °C. Besides these conductive polymers, 0.5 ml of Glycerol added to all the samples to act as a plasticizer. The films composed of PVA-Chi with PPy and the fillers (PEDOT: PSS/MWCNT/CB) were made by casting process on a 6 cm diameter petri dish. They allowed the samples to dry at room temperature for 72 h. Table 1 shows the working matrix used for obtaining the composite films. samples are shown in Figure 1.

Table 1.
Working Matrix.
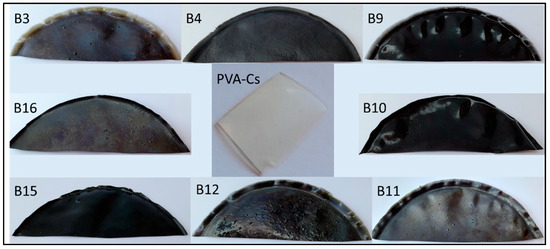
Figure 1.
PVA-Cs/PPy/PEDOT/MWCNT/CB composite Film.
2.3. Characterization
The tensile strength of the materials was evaluated using an INSTRON universal mechanical test machine, model Instron 3340 (825 University Ave Norwood, MA, 02062-2643, US), according to the ASTM D-882 tensile standard for plastic films, at a speed of 30 m/s.
Contact angle was analyzed using a goniometer by placing 1 µL of distilled water on the surface of the film (solid–liquid interface) at a temperature of 23 °C. Photographs of the microdrop were taken with 3 s of exposure time, per triplicate. The photographs, which were taken in triplicate, were processed in the image editor to measure the angle formed by the drop of water on the surface.
Fourier-transform infrared spectroscopy (FTIR) The FTIR analysis was performed using a FTIR Spectrophotometer Perkin Elmer’s Spectrum Two (Chalfont Rd, Seer Green, Beaconsfield HP9 2FX, UK). The wave number range used in the analysis was 400–4000 cm−1 in ATR mode. This analysis allows the identification of functional groups in organic materials, as well as any vibrational changes caused by the interaction between them.
The surface analysis was performed by scanning electron microscopy (SEM) using a JEOL microscope (JSM 6010A, Musashino, Akishima, Tokyo 196-8558, Japan) in SEI mode and 1.5 kV without metal coating.
3. Results
3.1. Tensile Test Results
Table 2 and the Figure 2 shows the results of the mechanical stress–strain tests. PVA and chitosan (Chi) underwent to mechanical tests. They do not show the Chi results because the films showed fragility when manipulated to perform the test. The PVA samples showed a tensile strength of 10.16 MPa with a deformation of 341.44 mm/mm. In the B1 PVA–Chi mixture, Chi caused an increase in tensile strength from the 10.16 MPa of PVA alone to 18.84 MPa for the PVA–Chi mixture. Regarding deformation, Chi in the mixture reduced the percentage of deformation from 341.44 mm/mm for PVA alone to 281.93 mm/mm for the PVA-Chi mixture (shows Figure 3). This could be because of an increase in the formation of hydrogen bridges between PVA chains and Chi, as has reported by Agil Abraham, Soloman P. and Rejini V. (2016) [4].

Table 2.
Statical analysis of Mechanical Properties.
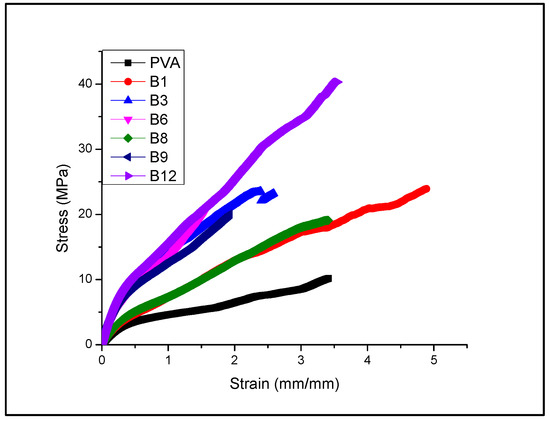
Figure 2.
Plot of stress–strain.
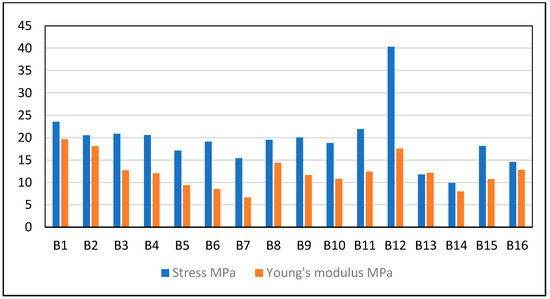
Figure 3.
Plot of Young’s modulus and stress.
The presence of the PPy filler in the PVA–Chi samples increased the mechanical resistance of the composite films, achieving an increase of up to 23.56 MPa in the B4 PVA–Chi/PPy0.3 sample. Although PPy has brittle properties, this did not detract from its contribution to mechanical strength, but it did render the matrix more susceptible to deformation, reducing its elasticity elasticity from 281.93 mm/mm (B1 PVA–Chi) to 254.58 mm/mm (B4 PVA–Chi/PPy0.3). The PEDOT: PSS filler increased the ductility of the materials, while the use of MWCNT improved their mechanical resistance, using a concentration of 0.2 g of each (B6 PVA–Chi/PEDOT: PSS0.2 and B8 PVA–Chi/MWCNT0.2) increased the percentage of deformation and the mechanical resistance of the materials. This did not happen with concentrations of 0.1 g (B5 PVA–Chi/PEDOT: PSS0.1 and B7 PVA–Chi/MWCNT0.1) since there was a percolation concentration at precisely 0.2 g, beyond which the mentioned properties increased. The same results have been reported by Villemin E. and Guo X. (2018) [10,16]. It is important to note that the sample representing the B15 quaternary mixture containing 0.3 g of PPy and 0.1 g of the PEDOT: PSS, CB, and MWCNT fillers showed high deformation and mechanical resistance values. The presence of PPy significantly contributed to increasing the percentage of deformation, while the interaction of the fillers, used in concentrations of 0.1%, gave greater mechanical resistance to the materials. The B15 PVA–Chi/PPy0.3/PEDOT: PSS0.1/MWCNT0.1/CB0.1 sample required a stress of 40.332 MPa for a deformation of 355.252%; thus, it is possible to say that, at these concentrations, the studied fillers improved the resistance to breakage of the material. The Young’s modulus of the materials obtained was determined based on the results of the stress and strain tests. The sample of PVA alone had a Young’s modulus of 8.083 MPa; when adding Chi to the PVA material, the Young’s modulus increased to 10.806 MPa. The molecular structure of Chi gives it physicochemical characteristics that improve the mechanical properties of PVA. This agrees with the results of tensile strength, since Chi was associated with an increase in the mechanical resistance of the material and a decrease in the percentage of deformation. Table 2 shows the results of Tukey’ analysis on the Young’s modulus of the samples, with a significance level of 0.05 for the statistical calculation of the standard deviation.
Increasing the percentage of any of the fillers caused an increase in the Young’s modulus of the material (see Figure 3), which also agrees with the behavior of tensile strength. The B4 PVA–Chi/PPy0.3 film showed better tensile test properties, rigidity, and toughness, with a Young’s modulus of 19.67 MPa, almost double compared to the 10.80 MPa of the PVA–Chi film. These results indicated that there was a positive interaction between PPy and the PVA–Chi material, turning it into a material with potential structural applications. The B15 PVA–Chi/PPy0.3/PEDOT: PSS0.1/MWCNT0.1/CB0.1 material, which contained the four fillers (0.3 g of PPy and 0.1 g each of MWCNT, CB, and PEDOT: PSS) had a Young’s modulus of 17.579 MPa, slightly less than the value for the B4 PVA–Chi/PPy0.3 material, which was 19.67 MPa. This may be since although PPy provided mechanical resistance to the materials, CB and MWCNT particles were dispersed using an ultrasonic bath, which could have affected the molecular structure of the materials.
3.2. Contact Angle
Figure 4 shows the contact angle average results for each of the samples. As the results show, the films had a hydrophilic character, which means that their contact angle was less than 90°. In the samples with a single filler (B2 PVA–Chi/PPy0.1 to B6 PVA–Chi/PEDOT: PSS0.2 samples), either PPy or PEDOT: PSS, the contact angle did not exceed 55°, which indicated that these samples were even more hydrophilic. The use of allotropic carbon fillers (MWCNT or CB) increased the contact angle of the materials from 60° to 62°, which made samples B7 PVA–Chi/MWCNT0.1 to B10 PVA–Chi/CB0.2 more hydrophobic. This may be due to the sp2 hybridization structure of these fillers. However, the quaternary mixture samples B11 to B16 (which contained the 4 fillers) had the highest contact angles, ranging from 64° to 69°. This may be caused by the interaction between the allotropic carbon fillers, which increased hydrophobicity and the other fillers. It is important to note that the polymer matrix materials B1 and B17 had different concentrations of PVA-Chi (28 and 25 mL respectively). The B1 PVA-Chi sample had a contact angle of 63°.
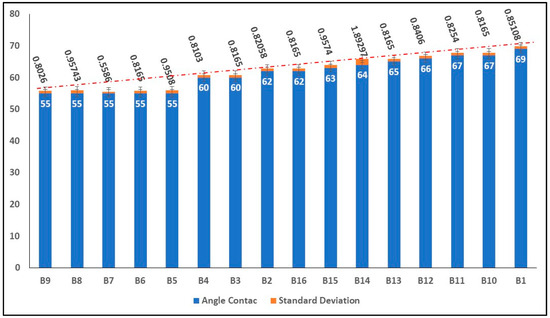
Figure 4.
Result of average Contact angle.
3.3. Surface Analysis by Scanning Electron Microscopy (SEM)
Figure 5 shows the SEM micrographs, in cross section, of the PVA (A) and B1 PVA–Chi (B) films. Adding Chi to PVA made the material homogeneous and uniform, can be observed between PVA and Chi. These results suggest that B1 PVA-Chi material has synergistic properties.
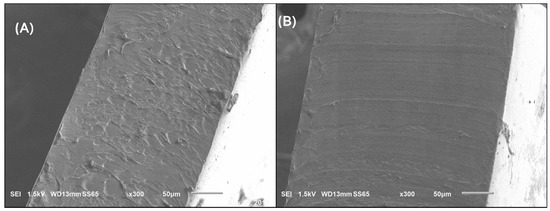
Figure 5.
SEM micrographs (300×) of samples (A) PVA, (B) B1 PVA−Chi.
Figure 6 shows the SEM micrographs of the composite materials of PVA-Chi mixed with conductive polymers (PPy, CB, MWCNT, and PEDOT: PSS). (A), (B), and (C) maintained homogeneity and uniformity, there is good adhesion between the PVA−Chi materials. In the image of the PVA–Chi/CB sample (D) small particles are observed, which may be due to carbon black, which due to their characteristics form dispersed aggregates that are clearly observed in the matrix.
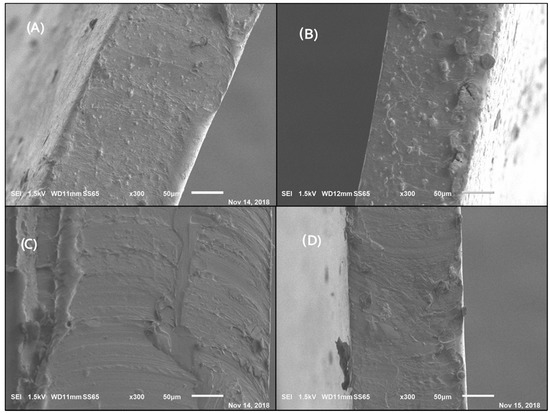
Figure 6.
Micrographs (300×). (A) B3 PVA−Chi/PPy 0.2 g; (B) B6 PVA−Chi/PEDOT: PSS0.2; (C) B8 PVA−Chi/MWCNT0.2; (D) B10 PVA−Chi/CB0.2.
Figure 7 shows SEM micrographs of the composite materials containing the four fillers under study in the PVA–Chi matrix quaternary samples (PVA–Chi/PPy/PEDOT: PSS/MWCNT/CB). As seen, the conductive filler dispersed throughout the matrix. Some micrographs show small particles, probably of carbon black that was not complete-ly dispersed and which formed aggregates instead. Micrographs (A) and (B) show the formation of small protuberances. As seen in (C), (D), and (E) and (F), uni-form and homogeneous films, with good adhesion between the materials.
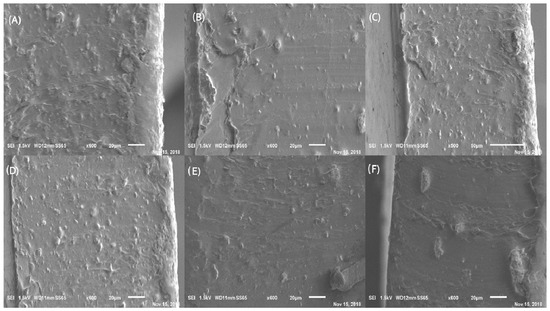
Figure 7.
SEM micrographs (600×). (A) B11 PVA−Chi/PPy0.1/PEDOT: PSS0.1/MWCNT0.1/CB0.1; (B) B12 PVA−Chi/PPy0.1/ PEDOT: PSS0.2/MWCNT0.2/CB0.2; (C) B13 PVA−Chi/PPy0.2/PEDOT: PSS0.1/MWCNT0.1/CB0.1; (D) B14 PVA−Chi/PPy0.2/PEDOT: PSS0.2/MWCNT0.2/CB0.2; (E) B15 PVA-Chi/PPy0.3/PEDOT: PSS0.1/MWCNT0.1/CB0.1; (F) B16 PVA−Chi/PPy0.3/PEDOT: PSS0.2/MWCNT0.2/CB0.2.
3.4. Fourier Transform Infrared Spectroscopy (FTIR–ATR)
Figure 8 shows the FTIR spectrum of the PVA–Chi sample, which represents the film containing only the polymer matrix PVA–Chi. The spectrum showed the following signals: in the region of 3500 cm−1, a stretching vibration of the NH bond; at 3100–3300 cm−1, a stretching vibration of the hydroxyl group −OH from PVA and Chitosan molecules; at 2900 cm−1, a stretching of the C–H bond; at 1790 cm−1, a stretching band of C=O; at 1600 cm−1, a bending vibration of the −OH bond due to the formation of hydrogen bridges as a result of the adsorption of water; at 1050 cm−1, a stretching vibration of the C–O bond in the C–O–C and C–OH groups (these functional groups are present in both PVA and Chi). In samples B2 PVA–Chi/PPy0.1, B3 PVA–Chi/PPy0.2, and B4 PVA–Chi/PPy0.3, in which PPy (0.3, 0.2 and 0.1 g respectively) was added to the PVA-Chi matrix, the FTIR spectra showed a decrease in the signal between 3100 and 3300 cm−1, which corresponded to the stretching of the O–H groups. The stretching vibration of the N–H bond in Chi and PPy is more clearly observed at 3500 cm−1. A sharp signal can also be observed at 1600 cm−1, corresponding to the stretching of the C=C bond in PPy. The signal at 1700 cm−1 corresponds to the stretching of the C=O bond in Chi. There is no significant change in the chemical structure of the components, forming hydrogen bridges.
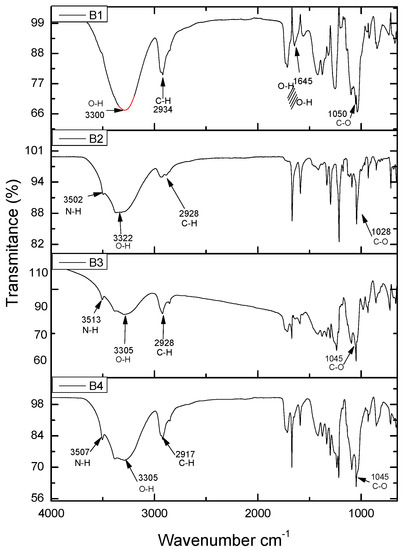
Figure 8.
FTIR analysis of the samples B1 PVA-Chi, B2 PVA-Chi/PPy0.1, B3 PVA-Chi/PPy0.2, B4 PVA-Chi/PPy0.3.
Figure 9 shows the FTIR spectrum of samples B6 PVA–Chi/PEDOT: PSS0.2 to B10 PVA-Chi/CB0.2. These images show the samples with PVA–Chi matrix containing a single filler of either PEDOT: PSS, MWNTC or CB. As can be seen, the spectra are very similar, with no great differences in vibration signals between the mentioned fillers. Figure 10 shows the FTIR spectra of samples B1 PVA-Cs, which contained only the polymer matrix, and of the samples B11 PVA-Chi/PPy0.1/PEDOT: PSS0.1/MWCNT0.1/CB0.1, B12 PVA-Chi/PPy0.1/PEDOT: PSS0.2/MWCNT0.2/CB0.2, B13 PVA-Chi/PPy0.2/PEDOT: PSS0.1/MWCNT0.1/CB0.1, B14 PVA-Chi/PPy0.2/PEDOT: PSS0.2/MWCNT0.2/CB0.2, B15 PVA–Chi/PPy0.3/PEDOT: PSS0.1/ MWCNT0.1/CB0.1 and B16 PVA-Chi/PPy0.3/PEDOT: PSS0.2/ MWCNT0.2/CB0.2, which also contained the four fillers under study (PPy, PEDOT: PSS, MWCNT, and CB).
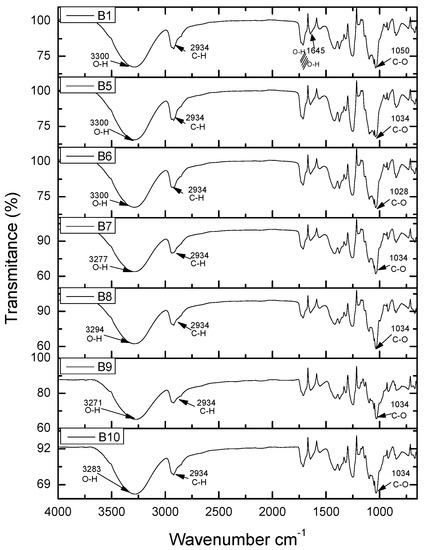
Figure 9.
FTIR analysis of the samples B1 PVA-Chi, B5 PVA-Chi/PEDOT: PSS0.1, B6 PVA-Chi/PEDOT: PSS0.2, B7 PVA-Chi/MWCNT0.1, B8 PVA-Chi/MWCNT0.2, B9 PVA-Chi/CB0.1 and B10 PVA-Chi/CB0.2.
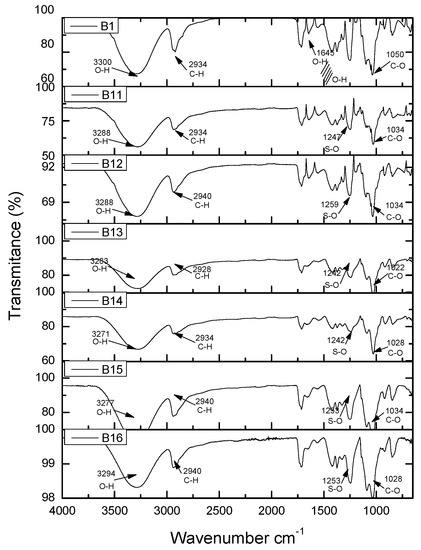
Figure 10.
FTIR analysis of samples B1 PVA-Chi, B11 PVA-Chi/PPy0.1/PEDOT: PSS0.1/MWCNT0.1/CB0.1, B12 PVA-Chi/PPy0.1/PEDOT: PSS0.2/MWCNT0.2/CB0.2, B13 PVA-Chi/PPy0.2/PEDOT: PSS0.1/MWCNT0.1/CB0.1, B14 PVA-Chi/PPy0.2/PEDOT: PSS0.2/MWCNT0.2/CB0.2, B15 PVA-Chi/PPy0.3/PEDOT: PSS0.1/MWCNT0.1/CB0.1, B16 PVA-Chi/PPy0.3/PEDOT: PSS0.2/MWCNT0.2/CB0.2.
3.5. Electrochemical Impedance Spectroscopy (EIS)
The impedance spectra obtained by Electrochemical Impedance Spectroscopy were plotted as a Nyquist diagram and modeled by equivalent circuits.
Figure 11A shows the equivalent circuit for the impedance spectrum of the B1 and B16 samples. This circuit comprises a load Q1 in series, with a load transfer resistance R1, followed by load transfer resistance R2 in parallel with load Q2. This behavior is associated with the ability to transfer load.

Figure 11.
Equivalent circuit (A) R1/(Q1+Q2/R2) and (B) Equivalent circuit R1/(R2 + C2).
This circuit comprises two load transfer resistances R1 and R2 in series followed by a capacitance C2. It can be seen in Figure 12A that there is a small decrease in the intersection with the semicircle, followed by a line; this effect is due to the transfer of electrons, while the line may be due to the limited diffusion process. In Figure 12B, it is possible to see a Bode diagram of magnitude (|Z|) and frequency (Hz); the magnitude starts at approximately 4 × 10⁶ ohm at low frequencies, while at high frequencies the magnitude decreases to 5 × 10⁵ ohm. Regarding the phase angle, an angle close to −10° can be observed at the beginning in the low frequency region; the phase angle then decreases until reaching −80°. This is because PVA reduces resistive behavior, which results in the predominance of capacitive behavior. Figure 12B shows the presence of a semicircle but at a lower frequency, indicating a transfer of electrons. This is followed by a line that could indicate energy release, since the molecular structure of PPy has double bonds (C=C) alternating with C–C bonds, forming conjugated structures along the chain that allow the transfer of electrons.
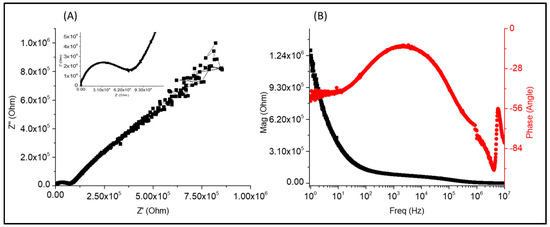
Figure 12.
Diagrams of (A) Nyquist and (B) Bode for the B4 PVA-Chi/PPy0.3 sample.
Figure 13 shows the diagrams for the B11 sample. Compared with the PVA-Chi/PPy0.1/PEDOT: PSS0.1/MWCNT0.1/CB0.1 sample. The Nyquist diagram in 13 shows a semicircle indicating load transfer, followed by a pseudo-line indicating energy release. The Bode diagram of magnitude (|Z|) and frequency (Hz) in 12 (B) shows an initial magnitude of 4×10⁴ ohm that decreases to 0 ohm and then remains constant. At lower frequencies, the phase angle remains constant at -85° but increases up to 10° at high frequencies it. The sample has a resistive behavior due to the presence of amino groups in the molecular structure of Cs and PPy, which generate a positive charge. PEDOT also contributes to the resistive behavior; it is considered an electroactive polymer due to the presence of interlocking polymer chains that allow the passage of cathodic charges.
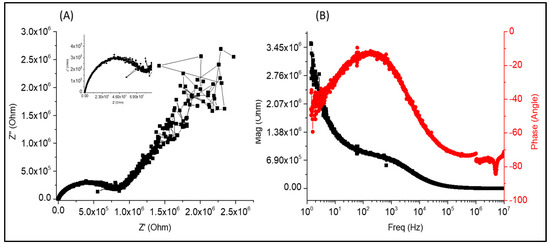
Figure 13.
Diagrams of (A) Nyquist (B) Bode for the B11 PVA-Chi/PPy0.1/PEDOT: PSS0.1/MWCNT0.1/CB0.1 sample.
They analyzed the electrical conductivity of the materials as a function of frequency. They recorded the maximum conductivity in the B11PVA-CS/PPy0.3/PEDOT:PSS0.2/MWCNT0.2 sample, with approximately 6E6 Hz and 562 S/m. The samples B1PVA-CS/PPy0.3, B2PVA-CS/PPy0.2, B3PVA-CS/PPy0.1, B4PVA-Cs/PEDOT:PSS0.2, B5PVA-Cs/PEDOT:PSS0.1, B11PVA-CS/PPy0.3/PEDOT:PSS0.2/MWCNT0.2, B13PVA-CS/PPy0.2/PEDOT:PSS0.2/MWCNT0.2,B14PVA-CS/PPy0.2/PEDOT:PSS0.1//MWCNT0.1//CB0.1 showed a phenomenon in which PPy and PEDOT:PPS, mainly because they have higher affinity between them, and this led to a greater dispersion of energy to nearby frequency 6E6 Hz, and to functional groups such as -OH. The hydrogen bonds increased the connections between the fillers and short-circuits in the connections. This caused the fillers to release energy, as seen in Figure 14.
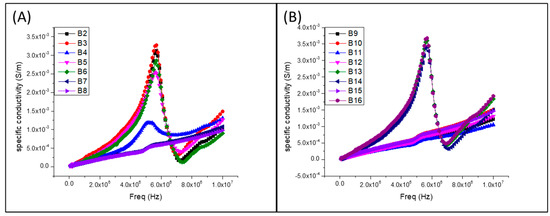
Figure 14.
Plots of the conductivities of the samples. (A) PVA-CS/PPy0.1, PVA-CS/PPy0.2, PVA-CS/ PPy0.3, PVA-Cs/PEDOT:PSS0.1, PVA-Cs/PEDOT:PSS0.2, PVA-Cs/MWCNT0.1, PVA-Cs/MWCNT 0.2. (B) PVA-Cs/CB0.1, PVA-Cs/CB0.2, PVA-CS/PPy0.1/PEDOT:PSS0.1//MWCNT0.1/CB0.1, PVA-CS /PPy0.1/PEDOT:PSS0.2/MWCNT0.2/CB0.2, PVA-CS/PPy0.2/PEDOT:PSS0.1//MWCNT0.1/CB0.1, PVA-CS/PPy0.2/PEDOT:PSS0.2/MWCNT0.2/CB0.2, PVA-CS/PPy0.3/PEDOT:PSS0.1 //MWCNT0.1 /CB0.1, PVA-CS/PPy0.3/PEDOT:PSS0.2/MWCNT0.2/CB0.2.
The quaternary samples (see Figure 14B) that were characterized (B11, B12, B13, B14, B15, and B16) showed properties of greater electrical conductivity, B12 with the stress of 40.33 MPa, however, the material with the highest conductivity was B11, it also showed a valued effort within the average of the other samples. All samples showed deformation above 200 mm/mm.
4. Discussion
Using the PVA-Chi matrix provided elasticity advantages that Chi alone lacks, acting as a plasticizer of Chi, because this material is fragile and brittle, increasing the percentage of plastic deformation. Showing an affinity between the two polymers. In the mechanical part of the composite material analyzed, first the test to the PVA-Chi matrix, with a standard error in Young’s modulus of 0.06477 providing between the series and samples traceability between samples, comparing B1 exceeded all samples except B12 showing a higher value stress to tension. Observing the SEM micrograph of the PVA-Chi observed that the Chi, integrated to the PVA compared to the PVA the cross section shows reliefs that in the micrograph of Figure 2 does not show, on the contrary, observing in the micrography, a smooth surface. In samples B2 to B4 with a PPy content of 0.1, 0.2, 0.3, respectively, a slight increase in mechanical strength with a slight change in deformation, this was observed in Young’s Modulus, in samples B7 and B8 shown with MWCNT and the samples with CB B9 and B10 there are no major changes within the matrix in terms of mechanical properties, If we observe the mechanical properties there was not a great change, where an abrupt change using PEDOT: PSS these samples showed a decrease effect in the mechanical properties (see Figure 2). In the morphological part in the micrograph of Figure 3 and Figure 4 PPy aggregates formed, different from those formed in because of CB, in shape and size, for the samples with PEDOT: PSS, looking at in the micrograph of Figure 3, a small gap observed that can be a separation between the PVA-Chi. The samples that contained the four fillers showed vibration signals at 3100–3500 cm−1, which corresponded to the stretching of the O–H bond. At 1600 cm−1, it is possible to see O–H hydrogen bridges bending because of the interaction between the fillers and the PVA-Chi matrix. The stretching of the C–O bond at 1000 cm−1 is also visible; this was because of the presence of C–OH groups. This agrees with the mechanical strength results, since samples B11 PVA-Chi/PPy0.3/PEDOT: PSS0.2/MWCNT0.2/CB0.2 and B12 PVA-Chi/PPy0.3/PEDOT: PSS0.1/MWCNT0.1/CB0.1 showed high mechanical strength, which reached up to 40.33 MPa, as shown by the results of the mechanical stress test.
The Bode diagram from Figure 12B of magnitude (IZI) and frequency (Hz) shows that, at lower frequencies, the magnitude starts at approximately 1.3 × 10⁶ ohm, while at high frequencies it reaches almost 0 ohm and remains constant. In the Bode diagram of phase angle (θ) and frequency (Hz), the sample behaves differently because there is an angle offset at lower frequencies; the angle starts at approximately 20° and decreases to −100°. The angle offset attributed to the formation of PPy aggregates in the composite material. The opposite occurs at high frequencies; the phase angle starts at −100° and increases up to −55°, which can attribute to amino (−NH2) groups in Chi and PPy that can be proton by the −OH groups in the PVA, thus gaining a positive charge.
The Nyquist diagram in Figure 13A shows a semicircle showing load transfer, followed by a pseudo-line indicating energy release. The Bode diagram of magnitude (|Z|) and frequency (Hz) in Figure 13B shows an initial magnitude of 4 × 10⁴ ohm that decreases to 0 ohm and then remains constant. At lower frequencies, the phase angle remains constant at −85° but increases up to 10° at high frequencies. The sample has a resistive behavior because of the presence of amino groups in the molecular structure of Chi and PPy, which generate a positive charge. PEDOT also contributes to the resistive behavior; they consider it an electroactive polymer because of interlocking polymer chains that allow the passage of cathodic charges.
5. Conclusions
The present work is a study of the physical and chemical properties of conductive composite films made from PVA-Chi and 4 fillers (PPy, PEDOT: PSS, MWCNT, and CB). The results showed that the incorporation of PPy improved the mechanical properties and Young’s modulus of the materials. The analysis of the contact angle showed that all the samples, having an angle of less than 90°, had hydrophilic characteristics, but the samples containing the four fillers showed an increase in their hydrophobic character. It is important to point out that the morphological analysis (SEM) showed that the materials obtained are homogeneous, which promoted the interaction between the fillers, as demonstrated by the FTIR analysis, which showed evidence of hydrogen bridges in the quaternary samples (those containing the four fillers). One of the most interesting results concerned the interaction between Chi and PVA. The literature reports that Chi improves the mechanical properties of PVA, that is, it increases its Young’s modulus. Indeed, in the present work Chi improved the mechanical properties of PVA, but the best mechanical properties were observed in the B15 PVA-Chi/PPy0.3/PEDOT: PSS0.1/MWCNT0.1/CB0.1 sample, a PVA-Chi material mixed with the four fillers under study. This mixture was made of B15 PVA-Chi/PPy 0.3/PEDOT 0.1/MWCNT 0.1/CB 0.1, and it achieved a Young’s modulus of 17.743 MPa, a maximum tensile strength of 40.332 MPa and a deformation of 355.252%, compared to the B1 PVA-Chi sample, which had a Young’s modulus of 10.858 MPa, a maximum tensile strength of 18.481 MPa and a deformation of 281.932%.
The Nyquist diagram generated with the data from electrical tests showed that the materials containing the fillers under study had decreased resistance due to the transfer of the electrons and the dispersion of the fillers. The Bode diagram showed a different behavior; the samples with higher concentrations of PPy and PEDOT: PSS at higher concentration showed resistive behavior due to the presence of amino groups in PPy and Chi that interact with the free links of PVA and PEDOT to form a more conductive material. The results of the present work provide important information about the possibility of obtaining composite materials with potential applications in microelectronics.
Author Contributions
Conceptualization A.O.-P., A.M.S.-D. and J.N.S.-D.; methodology, A.O.-P., H.H.-C., R.S.-D. and J.N.S.-D.; formal analysis A.O.-P., E.R.-R. and E.M.-C., and J.N.S.-D.; writing—original draft preparation A.O.-P., and J.N.S.-D.; writing—review and editing A.O.-P., V.M.C., and J.N.S.-D.; supervision A.O.-P., V.M.C. and E.R.-R. All authors have read and agreed to the published version of the manuscript.
Funding
The theoretical work reported in this paper was partially funded by Tecnologico Nacional de Mexico/I.T. de Zacatepec, Laboratory of Benemeriata Autonoma Universidad de Puebla, and Centro de Viculacion y transfrencia de Tecnología in BUAP whit acquisition of key TecNM funds 6630.18-p and PRODEP program support with agreement key DSA/103.5/16/7344 in the Facultad de Ing. Química-BUAP.
Institutional Review Board Statement
Not applicable.
Informed Consent Statement
Not applicable.
Acknowledgments
The academic sub-direction of TecNM / IT of Zacatepec for their administrative and management support for this project.
Conflicts of Interest
On behalf of all authors, the corresponding author states that there is no conflict of interest.
References
- Krukiewicz, K.; Chudy, M.; Vallejo-Giraldo, C.; Skorupa, M.; Wieclawska, D.; Turczyn, R.; Biggs, M. Fractal form PEDOT/Au assemblies as thin-film neural interface materials. Biomed. Mater. 2018, 13, 054102. [Google Scholar] [CrossRef]
- Tummalapalli, M.; Berthet, M.; Verrier, B.; Deopura, B.; Alam, M.; Gupta, B. Composite wound dressings of pectin and gelatin with aloe vera and curcumin as bioactive agents. Int. J. Biol. Macromol. 2016, 82, 104–113. [Google Scholar] [CrossRef]
- Huang, Y.; Kormakov, S.; He, X.; Gao, X.; Zheng, X.; Liu, Y.; Sun, J.; Wu, D. Conductive Polymer Composites from Renewable Resources: An Overview of Preparation, Properties, and Applications. Polymers 2019, 11, 187. [Google Scholar] [CrossRef]
- Abraham, A.; Soloman, P.; Rejini, V. Preparation of Chitosan-Polyvinyl Alcohol Blends and Studies on Thermal and Mechanical Properties. Procedia Technol. 2016, 24, 741–748. [Google Scholar] [CrossRef]
- Argüelles-Monal, W.M.; Lizardi-Mendoza, J.; Fernández-Quiroz, D.; Recillas-Mota, M.T.; Montiel-Herrera, M. Chitosan Derivatives: Introducing New Functionalities with a Controlled Molecular Architecture for Innovative Materials. Polymers 2018, 10, 342. [Google Scholar] [CrossRef] [PubMed]
- Bano, I.; Arshad, M.; Yasin, T.; Ghauri, M.A. Preparation, characterization and evaluation of glycerol plasticized chitosan/PVA blends for burn wounds. Int. J. Biol. Macromol. 2019, 124, 155–162. [Google Scholar] [CrossRef] [PubMed]
- El Bourakadi, K.; Merghoub, N.; Fardioui, M.; Mekhzoum, M.E.M.; Kadmiri, I.M.; Essassi, E.M.; Qaiss, A.E.K.; Bouhfid, R. Chitosan/polyvinyl alcohol/thiabendazoluim-montmorillonite bio-nanocomposite films: Mechanical, morphological and antimicrobial properties. Compos. Part B Eng. 2019, 172, 103–110. [Google Scholar] [CrossRef]
- Essel, T.Y.A.; Koomson, A.; Seniagya, M.-P.O.; Cobbold, G.P.; Kwofie, S.K.; Asimeng, B.O.; Arthur, P.K.; Awandare, G.; Tiburu, E.K. Chitosan Composites Synthesized Using Acetic Acid and Tetraethylorthosilicate Respond Differently to Methylene Blue Adsorption. Polymers 2018, 10, 466. [Google Scholar] [CrossRef]
- Garcia, C.E.G.; Martínez, F.A.S.; Bossard, F.; Rinaudo, M. Biomaterials Based on Electrospun Chitosan. Relation between Processing Conditions and Mechanical Properties. Polymers 2018, 10, 257. [Google Scholar] [CrossRef]
- Villemin, E.; Lemarque, B.; Vũ, T.T.; Nguyen, V.Q.; Trippé-Allard, G.; Martin, P.; Lacaze, P.-C.; Lacroix, J.-C. Improved adhesion of poly(3,4-ethylenedioxythiophene) (PEDOT) thin film to solid substrates using electrografted promoters and application to efficient nanoplasmonic devices. Synth. Met. 2019, 248, 45–52. [Google Scholar] [CrossRef]
- Ko, Y.; Kim, J.; Kim, D.; Kwon, G.; Yamauchi, Y.; You, J. Fabrication of Highly Conductive Porous Cellulose/PEDOT:PSS Nanocomposite Paper via Post-Treatment. Nanomaterials 2019, 9, 612. [Google Scholar] [CrossRef]
- Meng, Q.; Jiang, Q.; Cai, K.; Chen, L. Preparation and thermoelectric properties of PEDOT: PSS coated Te nanorod/PEDOT:PSS composite films. Org. Electron. 2019, 64, 79–85. [Google Scholar] [CrossRef]
- Ni, D.; Song, H.; Chen, Y.; Cai, K. Free-standing highly conducting PEDOT films for flexible thermoelectric generator. Energy 2019, 170, 53–61. [Google Scholar] [CrossRef]
- Popov, A.; Brasiunas, B.; Mikoliunaite, L.; Bagdziunas, G.; Ramanavicius, A.; Ramanaviciene, A. Comparative study of polyaniline (PANI), poly(3,4-ethylenedioxythiophene) (PEDOT) and PANI-PEDOT films electrochemically deposited on transparent indium thin oxide based electrodes. Polymers 2019, 172, 133–141. [Google Scholar] [CrossRef]
- Zarrin, N.; Tavanai, H.; Abdolmaleki, A.; Bazarganipour, M.; Alihosseini, F. An investigation on the fabrication of conductive polyethylene dioxythiophene (PEDOT) nanofibers through electrospinning. Synth. Met. 2018, 244, 143–149. [Google Scholar] [CrossRef]
- Guo, X.; Bai, N.; Tian, Y.; Gai, L. Free-standing reduced graphene oxide/polypyrrole films with enhanced electrochemical performance for flexible supercapacitors. J. Power Sources 2018, 408, 51–57. [Google Scholar] [CrossRef]
- Saugo, M.; Flamini, D.O.; Saidman, S.B. Formación electroquímica de películas de polipirrol sobre Nitinol a partir de soluciones de ácido sulfosuccínico. Rev. Mater. 2018, 23, 2. [Google Scholar] [CrossRef]
- Urper, O.; Çakmak, I.; Karatepe, N. Fabrication of carbon nanotube transparent conductive films by vacuum filtration method. Mater. Lett. 2018, 223, 210–214. [Google Scholar] [CrossRef]
- Zhou, H.; Zhai, H.-J. A highly flexible solid-state supercapacitor based on the carbon nanotube doped graphene oxide/polypyrrole composites with superior electrochemical performances. Org. Electron. 2016, 37, 197–206. [Google Scholar] [CrossRef]
- Aydın, E.B.; Aydın, M.; Sezgintürk, M.K. Electrochemical immunosensor based on chitosan/conductive carbon black composite modified disposable ITO electrode: An analytical platform for p53 detection. Biosens. Bioelectron. 2018, 121, 80–89. [Google Scholar] [CrossRef]
- Zhan, P.; Zhai, W.; Wang, N.; Wei, X.; Zheng, G.; Dai, K.; Liu, C.; Shen, C. Electrically conductive carbon black/electrospun polyamide 6/poly(vinyl alcohol) composite based strain sensor with ultrahigh sensitivity and favorable repeatability. Mater. Lett. 2019, 236, 60–63. [Google Scholar] [CrossRef]
- Wang, F.; Zhang, X.; Ma, Y.; Chen, D.; Yang, W. Conductive HNTs-PEDOT hybrid preparation and its application in enhancing the dielectric permittivity of HNTs-PEDOT/PVDF composites. Appl. Surf. Sci. 2018, 458, 924–930. [Google Scholar] [CrossRef]
- Islam, A.; Yasin, T.; Akhtar, M.J.; Imran, Z.; Sabir, A.; Sultan, M.; Khan, S.M.; Jamil, T. Impedance spectroscopy of chitosan/poly(vinyl alcohol) films. J. Solid State Electrochem. 2015, 20, 571–578. [Google Scholar] [CrossRef]
Publisher’s Note: MDPI stays neutral with regard to jurisdictional claims in published maps and institutional affiliations. |
© 2021 by the authors. Licensee MDPI, Basel, Switzerland. This article is an open access article distributed under the terms and conditions of the Creative Commons Attribution (CC BY) license (http://creativecommons.org/licenses/by/4.0/).