1. Introduction
Contemporary infotainment devices are introduced in car interiors to provide crucial information related to the vehicle and different forms of audio–visual entertainment. Yet the number of devices, their position, and the attention-seeking interfaces have multiplied exponentially, following the infotainment trends provided by popular, non-vehicular conduits, such as smartphones and tablets. Notably, such devices were primarily designed to attract the user’s attention, hence not compatible with the driving process. The vehicular devices replicate the incoming information and engross the driver’s situational and spatial awareness through ineffective gazing at the dashboard’s interactive screens. The latter provides a regularly updated stream of information facilitating satellite navigation and incoming mobile communications amongst other systems. As all the aforementioned information conduits are positioned within the vehicular dashboard, which is below the driver’s field of view (FOV), they are forcing the driver to look down, hence these devices are also known as head-down displays (HDD).
Due to their position, they can divert the driver’s concentration from the primary task and result in misjudgment of traffic conditions and vehicle control requirements [
1,
2]. As such, in a collision-prone situation, the driver’s reaction/response time (RT) is reduced significantly [
3,
4,
5]. Amongst the plethora of devices and applications located in the dashboard, some have been particularly distracting as they require the driver’s immediate attention and response, such as mobile phone communication (mobile call and texting), [
6,
7,
8,
9], and navigation guidance systems [
10,
11]. Notably, the imposed cognitive load to the driver in both cases can rapidly reduce the concentration in the main task and result in collisions, as the driver suffers from an attention bottleneck due to the plurality and intensiveness of the incoming information [
8,
9,
12]. Previous and concurrent efforts to raise public awareness with regards to the hazards involved in the inappropriate use of those technologies during driving have not managed to mitigate this issue [
7].
On our earlier work, it was deemed ideal to utilise the vast windshield area in front of the driver’s FOV with the use of a head-up display (HUD) system. The latter reduces the gazing time in the infotainment devices typically positioned in the lower section of the dashboard (i.e., HDD) [
1,
2,
12]. The idea to evolve the AR HUD interface concept and include a direct manipulation interface, based on a gesture recognition system stemmed from previous encouraging results. As such, the driver will not passively receive information and try to control them through the HDD buttons and touchscreens. The latter interaction with the HDD components defies the purpose or reduces the efficiency of a HUD system, as the driver is still required to take the eye-off-the-road and the hands off-the-steering-wheel.
In contrast, the proposed system enables the driver to control the AR symbols through a novel gesture recognition user interface (UI) presented in earlier studies [
4,
13]. The employment of a gesture recognition system that offers to the driver the ability to directly operate the AR symbols projected in the HUD section of the windshield significantly reduces the gazing time off-the-road [
13]. For the evaluation of the system, we have utilised a full-scale, virtual reality (VR) driving simulator, which was customized to accommodate the proposed AR HUD interface. The simulation scenarios were based on real-life accidents which were replicated in the VR driving simulation environment. For this purpose, an instance of the digital twin city of Glasgow and the surrounding motorways was modelled to accommodate the scenarios, increase the immersion and the realism of the simulation. Thirty drivers performed the evaluation and the results are presented analytically in the following sections.
2. Current Issues, System Rationale and Objectives
2.1. Infotainment Systems’ Distraction
A major issue currently hindering the development of in-vehicle infotainment systems is their negative impact towards driver’s attention during driving which increases the probability of accident occurrences [
6,
11,
14,
15]. This issue has been investigated extensively by various studies aiming to provide comprehensive guidelines for the development of the aforementioned devices [
15,
16,
17].
Yet, conveying the digital information that current drivers are accustomed to through their smart-phones and other similar devices, whilst maintaining the driver’s undivided attention to the driving task, remains a challenging task. Notably, the tendency to provide interconnected information to the user and infiltrate every aspect of daily life is currently appearing through the Internet of Things (IoT). IoT integrates the social element of mobility through vehicular interactivity and exchange of information primarily through vehicular ad-hoc network systems (VANETS), [
3,
18]. This phenomenon is expected to increase exponentially and provide a vast number of updating information, from various outlets (i.e., smart home temperature, security cameras, and fire alarm monitoring amongst other), directly to the driver’s infotainment system. This social element of network communication appears as a new segment of IoT, namely the Social Internet of Vehicles (SIoV). SIoV entails and interconnects a diverse spectrum of road users and vehicles which could share a plethora of data including audio, video, messaging, audio communication, and vehicular sensors’ measurements, amongst others [
19,
20].
As such, a system that provides prioritisation of incoming data and appropriate presentation to the driver is required to control and conform these multiple sources of information. Apart from the future complexity of IoT incoming data, a concurrent issue stems from less complex devices such as the smartphones and navigation systems.
Notably, a large number of drivers are indulging in “quick” texting or short communication through their mobile phones which increases the accident probability significantly as shown in previous studies [
10,
21]. Similarly, drivers attempt to reprogram a route on their satellite navigation system or follow provided traffic updates and alternative routes which can be proved equally hazardous to the mobile phone applications [
11,
12]. This major issue of driver distraction by infotainment devices has challenged the automotive and electronics manufacturers to provide a solution. To this end, the above industries have attempted to tackle it by primarily embedding the external devices (smartphones and sat-nav) directly to a more homogenous environment in the vehicles’ dashboards. Although this approach reduced the driver’s multitasking challenge between different devices and interfaces, it still requires the frequent diversion of attention from the driving task to interact with the dashboard section of the car.
Apart from the driving function, which can be defined as the primary task, all the new infotainment systems are falling under the category of secondary tasks. Depending on the amount of attention and interaction required, the secondary functions can be defined through a scale of 1–5 with five requiring the maximum driver attention [
22]. These five groups are manual only, manual primarily, visual only, mostly visual and visual-manual, respectively. The latter subgroup has a highly attention-seeking propensity and requires both visual and manual interaction [
22] intensively.
As such, the visual–manual subset covers the majority of smartphone applications and navigation systems typically found in a vehicular dashboard. As the dashboard estate hosts the majority of these devices and is physically located on the lower part of the driver’s FOV, the driver increases dramatically the eyes-off-the-road time duration which consequently increases the collision probability [
21,
22]. Previous studies presented an alternative, namely HUD, that could alleviate such issues and could utilise the windshield estate [
23,
24,
25,
26,
27]. As stated above, the windshield is currently unused in the majority of the vehicles except for very few, small-size, HUD interfaces introduced in the flagship or bespoke models of high-end car manufacturers. Yet these systems still require visual and, in some cases, manual interaction through the dashboard section and/or the steering wheel, reducing the benefits of the HUD.
2.2. System Design Rationale
Adhering to the above issues and observations, we have evolved our previous AR HUD interface designed to attend to driver’s requests, yet to provide the incoming infotainment data in a safe and accessible manner [
2,
3,
23,
24].
Due to the provided windshield estate and the proximity to driver’s FOV, a HUD solution was deemed essential for a complex set of infotainment systems’ functionalities aiming to minimise driver distraction by controlling the multiple stimuli provided by in-vehicle infotainment devices [
2,
4,
14,
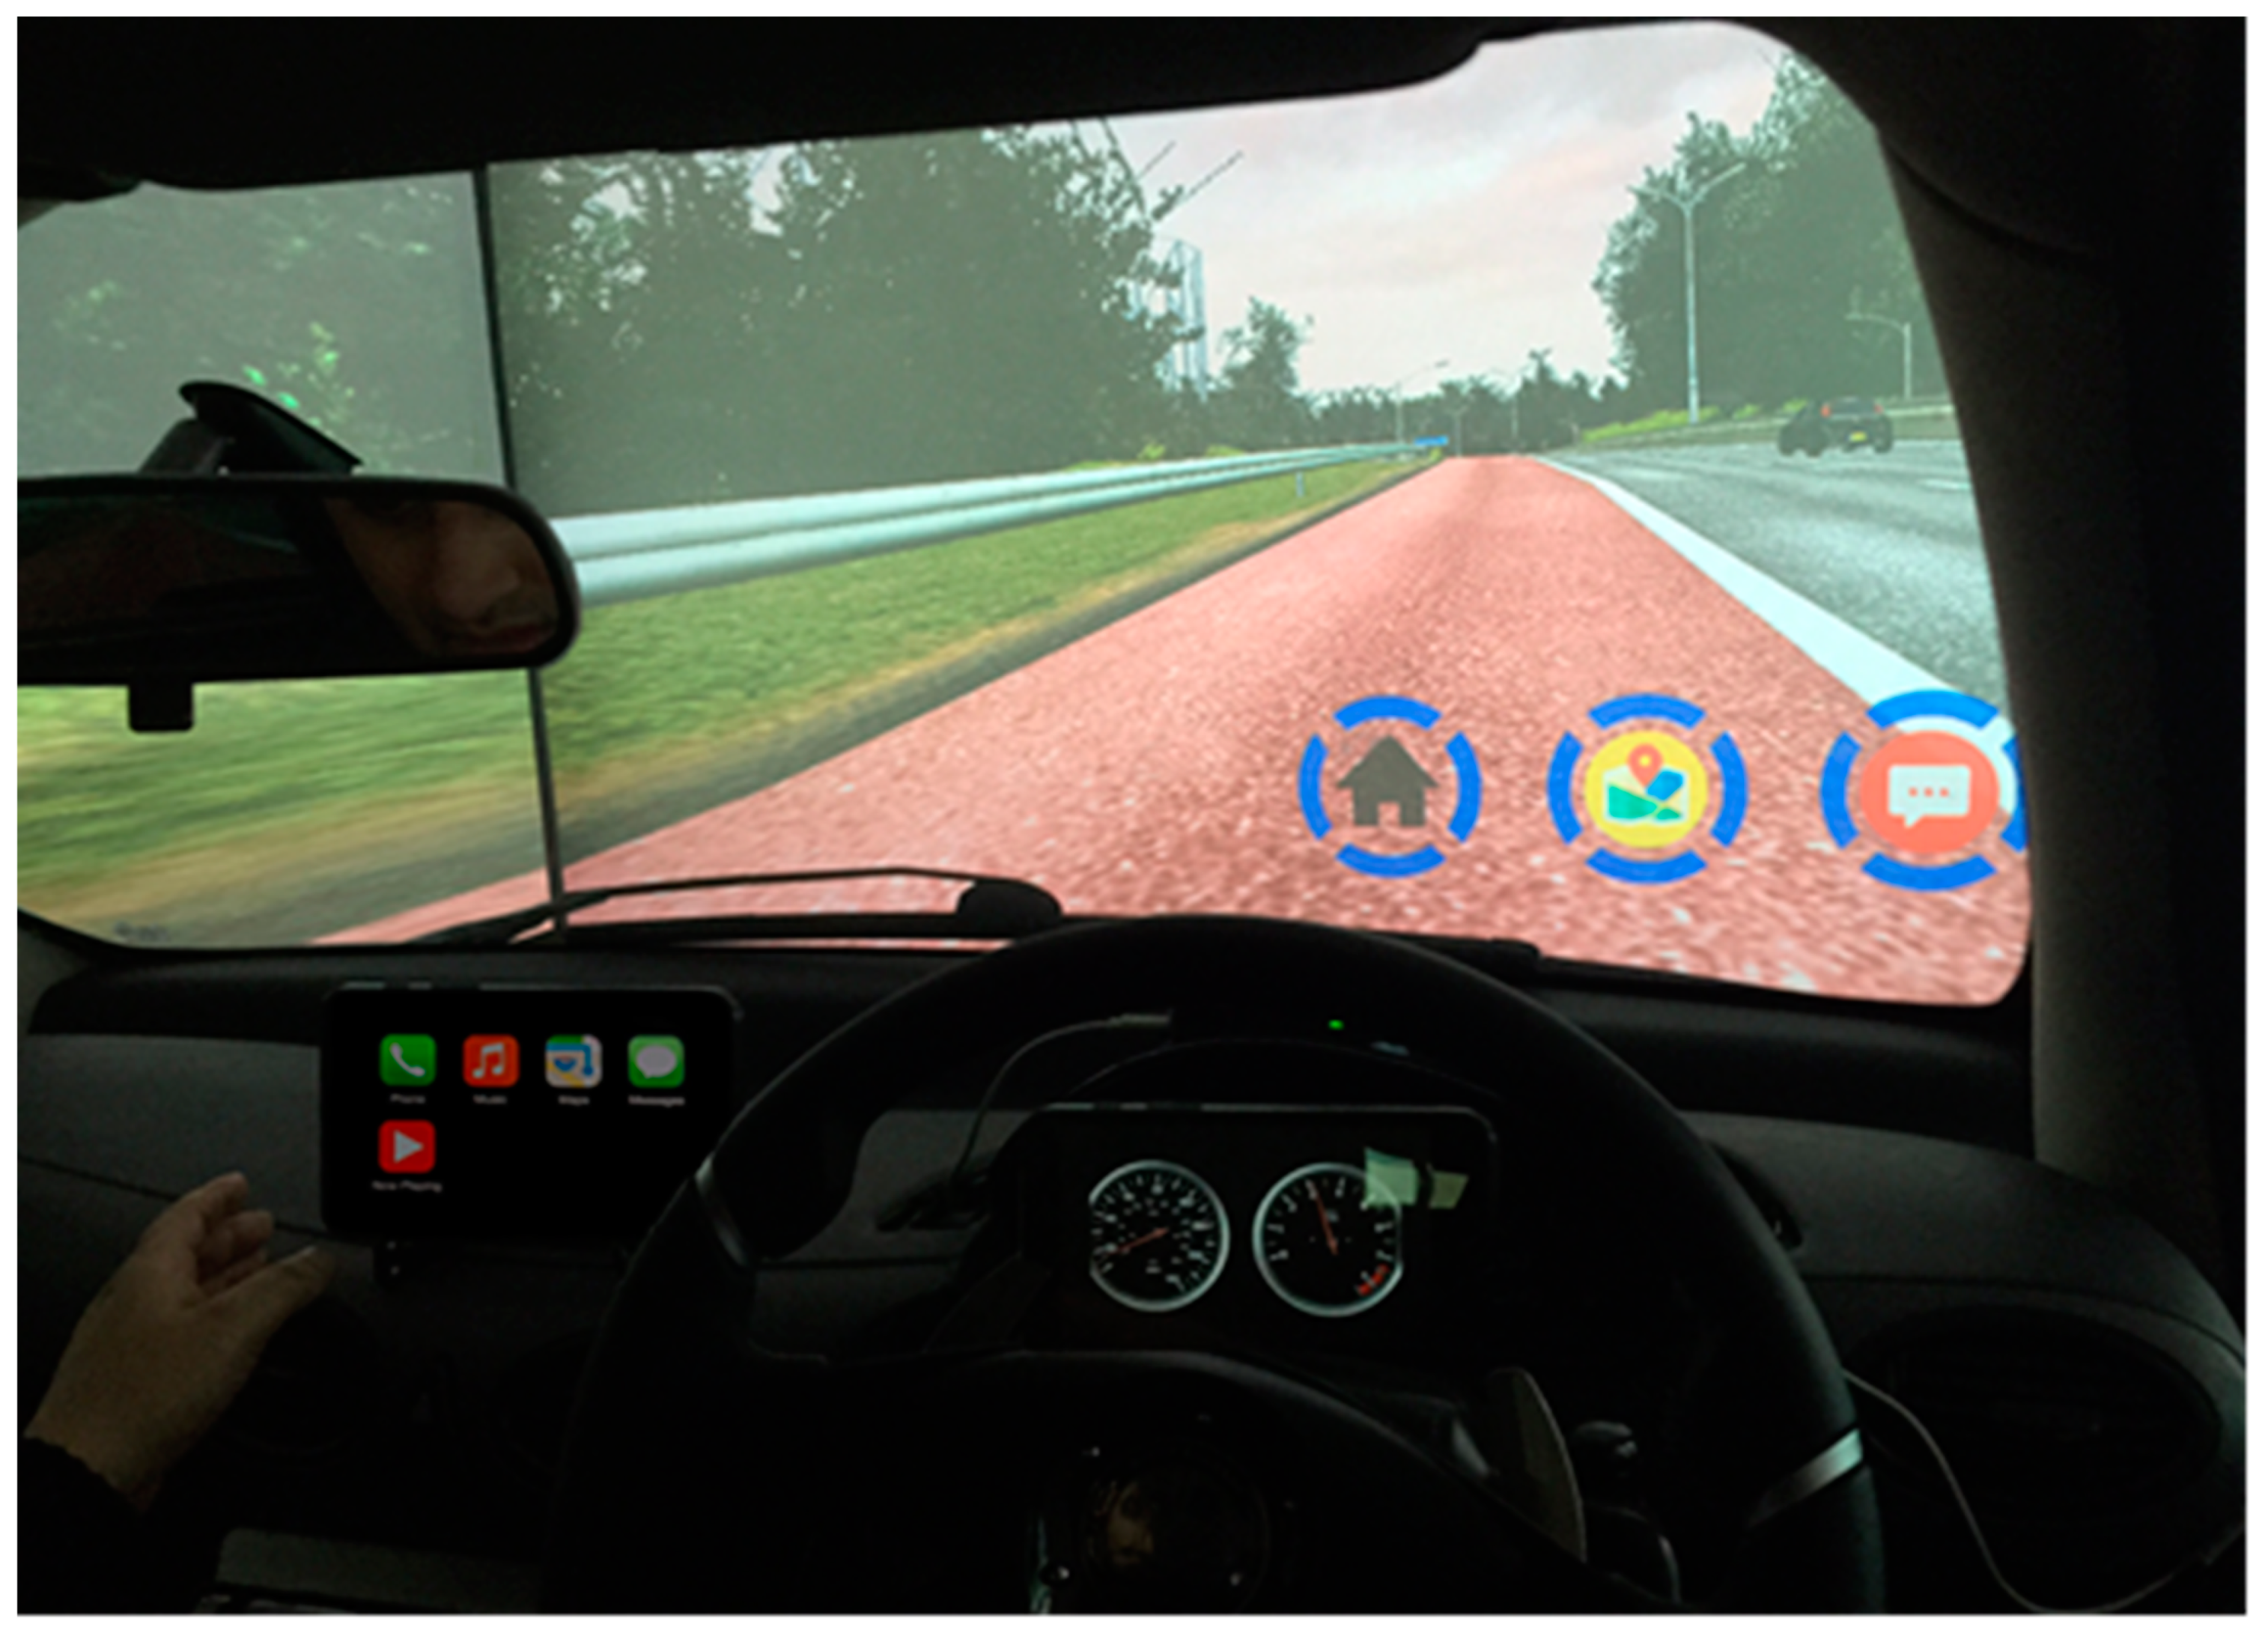
15]. To mitigate the aforementioned issue, we designed and implemented a prototype medium-size, HUD interface which aims to improve driver performance and reduce significantly the eyes-off-the-road effect resulting from the use of infotainment systems as presented in
Figure 1.
Being aware of the limitations posed by the small-factor HUD and the required interactions through dashboard devices, our medium-sized HUD design utilises a more significant segment of the windshield. Previous evaluation results provided an insight into the HUD requirements that improve driver’s response times (RT) and situational awareness during driving under adverse weather conditions and low visibility. They highlighted the improved efficiency of the large-factor and full-windshield HUD interfaces [
1,
2,
23,
28].
Prior studies in the development of efficient and user-friendly AR-HUD interfaces provided a crucial background for the currently proposed system and identified in advance potential design and development issues. A recurrent issue was the lack of interaction with the incoming infotainment data which were presented in the HUD interface [
28,
29]. Similarly, the existing HUD interfaces provided by a large number of automotive manufacturers are plagued with complicated menus and buttons positioned in the HDD space or in awkward to reach positions, around the steering wheel.
The proposed novel HUD interface aims to keep the driver in touch with the incoming information (i.e., mobile phone and navigation system data) whilst maintaining a driver’s focus on the primary task of driving and alleviating the cognitive load of the in-vehicle infotainment systems.
2.3. Implementation Rationale
The combinatory approach of a HUD and a gesture interface intent to facilitate the multiple and diverse infotainment systems that currently distract the driver. Moreover, the mobile and wireless communication systems and protocols have come under intense research focus in concert with the continuing development of mobile services, applications, and devices offering a broader spectrum of communication conduits to the users [
18,
30].
As this technology progresses at a faster rate than its integration to the vehicles by the automotive industry, a large segment of the concurrent car-market, namely used and older vehicle-models, will require a retrospective integration. In particular, the used vehicles’ market is significantly larger, representing sales numbers of used versus new models in the ratio of 3:1 in the UK, 2.6:1 in the US, 2.4:1 in France, and 2:1 in Germany, amongst other countries with similar market trends [
31]. Notably, any further financial turbulence in worldwide or national level increases further this ratio difference in favour of the used cars market.
As such, the provision of an off-the-shelf consumer electronic system presents a viable option for retrofitting to older vehicle fleets. This resolves a major issue in which most of the older vehicles are becoming disassociated from the current driver’s digital ecosystem due to incompatibility between the vehicular electronics/infotainment systems and the latest mobile technologies. As the proposed system aims to increase the safety and regulate the use of the latter devices in the car, this retrospective compatibility offers democratisation of technology and enhances the socioeconomic equality. To this end, the proposed HUD system offers a combinatory approach of existing hardware components and proprietary software. The point of using readily available hardware was to avoid the reliance on each automotive manufacturer’s proprietary systems.
The proposed HUD system could be devised in an adaptable and flexible positioning of the individual hardware components (i.e., glass combiner, mini-HUD projector, micro-computer unit, and gesture recognition sensor). The in-house developed software will also aid the user in the system calibration and alignment between the components, accommodating the different design aspects of various dashboards and instrumentation panel hubs. A prototype version was utilised for the simulation and evaluation of the system.
Consequently, the complete and streamlined version of the system will be transferable to new vehicles as well, either as a retrospective system or as a bespoke system directly embedded to new vehicle models during the manufacturing process.
2.4. Objectives
Adhering to the above observations, the aim of the proposed AR HUD system is to reduce the driver’s distraction by the current attention-commanding infotainment devices to improve driver safety. To achieve this, the researchers have employed various emerging technologies and strategies in the system design and have evaluated a prototype system within a VR simulation environment. The main research objectives for this work are the following:
Design interrupt strategies that could regulate the incoming information from various sources. These strategies will collect, categorise, and prioritise the incoming data, and release it at safe intervals/points.
Provide a minimalistic visual interface (AR) which will be projected in a visible yet non-distractive position within the driver’s field of view through a medium-size HUD system. This aims to enable the driver to maintain eyes on the road whilst receiving data or interacting with the HUD interface.
Employ gesture recognition for the interaction with the AR visual interface through the minimal movement of the hands, aiming to maintain hands at the steering wheel at all times.
Evaluate the system in a VR simulator, collecting data on collision occurrence, speed, lane positioning, distance from neighbouring vehicles, and driver’s response times, with a typical HDD versus the prototype HUD interface.
The evaluation will further assess the proposed system’s acceptability and perceived ease of use and safety.
The following section presents the implementation of the aforementioned objectives, the development process and challenges encountered during the design and development of the proposed system.
4. Evaluation Method and Simulation Requirements
To illustrate the domain adaptation problem and our proposal, we embedded the proposed AR HUD interface in our fourth generation VR driving simulator. The simulator is designed to be customisable and to accommodate different in-vehicle systems and interfaces that require evaluation in various driving conditions, road networks, and traffic flow scenarios.
The evaluation process entailed a pre-test questionnaire aiming to gather information regarding driving experience, mobile and computer technologies, as well as driving habits and other demographic information such as age and gender amongst others. In turn, the users were introduced to the driving simulator and they were provided with 10 min approximately to familiarise themselves with the simulation system. During the familiarisation process, the drivers experienced a collision-scenario free traffic flow in sunny/clear weather conditions. After the familiarisation round, each user drove the simulation with and without the HUD interface. The order was selected randomly for every user to minimise trial order bias.
On the final third stage of the evaluation process, commencing the actual driving simulation, each user was provided with a post-test questionnaire aiming to acquire the driver’s subjective feedback regarding the usability of the proposed system. A succinct de-briefing session completed the acquisition of the user’s feedback. It offered an opportunity for users to provide further suggestions and thoughts related to their experience with the proposed AR HUD interface.
The drivers’ and systems’ performance were measured primarily by the number of collisions that occurred per trial, yet the simulator recorded several other human responses and performance variables during each simulation. These measurements were recorded continuously, providing a refined view of the driving patterns and accident propensity that arose throughout every moment in the simulation [
2,
23].
The subjective feedback questionnaires were designed to respond to an explicitly designed for the purpose, technology acceptance model (TAM). This customised TAM was intended to identify and quantify the drivers’ system experience and their intention to accept and adopt this technology for future vehicles or incorporate retrospectively on the existing car-models. As this paper is presenting the collision results with and without the proposed AR HUD system as well as the individual driver performance, it is not this paper’s remit to present the TAM analysis.
4.1. VR Driving Simulator
To evaluate the proposed system, we developed a custom VR driving simulator. The latter could offer a controlled environment to experiment safely and ensure the repeatability of the simulation conditions [
23,
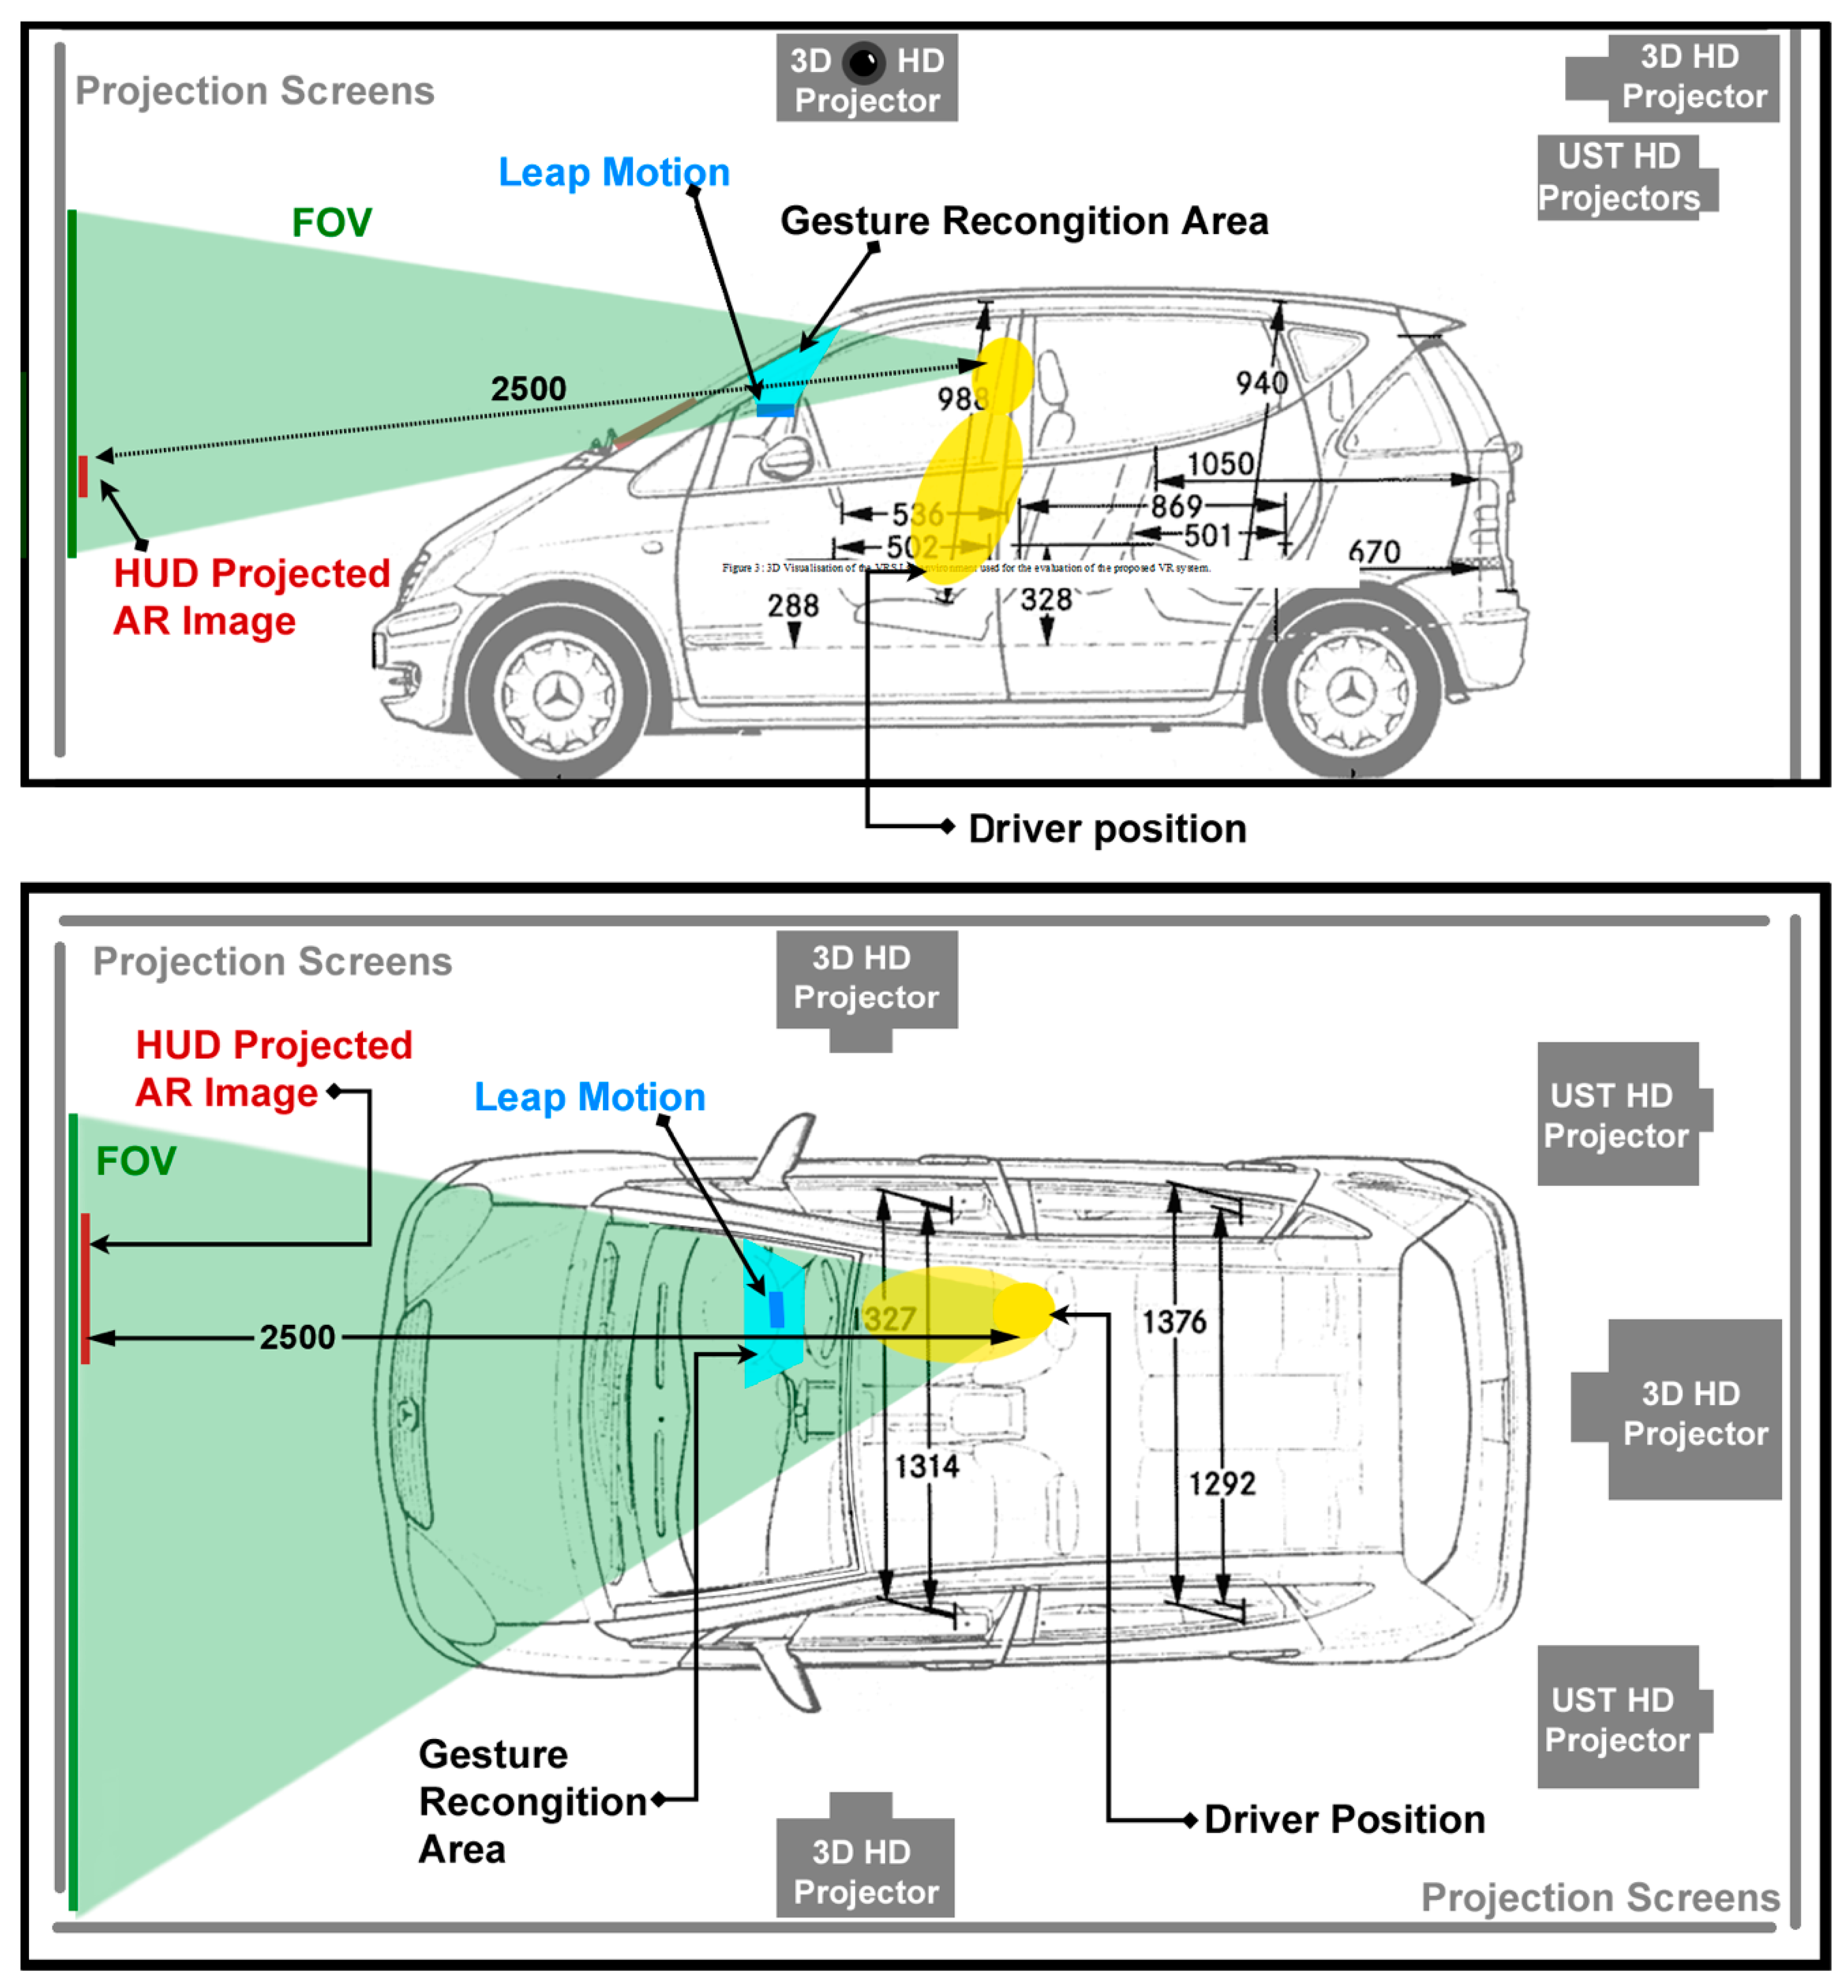
24]. The simulator accommodates a full-scale Mercedes A-Class 2003 car model, which was encapsulated in a Cave Automatic Virtual Environment (CAVE) room, as illustrated in
Figure 7. The CAVE produces a fully immersive experience with 3D high-definition projections on all the surrounding walls. The simulator’s interior was rebuilt to facilitate the testing of vehicular interfaces.
In addition, the simulator interior is equipped and customisable with different types and positions of touchscreens for the simulation of various HDD infotainment systems. The dashboard instrumentation presents fully functional, digital versions, of a tachometer and speedometer. For the particular experiment, a Leap Motion sensor positioned on the top of the dashboard instrumentation hub for the facilitation of the gesture recognition. A 5.1 surround audio system ensures that the driver experiences the environmental noises as well as the engine, gearbox, tyres, and any other related sound during the simulation. Furthermore, the vehicular floor houses a set of vibrating devices providing realistic engine, road and collision vibrations.
The simulation software records for each user trial, the collisions occurred, the driver’s speed, the simulation elapsed time, the lane position, the distance from the lead vehicle, and the neighbouring vehicles every 0.03 s. The derived results are automatically calculated and present the driver’s response times (RT) and headway (HW) during an imminent collision.
As the simulation was not ending at the first collision, the number of collisions per user-trial was also logged. Additionally, the recording of the manoeuvring choices of each driver sketches a clear view of the driving patterns that emerge and the usability of the system under evaluation.
The vehicle interior accommodated the HDD in the form of a lower touchscreen (smart tablet) positioned in the existing screen-space that the manufacturer has provided for such systems which are located in the middle section of the dashboard in relatively close proximity to the user’s extended arm and approximately 720–880 mm from the driver’s eyes [
14,
23].
Evaluation of multiple potential positions has been performed in-depth and results indicate that the following order, F, C, A, D, B, G, and E are the best to worst options as illustrated in
Figure 8 [
46]. The selected HDD position, the upper part of the cluster/dashboard (C), used in this experiment, is the second-best position following the HUD projected in front to the driver’s field of view (FOV) [
46]. Notably, any other HDD position results in worse results for the HDD users as presented in previous studies [
46,
47,
48]. In particular, this work compares the best possible HDD position (C) against the proposed HUD (F) which occupies a typical HUD space in the windscreen and appears to be embedded in the environment.
For the proposed HUD, the AR symbols appear at 2.5 m ahead (bonnet level), extending further than the vehicle’s bonnet, an improvement from the previous design to enhance the merging of the information to the external environment and reduce the strain of driver’s focusing between AR information and exterior scene. This position is also identified by other relevant studies as the best position (F) for the projection of a HUD interface [
46,
47].
However, the vast majority of infotainment systems are bound to the HDD space and typically positioned in the spaces D and E of vehicle dashboards. The positioning, size, and accessibility of the infotainment screens are also dependent on the vehicular interior-design style of each manufacturer, which can further differentiate between models. Yet, the inherited positioning issues of the HDDs present a major disadvantage in contrast to HUD interfaces [
2,
5,
23,
46]. Furthermore, the manual type of interaction with the interface affects further the results as the driver’s manual distraction adds onto the visual and cognitive distraction of the position, size, and context of the screens of the HDD [
45]. During the experiment, it was observed that every time that driver takes one hand off the steering wheel to interact with the infotainment screens (HDD), this affects the whole body posture, resulting to an unstable positioning and grip of the remaining hand on the steering wheel [
46].
The interaction with the AR symbols is feasible with a simple gesture, perceived by the Leap Motion device, positioned at the top of the instrumentation hub, behind the steering wheel. This is approximately 500–650 mm from the driver’s head and easily accessible with the driver’s fingertips or minimal arm extension depending on the height and seating position of the driver.
Due to the direct approach and interaction with the HUD interface, the driver’s both hands could remain on the steering wheel. This prevents the issue described above, in which the driver has to take one hand from the steering wheel and change the body posture whilst interacting with traditional HDD interfaces. Notably, all the distances and dimensions are dependent to the driver’s physical dimensions and seating position. During the user trials, the vast majority of the drivers managed to maintain both hands on the steering wheel with minor exceptions that the hand was lifted to “air-click” and AR interface, yet in very close proximity to the steering wheel and without changing the driver’s body posture and balance as illustrated in
Figure 2 [
46].
4.2. Digital Twin City and AI
The VR driving simulator follows on previous successful versions designed for this type of evaluations, yet is improved on graphics realism, artificial intelligence (AI) of the computer-controlled vehicles, and the physics fidelity provided [
2,
15,
49]. Typical, driver’s behavioural patterns were scripted for individual AI vehicles which allowed them to react and manoeuvre around a user driver [
50,
51]. This facilitates seamless interaction between the driver and the suspension of disbelief with regards to the user driver and also stimulates user concentration as they are forced to react to the actions of the AI-controlled vehicular agents. The number of AI vehicles and speeds replicated a typical midday traffic flow during the week. Fluctuations on speed and driving patterns were incorporated to resemble closely real traffic [
50,
51,
52,
53,
54]. The driving patterns utilised for the AI vehicles were provided through consultation with the Strathclyde Traffic Police department [
2,
19,
50,
51,
52]. The particular patterns covered an array of drivers, vehicle types, and styles appearing on the UK motorways [
54]. In addition, the research group retrieved traffic network information, collision scenarios, and statistics through consultation with the Road Safety Framework team and Road Safety Policy team within Transport Scotland [
53]. Different virtual personas were created for the AI-driven vehicles, reflecting the information provided by the aforementioned organisations.
Additionally, these AI-controlled vehicles would create the conditions to engage the user in an accident event as described by the local traffic police [
2,
52]. The latter information is used to simulate the accident scenarios in the precise position that these typically occur in the real-city motorways. The arrival of the driver to the accident occurring zone depends upon previous potential accidents that might occur and the driver’s speed fluctuations.
The current design has several properties which can be configured to determine the behaviour of how an AI vehicle travels on the road. These include the speed, the line of travel, and the variation in the line of travel. Approaching an area that requires a driving behaviour divergent from what is normally employed, the AI vehicles will react depending on the proximity and information provided by the trigger area as illustrated in
Figure 9. Within this area, the vehicles attempt to create an abrupt-breaking of the lead AI vehicle situation which will challenge the user’s response. Prior to some of these challenges, the user receives mobile phone messages or navigational information that intend to distract him/her from the main task. A description of the evaluation scenarios is presented in detail in the following
Section 4.3.
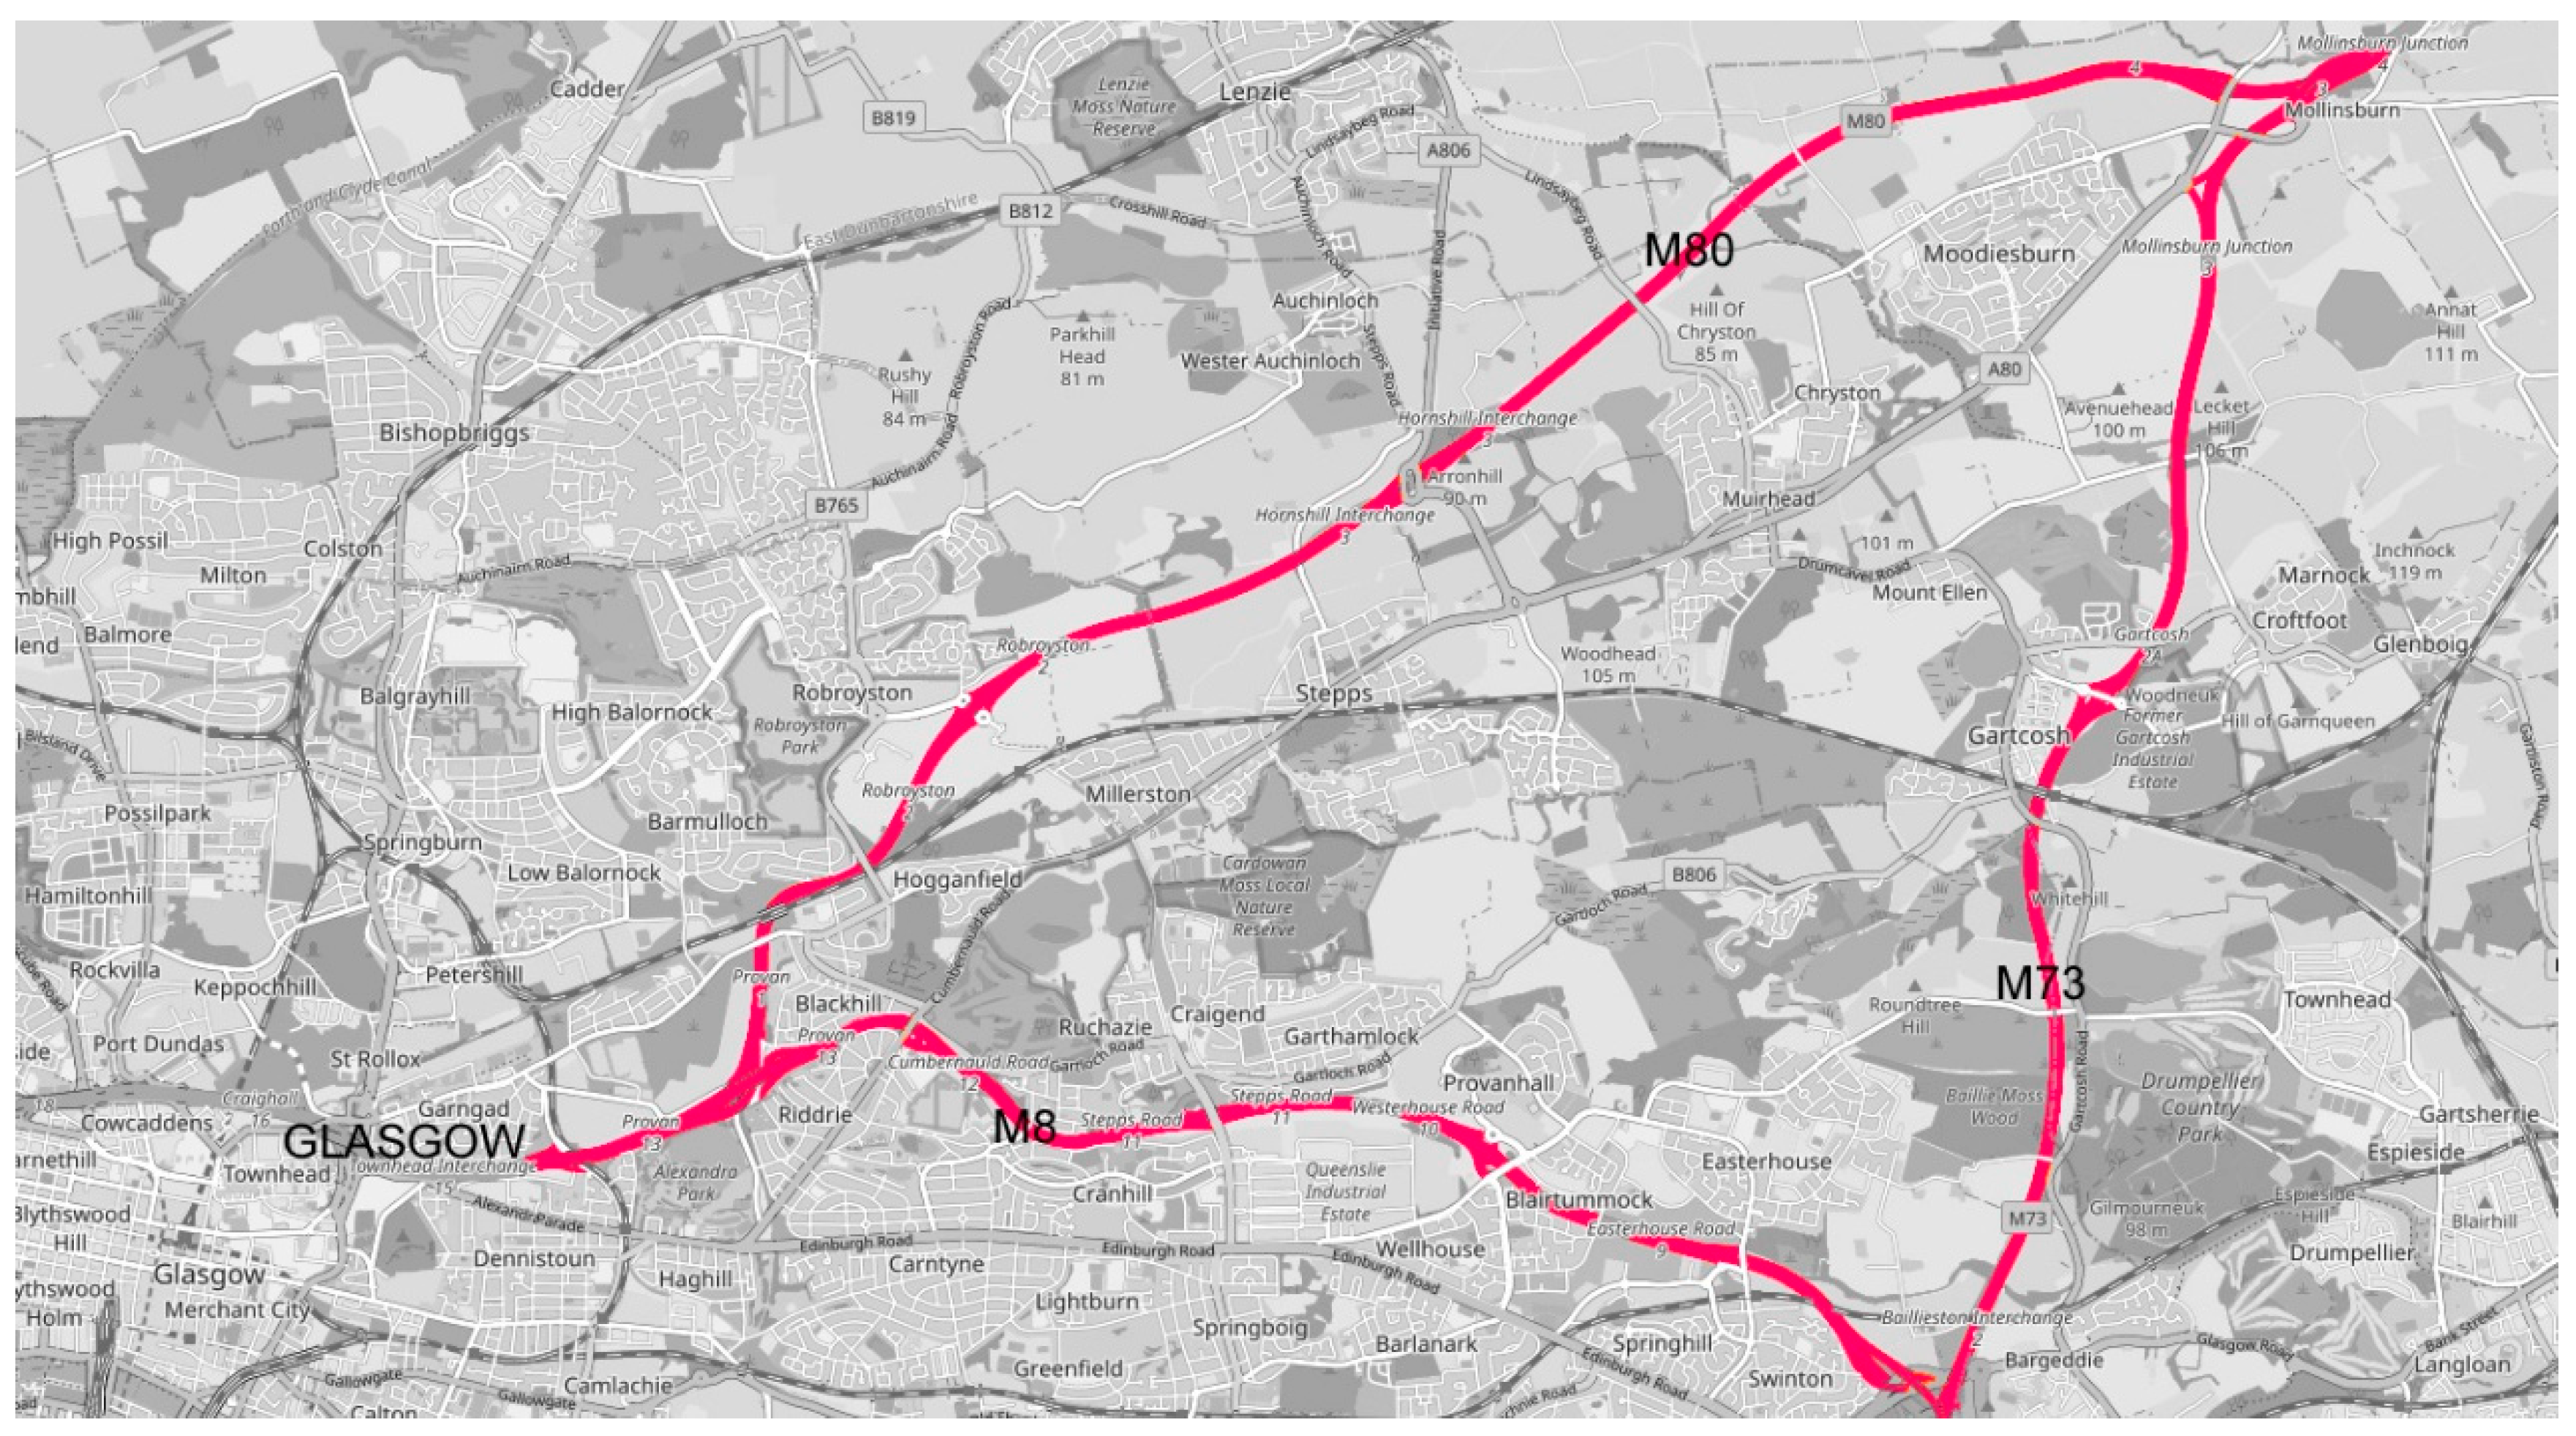
To immerse the driver further, a digital twin of the city of Glasgow’s surrounding motorways has been modelled. The selected routes of M8, M73, and M80 formed a 28 miles triangle which is the busiest part of the road-network connecting Glasgow to Edinburgh and Stirling whilst offering the path to the north in Highlands and to the south towards North England as depicted in
Figure 10.
Due to the size and complexity of the area, the team opted to model only the visible buildings and the landmarks alongside the motorways. For the simulation purposes, the traffic flow of the digital twin model was asynchronous to replicate the particular conditions that lead to an accident.
A synchronous version would have been unusable as predetermined events could not be embedded. As such an instance of the digital twin model representing a typical flow during daytime was utilised for the experiment. As such, the digital twin city section offers a multilayered model that entails architectural information, AI traffic flow, road network, and VANETS simulation data, encapsulating multiple elements that could affect the mobility on the road network [
3,
49,
52,
53,
54]. The asynchronous state of the digital twin offers the flexibility of embedding and testing one or more scenarios and conditions to imitate particular real-life events and provide output for prediction models [
49,
54,
55,
56,
57].
For the development of the digital twin 3D model, the aforementioned road network was modelled with a combination of satellite images, photogrammetry, and video-recordings to provide a photorealistic outcome that could enhance the driver’s immersion as illustrated in
Figure 11. To avoid visualising every road extension stemming from the main motorways, the exits were blocked with police cones which were defined as immovable objects in the simulation. In this way, a continues path of the three connected motorway sections produced a triangular circuit that kept the drivers from wandering in the neighbouring areas.
Other minor approximations were performed to the 3D digital twin model to reduce the graphics’ computational intensity of the real-time VR simulation. Objects, irrelevant to the simulation, such as light-poles, pavements, electric station boxes, and other road furniture, were originally introduced to the simulation scenes but removed as they were affecting the frame per second performance of the VR environment. Maintaining a minimum of 90 FPS was essential to avoid or reduce the participants’ disorientation, nausea, and overall motion sickness.
To improve further the immersion of the users to the simulation environment, the vehicles selected to populate the traffic flow were chosen based on their commonality to the existing vehicles that are typically encountered in these motorways. Police vehicles, lorries, and other distinctive vehicles were also used to seamlessly appear in the three motorways and provide a diverse group of vehicles, to improve the drivers’ familiarisation and immersion in the VR environment.
4.3. Evaluation Scenario
Evaluation of the proposed HUD system was undertaken though a contrasting comparative study between the proposed interface and currently in use systems. Accident scenarios provided by the Strathclyde Police department to previous simulation experiments [
2,
18,
53,
58] formed the basis of the potential accident simulations recreated by the system and presented to the evaluation participants. By establishing an internal consistency amongst the various trials with testing the same accident scenarios while utilising different prototype systems, we ensure a direct correlation between variables altered and evaluation result output [
2,
15,
43,
50].
The simulation deemed most appropriate for this evaluation is one that employs a rear collision accident scenario. It accesses the driver’s response in high-speed, low traffic situations (i.e., motorway environment) when distracted with random text messages which may or may not deviate the driver’s gaze from the road and of the primary task of driving. A high-propensity collision scenario is created through fundamental AI, which controls the neighbouring agent-vehicles. The latter, computer-controlled vehicles, follow seemingly the human-driven vehicle and gradually form potential abrupt braking and path-blocking conditions following closely the collision patterns provided by the Traffic Police. In particular, the driver receives messages related to navigation or mobile phone text messages, in seemingly random intervals. In total, the driver receives four messages, two for navigation updates and two from mobile texts. The scenario presented to the users follows a storyline in which the driver is invited to meet friends in a location nearby Edinburgh. In this way, the user has to check the incoming navigation and text messages’ trail to guide him/her to the meeting location.
For the scenario version that utilises the typical HDD, the infotainment messages are presented on a tablet device positioned in the middle of the vehicle dashboard.
On the second round of the experiment, the same text information is presented to the driver through the proposed AR HUD. As mentioned above, the order of the simulation runs with HDD and HUD was changed randomly for each user. In both cases, the requested task is to access and read the incoming messages from mobile phone communication and navigation updates, while driving, assuming that they feel safe to do this.
The driver is intentionally enticed to interact with the incoming infotainment data as stated above by replicating a typical routine for the vast majority of the drivers with the HDD infotainment systems or with the actual mobile phone.
As the simulation progresses, the division of the driver’s attention secondary to the external stimulus (i.e., text message and/or navigation message) creates a situation of a potential imminent collision. In a short interval after receiving the message, a rear collision scenario is unfolding; as the lead vehicle, every time is performing an abrupt braking or full-stop braking [
50,
59]. The latter is appearing on a seemingly random part of the simulation as a traffic jam is blocking the road ahead, in order to minimise the likelihood of the user memorising the events. In such a situation, the driver has three potential options, mainly related to his response time from noticing the external event, namely: break abruptly and avoid a collision, collide or circumvent the lead obstructing vehicle, and try to perform a full-stop without collision.
The simulation software measures the said driver’s response by calculating the response time (RT) and collision occurrence frequency in both simulation scenarios (with or without the HUD interface). These data contribute to the final evaluation, in combination with the subjective feedback from drivers collected via a pre and post-trial questionnaire as presented succinctly above. Drivers are also invited to voice their overall impression, thoughts, and suggestions post-evaluation experiment in a debriefing session with the researchers.
4.4. Participants
The results presented below are derived by the user-trials of 30 drivers (9 female, 21 male participants) which held a valid driving license, and they were aged between 20 and 66 years old. The simulation and the computer-controlled vehicles were programmed to comply with the driving rules and regulations of the British Highway Code.
5. Evaluation Results and Discussion
5.1. Collision Occurred HUD vs. HDD
The comparative study between HDD and HUD aimed to identify the benefits and the potential drawbacks of both systems and with a particular interest in the efficiency of information access and provision of the proposed system. The collision results offer a clear and concise manner of revealing the aforementioned. The derived collision occurrence results of this comparison are presented in detail in
Figure 12.
Notably, the use of traditional touchscreens positioned within the dashboard estate (HDD) presented 87% collision occurrences. In contrast, when the HUD system was deployed, a sharp decrease of 64% in collisions was observed, whereby only 23% of participants experienced a collision in the simulated accident scenario.
Beyond the duality of a positive and negative result of the collision occurrences, it was observed that each user had a different number of collisions throughout the simulation until the simulation events were completed.
The number of collisions per trial is indicative of the amount of driver’s distraction while attempting to circumvent the traffic and respond to the different incoming information as illustrated in
Figure 13. Notably, the simulation was not terminated in the first collision, but the driver was allowed to continue the simulation until he/she reached the main collision event. Yet, throughout the simulation, the driver was tested and challenged by the AI-controlled vehicles which created mini-collision collision conditions which tested the driver’s capability to respond and maintain the focus on the driving task. The drivers that were preoccupied with the interior infotainment systems tended to collide multiple times before the main collision event.
Additionally, the timing of the accidents and the intensity of collisions could reveal the exact moment that each user experienced a cognitive overload and the time required to respond and attempt to amend the vehicle speed and lane positioning. Further observation of the driving patterns indicates that 6.5% of the users had no collisions with and without a HUD.
However, on the post-trial debriefing, they highlighted that although they managed to avoid collisions, they felt more relaxed to operate the HUD system in contrast to the HDD, which required additional effort. Furthermore, the HDD arm of the simulation entailed in total 127 collisions amongst 26 participants, in comparison to the HUD which produced only 15 collisions between 7 users. As such, their driving pattern with the HUD did not present any erratic behaviour such as observed with the HDD in which they had to perform abrupt braking or lane change to avoid an imminent collision.
Only 3% of the participants’ sample (1 user), performed worst with the HUD interface, although experienced collisions in both simulations, with and without the HUD.
The particular user found it difficult to operate the HUD interface and access the incoming data primarily due to the user’s preferred seating position that prevented the operation within the active area of Leap Motion.
A statistical analysis of the collision occurrences results presented previously in
Figure 8 suggests that the HUD system offers a higher probability of collision avoidance with a confidence interval of 95%. The collision occurrences results were extrapolated from the 30 participants sample to the overall population of drivers with the use of large sample confidence interval (CI) for the population mean.
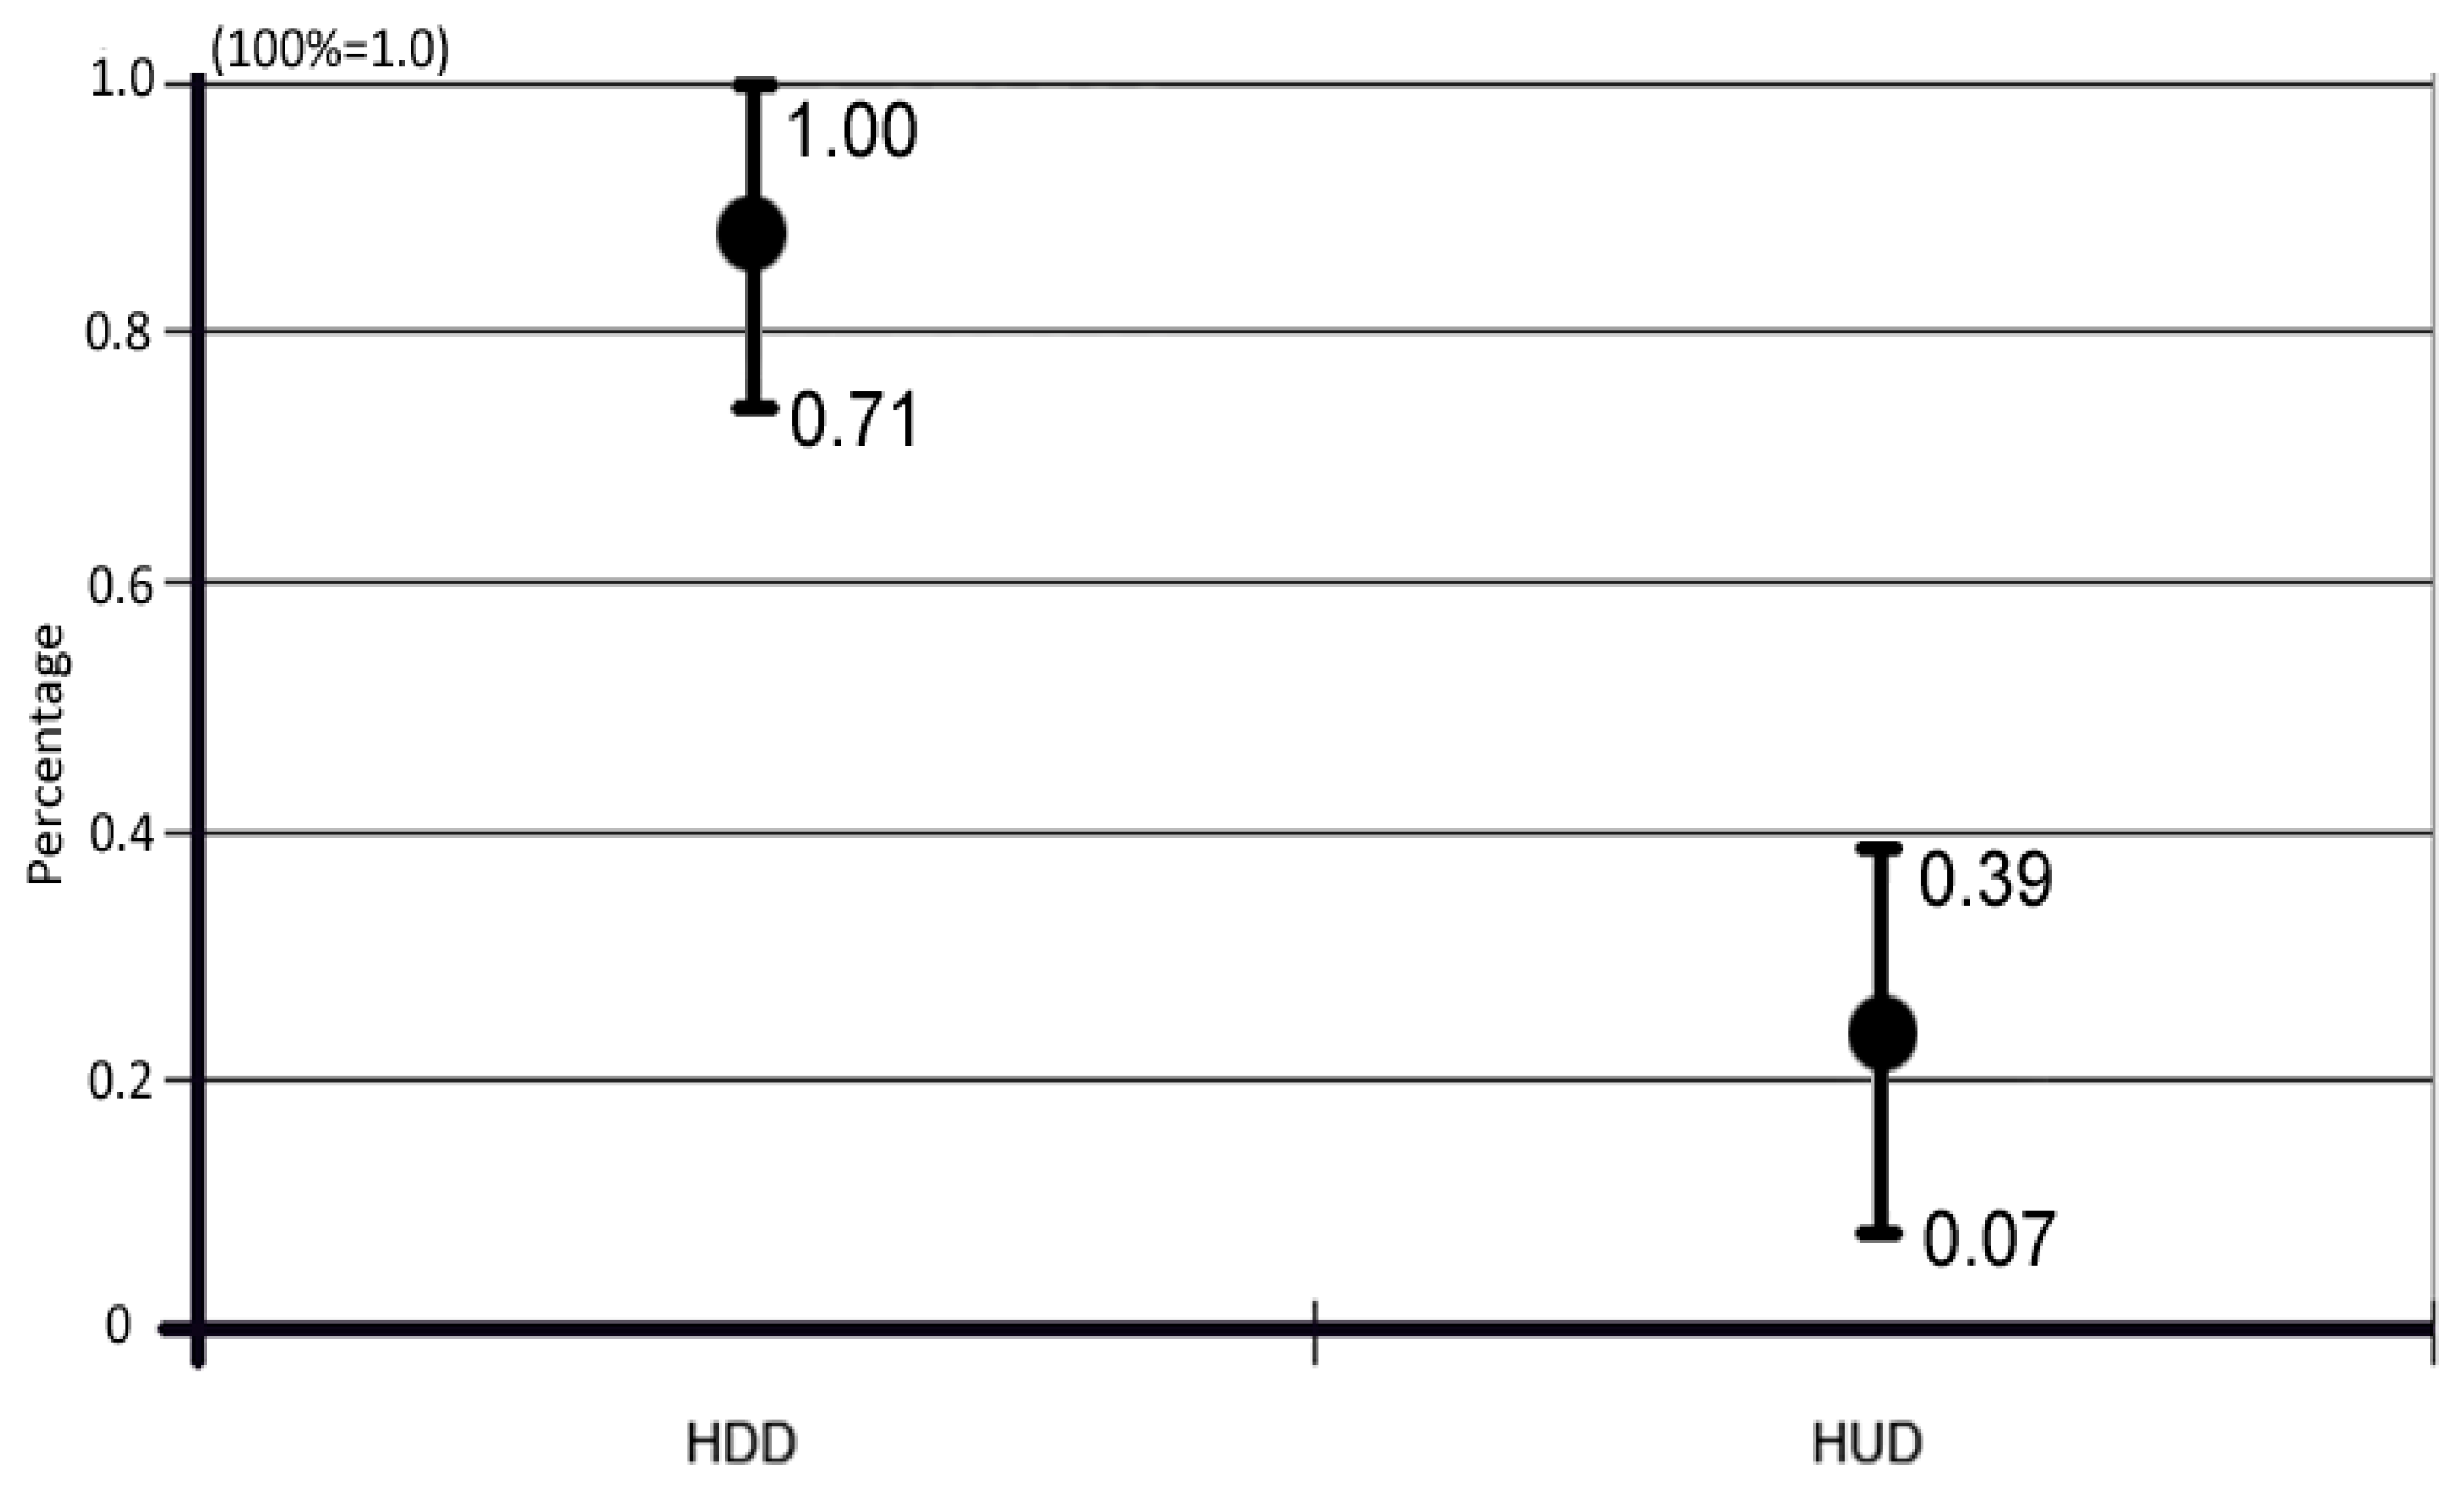
The results were calculated with the confidence of 95%, which suggests a margin of 5% of potential error that is acceptable for the nature of this evaluation. The analysis highlighted that drivers have a probability of average 87% (1.00–0.74) to collide when they use the HDD for a mobile-phone messaging system and navigation updates on the aforementioned driving scenario as presented in
Table 1 and
Figure 14. This is an alarming percentage which can be confirmed by the real-life collisions typically occurring and attributed to these factors.
This was sharply decreased to 23% (0.39–0.07) when the proposed HUD interface was utilised as a guidance system in the same conditions, as presented in
Figure 12. Overall, the proposed AR HUD system in conjunction with the direct manipulation gesture interface provided a safer provision of the infotainment information, reduced the driver’s anxiety, and ultimately contributed significantly in the reduction of collisions caused by driver’s inattention to the main task.
5.2. Indicative Driving Patterns-Discussion
Four indicative driving patterns are presented based on the collision occurrences with the HUD and HDD devices. In particular, these include (A) collision with HUD and with HDD, (B) no collisions with HUD and no collisions with HDD, (C) large number of collisions with the use of HDD, and (D) no collisions with HUD and collisions with HDD, which was the result of the largest group in the experiment as presented in
Figure 15.
The first set of graphs (
Figure 15A) highlights some driver responses which have been similar to both HDD and HUD devices and resulted in both cases in collisions. The five users of this category produced an equal amount of HUD and HDD collisions (2 users) and in some cases a higher number of collisions with the use of HUD (3 users). This can be attributed to a number of potential issues or combination of issues related to the simulation environment (i.e., seating position), the driver (i.e., height), and lack of familiarisation with the new system amongst other. Further, it could reflect the cognitive load that for some users is similar for both systems. Additionally, the interface design or interaction could not be intuitive for some users. Although it is expected that a system could not facilitate all the users, it would be interesting to investigate further the reasons and identify potential solutions that could enable more users to operate the proposed system.
The following graph (
Figure 15B) presents another group of four users who managed to avoid all the potential collisions whilst operating the HDD or the HUD. Their driving patterns followed closely the response of the lead vehicles and manoeuvred appropriately or decelerated without getting involved in any of the accident scenarios developed by the AI-controlled vehicles. In contrast, five users were involved in more than 10 accidents each while they were using the HDD infotainment system. One of the users had also one collision with the HUD. The high number of collisions highlights the detrimental effects for some users when they split their attention and take their eyes off the road. Interestingly the rest of them had no collisions with the HUD.
Investigating further the driving patterns that appeared on the simulation, an indicative common user reaction (16 users) is presented in the graphs of
Figure 15D.
Focusing into the last few seconds of the final collision of the driver D the following two graphs (
Figure 16a,b) present the users’ (a) speed vs. time and (b) distance from the lead vehicle vs. time. In particular, the
Figure 16a graph shows the user’s vehicle speed (Km/h) and the time travelled (s) prior to the imminent collision scenario with the lead vehicle.
Notably, the lead vehicle is braking abruptly behind immobile traffic. The user is challenged to respond quickly and avoid the collision. However, during the overall simulation, the driver is receiving four messages at different intervals, related to navigation and mobile phone texts activity. Two of the four messages are related to navigation updates and in particular, the first two messages, related to navigation, alert the driver for potential dense traffic ahead and delays appearing in the following sections of the motorway. The last two are mobile-phone text messages related to a social event. The context presents small variations between the two simulations. The sequence of the messages changes randomly between the simulations.
This scenario is repeated randomly for each system (i.e., HUD and HDD). The user illustrated in
Figure 16a,b drove the simulation with the HUD first and in turn with the HDD. The two grey sections in both graphs indicate the last event in which the driver receives the fourth message, and at the same time, the lead vehicle performs a sudden brake to avoid collision with the traffic jam ahead. In
Figure 16a, the user drives close to the motorway upper-speed limit (70 mph/112 Km/h) with reasonable fluctuations in speed. When the user receives some information through the HUD, he is braking lightly to interact with the HUD, as can be seen by the two small peaks in the graph just before 5 s and marginally after 9 s.
Yet, the user does not change the speed abruptly or swerve between lanes as he can see at the same time the external environment and the braking vehicle ahead. Notably, the user through the HUD managed to read the previous brief navigation warnings regarding the traffic jam ahead. Anticipating such issue, the user slows down from the top legal speed gradually and reaches on a full stop behind the traffic on 11.5 s. He starts driving again as the traffic is resolved.
In contrast, when the user is trying to access the information from the HDD, is struggling to read some of the messages and the driving speed pattern becomes erratic, presenting abrupt deceleration and acceleration as illustrated by the red line of the same graph in
Figure 15b. In addition, being unable to read the navigation warnings, the user maintains a fast pace of driving. On the final message, it can be observed that the driver is trying to access the information looking and interacting with the HDD device. The following 2 s the driver realises that he is in a direct course to collision and attempts a full brake unsuccessfully, resulting in a rear collision at 72 Km/h with a stationary lead vehicle. Such collisions are severe and frequently fatal or resulting in debilitating injuries of both vehicles’ occupants. Interestingly, the driver with the use of the HDD maintained higher speed and reached the event area in a shorter period of time and unable to access the navigation warnings safely, met the traffic 7 s earlier that with the use of the HUD.
Further driving patterns that appeared are presented in
Figure 16b, illustrating the distance (m) from the lead vehicle in correlation to the time (s) driven prior to the collision event. The last 200 m separating the driver’s vehicle from the lead vehicle is reduced rapidly, in less than 5 s while the driver is preoccupied with the HDD interaction, resulting in a major collision. In contrast, while the driver is using the AR projected information of the proposed HUD, the vehicle’s distance from the stopped lead vehicle is plotted as a gradual curve, reaching a full stop approximately 40 m behind the immobile traffic.
The aforementioned findings relate to less stressful driving with the use of HUD, as advocated by 97% participants, and are in accordance with the findings of previous experiments that utilised prototype HUD systems to alleviate the driver’s cognitive load and reduce driver’s distraction [
2,
14,
47].
5.3. HUD Ease of Use
The post-questionnaire findings regarding the ease of use and the familiarisation time required for the prototype HUD system are confirming the aforementioned observations (
Figure 12 and
Figure 13) and subjective feedback. To this end, a promising response from 80% of the participants found it either extremely easy or very easy to get accustomed to the HUD interface and interactivity as shown in
Figure 17.
5.4. System Overview and Limitations
The evaluation of the proposed system offered encouraging results and an indicative appraisal of users’ acceptance of the prototype AR-HUD system. The aforementioned results suggest that the combination of AR HUD and gesture recognition offered a viable alternative to current in-vehicle interfaces for infotainment systems. The selection of the HUD as a conduit of the provision of visual information to the driver and its positioning confirmed previous and concurrent research studies in the field [
2,
24,
26,
27,
28,
58]. The study’s results both on user performance and on system acceptability, as presented in previous sections, are concordant with published findings. The collisions occurrences results, in particular, resembled closely previous experiments that utilised HUD interfaces and contrasted them against typical HDD devices [
2,
3,
58,
60,
61].
Coupling the latter with a gesture recognition interface design, following the same design mantra, enabled the users to perform the selected and specific tasks without complicated multilayered interfaces. As per previous studies, uncomplicated gesture recognition systems could be utilised instead of typical manual or voice-controlled interfaces that tend to distract the driver by taking the eyes off the road [
29,
32,
33,
34,
62,
63,
64,
65]. Yet, several limitations hindered the research process as presented below.
The position and size of the current HUD–UI is fixed and allows no modifications. This limits the usability of the system as the drivers had to modify the position of their seat as to see clearly and operate the AR HUD. The addition of the customisable size and position of the HUD would likely enhance the proposed system’s usability and driving experience of the driver. This limitation could have potentially affected some of the simulation results.
As presented in the “Simulation Requirements” section, the development of a full-scale VR driving simulator carries a considerable cost. The reduction of the cost wherever possible dictated the utilisation of off-the-shelf equipment which had to be installed retrospectively in the vehicle’s interior. Hardware devices employed for the simulation such as the Leap Motion are commercially available computing equipment/peripherals and they are not designed for immediate use in other domains. This was evident during the simulation, as some users with larger hands found it difficult to pin-point and select the different UI options, as revealed in the post-evaluation questionnaire. Furthermore, the aforementioned device’s usability has not been tested in a real-life vehicle. In its current form, it is unclear if it is suitable for a vehicle in motion.
Another measuring element that intentionally has not been employed was the eye-tracking of the users, typically utilised to identify their gaze position and time during the simulations. Although eye-tracking is available in the VRDS laboratory, it was deemed unusable for two reasons.
The first one stems from our previous attempts, which presented major issues with the users’ acceptability and the performance of the tracking equipment. In particular, as the driver gazes between the road in the VR environment (i.e., layer 1) and the AR HUD interface (i.e., layer 2), the eye-tracking system was not able to distinguish between the two layers. The reason is that the proposed HUD interface is projected at 2.5 m ahead of the windshield to blend with the external environment and avoid double accommodation of the driver’s gaze as mentioned previously [
2,
24]. Eye-tracking could have been used in the cases of typical small-size HUD interfaces that they tend to appear at the same level or in close proximity behind the windscreen depending on the projection system, HUD device, and glass combiner used [
2,
24,
58,
60,
65]. The alternative of head-mounted display (HMD) eye-trackers was also deemed unusable as were uncomfortable for the users and distorted their performance and subjective feedback during focus group trials. To resolve the above issue, video recordings were used to track the drivers’ eye-gaze, head position, and body posture, yet the derived information was not included in the analysis, as not all the drivers consented to be recorded, introducing confounders. A large number of users could alleviate this issue in future evaluations.
The second reason is that a driver’s attention is not necessarily where his/her eyes are gazing. Various objects (in-vehicle and externally), events, or thoughts could distract the driver whilst he/she phenomenically gaze in the right direction. As such, it remains unclear the potential impact of the driver’s attention captured by the HUD interface, namely percent road centre (PRC) which could affect the driver’s response times (RTs) [
65,
66]. Although in the particular motorway scenarios and the current AR HUD system, the PRC might have a negligible effect to the driver, in an urban environment the multilateral movement and positioning of pedestrians, crossings, could increase the PRC with direct impact on driver’s and surrounding road users’ safety. Thus, the interface is primarily designed and tested for motorway driving and performing to the requirements of an urban environment was outwith the remit of the current investigation but remains within our future development plans.
The collision avoidance braking and manoeuvring performed by the user in the evaluation provided a suggestive appraisal of their actual ability to focus on the driving task manifested by the reduced collisions. Yet, some of these responses could have been instinctively performed. Detection response tasks (DRT) could be introduced seemingly on the following evaluations to check, at frequent intervals, the driver’s actual attention on the road [
67,
68].
The driving simulation investigated the driver’s behaviour with and without the proposed system, on a typical British motorway environment and simulated specific accident scenarios as provided by the local traffic police. As stated previously, the digital twin model of the city of Glasgow and the extended motorway network had to be optimised to facilitate optimal software and hardware performance. Additionally, the neighbouring vehicles’ AI offers limited driving behaviour which is developed primarily to fulfil the traffic flow needs and the specific accident scenarios’ formation. Additional characteristics could be included to challenge further driver’s ability to respond. Finally, the number of users (30), although sufficient to provide statistically significant results and in par to similar studies [
2,
25,
50,
51,
62], could be increased in the future to improve the accuracy of the results and acquire a better understanding of driver’s future requirements related to the incorporation of emerging technologies in the daily vehicular environment.
6. Conclusions
This paper presented the design and implementation challenges of our prototype multimodal HUD interface that aims to reduce the number of attention-seeking infotainment interfaces and improve the response time and situational awareness of the driver. This was achieved with the development of a prototype AR HUD interface that presents a fresh approach which combines the visual presentation of relevant information through the car’s windshield whilst enabling the driver to interact with the system in real-time through a novel gesture recognition system.
For the evaluation of the system, we have developed a high-fidelity full-scale driving simulator that replicated realistically two driving scenarios of high probability collision. The system has been preliminarily evaluated by 30 users with promising results, demonstrating 64% improvement in collision avoidance as the users maintained the eye gaze on the road and their hands on the steering wheel at all times.
Additionally, this work presented an insight into the average driving responses and offered justification for the merits of such systems. The data analysis showed encouraging results, providing the basis for further research and development in the area of AR and gesture recognition interfaces for vehicular purposes.
Adhering to the above, our tentative plan of future work entails the streamlining of interface functionality and gesture recognition with a subsequent increase of user-trials number to refine the granularity of results and offer more conclusive outcomes. Furthermore, we aim to introduce additional visual icons and experiment further with the gesture interaction of multiple infotainment sources. Finally, we plan to engage more the co-driver, who can operate non-crucial infotainment data which in turn could be shared or presented to the driver safely.


 ,
, 


