Experiences with Establishing a Simulation Scenario of the City of Duisburg with Real Traffic Volume


Abstract
Featured Application
Abstract
1. Introduction
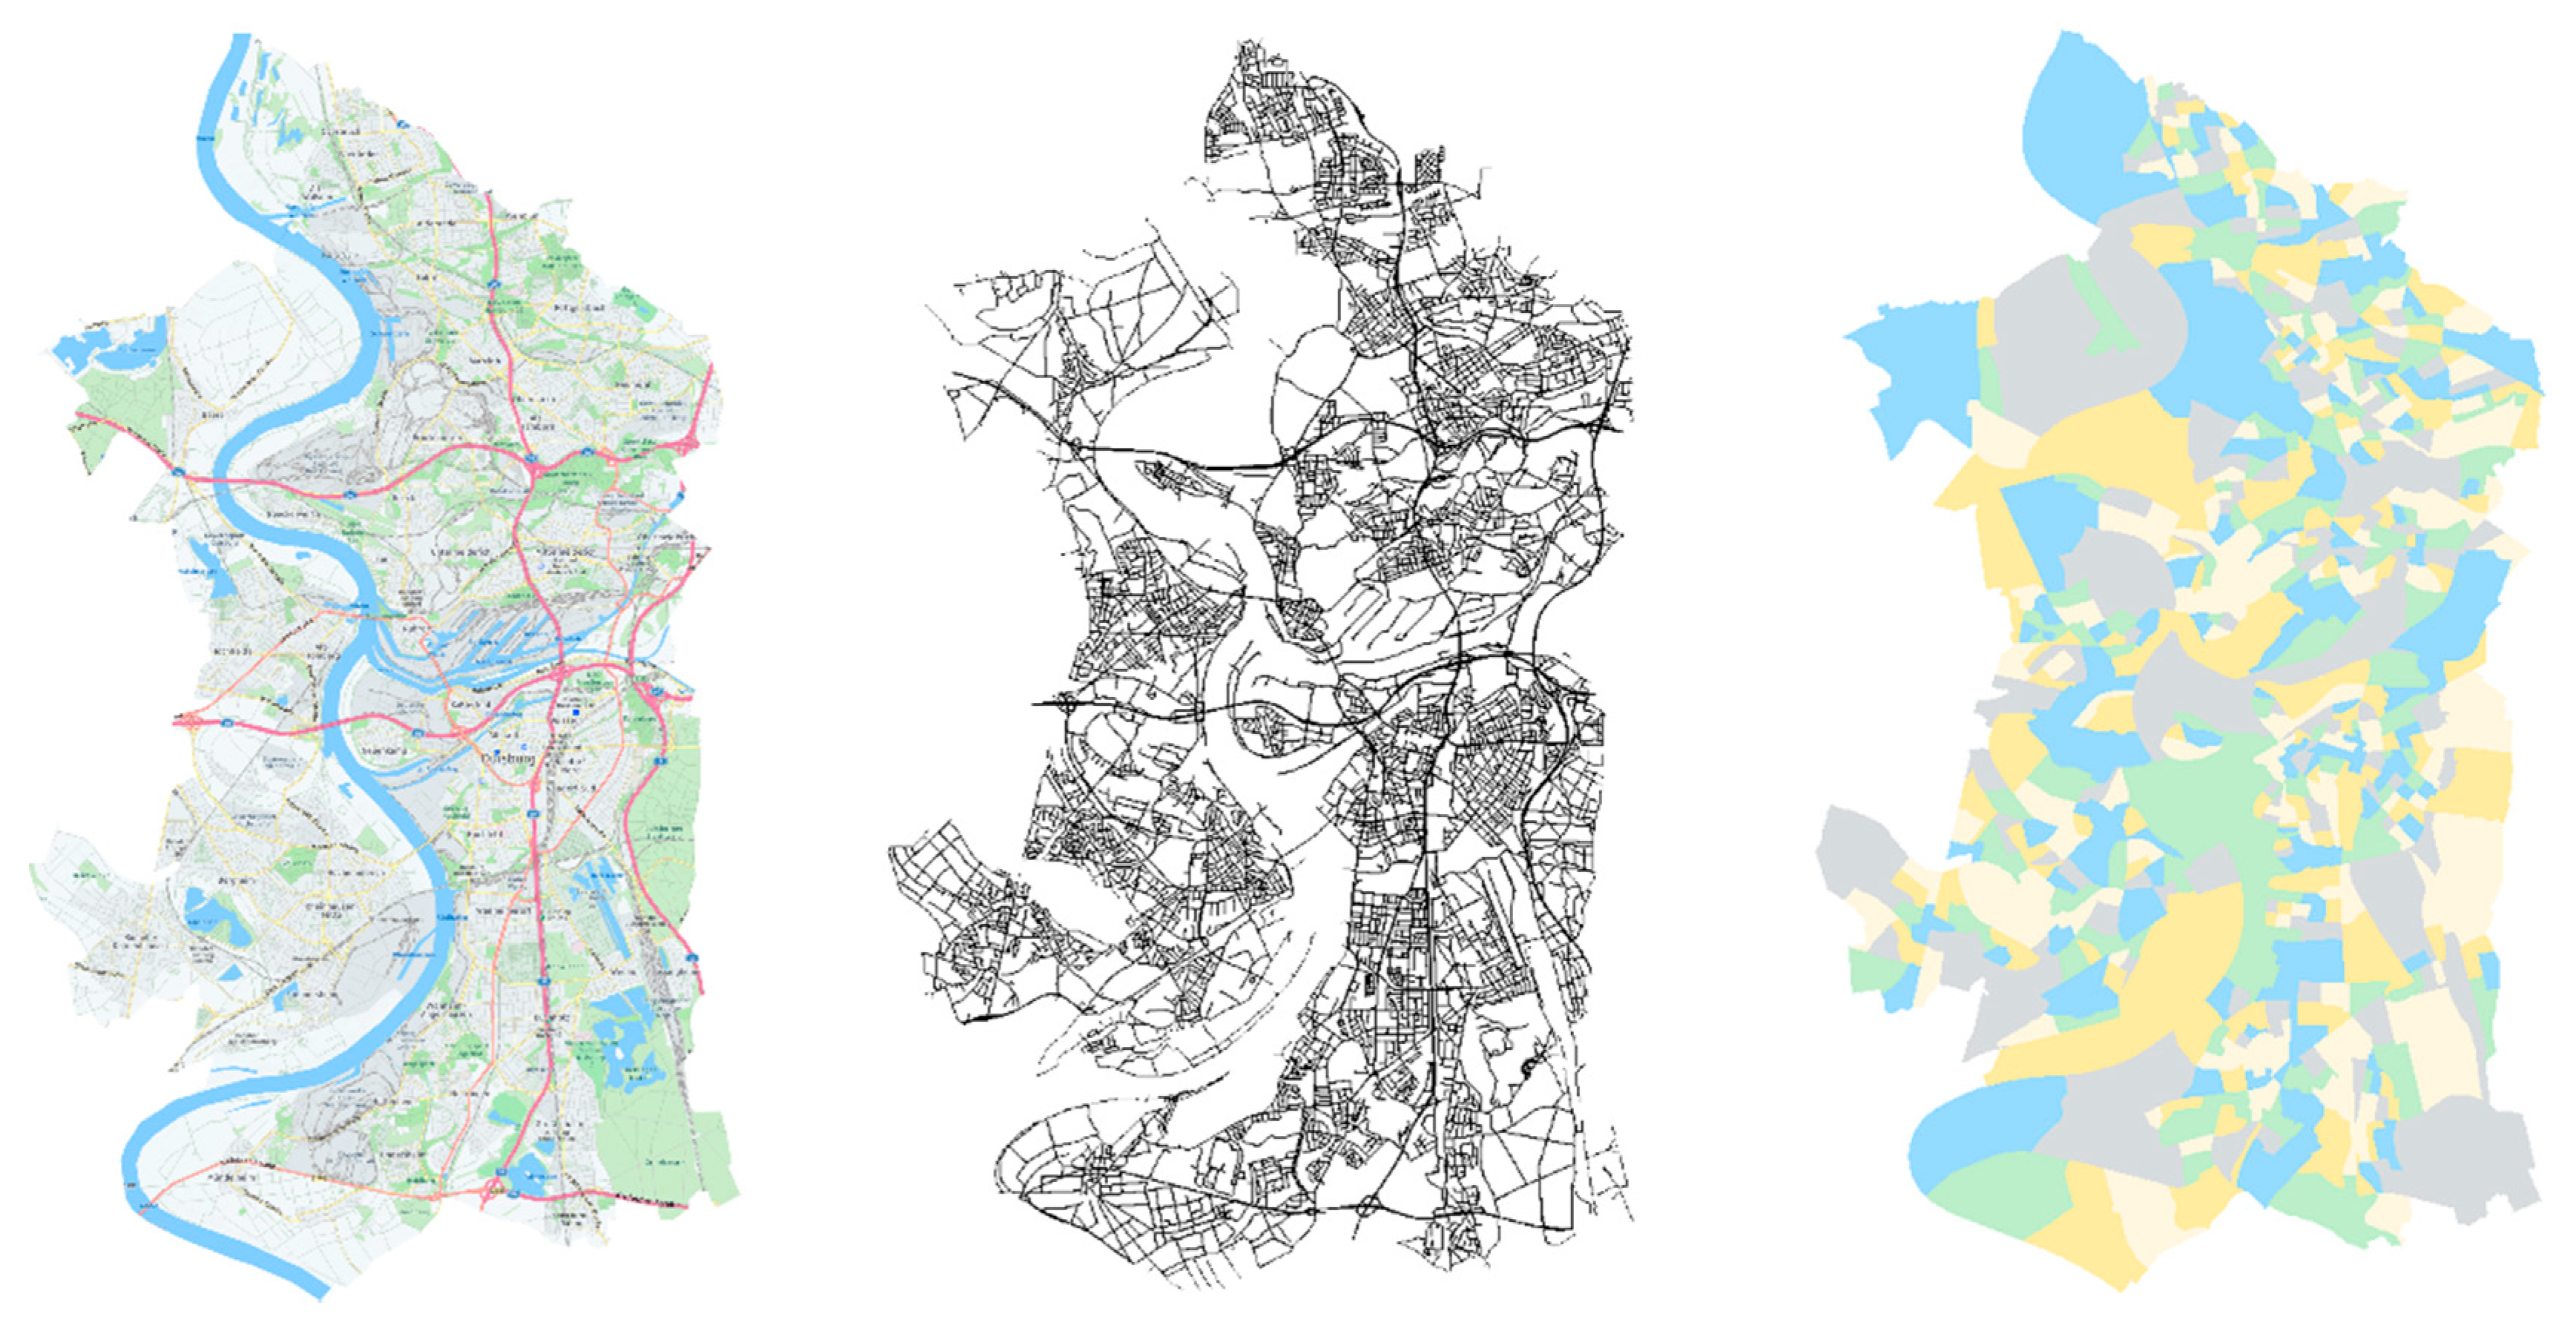
2. Road Network
- Divided intersections. Large intersections are always divided into smaller ones, especially those with a cover (e.g., viaducts and green belts) in the middle. The extra intersections are often accompanied by the extra unlinked traffic lights, which increase the possibility of unrealistic traffic jams.
- Occurrence of extra roads. Sometimes, the non-motorized roads or the dedicated roads are included in the normal motorways, however in street view, some isolation piles or stop signs can be found at the road entrance.
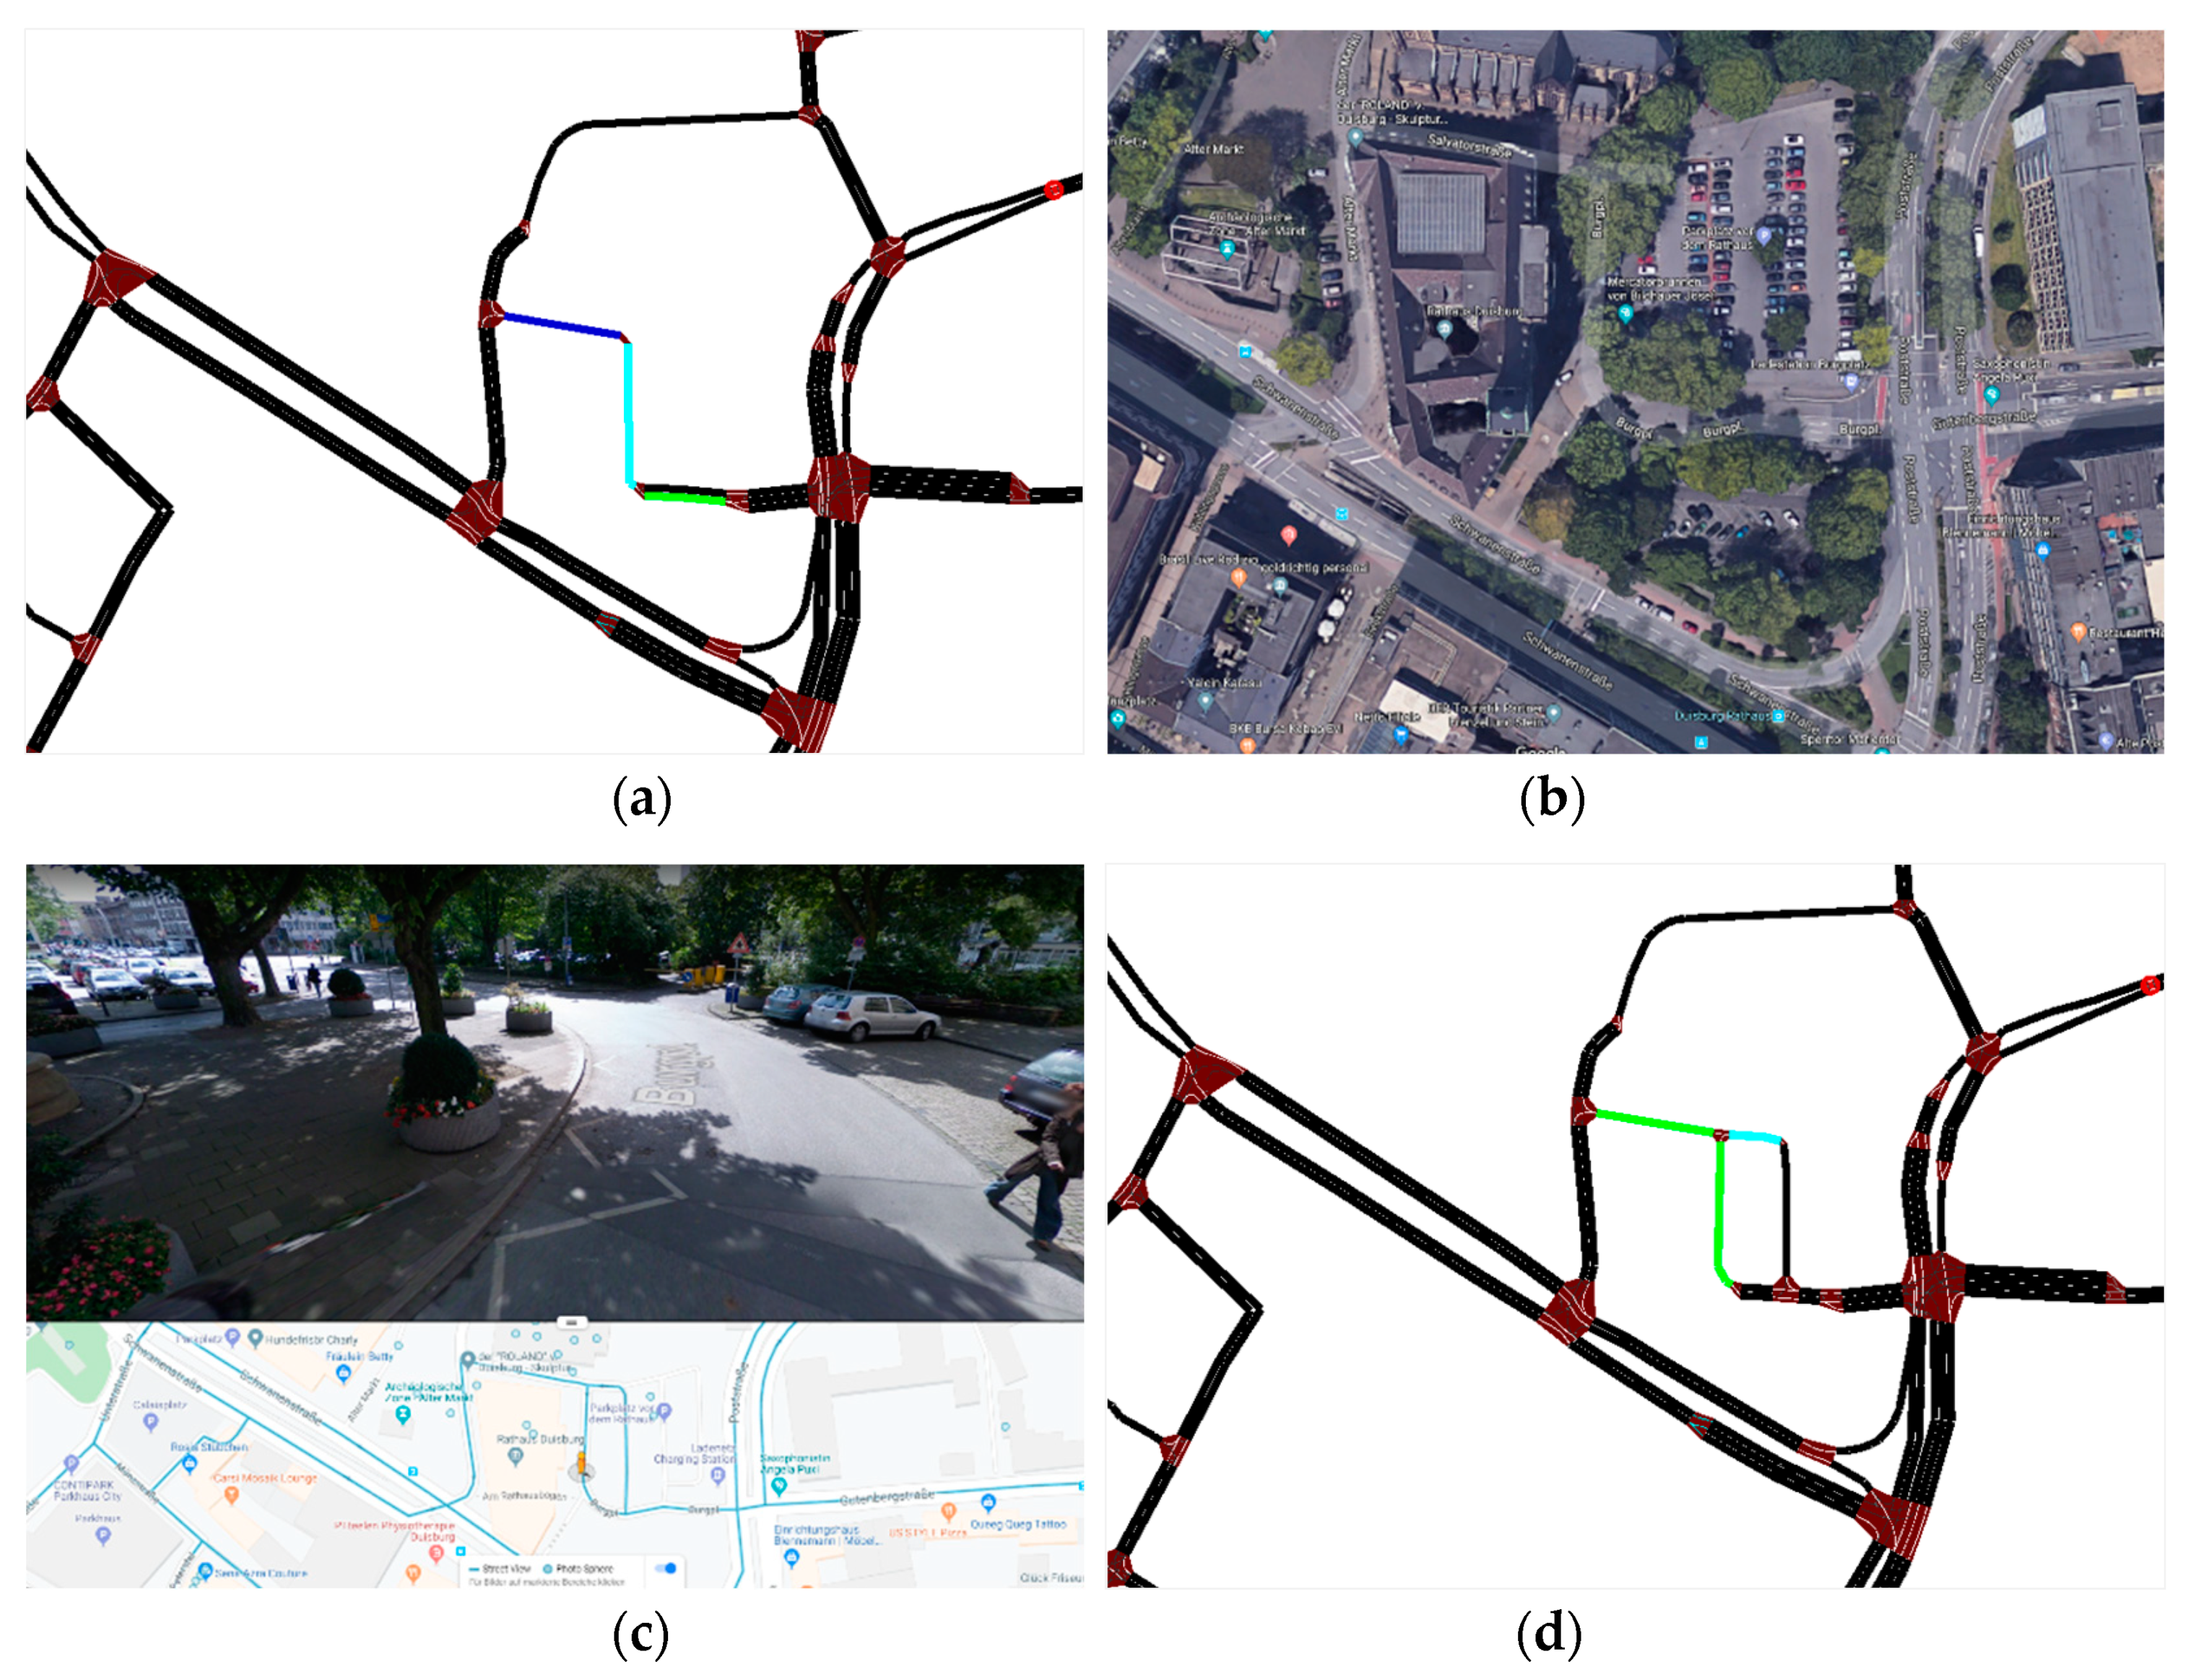
- Missing roads. There are no two-directional ways in SUMO. However, they are common in residential areas. Many people have a single-lane road leading to their garage, responsible for both incoming and outgoing directions. In SUMO, we had to add the reverse lanes for these kinds of roads. What is more, there were also other road-missing conditions. An example can be seen in Figure 1. In this case, a part of a ring road in the parking lots is missing. It causes a dead-end in Figure 1a. After comparing with the satellite map in Figure 1b and the street view map in Figure 1c, the missing sections were manually filled in. The modified road network of the parking lots is in Figure 1d.
- Reverse directions. In some cases, some lanes on a road may be in the wrong direction, which affects their connection with other roads. This kind of mistake is less likely than the other three but is also a common error in road network imported from OSM.
3. Traffic Demand
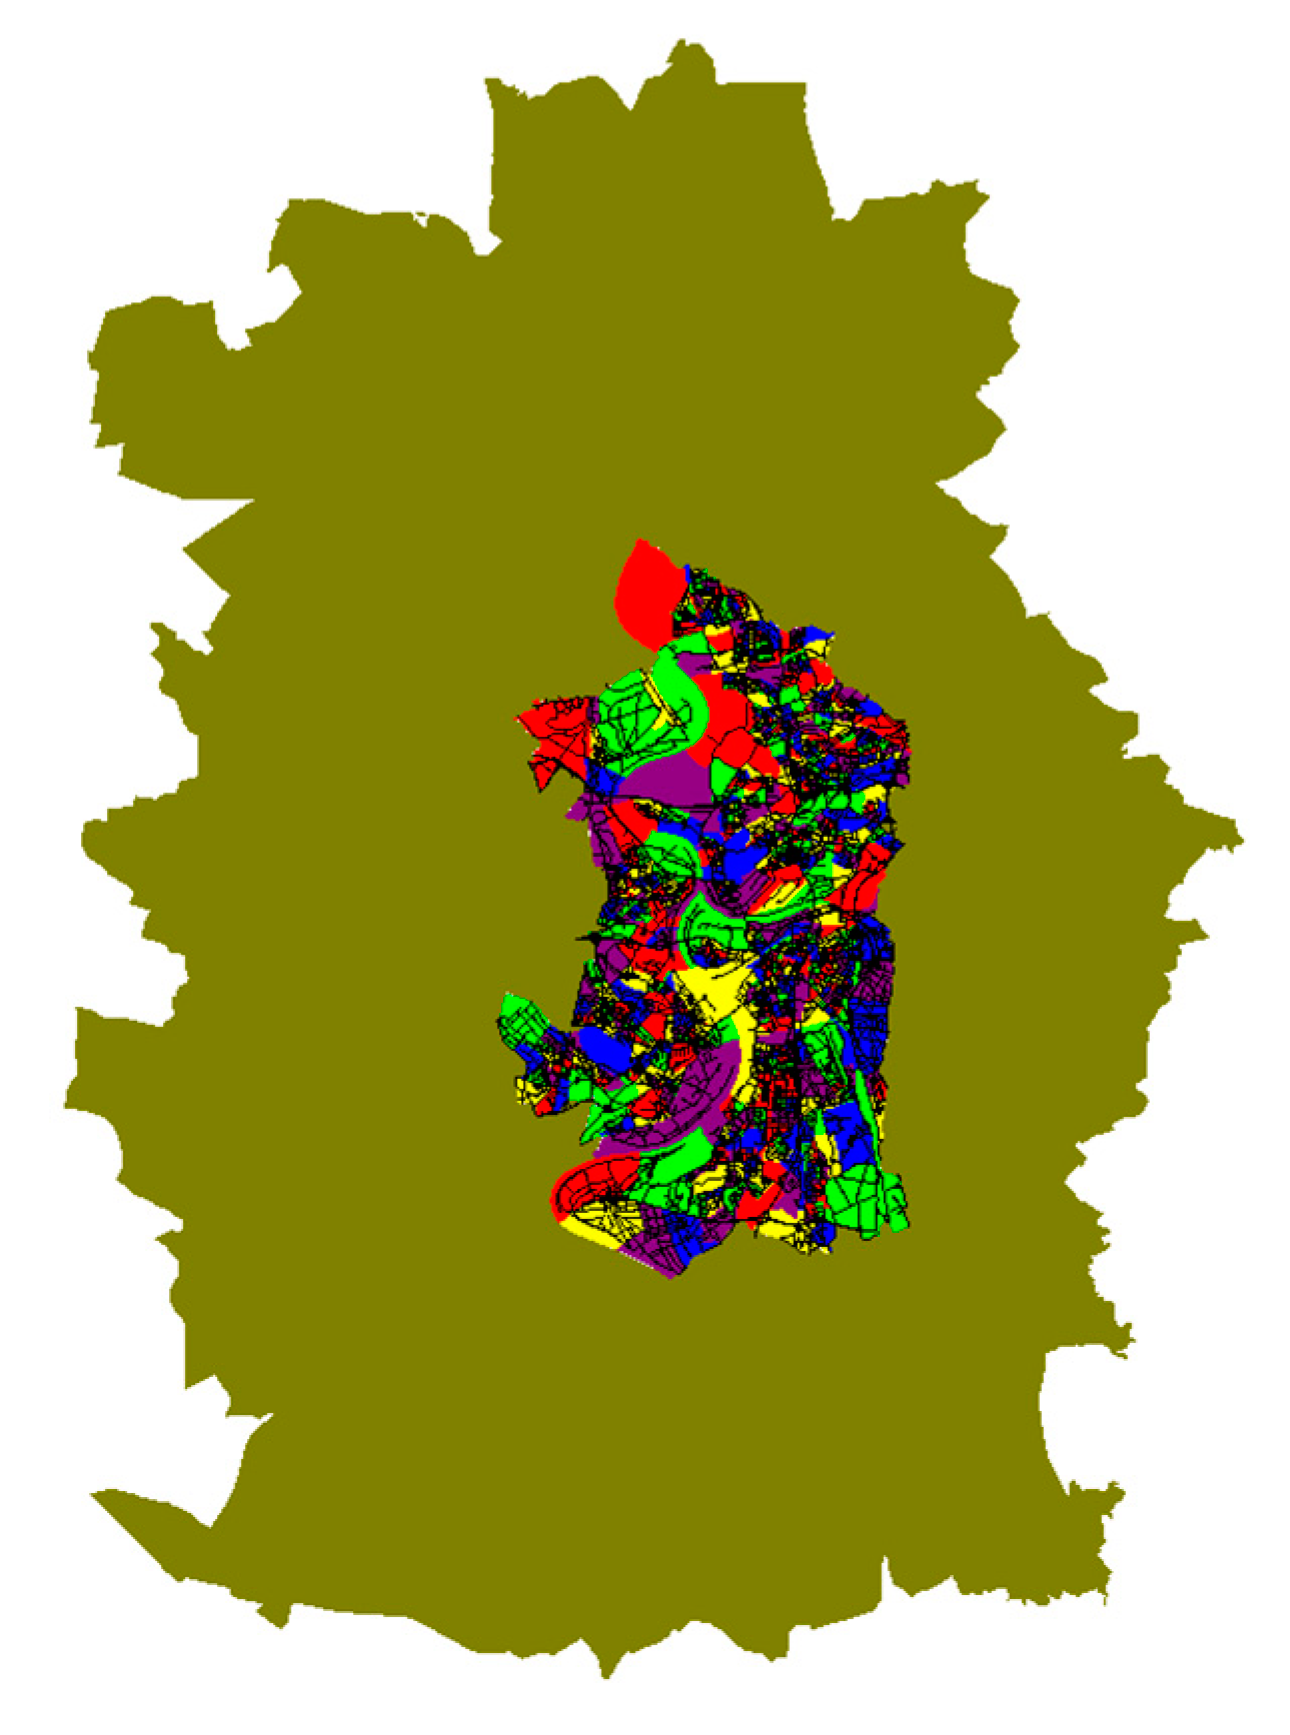
3.1. Polygons and TAZ
3.2. Trip Generation and Distribution
3.3. Route Generation and Dynamic Equilibrium
4. Simulation and Verification
4.1. Duisburg Interior Simulation
4.2. Duisburg Simulation with Intercity Traffic
4.3. Duisburg Plus Surrounding Area
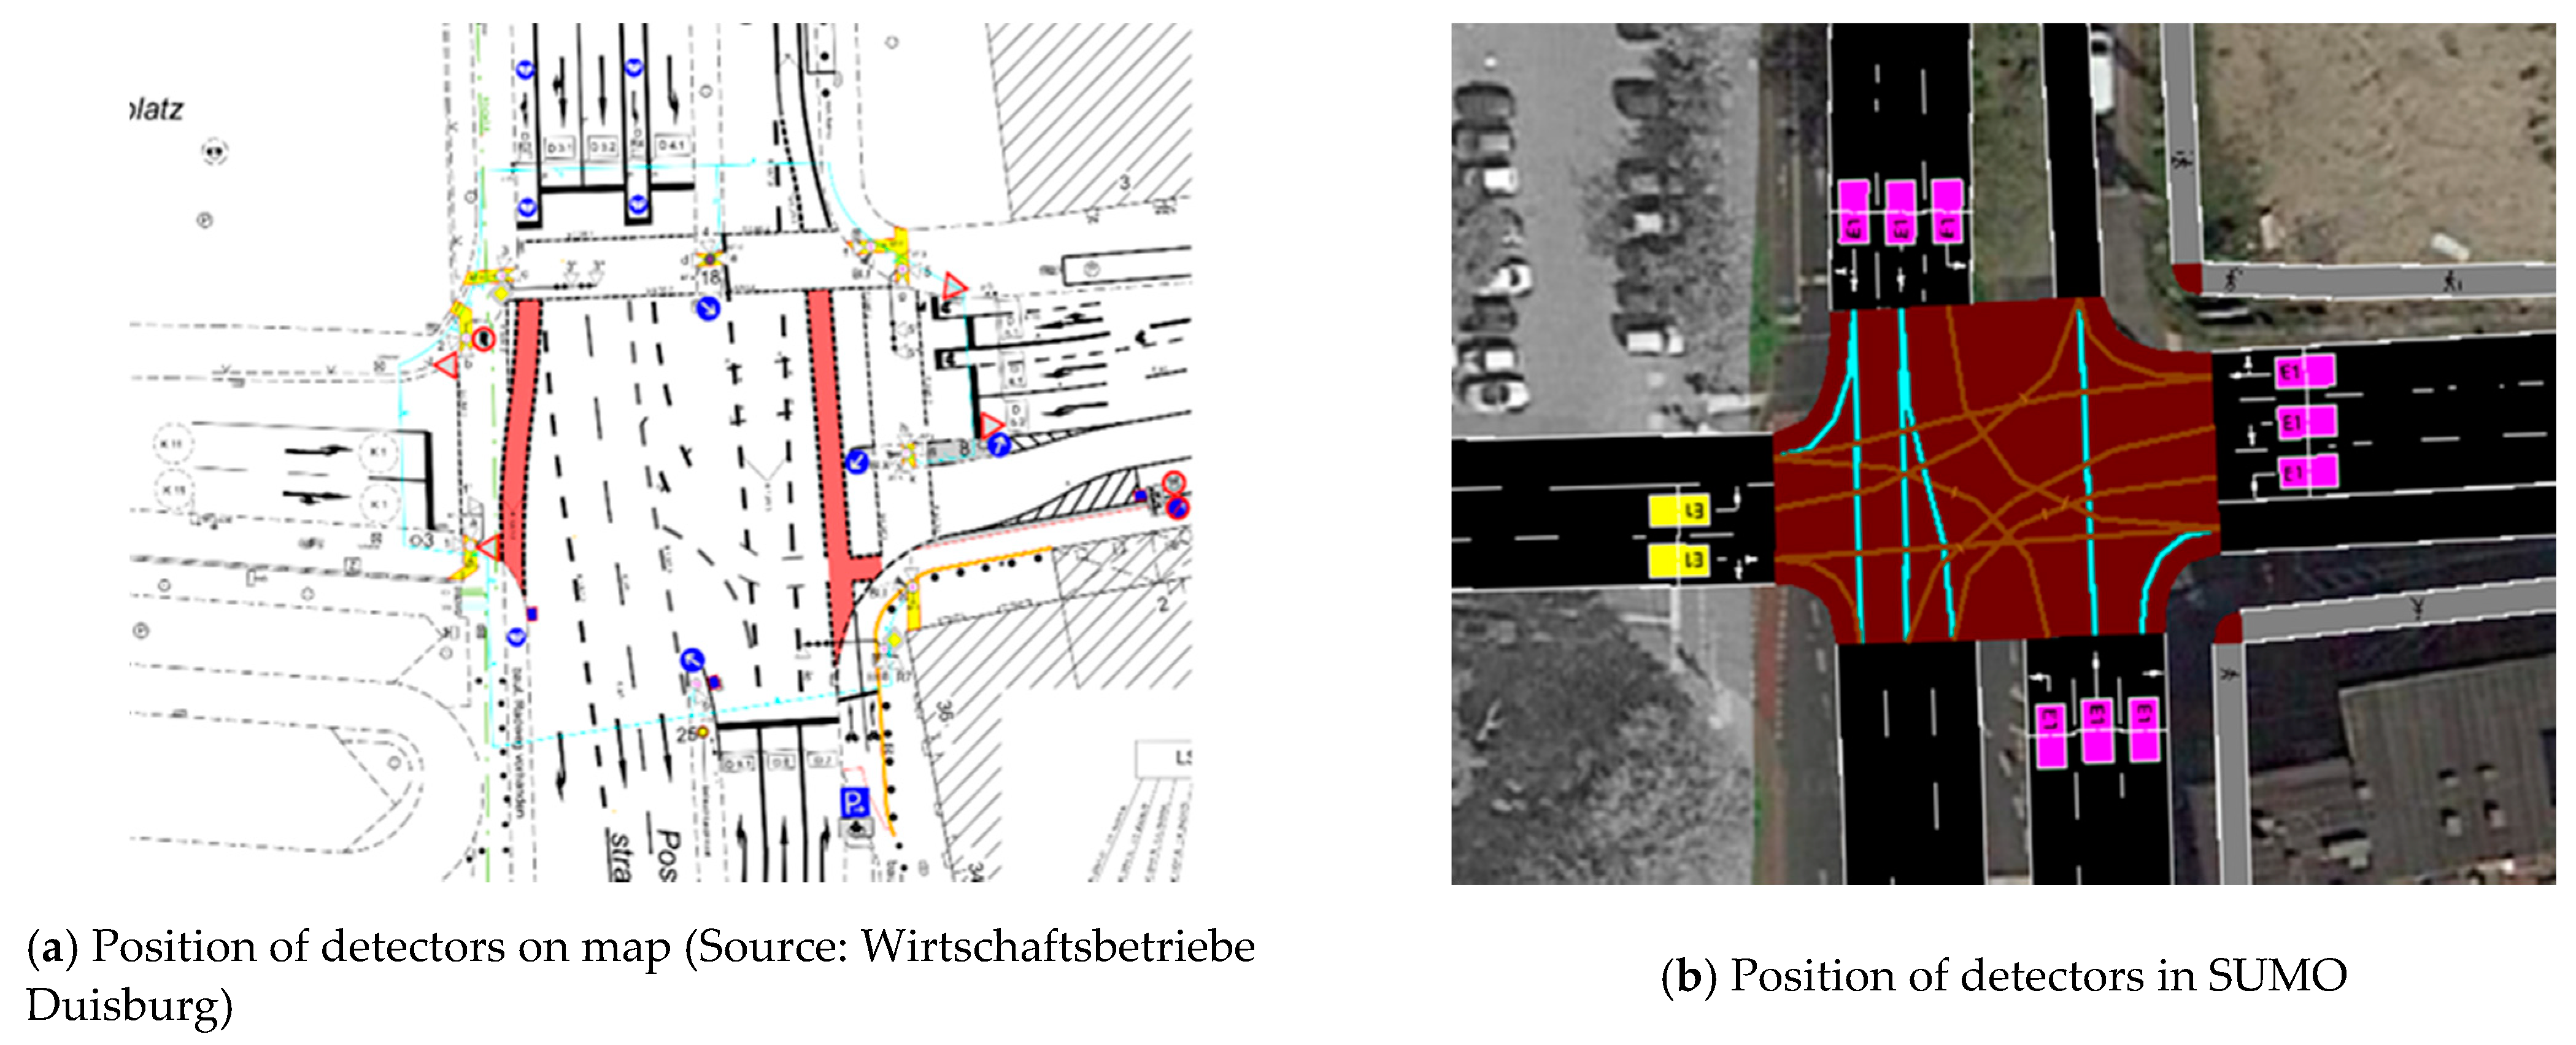
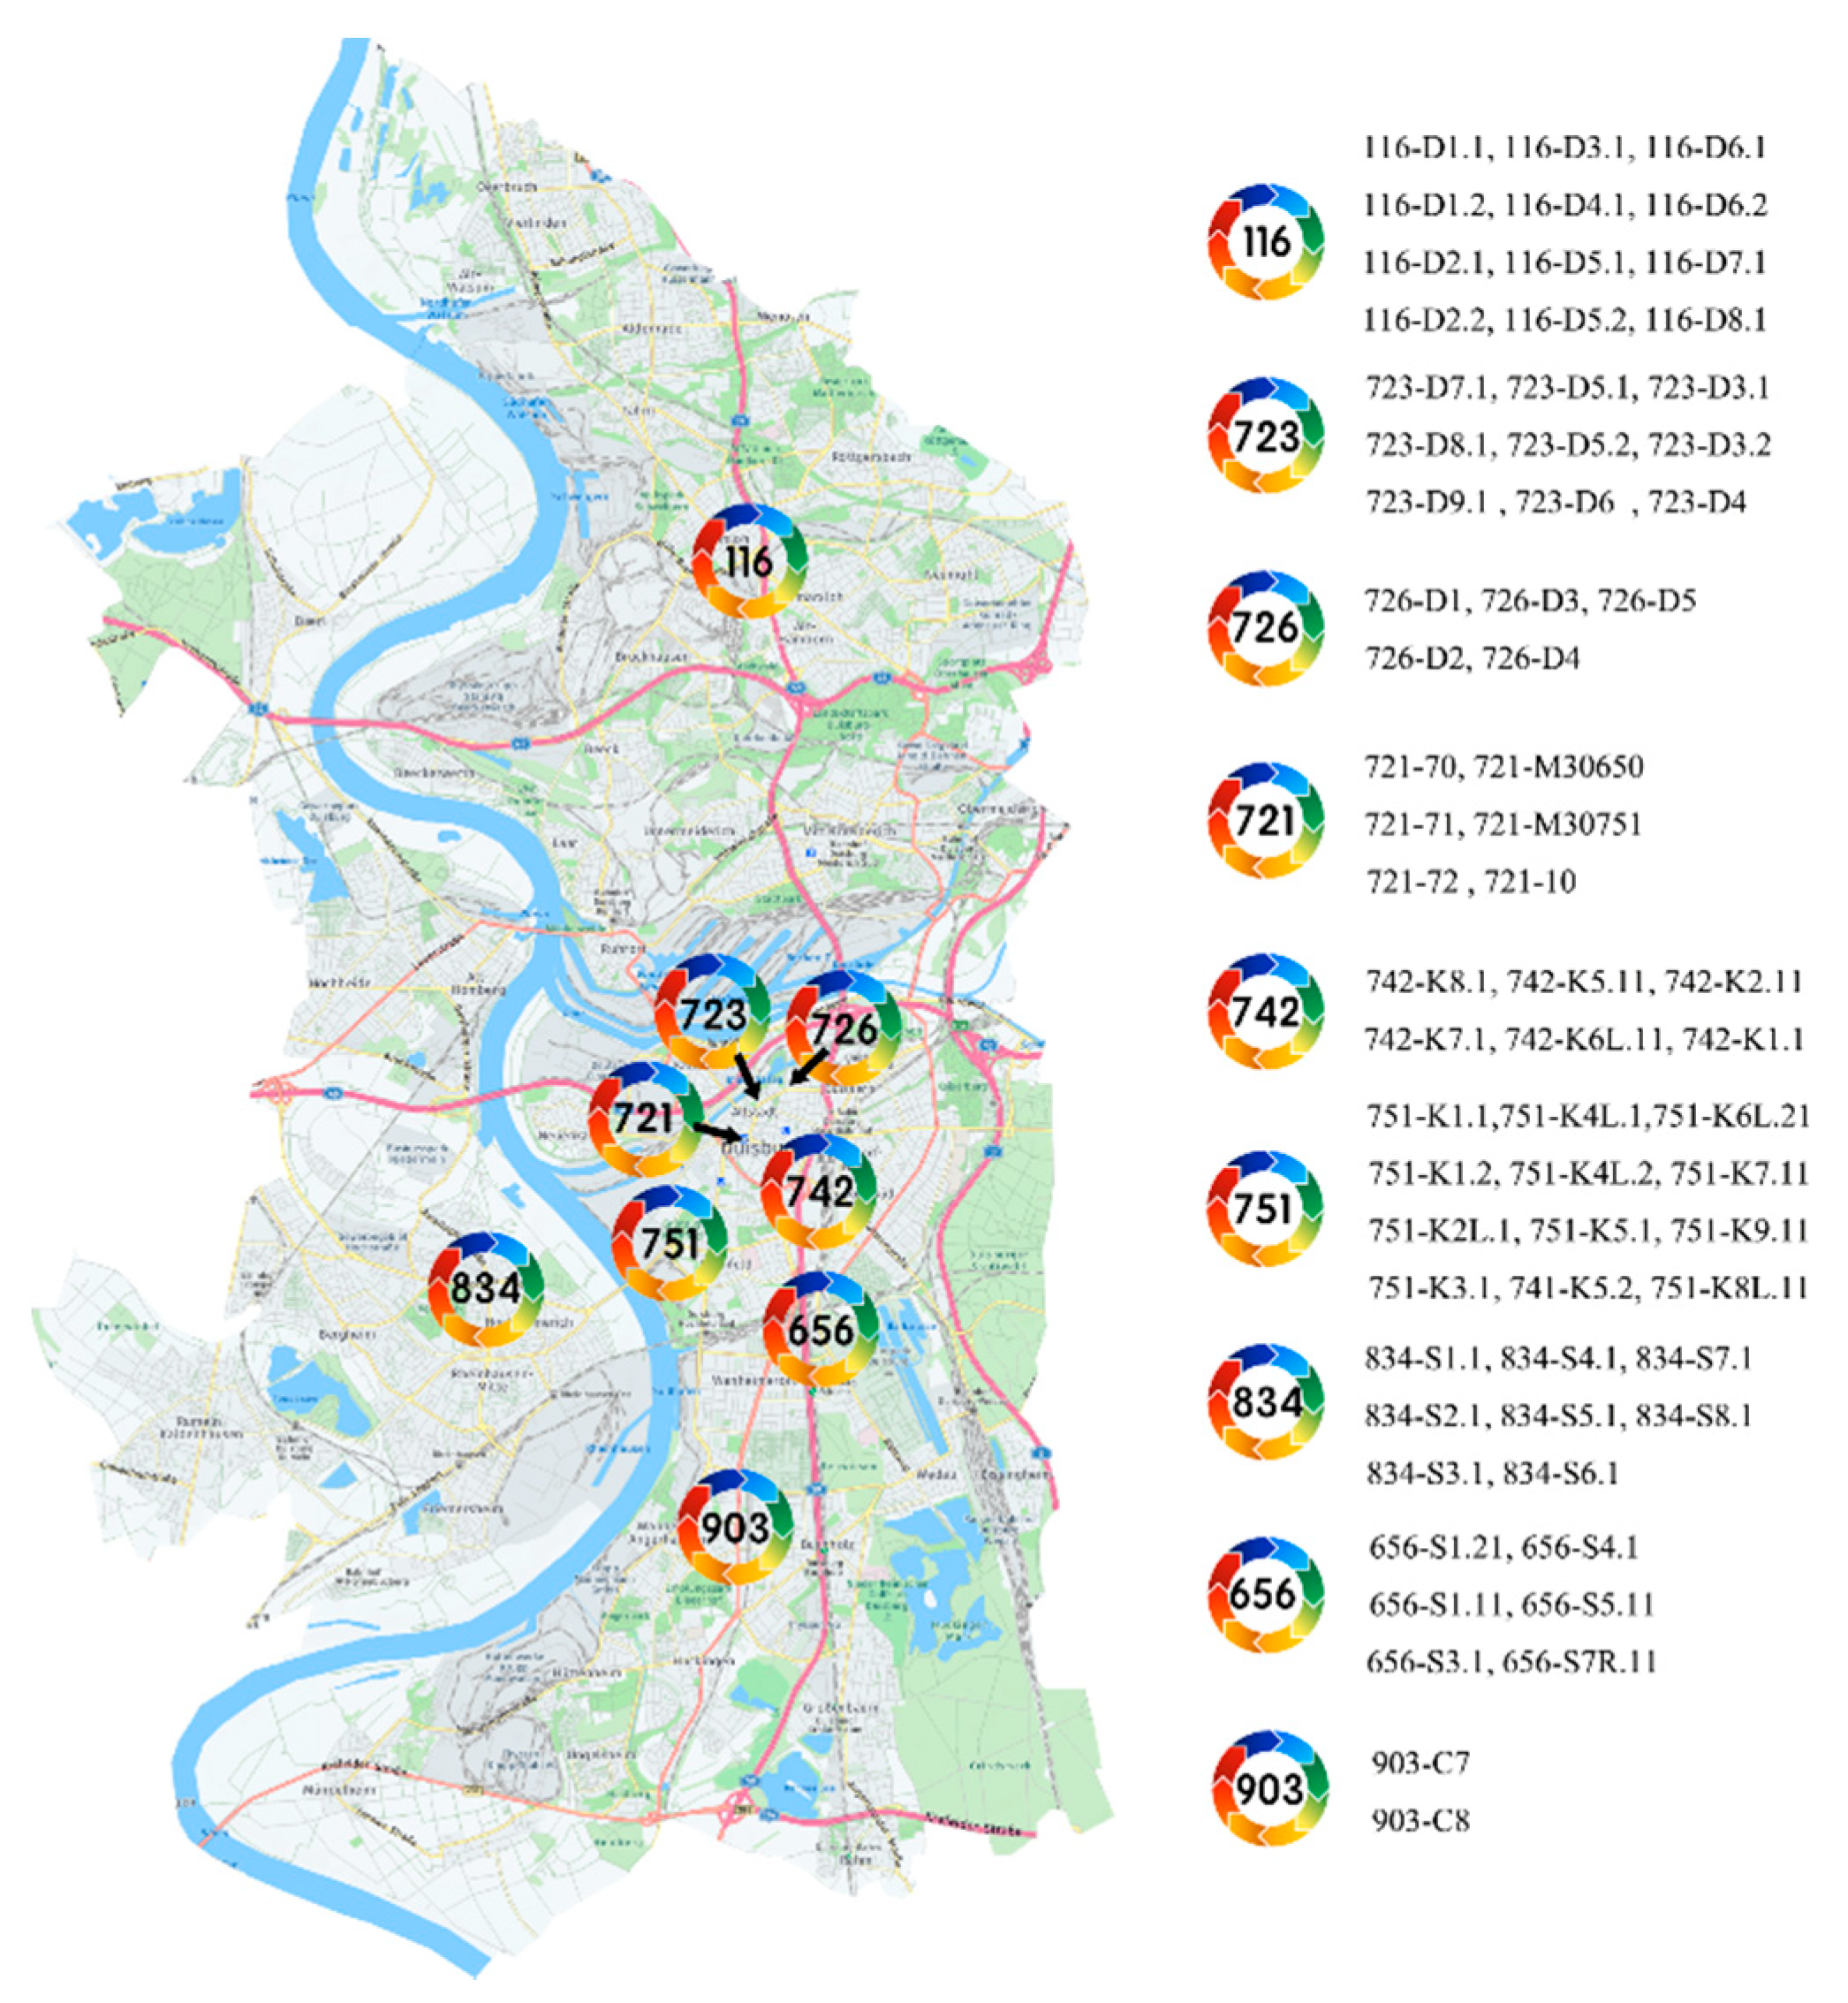
4.4. Verification Points
5. Conclusions and Outlook
Author Contributions
Funding
Institutional Review Board Statement
Informed Consent Statement
Data Availability Statement
Acknowledgments
Conflicts of Interest
References
- Lopez, P.A.; Wiessner, E.; Behrisch, M.; Bieker-Walz, L.; Erdmann, J.; Flotterod, Y.-P.; Hilbrich, R.; Lucken, L.; Rummel, J.; Wagner, P. Microscopic Traffic Simulation using SUMO. In Proceedings of the 2018 21st International Conference on Intelligent Transportation Systems (ITSC), Maui, HI, USA, 4–7 November 2018; pp. 2575–2582. [Google Scholar]
- Bieker, L.; Krajzewicz, D.; Morra, A.; Michelacci, C.; Cartolano, F. Traffic simulation for all: A real world traffic scenario from the city of Bologna. In Modeling Mobility with Open Data; Behrisch, M., Weber, M., Eds.; Lecture Notes in Mobility; Springer: Cham, Switzerland, 2015. [Google Scholar]
- Krajzewicz, D.; Erdmann, J.; Behrisch, M. Recent development and applications of SUMO-Simulation of Urban MObility. Int. J. Adv. Syst. Meas. 2012, 5, 3–4. [Google Scholar]
- Codeca, L.; Frank, R.; Engel, T. LuST: A 24-hour Scenario of Luxembourg City for SUMO Traffic simulations. In Proceedings of the SUMO User Conference 2015—Intermodal Simulation for Intermodal Transport, Berlin, Germany, 7–8 May 2015. [Google Scholar]
- Asano, Y.; Ito, N.; Inaoka, H.; Imai, T.; Uchitane, T. Traffic simulation of Kobe-city. In Proceedings of the International Conference on Social Modeling and Simulation, Plus Econophysics Colloquium 2014; Springer: Cham, Switzerland, 2015; pp. 255–264. [Google Scholar]
- Ma, X.; Hu, X.; Schramm, D. Effects of School Activities on Traffic Flow on Example of Traffic Scenario from the City Wuhan. In Neue Dimensionen der Mobilität; Springer Gabler: Wiesbaden, Germany, 2020; pp. 153–163. [Google Scholar]
- Tubaishat, M.; Zhuang, P.; Qi, Q. Wireless sensor networks in intelligent transportation systems. Wirel. Commun. Mob. Comput. 2009, 9, 287–302. [Google Scholar] [CrossRef]
- Lefebvre, N.; Chen, X.; Beauseroy, P. Traffic flow estimation using acoustic signal. Eng. Appl. Artif. Intell. 2017, 64, 164–171. [Google Scholar] [CrossRef]
- Ma, X.; Hu, X.; Weber, T.; Schramm, D. Traffic Simulation of Future Intelligent Vehicles in Duisburg City Inner Ring. Appl. Sci. 2021, 11, 29. [Google Scholar] [CrossRef]
- OpenStreetMap Contributors. Planet Dump [Data File from 01.10.2017]. 2015. Available online: https://planet.openstreetmap.org (accessed on 19 August 2020).
- JOSM. Available online: https://josm.openstreetmap.de/ (accessed on 8 July 2018).
- Google Steet View. Available online: https://www.google.com/streetview/ (accessed on 19 August 2020).
- Schmidt, G.; Thomas, B. Hochrechnungsfaktoren für manuelle und automatische Kurzzeitzählungen im Innerortsbereich. In Forschung Straßenbau Straßenverkehrstechnik; Bundesministerium für Verkehr: Bonn, Germany, 1996. [Google Scholar]
- Dijkstra, E.W. A note on two problems in connexion with graphs. Numer. Math. 1959, 1, 269–271. [Google Scholar] [CrossRef]
- Seyed Sajad, M.; Michael, S.; Enda, H. Traffic light control using deep policy-gradient and value-function-based reinforcement learning. IET Intell. Transp. Syst. 2017, 11, 417–423. [Google Scholar]
- Westerman, M.; Litjens, R.; Linnart, J.P.Z. Integration of Probe Vehicle and Induction Loop Data: Estimation of Travel Times and Automatic Incident Detection; PATH Research Report UCB-ITS-PRR-96-13, Institute of Transportation Studies; University of California: Berkeley, CA, USA, 1996. [Google Scholar]
- Treiber, M.; Arne, K. Traffic flow dynamics: Data, models and simulation. In Physics Today; Springer: New York, NY, USA, 2014; pp. 7–23. [Google Scholar]


| Simulation Scope | Case A | Case B | Case C | Case D | |
|---|---|---|---|---|---|
| Traffic | Inner-city | √ | √ | √ | √ |
| In to out/out to in | x | √ | √ | √ | |
| Out to out | x | √ | x | √ | |
| Map | Inner-city | √ | √ | √ | √ |
| Outer city | x | x | x | √ | |
Publisher’s Note: MDPI stays neutral with regard to jurisdictional claims in published maps and institutional affiliations. |
© 2021 by the authors. Licensee MDPI, Basel, Switzerland. This article is an open access article distributed under the terms and conditions of the Creative Commons Attribution (CC BY) license (http://creativecommons.org/licenses/by/4.0/).
Share and Cite
Ma, X.; Hu, X.; Weber, T.; Schramm, D. Experiences with Establishing a Simulation Scenario of the City of Duisburg with Real Traffic Volume. Appl. Sci. 2021, 11, 1193. https://doi.org/10.3390/app11031193
Ma X, Hu X, Weber T, Schramm D. Experiences with Establishing a Simulation Scenario of the City of Duisburg with Real Traffic Volume. Applied Sciences. 2021; 11(3):1193. https://doi.org/10.3390/app11031193
Chicago/Turabian StyleMa, Xiaoyi, Xiaowei Hu, Thomas Weber, and Dieter Schramm. 2021. "Experiences with Establishing a Simulation Scenario of the City of Duisburg with Real Traffic Volume" Applied Sciences 11, no. 3: 1193. https://doi.org/10.3390/app11031193
APA StyleMa, X., Hu, X., Weber, T., & Schramm, D. (2021). Experiences with Establishing a Simulation Scenario of the City of Duisburg with Real Traffic Volume. Applied Sciences, 11(3), 1193. https://doi.org/10.3390/app11031193