
The New York City COVID-19 Spread in the 2020 Spring: A Study on the Potential Role of Particulate Using Time Series Analysis and Machine Learning


Abstract
1. Introduction
2. Materials and Methods
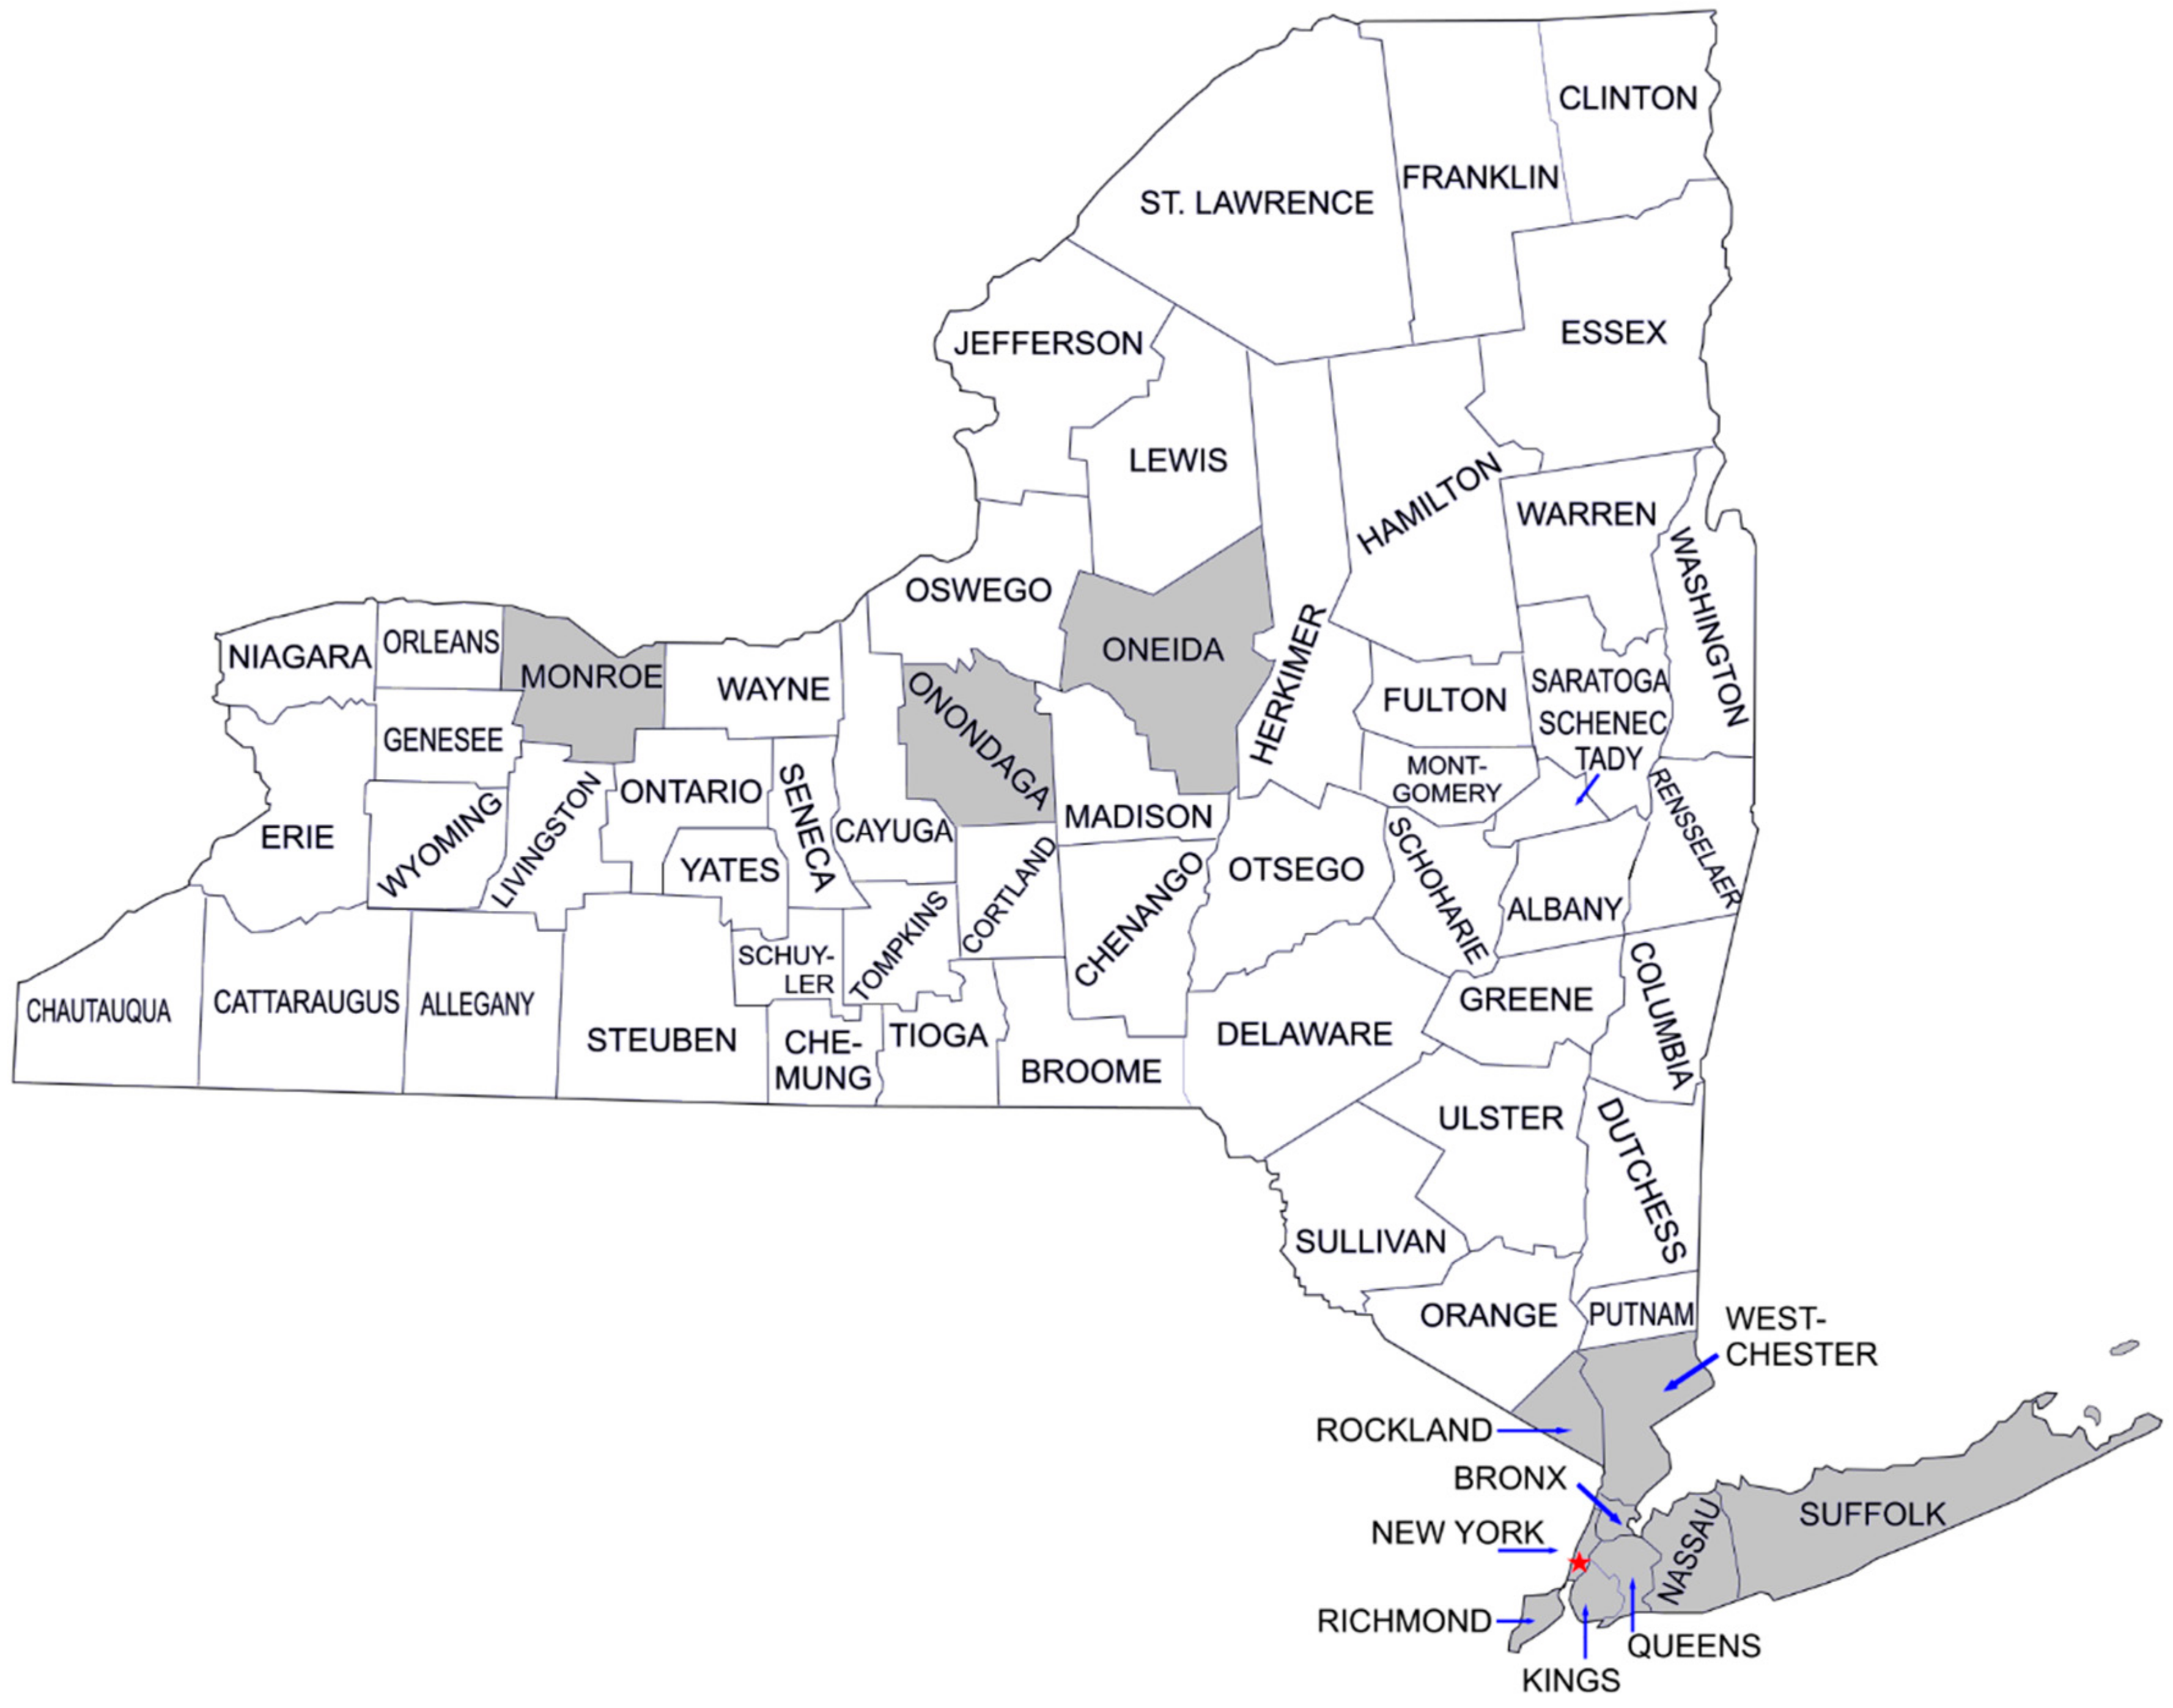
2.1. Dataset Description
2.2. Methodologies
2.2.1. Granger Causality
2.2.2. Machine Learning
3. Results
3.1. Granger Analysis: Results
3.2. Machine Learning: Results
| Algorithm 1 Dataset preparation algorithm. |
|
1: Input: raw data with number of infections and pollution values per county 2: Output: time series with pollution levels and infection threshold exceedances per county 3: begin 4: in_data = [] 5: out_data = [] 6: for each county in counties do 7: i = 0 8: for each day from 03/04 to 03/22 do 9: out_data[county][i] = infections[county][day] > threshold 10: in_data[county][i] = [] 11: for each lag from 0 to 7 do 12: in_data[county][i].append(pollution[county][day-14+lag]) 13: end for 14: i++ 15: end for 16: end for 17: end |
| Algorithm 2 Training and (county) cross validation algorithm. |
|
1: Input: time series with pollution levels and infection threshold exceedances per county 2: Output: predictions accuracy on the COVID-19 infections per each county 3: begin 4: results = [] 5: for each county in counties do 6: input_train = in_data[!county] 7: output_train = out_data[!county] 8: input_validation = in_data[county] 9: output_validation = out_data[county] 10: model.train(input_train, output_train) 11: output_pred = model.test(input_validation) 12: results.append(f1_score(output_result, output_validation) 13: end for 14: end |
4. Discussion and Conclusions
Author Contributions
Funding
Institutional Review Board Statement
Informed Consent Statement
Data Availability Statement
Conflicts of Interest
References
- Goldstein, J.; McKinley, J. Coronavirus in N.Y.: Manhattan Woman Is First Confirmed Case in State. The New York Times. 1 March 2020. Available online: https://www.nytimes.com/2020/03/01/nyregion/new-york-coronvirus-confirmed.html (accessed on 24 November 2020).
- Zurcher, A. Coronavirus spreading in New York like ‘a bullet train’. BBC News. 24 March 2020. Available online: https://www.bbc.com/news/world-us-canada-52012048 (accessed on 24 November 2020).
- Yang, W.; Shaff, J.; Shaman, J. COVID-19 Transmission Dynamics and Effectiveness of Public Health Interventions in New York City during the 2020 Spring Pandemic Wave. medRxiv 2020. [Google Scholar] [CrossRef]
- COVID-19 Dashboard by the Center for Systems Science and Engineering (CSSE) at Johns Hopkins University (JHU). 2020. Available online: https://gisanddata.maps.arcgis.com/apps/opsdashboard/index.html#/bda7594740fd40299423467b48e9ecf6 (accessed on 24 November 2020).
- Wynants, L.; Van Calster, B.; Collins, G.S.; Riley, R.D.; Heinze, G.; Schuit, E.; Bonten, M.M.; Dahly, D.L.; Damen, J.A.; Debray, T.P.; et al. Prediction models for diagnosis and prognosis of covid-19: Systematic review and critical appraisal. BMJ 2020, 369. [Google Scholar] [CrossRef]
- Roda, W.C.; Varughese, M.B.; Han, D.; Li, M.Y. Why is it difficult to accurately predict the COVID-19 epidemic? Infect. Dis. Model. 2020, 5, 271–281. [Google Scholar] [CrossRef] [PubMed]
- Dinnon, K.H.; Leist, S.R.; Schäfer, A.; Edwards, C.E.; Martinez, D.R.; Montgomery, S.A.; West, A.; Yount, B.L.; Hou, Y.J.; Adams, L.E.; et al. A mouse-adapted model of SARS-CoV-2 to test COVID-19 countermeasures. Nature 2020, 586, 1–7. [Google Scholar] [CrossRef] [PubMed]
- Rocklöv, J.; Sjödin, H.; Wilder-Smith, A. COVID-19 outbreak on the Diamond Princess cruise ship: Estimating the epidemic potential and effectiveness of public health countermeasures. J. Travel Med. 2020, 27. [Google Scholar] [CrossRef]
- Rezaei, M.; Azarmi, M. DeepSOCIAL: Social Distancing Monitoring and Infection Risk Assessment in COVID-19 Pandemic. Appl. Sci. 2020, 10, 7514. [Google Scholar] [CrossRef]
- Lauritano, D.; Moreo, G.; Limongelli, L.; Nardone, M.; Carinci, F. Environmental Disinfection Strategies to Prevent Indirect Transmission of SARS-CoV2 in Healthcare Settings. Appl. Sci. 2020, 10, 6291. [Google Scholar] [CrossRef]
- Ahmed, N.; Michelin, R.A.; Xue, W.; Ruj, S.; Malaney, R.; Kanhere, S.S.; Seneviratne, A.; Hu, W.; Janicke, H.; Jha, S.K. A survey of covid-19 contact tracing apps. IEEE Access 2020, 8, 134577–134601. [Google Scholar] [CrossRef]
- Hellewell, J.; Abbott, S.; Gimma, A.; Bosse, N.I.; Jarvis, C.I.; Russell, T.W.; Munday, J.D.; Kucharski, A.J.; Edmunds, W.J.; Sun, F.; et al. Feasibility of controlling COVID-19 outbreaks by isolation of cases and contacts. Lancet Glob. Health 2020, 8, e488–e4996. [Google Scholar] [CrossRef]
- Kretzschmar, M.E.; Rozhnova, G.; Bootsma, M.C.; van Boven, M.; van de Wijgert, J.H.; Bonten, M.J. Impact of delays on effectiveness of contact tracing strategies for COVID-19: A modelling study. Lancet Public Health 2020, 5, e452–e459. [Google Scholar] [CrossRef]
- Hernández-Orallo, E.; Calafate, C.T.; Cano, J.-C.; Manzoni, P. Evaluating the Effectiveness of COVID-19 Bluetooth-Based Smartphone Contact Tracing Applications. Appl. Sci. 2020, 10, 7113. [Google Scholar] [CrossRef]
- Di Crosta, A.; Palumbo, R.; Marchetti, D.; Ceccato, I.; La Malva, P.; Maiella, R.; Cipi, M.; Roma, P.; Mammarella, N.; Verrocchio, M.C. Individual differences, economic stability, and fear of contagion as risk factors for PTSD symptoms in the COVID-19 emergency. Front. Psychol. 2020, 11, 2329. [Google Scholar] [CrossRef] [PubMed]
- Staszkiewicz, P.; Chomiak-Orsa, I. Dynamics of the COVID-19 Contagion and Mortality: Country Factors, Social Media, and Market Response Evidence from a Global Panel Analysis. IEEE Access 2020, 8, 106009–106022. [Google Scholar] [CrossRef]
- Marini, J.J.; Gattinoni, L. Management of COVID-19 Respiratory Distress. JAMA 2020, 323, 2329. [Google Scholar] [CrossRef] [PubMed]
- Shakil, M.H.; Munim, Z.H.; Tasnia, M.; Sarowar, S. COVID-19 and the environment: A critical review and research agenda. Sci. Total. Environ. 2020, 745, 141022. [Google Scholar] [CrossRef]
- Wu, X.; Nethery, R.C.; Sabath, M.B.; Braun, D.; Dominici, F. Air pollution and COVID-19 mortality in the United States: Strengths and limitations of an ecological regression analysis. Sci. Adv. 2020, 6, eabd4049. [Google Scholar] [CrossRef]
- Becchetti, L.; Conzo, G.; Conzo, P.; Salustri, F. Understanding the Heterogeneity of Adverse COVID-19 Outcomes: The Role of Poor Quality of Air and Lockdown Decisions. SSRN Electron. J. 2020. [Google Scholar] [CrossRef]
- Setti, L.; Passarini, F.; De Gennaro, G.; Barbieri, P.; Licen, S.; Perrone, M.G.; Piazzalunga, A.; Borelli, M.; Palmisani, J.; Di Gilio, A.; et al. Potential role of particulate matter in the spreading of COVID-19 in Northern Italy: First observational study based on initial epidemic diffusion. BMJ Open 2020, 10, e039338. [Google Scholar] [CrossRef]
- Delnevo, G.; Mirri, S.; Roccetti, M. Particulate Matter and COVID-19 Disease Diffusion in Emilia-Romagna (Italy). Already a Cold Case? Computation 2020, 8, 59. [Google Scholar] [CrossRef]
- Mirri, S.; Delnevo, G.; Roccetti, M. Is a COVID-19 Second Wave Possible in Emilia-Romagna (Italy)? Forecasting a Future Outbreak with Particulate Pollution and Machine Learning. Computation 2020, 8, 74. [Google Scholar] [CrossRef]
- Jiang, Y.; Wu, X.-J.; Guan, Y.-J. Effect of ambient air pollutants and meteorological variables on COVID-19 incidence. Infect. Control. Hosp. Epidemiol. 2020, 41, 1011–1015. [Google Scholar] [CrossRef] [PubMed]
- New York State Department of Health COVID-19 Tracker. Available online: https://covid19tracker.health.ny.gov/views/NYS-COVID19-Tracker/NYSDOHCOVID-19Tracker-DailyTracker (accessed on 24 November 2020).
- United States Environmental Protection Agency. Outdoor Air Quality Data. Available online: https://www.epa.gov/outdoor-air-quality-data/download-daily-data (accessed on 24 November 2020).
- Li, Q.; Guan, X.; Wu, P.; Wang, X.; Zhou, L.; Tong, Y.; Ren, R.; Leung, K.S.; Lau, E.H.; Wong, J.Y.; et al. Early transmission dynamics in Wuhan, China, of novel coronavirus–infected pneumonia. N. Engl. J. Med. 2020. [Google Scholar] [CrossRef] [PubMed]
- Cereda, D.; Tirani, M.; Rovida, F.; Demicheli, V.; Ajelli, M.; Poletti, P.; Trentini, F.; Guzzetta, G.; Marziano, V.; Barone, A.; et al. The early phase of the COVID-19 outbreak in Lombardy, Italy. arXiv 2020, arXiv:2003.09320. [Google Scholar]
- New York State on PAUSE. Available online: https://coronavirus.health.ny.gov/new-york-state-pause (accessed on 24 November 2020).
- TownCharts. Top 25 New-York Counties Ranked by Population Density. Available online: https://www.towncharts.com/New-York/Top-25-Counties-in-New-York-ranked-by-Population-Density.html (accessed on 24 November 2020).
- WHO. Air Quality Guidelines for Particulate Matter, Ozone, Nitrogen Dioxide and Sulfur Dioxide. Available online: https://apps.who.int/iris/bitstream/handle/10665/69477/WHO_SDE_PHE_OEH_06.02_eng.pdf?sequence=1 (accessed on 24 November 2020).
- Granger, C. Investigating Causal Relations by Econometric Models and Cross-spectral Methods. Econometrica 1969, 37, 424–438. [Google Scholar] [CrossRef]
- Granger, C.W. Testing for causality: A personal viewpoint. J. Econ. Dyn. Control 1980, 2, 329–352. [Google Scholar] [CrossRef]
- Dickey, D.; Fuller, W. Distribution of the estimators for autoregressive time series with a unit root. J. Am. Stat. Assoc. 1979, 74, 427–431. [Google Scholar] [CrossRef]
- Roccetti, M.; Delnevo, G.; Casini, L.; Cappiello, G. Is bigger always better? A controversial journey to the center of machine learning design, with uses and misuses of big data for predicting water meter failures. J. Big Data 2019, 6, 70. [Google Scholar] [CrossRef]
- Carbonaro, A.; Piccinini, F.; Reda, R. Integrating Heterogeneous Data of Healthcare Devices to enable Domain Data Management. J. e-Learn. Knowl. Soc. 2018, 14. [Google Scholar] [CrossRef]
- Salomoni, P.; Mirri, S.; Ferretti, S.; Roccetti, M. Profiling learners with special needs for custom e-Learning experiences, a closed case? In Proceedings of the International Cross-Disciplinary Conference on Web Accessibility (W4A 2007), Banff, AB, Canada, 7–8 May 2007; pp. 84–92. [Google Scholar]
- Keller, J.M.; Gray, M.R.; Givens, J.A. A fuzzy k-nearest neighbor algorithm. IEEE Trans. Syst. Man Cybern. 1985, 4, 580–585. [Google Scholar] [CrossRef]
- Cortes, C.; Vapnik, V. Support-vector networks. Mach. Learn. 1995, 20, 273–297. [Google Scholar] [CrossRef]
- Hastie, T.; Tibshirani, R.; Friedman, J.; Franklin, J. The elements of statistical learning: Data mining, inference and prediction. Math. Intell. 2005, 27, 83–85. [Google Scholar]
- Geurts, P.; Ernst, D.; Wehenkel, L. Extremely randomized trees. Mach. Learn. 2006, 63, 3–42. [Google Scholar] [CrossRef]


| County | Density | Population |
|---|---|---|
| New York | 72,056 | 1,632,480 |
| Kings | 37,252 | 2,600,750 |
| Bronx | 21,132 | 1,437,870 |
| Queens | 34,194 | 2,298,510 |
| Richmond | 8149 | 474,101 |
| Nassau | 4763 | 1,356,560 |
| Westchester | 2250 | 968,815 |
| Rockland | 1866 | 323,686 |
| Suffolk | 1632 | 1,487,900 |
| Monroe | 1132 | 744,248 |
| Onondaga | 596 | 464,242 |
| Oneida | 190 | 230,782 |
| County | PM2.5 | # of Days with PM2.5 > 10 | ||||
|---|---|---|---|---|---|---|
| 19/02–08/03 | 19/02–31/07 | Increase | Percentage | 19/02–08/03 | 19/02–31/07 | |
| New York | 7.48 | 6.63 | +0.85 | +12.8% | 4 | 10 |
| Kings | 6.27 | 5.28 | +0.99 | +18.8% | 2 | 8 |
| Bronx | 7.62 | 6.47 | +1.15 | +17.8% | 5 | 15 |
| Queens | 6.87 | 5.79 | +1.08 | +18.7% | 4 | 14 |
| Richmond | 6.86 | 5.63 | +1.23 | +21.8% | 5 | 12 |
| Nassau | 6.52 | 5.18 | +1.34 | +25.9% | 3 | 7 |
| Westchester | 6.08 | 4.77 | +1.31 | +27.5% | 2 | 4 |
| Rockland | 6.14 | 4.82 | +1.32 | +27.4% | 3 | 6 |
| Suffolk | 6.35 | 5.4 | +0.95 | +17.6% | 2 | 9 |
| Monroe | 7.11 | 6,15 | +0.96 | +15.6% | 3 | 13 |
| Onondaga | 8.51 | 6.38 | +2.13 | +33.4% | 5 | 11 |
| Oneida | 6.63 | 4.38 | +2.25 | +51.4% | 3 | 6 |
| Average | 24.04% | |||||
| County | Number of Infections (Four Days) | |||
|---|---|---|---|---|
| 17/03 | 18/03 | 19/03 | 20/03 | |
| New York | 69 | 161 | 335 | 437 |
| Kings | 39 | 264 | 273 | 674 |
| Bronx | 29 | 123 | 154 | 191 |
| Queens | 38 | 123 | 336 | 519 |
| Richmond | 11 | 26 | 33 | 116 |
| Nassau | 24 | 52 | 186 | 385 |
| Westchester | 157 | 158 | 261 | 292 |
| Rockland | 9 | 8 | 23 | 48 |
| Suffolk | 22 | 31 | 62 | 193 |
| Monroe | 1 | 4 | 13 | 5 |
| Onondaga | 1 | 0 | 3 | 3 |
| Oneida | 0 | 0 | 2 | 0 |
| Overall Average | 122.8 | |||
| Start Date (Infections) | 04/03 | ||
|---|---|---|---|
| End Date (Infections) | 20/3 | 21/03 | 22/03 |
| New York | <10−4 | 0.0518 | 0.0902 |
| Kings | <10−4 | 0.0003 | <10−4 |
| Bronx | <10−4 | 0.0011 | 0.0003 |
| Queens | <10−4 | 0.0002 | 0.1283 |
| Richmond | <10−4 | <10−4 | <10−4 |
| Nassau | <10−4 | <10−4 | 0.0018 |
| Westchester | <10−4 | <10−4 | <10−4 |
| Rockland | 0.0071 | 0.0 | <10−4 |
| Suffolk | <10−4 | <10−4 | <10−4 |
| Monroe | <10−4 | 0.0058 | 0.001 |
| Onondaga | <10−4 | <10−4 | <10−4 |
| Oneida | <10−4 | <10−4 | <10−4 |
| Algorithm | Hyper-Parameters | Value |
|---|---|---|
| KNN | N Neighbors | 5 |
| Weights | Uniform | |
| SVC | C | 1 |
| Kernel | RBF | |
| Degree | 3 | |
| Gamma | 1/8 | |
| MLP | Hidden Layer | 1 |
| Hidden Layer size | 100 | |
| Max Epochs | 500 | |
| Activation Function | ReLU | |
| Optimization Algorithm | Adam | |
| Batch Size | 16 | |
| Learning Rate | 0.001 | |
| ET | N Estimators | 50 |
| Criterion | Gini | |
| Min Samples Split | 2 | |
| Min Samples Leaf | 1 | |
| Max Features | ||
| Bootstrap | False |
| County | KNN | SVC | MLP | ET | Avg. per County |
|---|---|---|---|---|---|
| New York | 1 | 1 | 0.95 | 0.82 | 0.94 |
| Kings | 0.95 | 0.8 | 1 | 0.79 | 0.89 |
| Bronx | 0.85 | 1 | 0.95 | 0.82 | 0.91 |
| Queens | 0.9 | 0.89 | 0.89 | 0.89 | 0.89 |
| Richmond | 0.87 | 0.87 | 0.87 | 0.91 | 0.88 |
| Nassau | 0.8 | 0.7 | 0.95 | 0.89 | 0.84 |
| Rockland | 0.77 | 0.82 | 0.82 | 0.82 | 0.81 |
| Westchester | 0.95 | 0.83 | 0.76 | 0.76 | 0.83 |
| Suffolk | 0.9 | 0.85 | 0.85 | 0.9 | 0.88 |
| Rockland | 0.77 | 0.82 | 0.82 | 0.82 | 0.81 |
| Avg per algorithm | 0.89 | 0.86 | 0.89 | 0.84 | |
| Monroe | 0.85 | 0.85 | 0.88 | 0.91 | 0.87 |
| Onondaga | 0.85 | 0.88 | 0.91 | 1 | 0.91 |
| Oneida | 0.91 | 0.94 | 1 | 0.94 | 0.95 |
| Avg per algorithm | 0.87 | 0.89 | 0.93 | 0.95 |
Publisher’s Note: MDPI stays neutral with regard to jurisdictional claims in published maps and institutional affiliations. |
© 2021 by the authors. Licensee MDPI, Basel, Switzerland. This article is an open access article distributed under the terms and conditions of the Creative Commons Attribution (CC BY) license (http://creativecommons.org/licenses/by/4.0/).
Share and Cite
Mirri, S.; Roccetti, M.; Delnevo, G. The New York City COVID-19 Spread in the 2020 Spring: A Study on the Potential Role of Particulate Using Time Series Analysis and Machine Learning. Appl. Sci. 2021, 11, 1177. https://doi.org/10.3390/app11031177
Mirri S, Roccetti M, Delnevo G. The New York City COVID-19 Spread in the 2020 Spring: A Study on the Potential Role of Particulate Using Time Series Analysis and Machine Learning. Applied Sciences. 2021; 11(3):1177. https://doi.org/10.3390/app11031177
Chicago/Turabian StyleMirri, Silvia, Marco Roccetti, and Giovanni Delnevo. 2021. "The New York City COVID-19 Spread in the 2020 Spring: A Study on the Potential Role of Particulate Using Time Series Analysis and Machine Learning" Applied Sciences 11, no. 3: 1177. https://doi.org/10.3390/app11031177
APA StyleMirri, S., Roccetti, M., & Delnevo, G. (2021). The New York City COVID-19 Spread in the 2020 Spring: A Study on the Potential Role of Particulate Using Time Series Analysis and Machine Learning. Applied Sciences, 11(3), 1177. https://doi.org/10.3390/app11031177