
Optimization of Multi-Energy Microgrid Operation in the Presence of PV, Heterogeneous Energy Storage and Integrated Demand Response


Abstract
1. Introduction
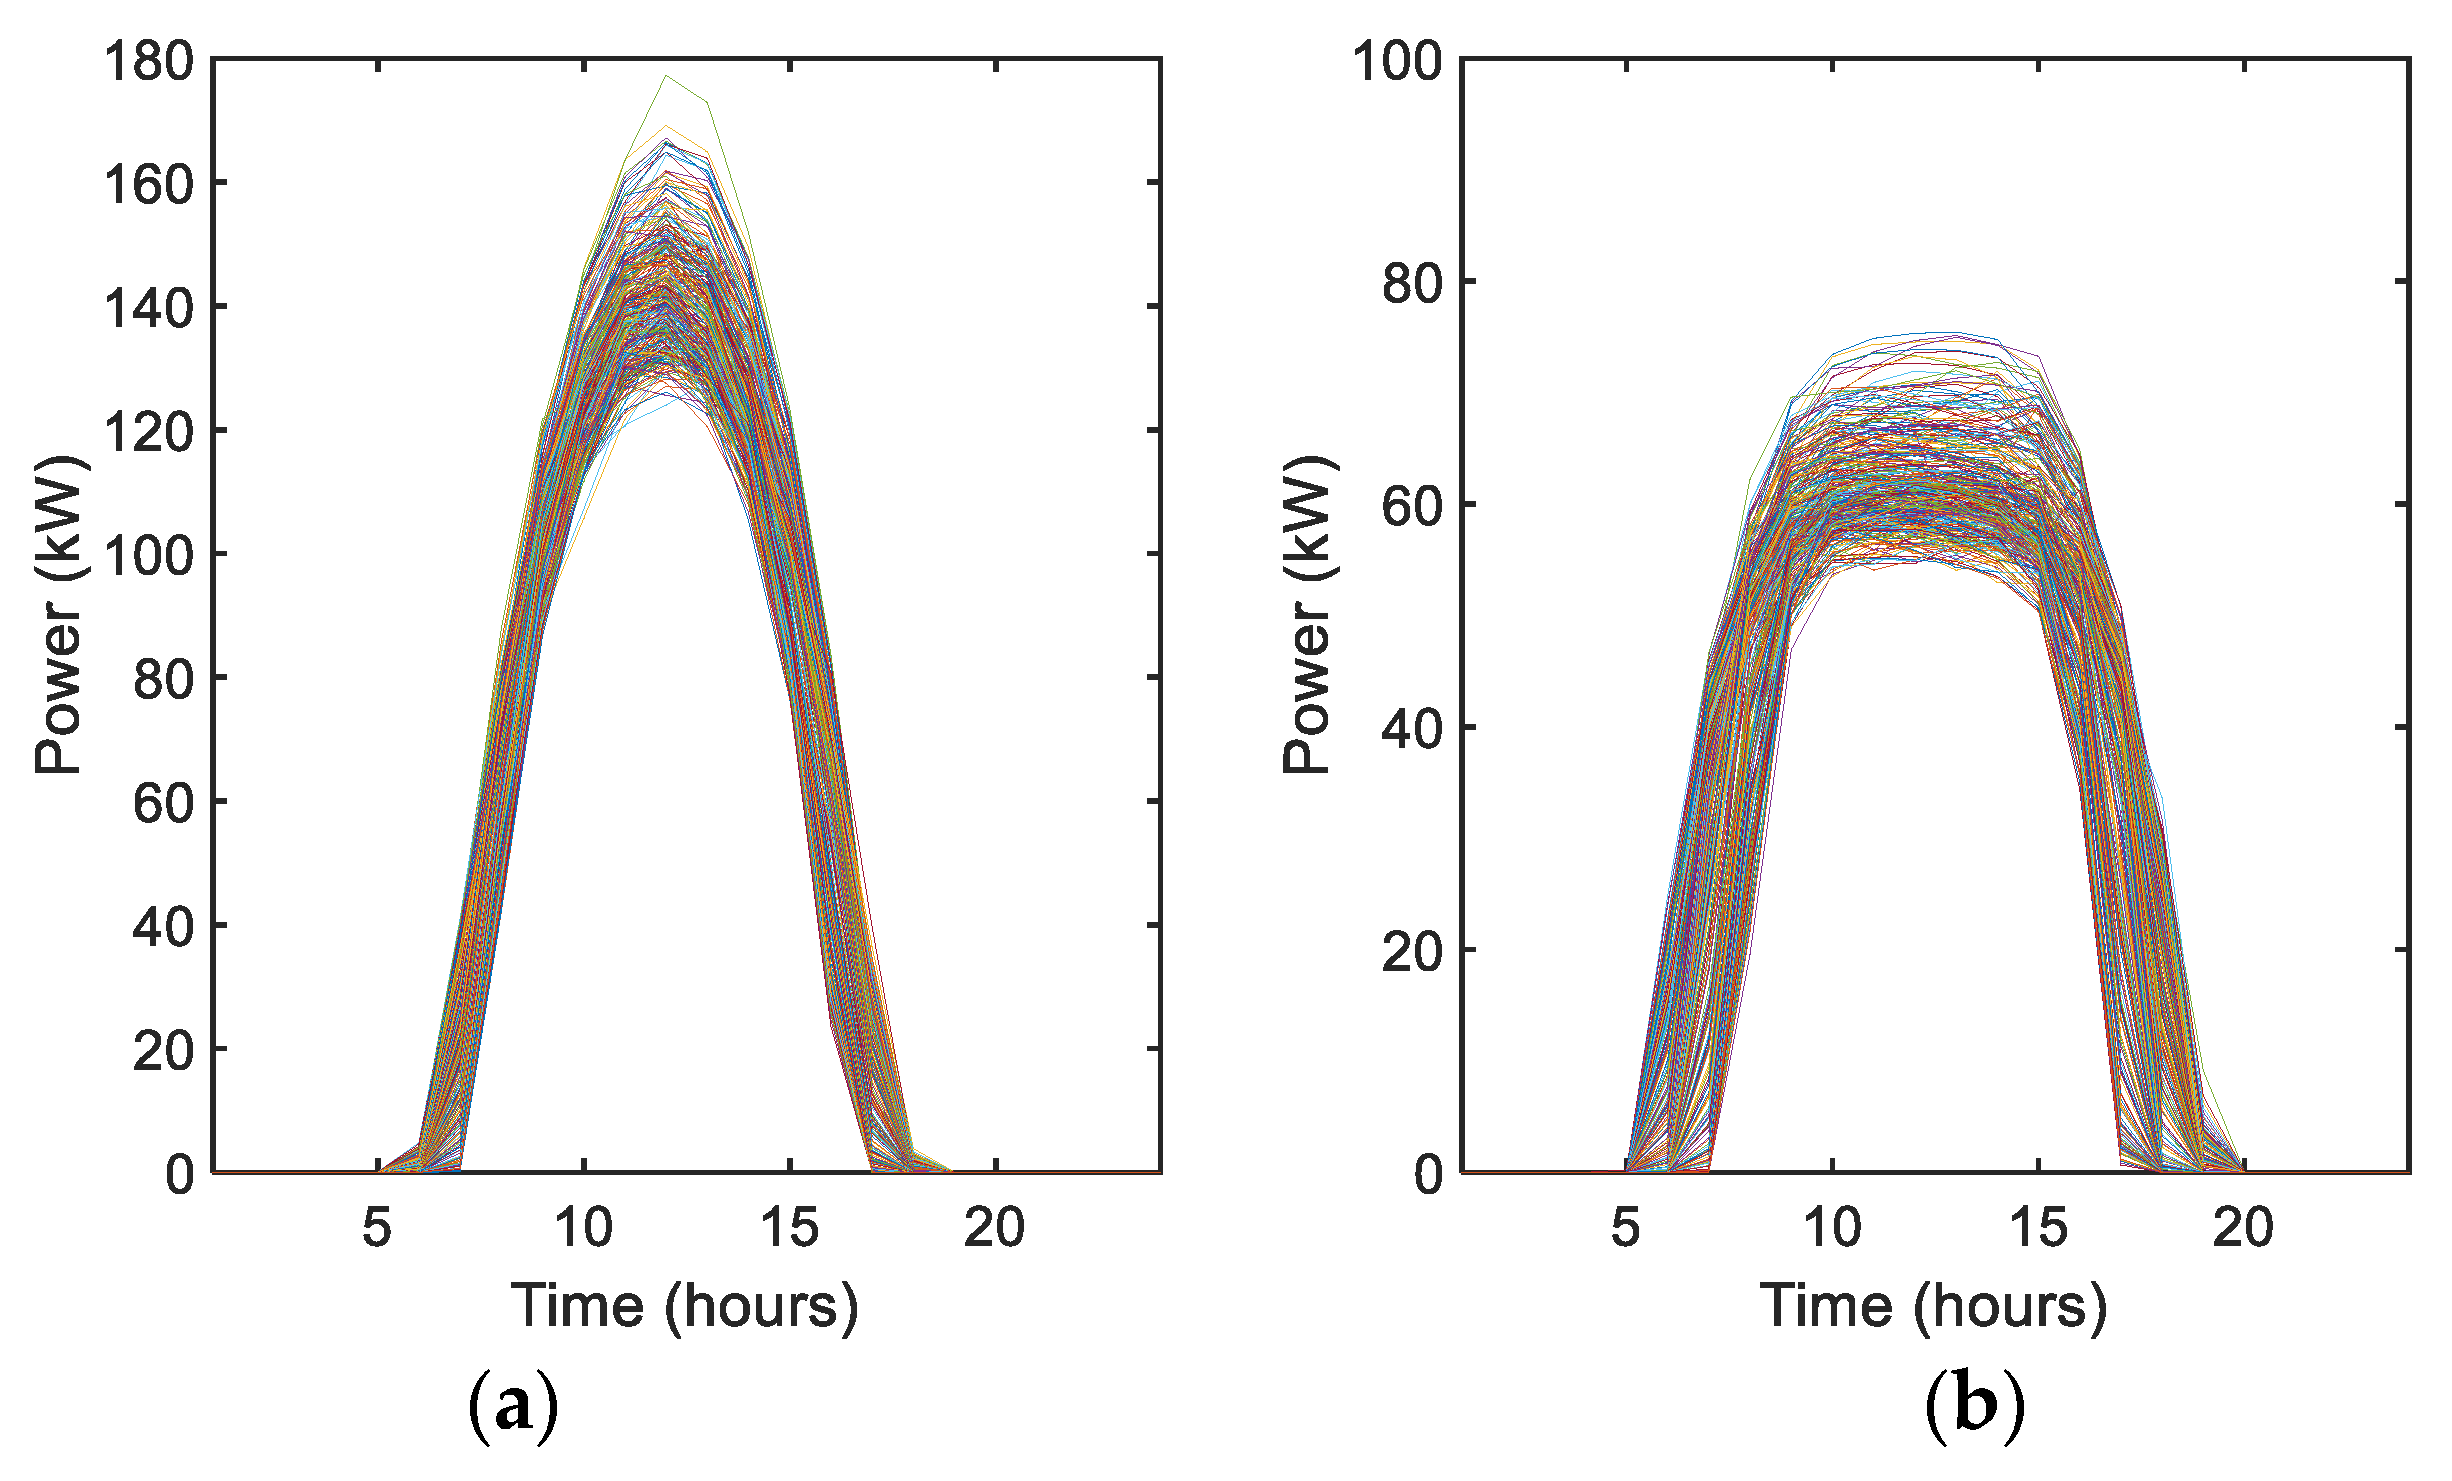
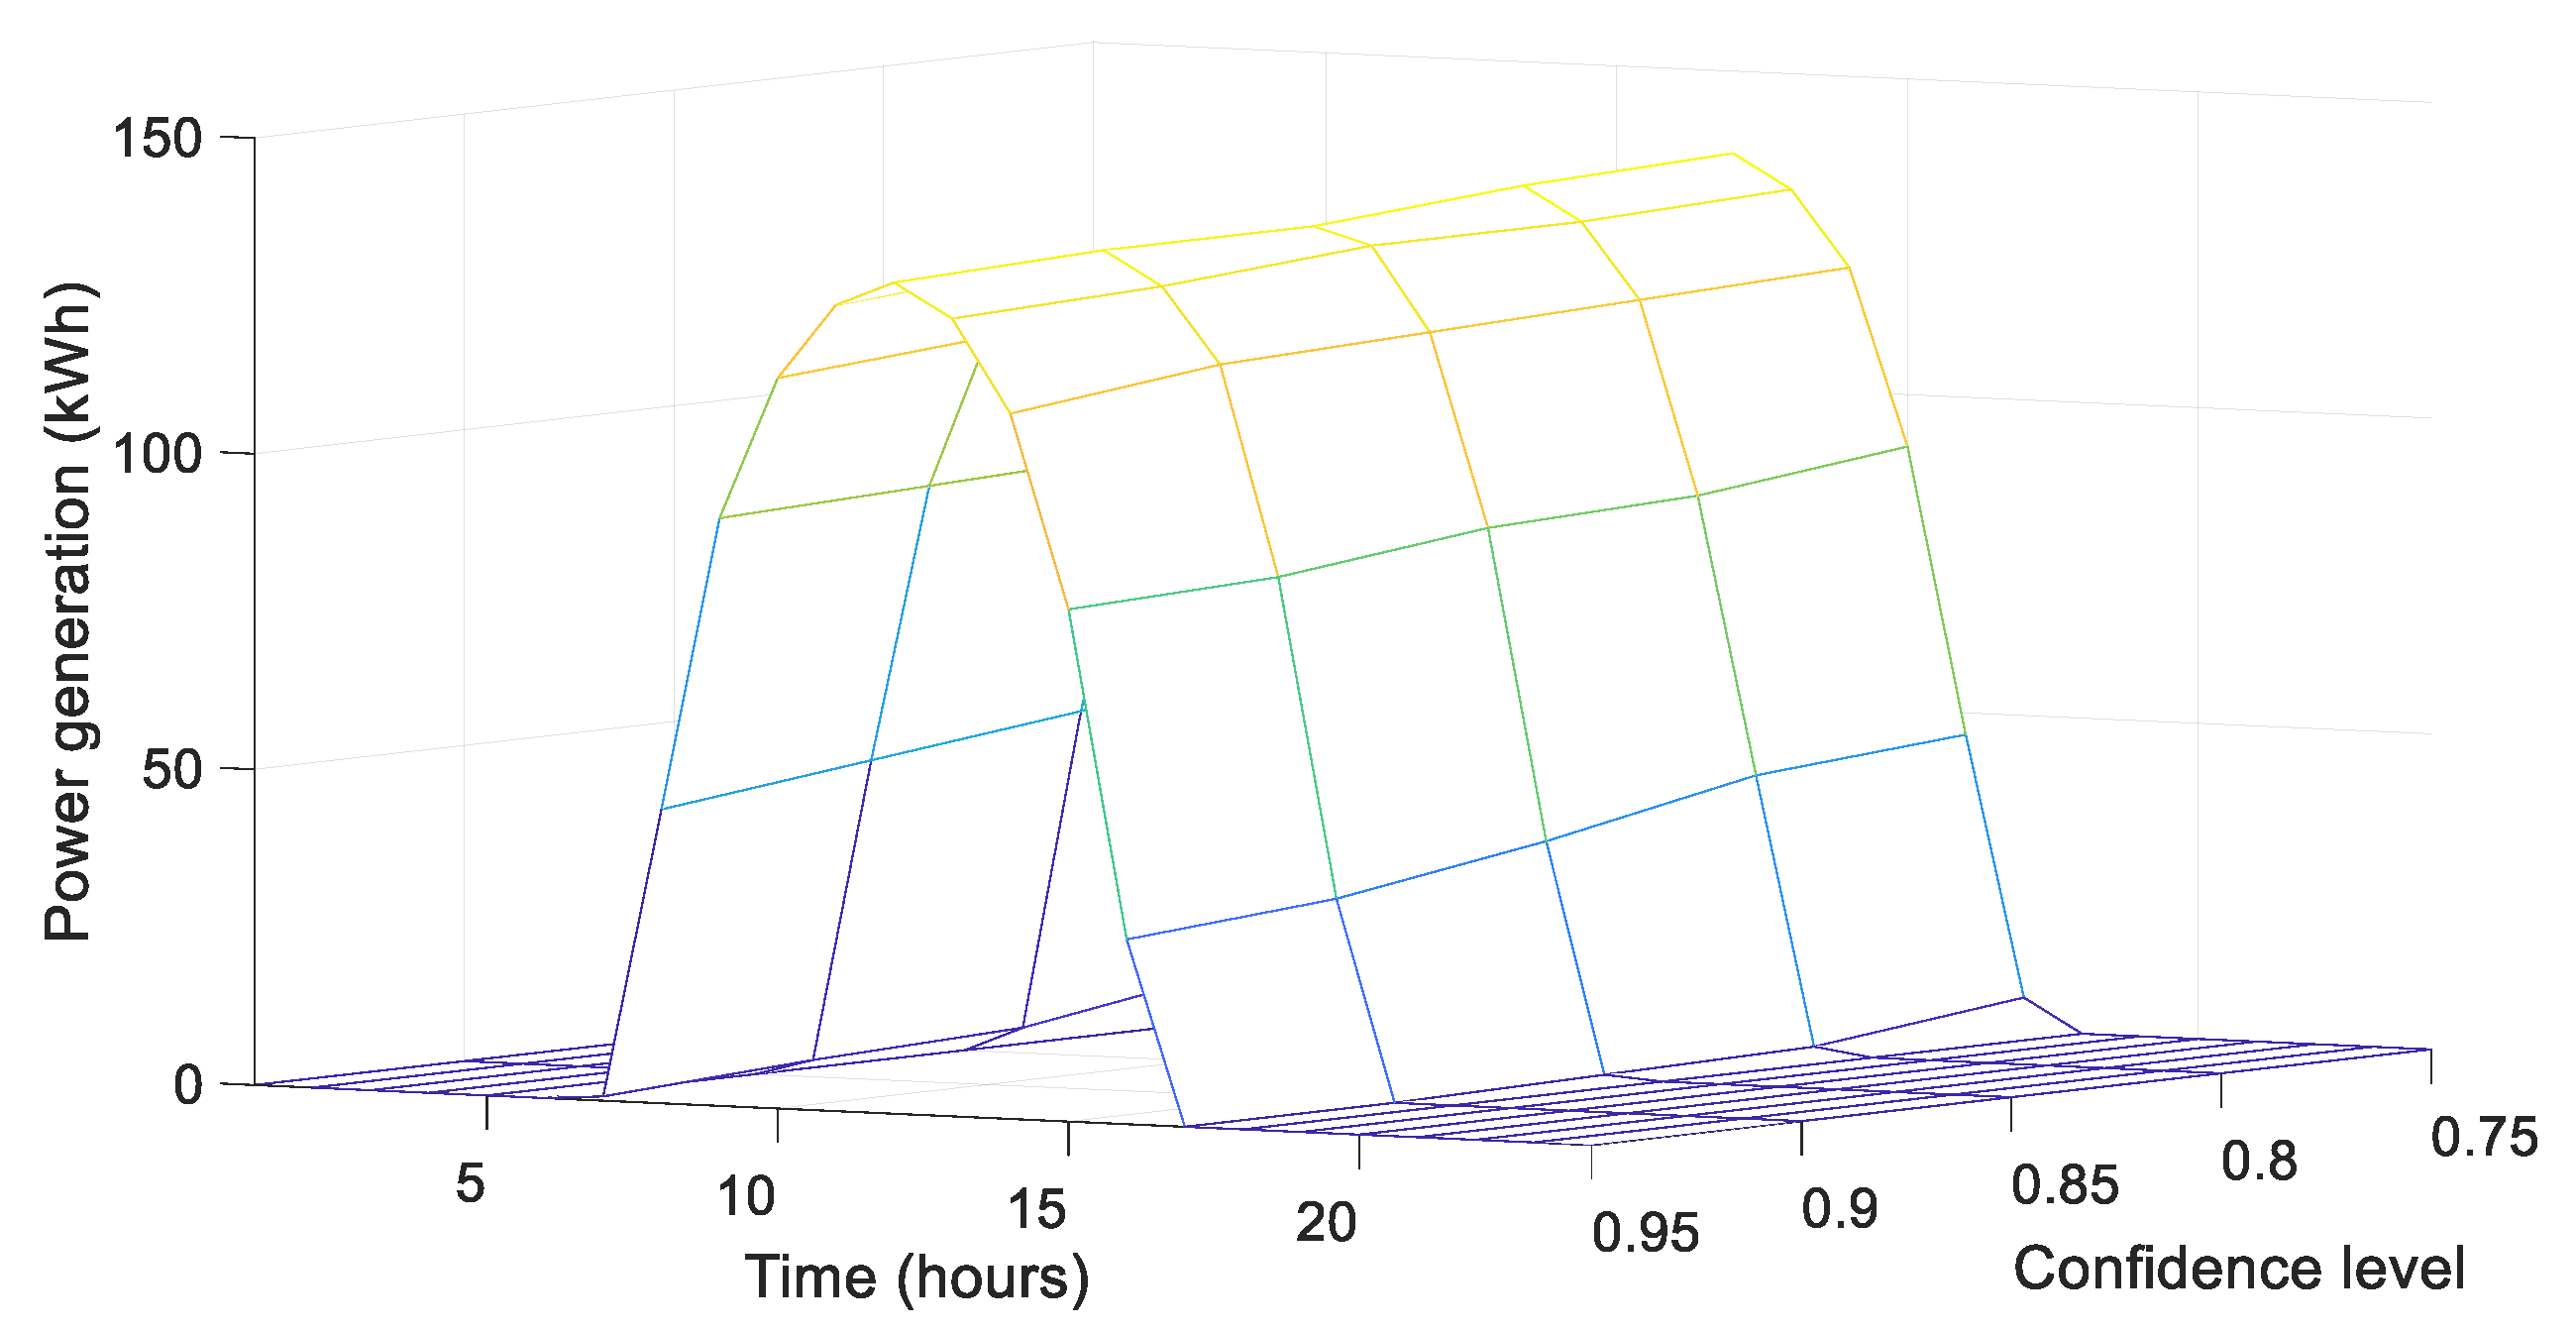
- To properly handle the uncertainty of variable PV generation, the p-efficient point method is applied to determine the expected PV generation amounts based on historical data at given confidence levels and then incorporate them into the MEMG optimization problem.
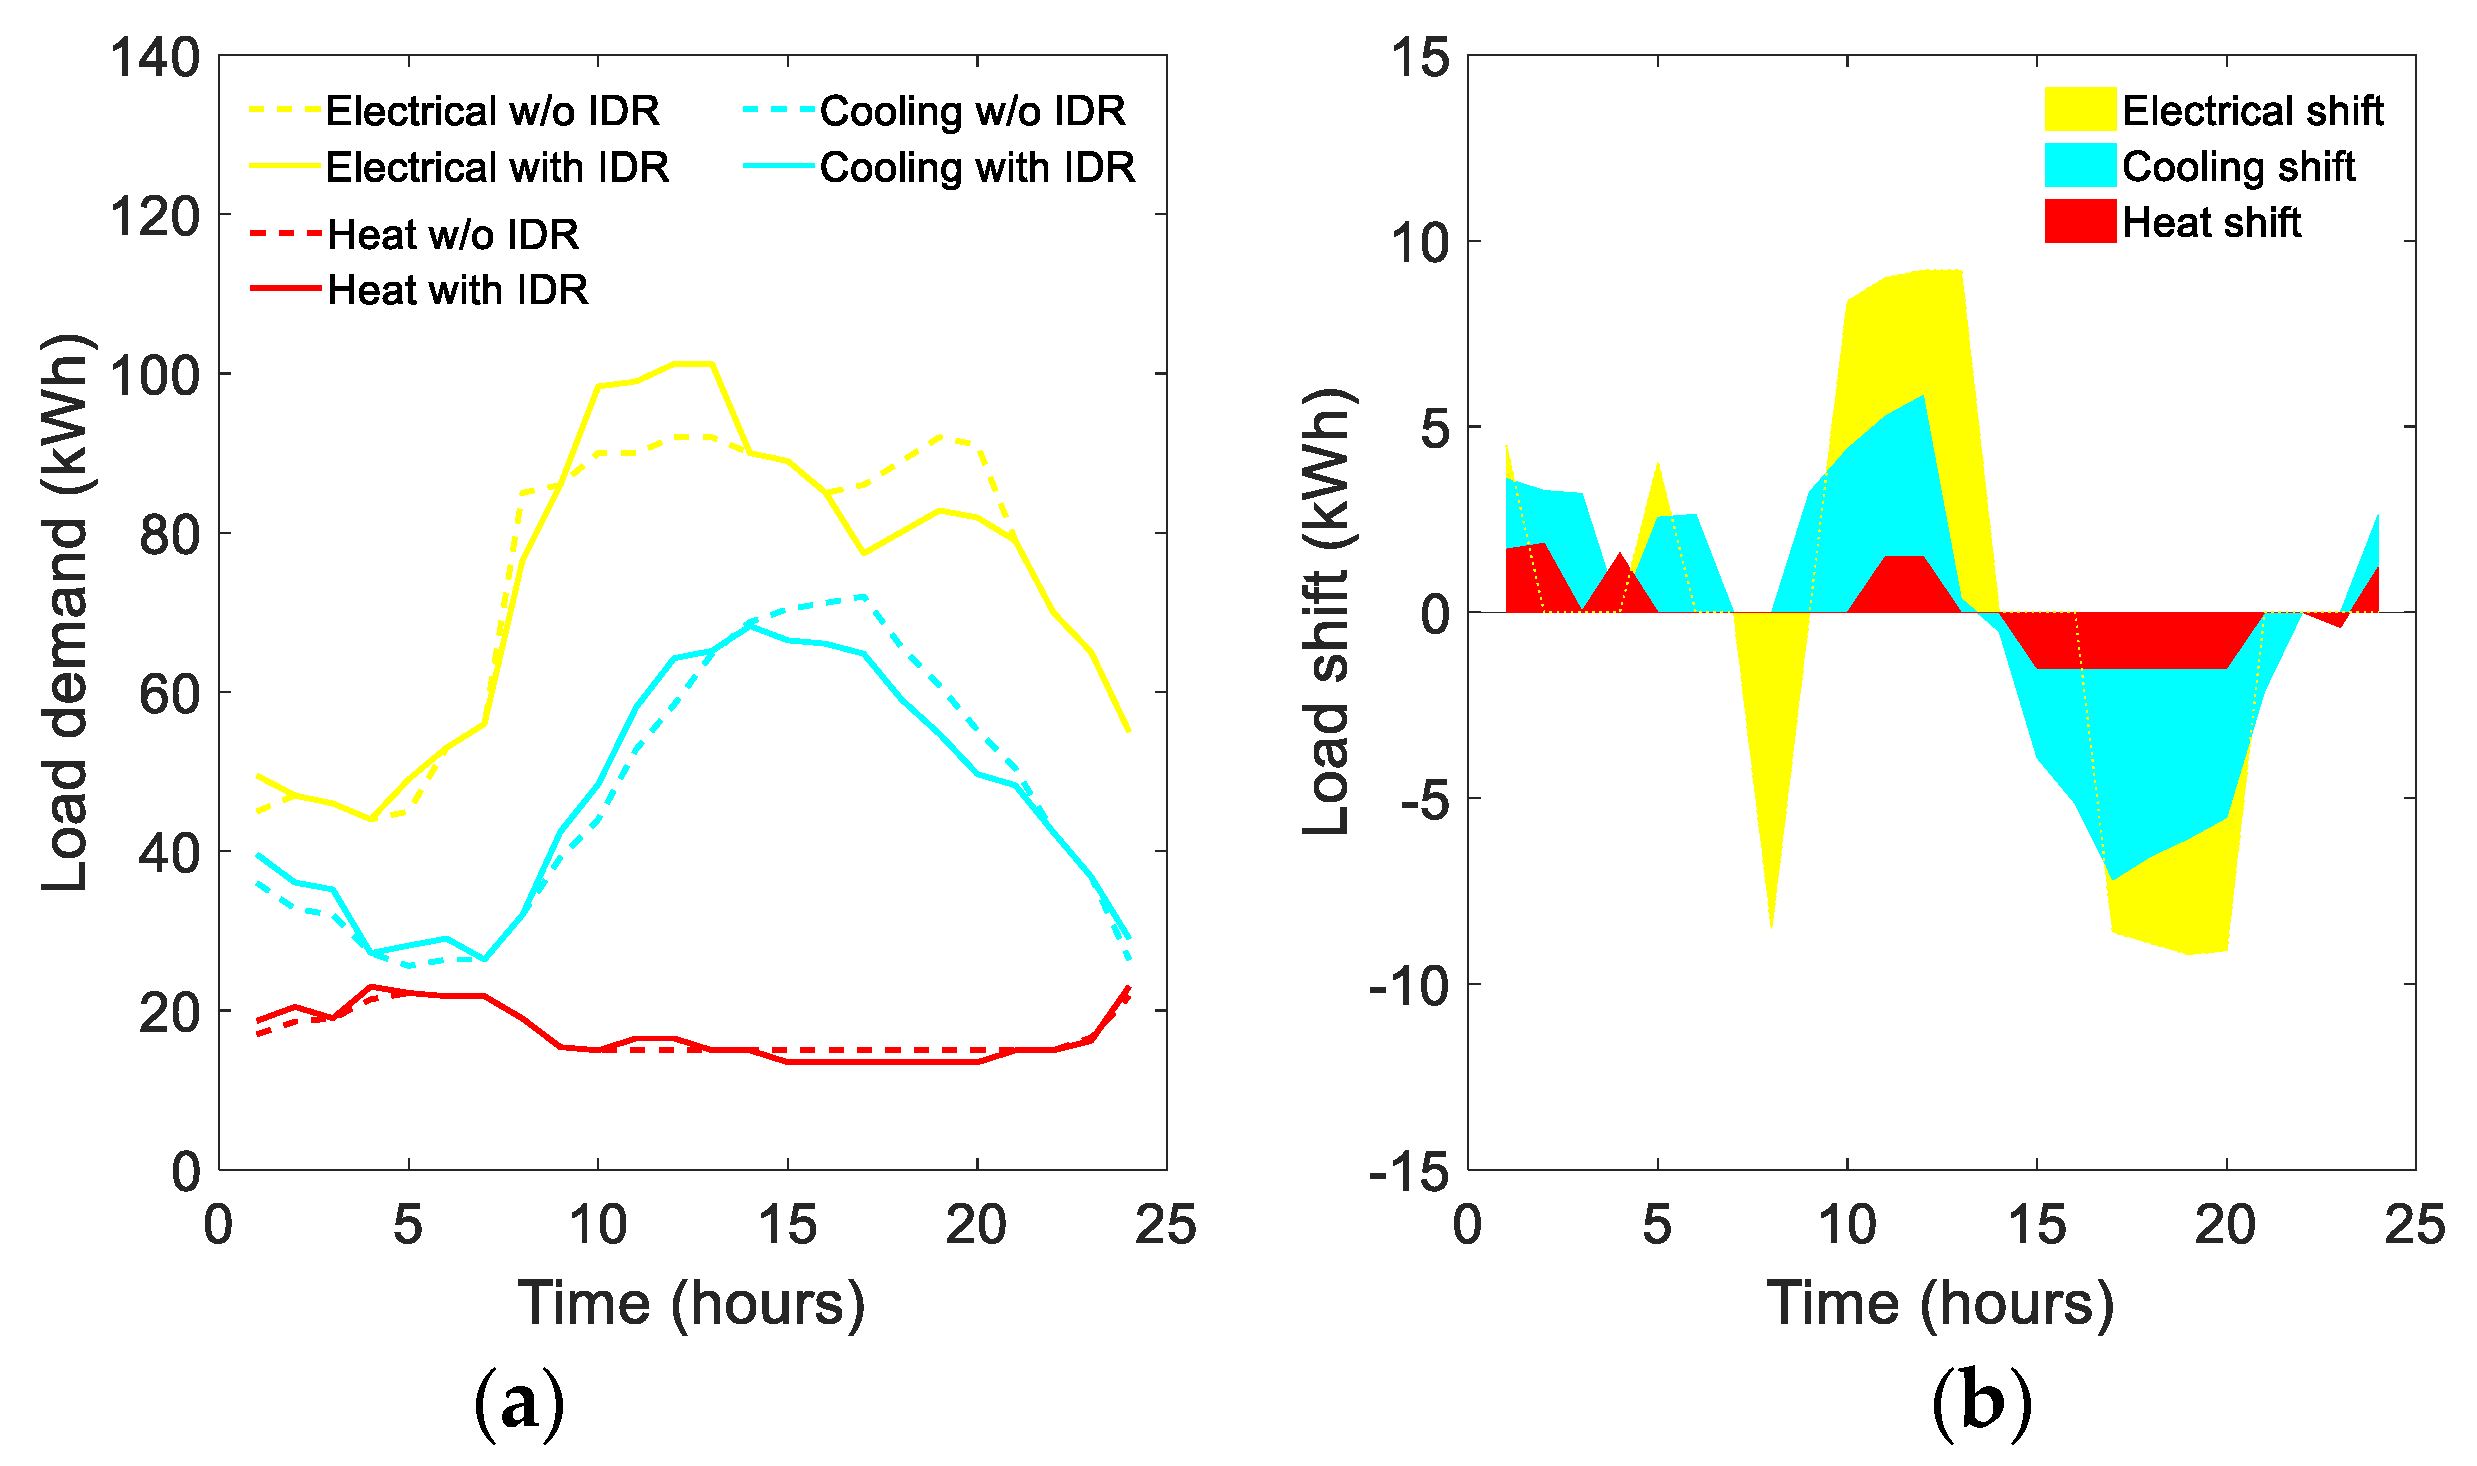
- A generalized model for IDR is developed, and the role of IDR in accommodating PV generation within MEMGs is investigated.
- A mixed-integer linear programming (MILP) model for properly integrating and coordinating the deployment of IDR, HES and also the energy conversion facilities for economic system operation is proposed. Coordinated operation of electrical, heating and cooling energy storage is optimized.
- The proposed model is implemented on two typical summer and winter days for various cases to validate its effectiveness and feasibility. According to the obtained results, the proposed strategy can help the system operator to reduce the total energy costs by 5.44% on a typical summer day and 3.5% on a typical winter day.
2. System Modeling
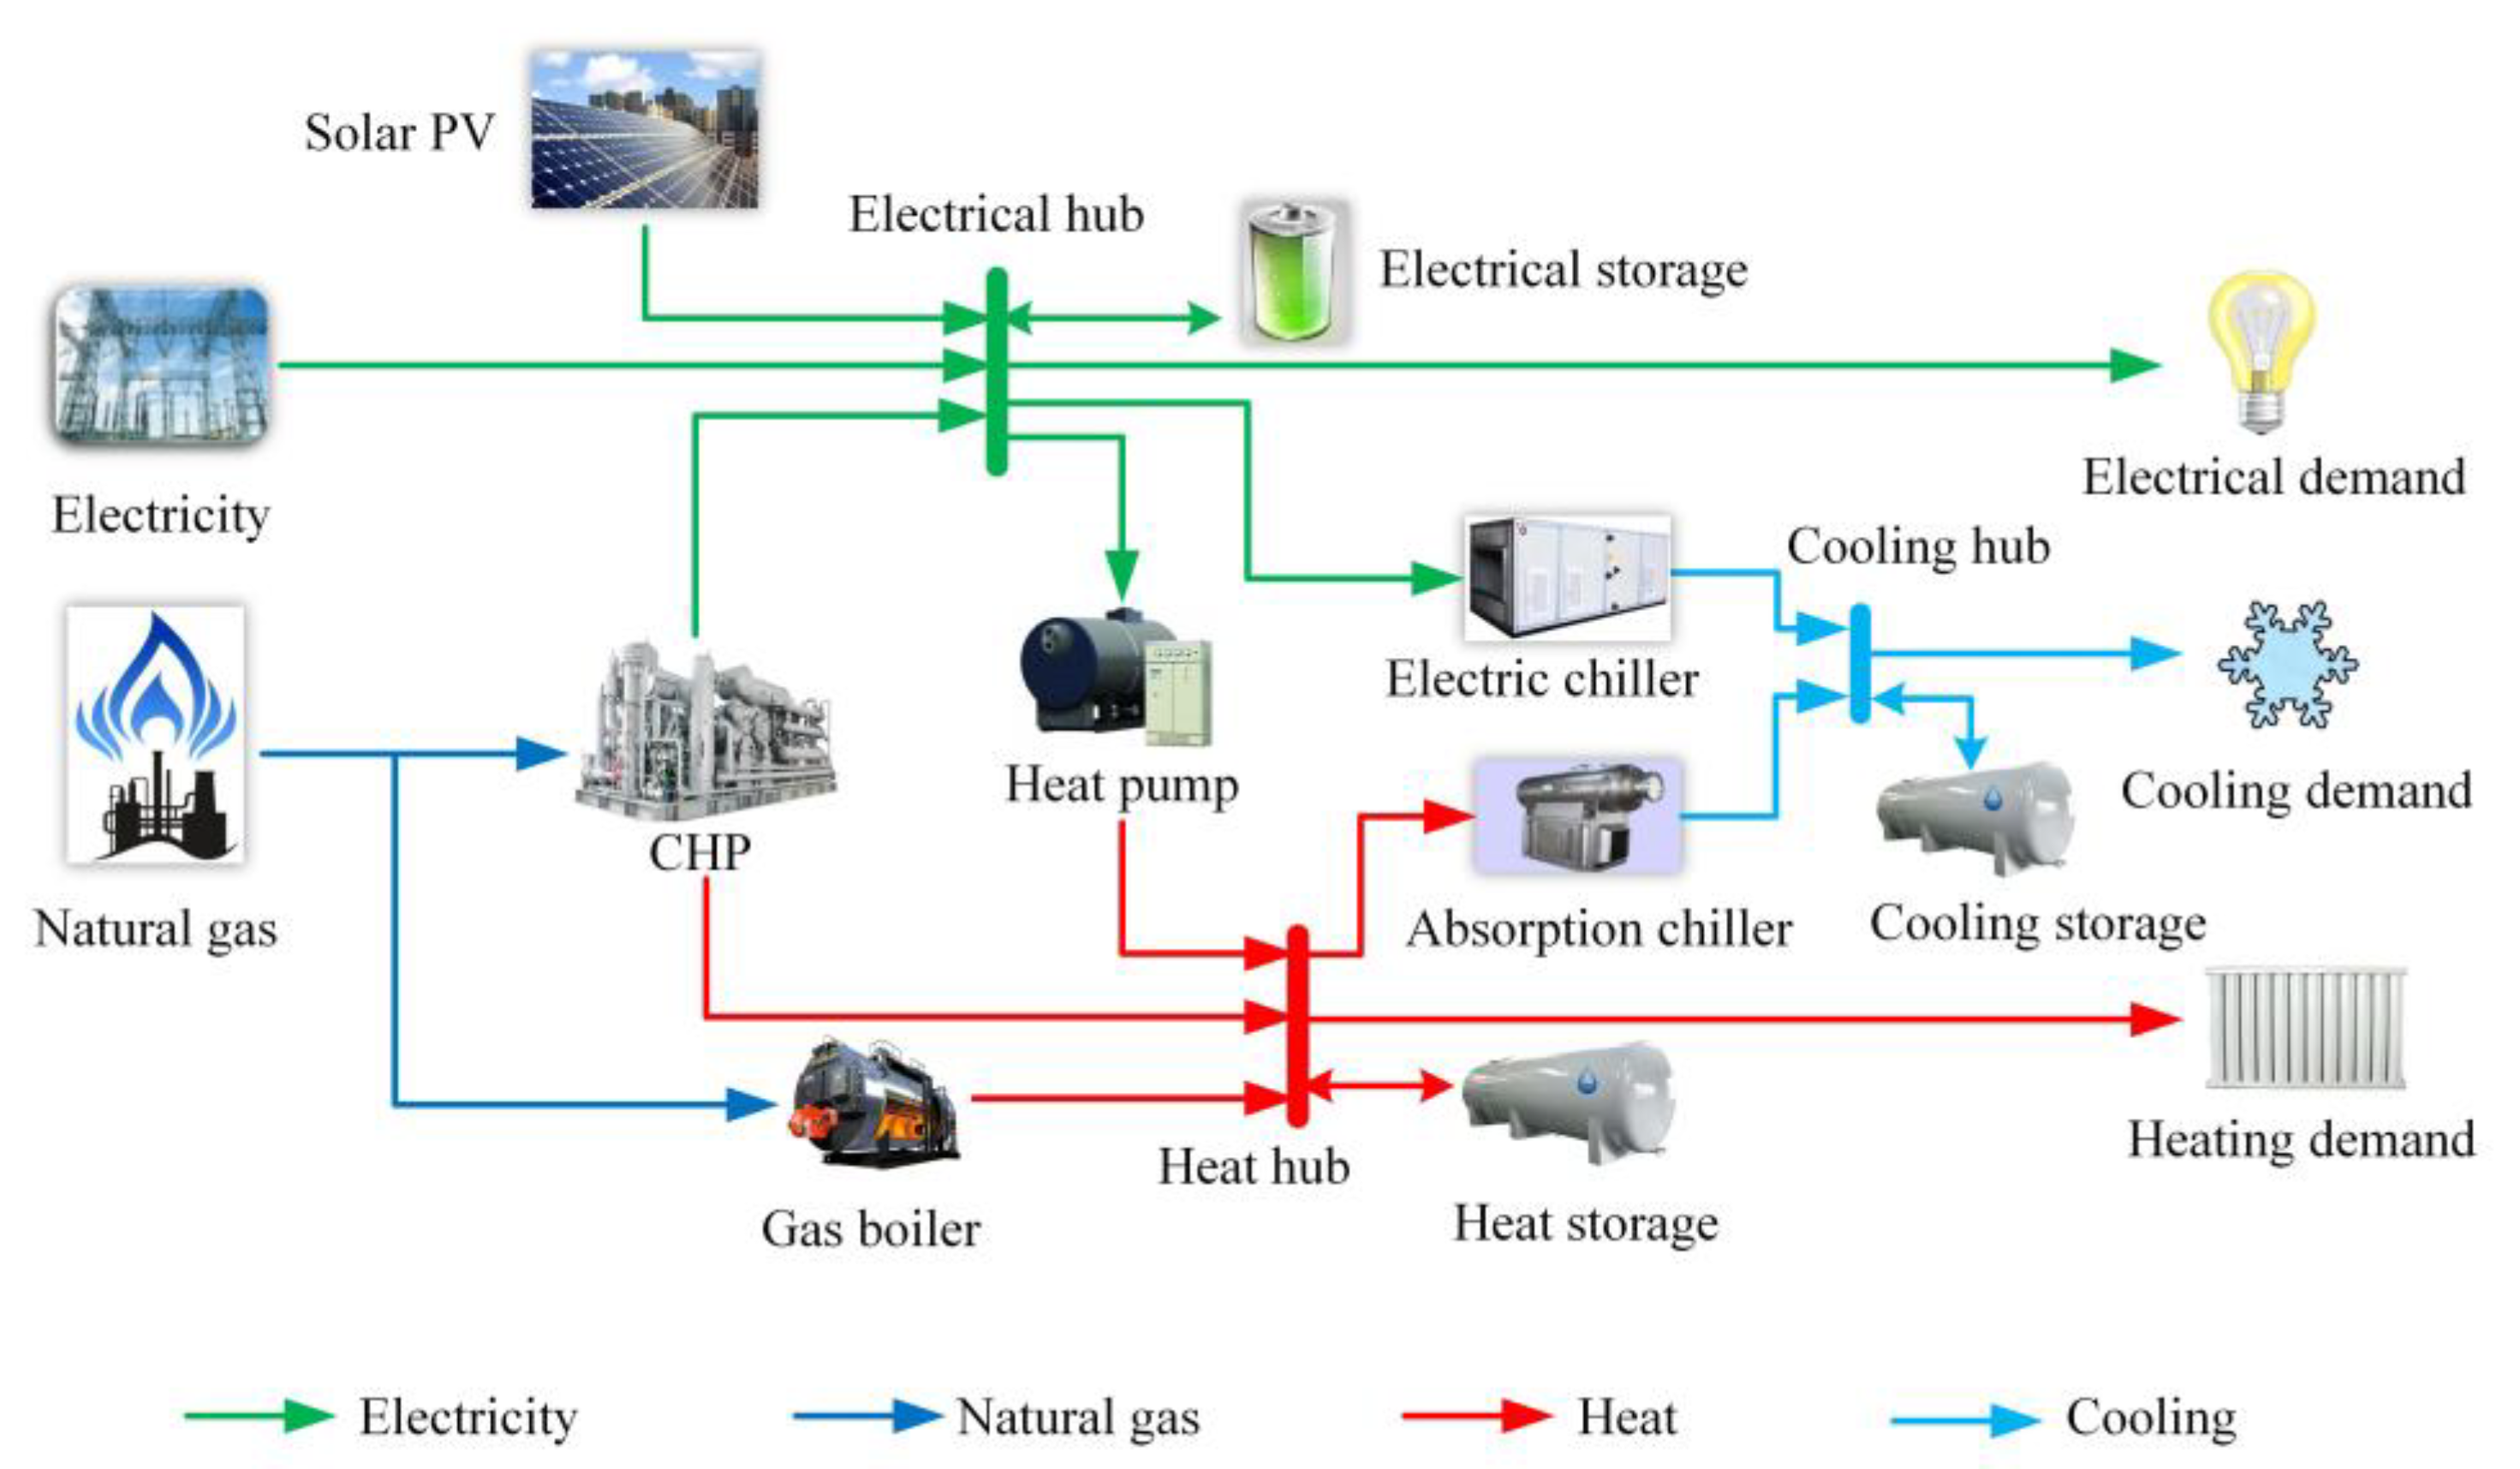
2.1. System Description
- Electricity and natural gas are the two principal energy carriers for the energy inputs, which are converted and delivered to end users. Coupling electrical and gas infrastructures is an efficient approach to the optimal operation of the two different energy systems.
- Solar PV panels are integrated into the MEMG system. Unlike other renewable resources, solar power can be more easily applied to the demand side in distributed patterns, e.g., solar PV-integrated buildings [37].
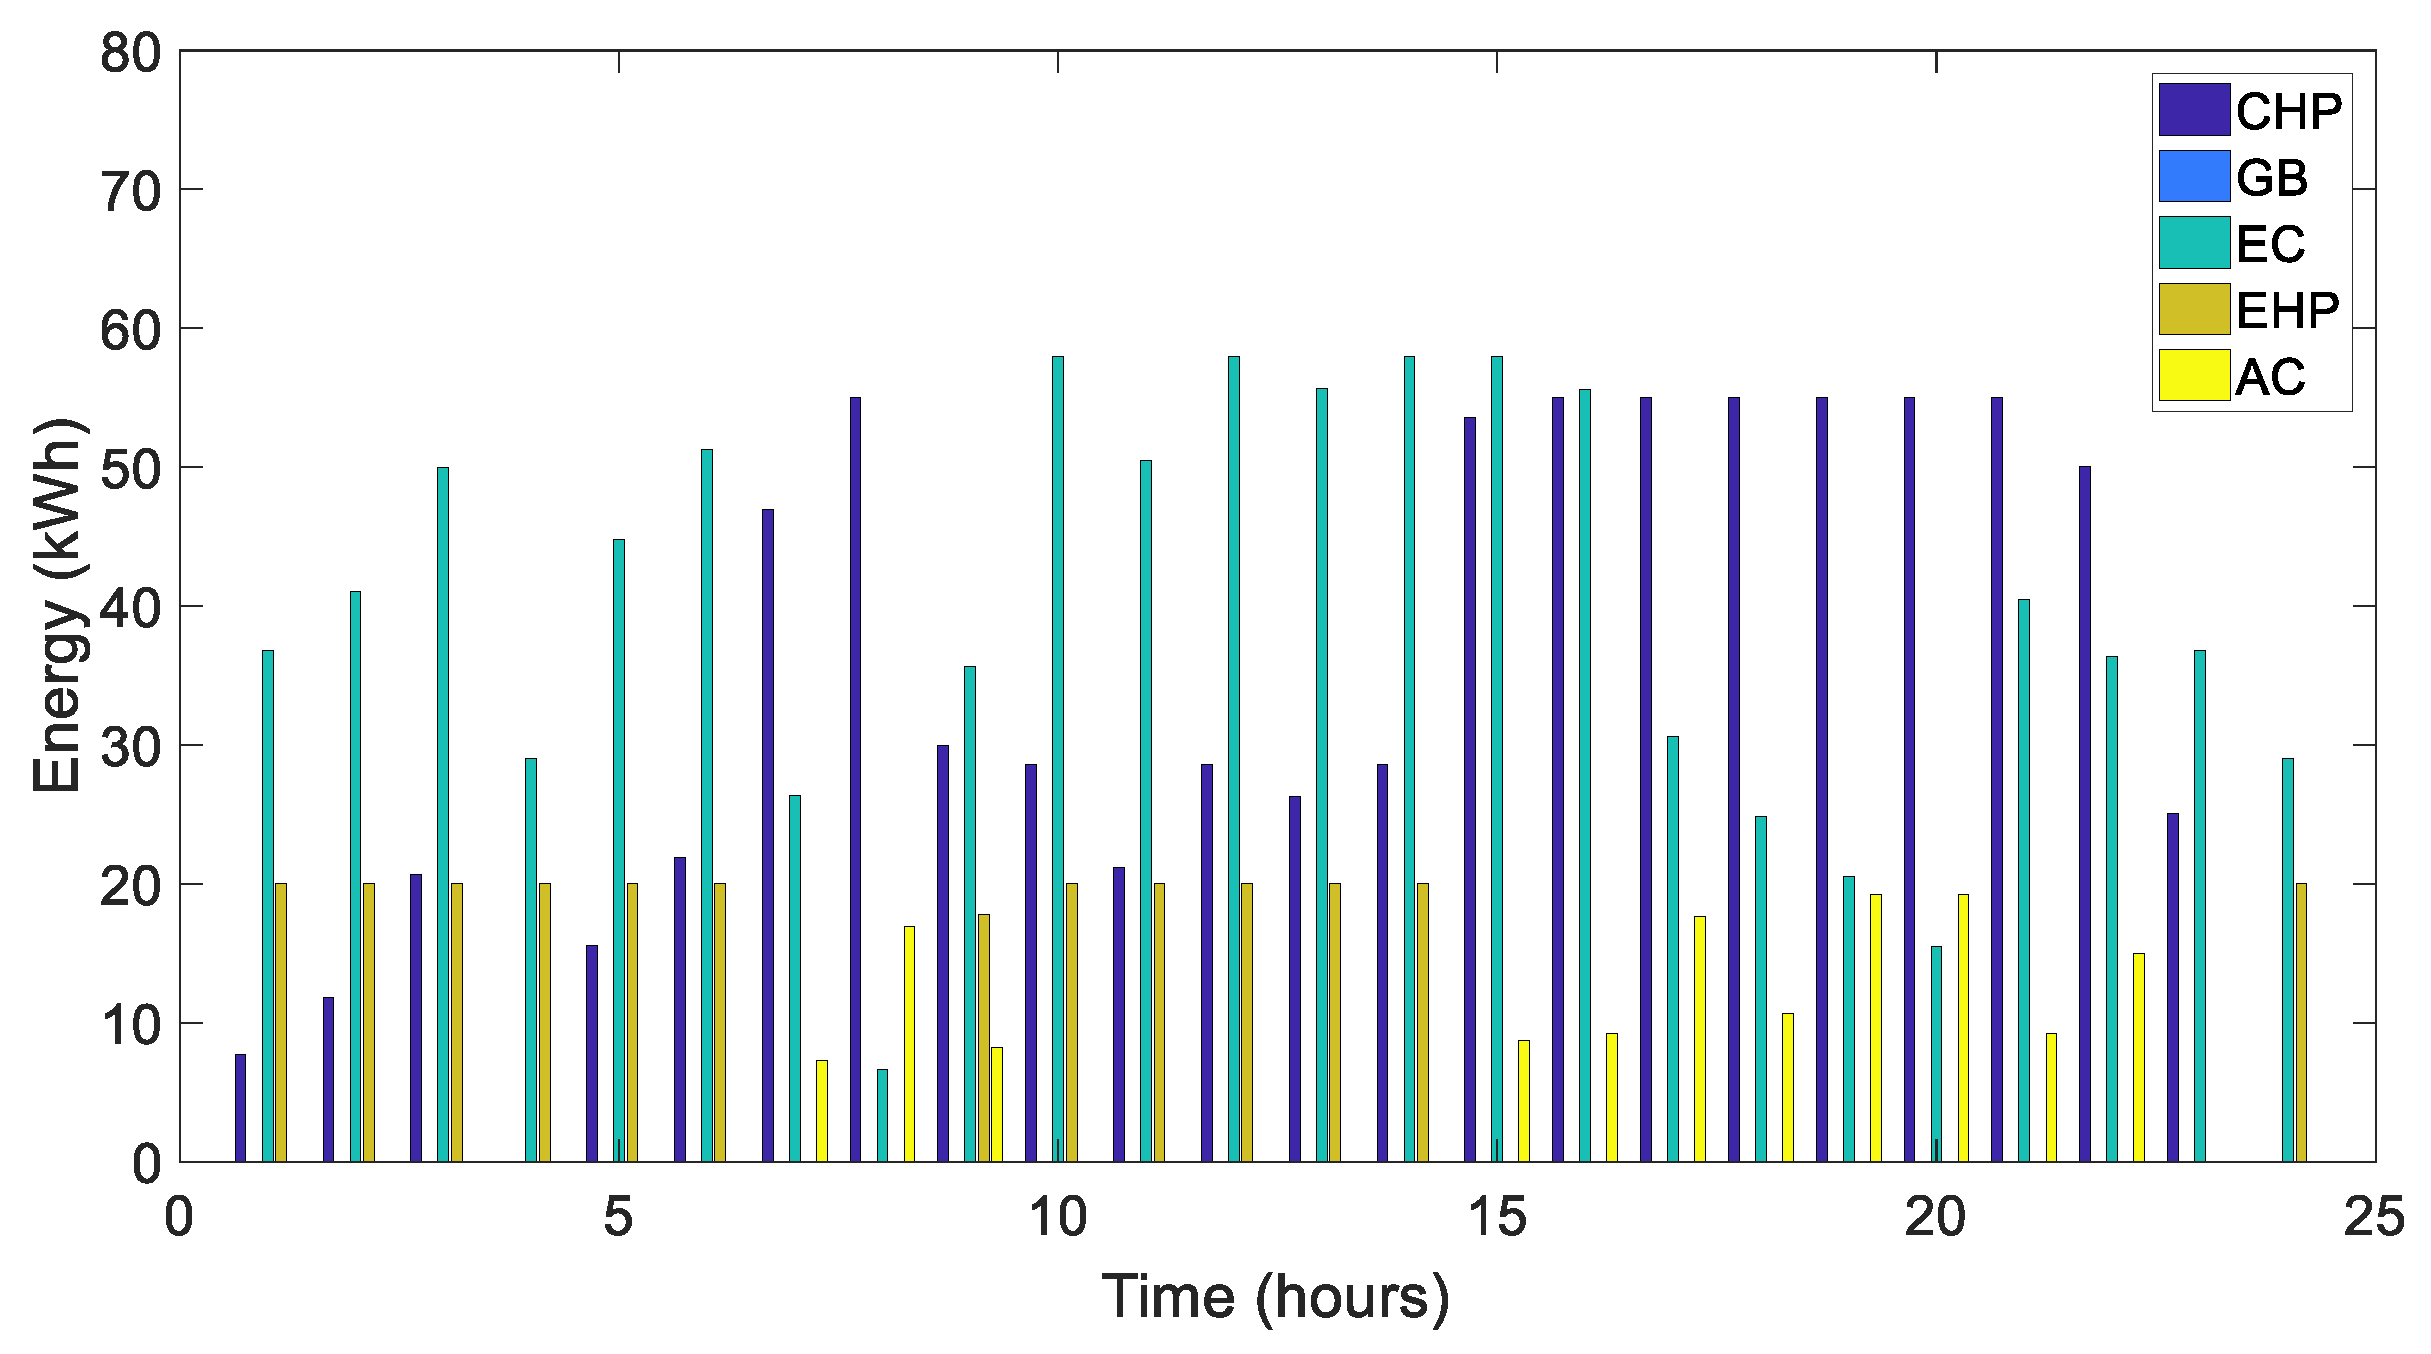
- The MEMG consists of a combined heat and power (CHP) system, gas boiler (GB), electrical heat pump (EHP), electric chiller (EC), absorption chiller (AC) and heterogeneous energy storage (HES), which are integrated into the MEMG system for transferring, converting or storing heterogeneous energy to meet the multi-energy demands and to improve the efficiency.
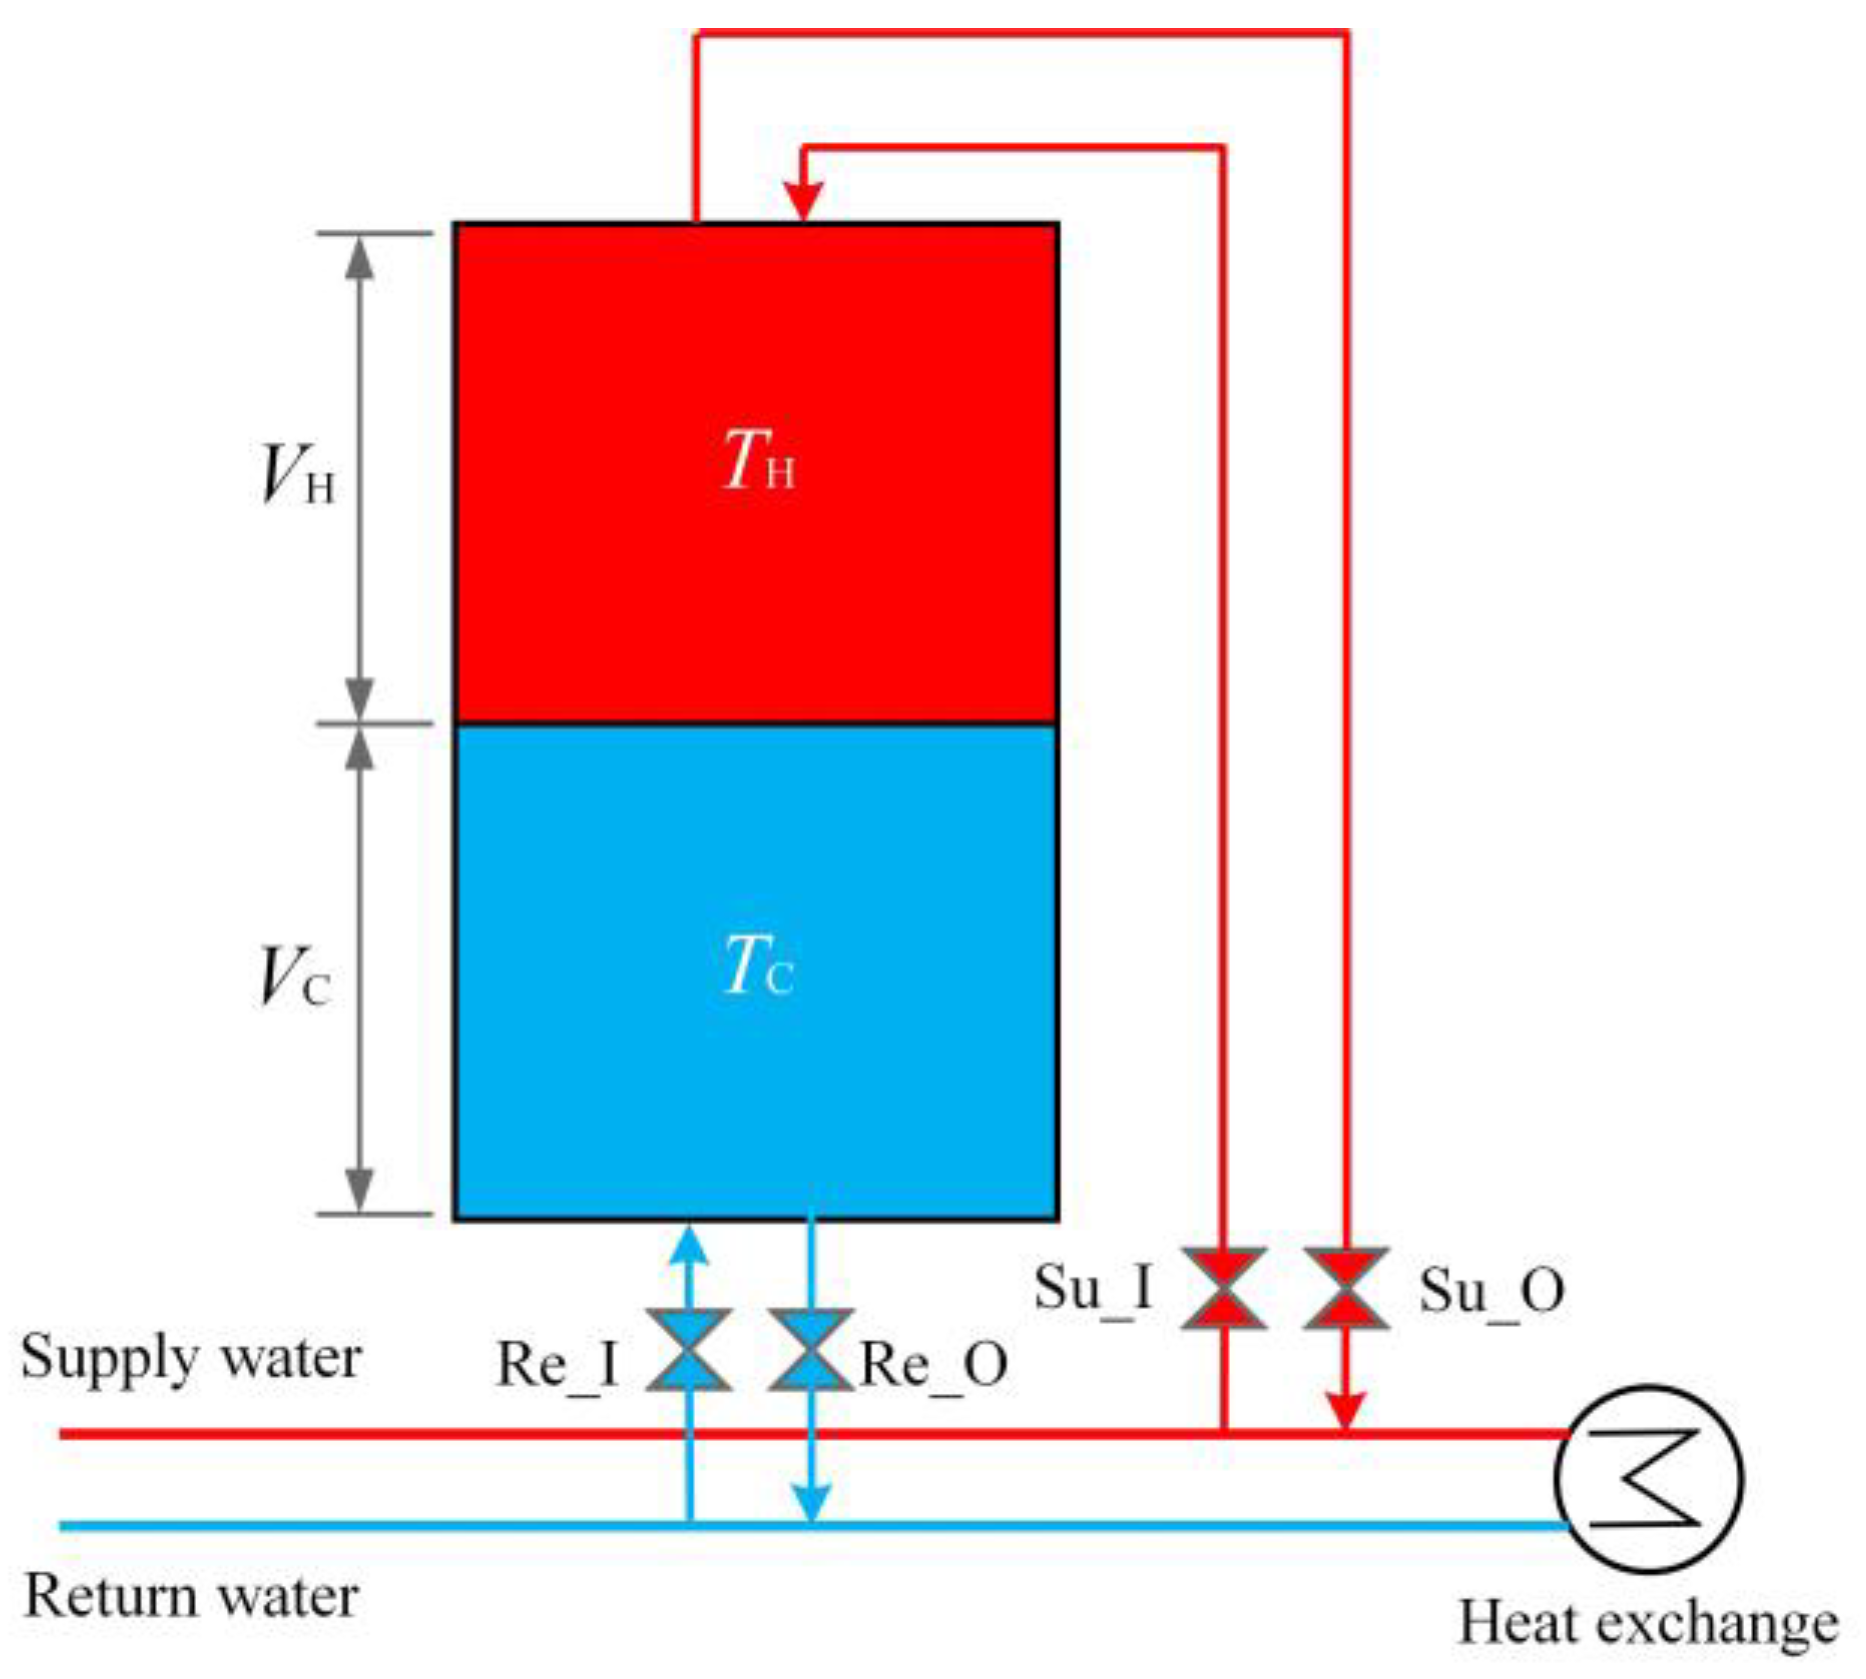
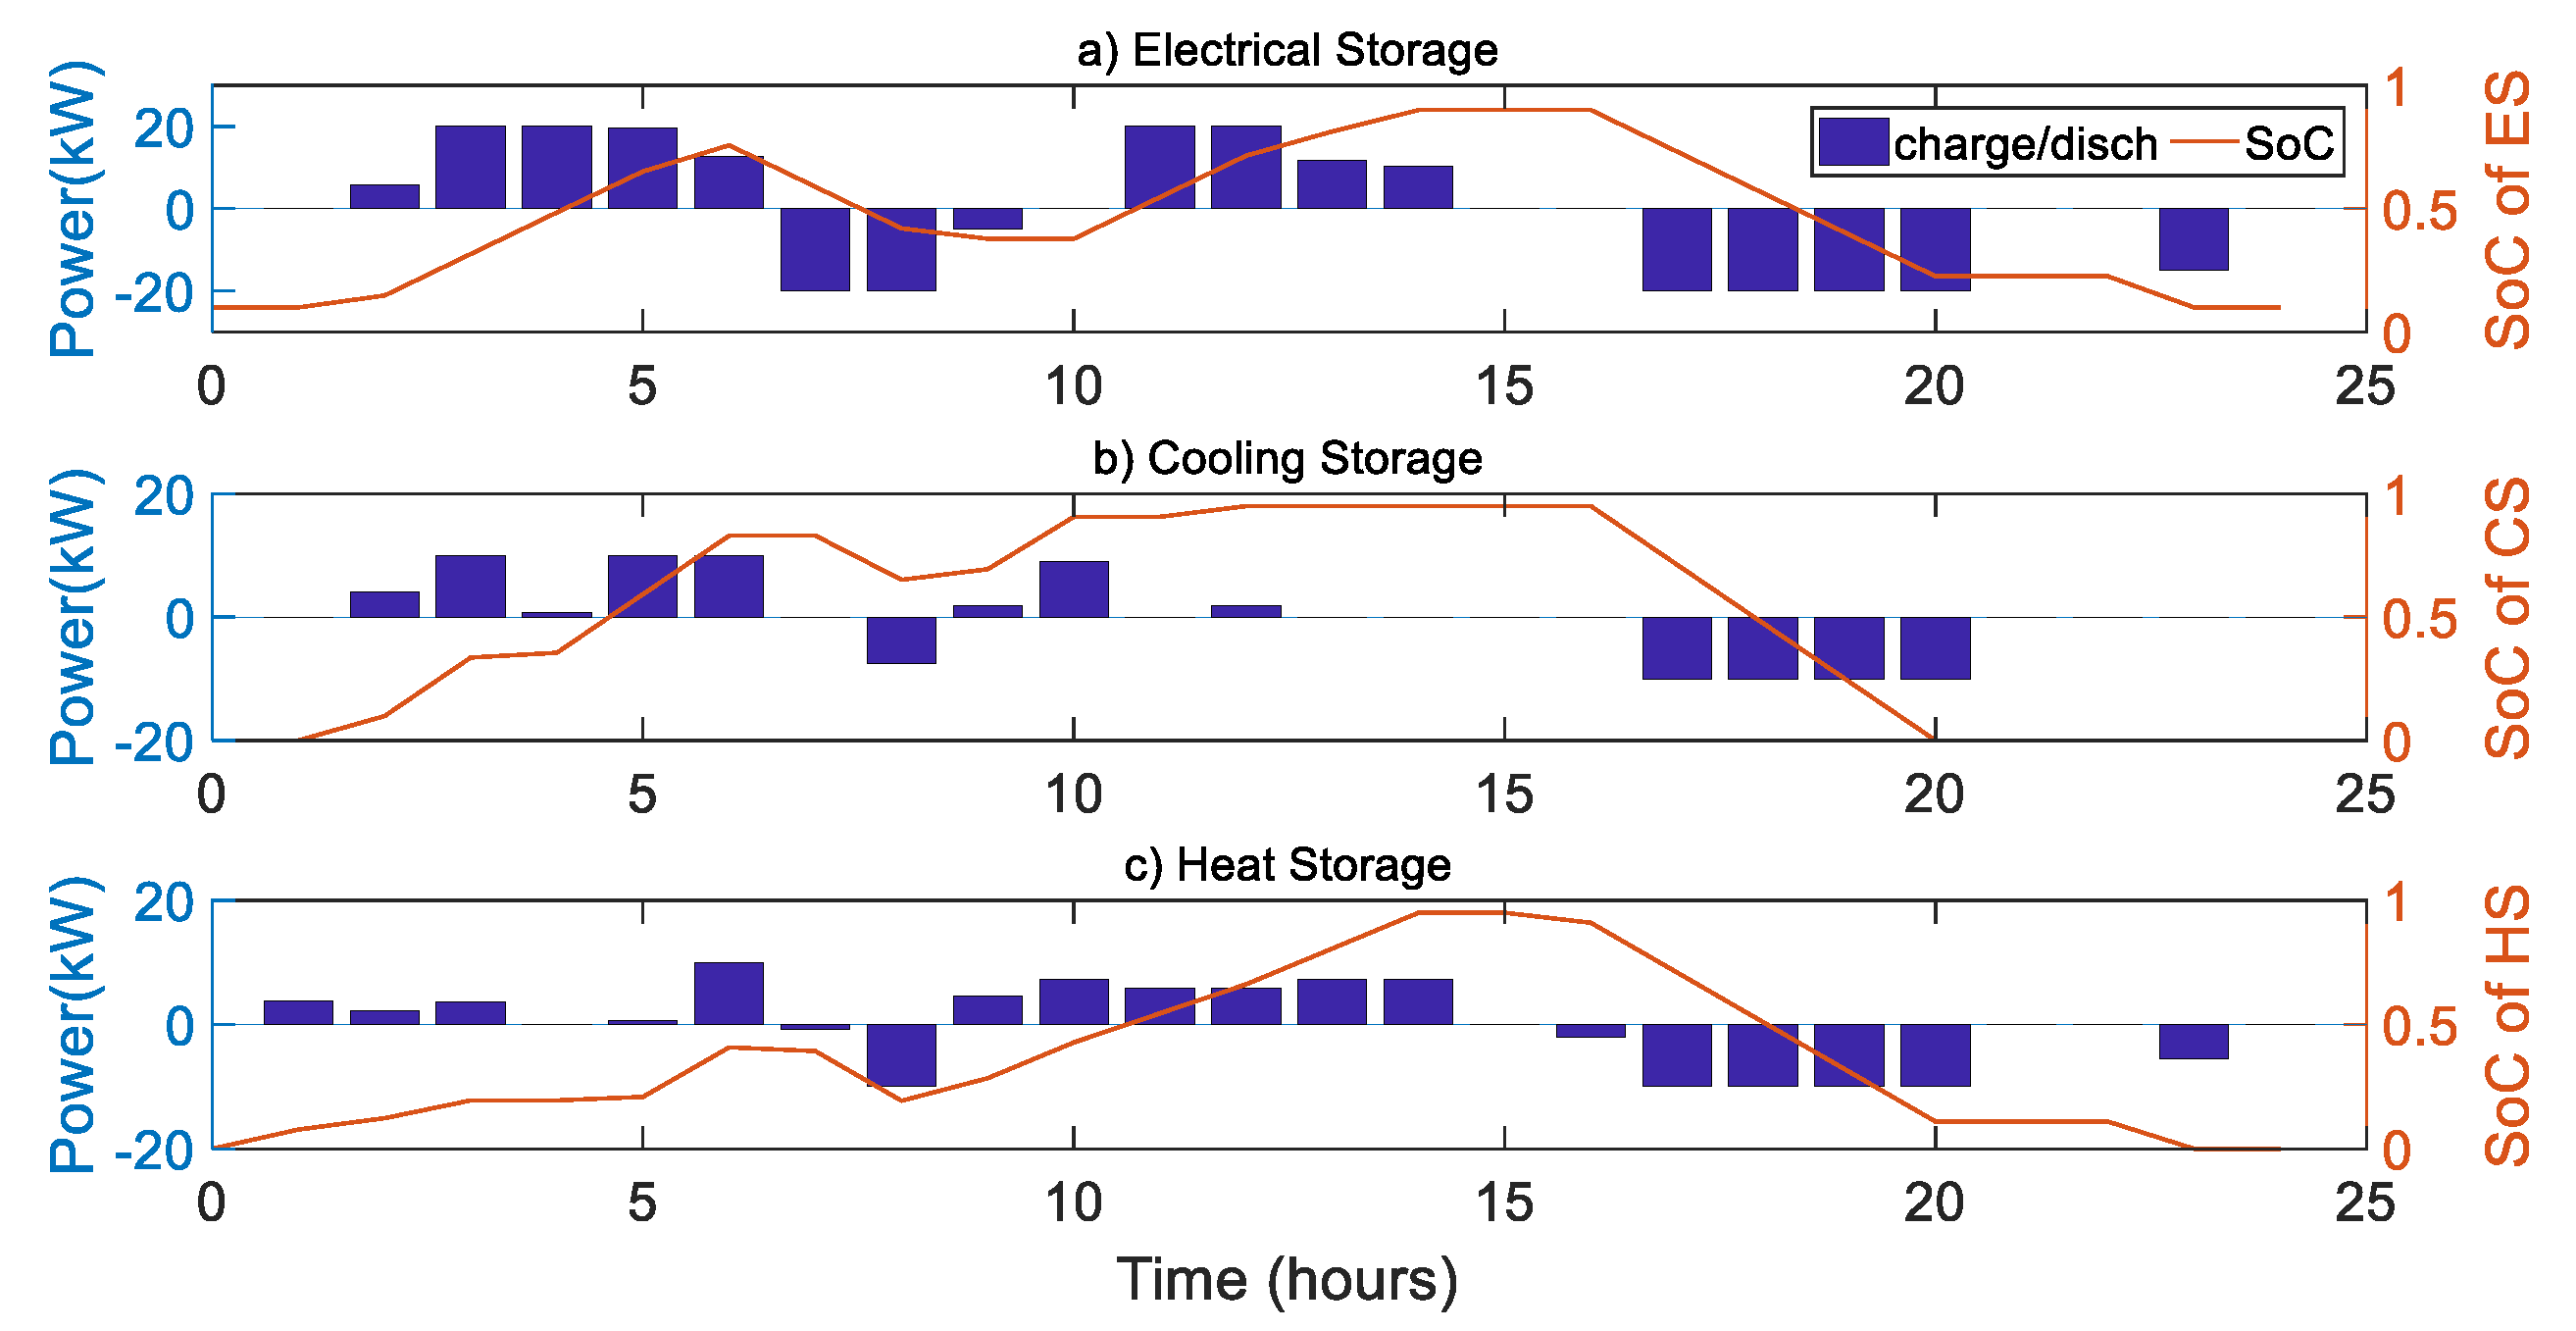
- The HES consists of electrical energy storage (ES), a cooling storage (CS) tank and a heat storage (HS) tank, which are deployed for the purposes of tackling the intermittent outputs from solar power, shaving peak energy demands and achieving higher energy utilization flexibility.
- The use of variable solar power and HES adds to the flexibility and complexity of MEMG operation at the same time.
2.2. Model of Components
2.2.1. CHP
2.2.2. GB
2.2.3. EHP
2.2.4. EC
2.2.5. AC
2.2.6. HES
2.2.7. Solar PV
2.3. PV Uncertainty Handling
2.4. IDR
3. Problem Formulation
3.1. Objective Function
3.2. Constraints
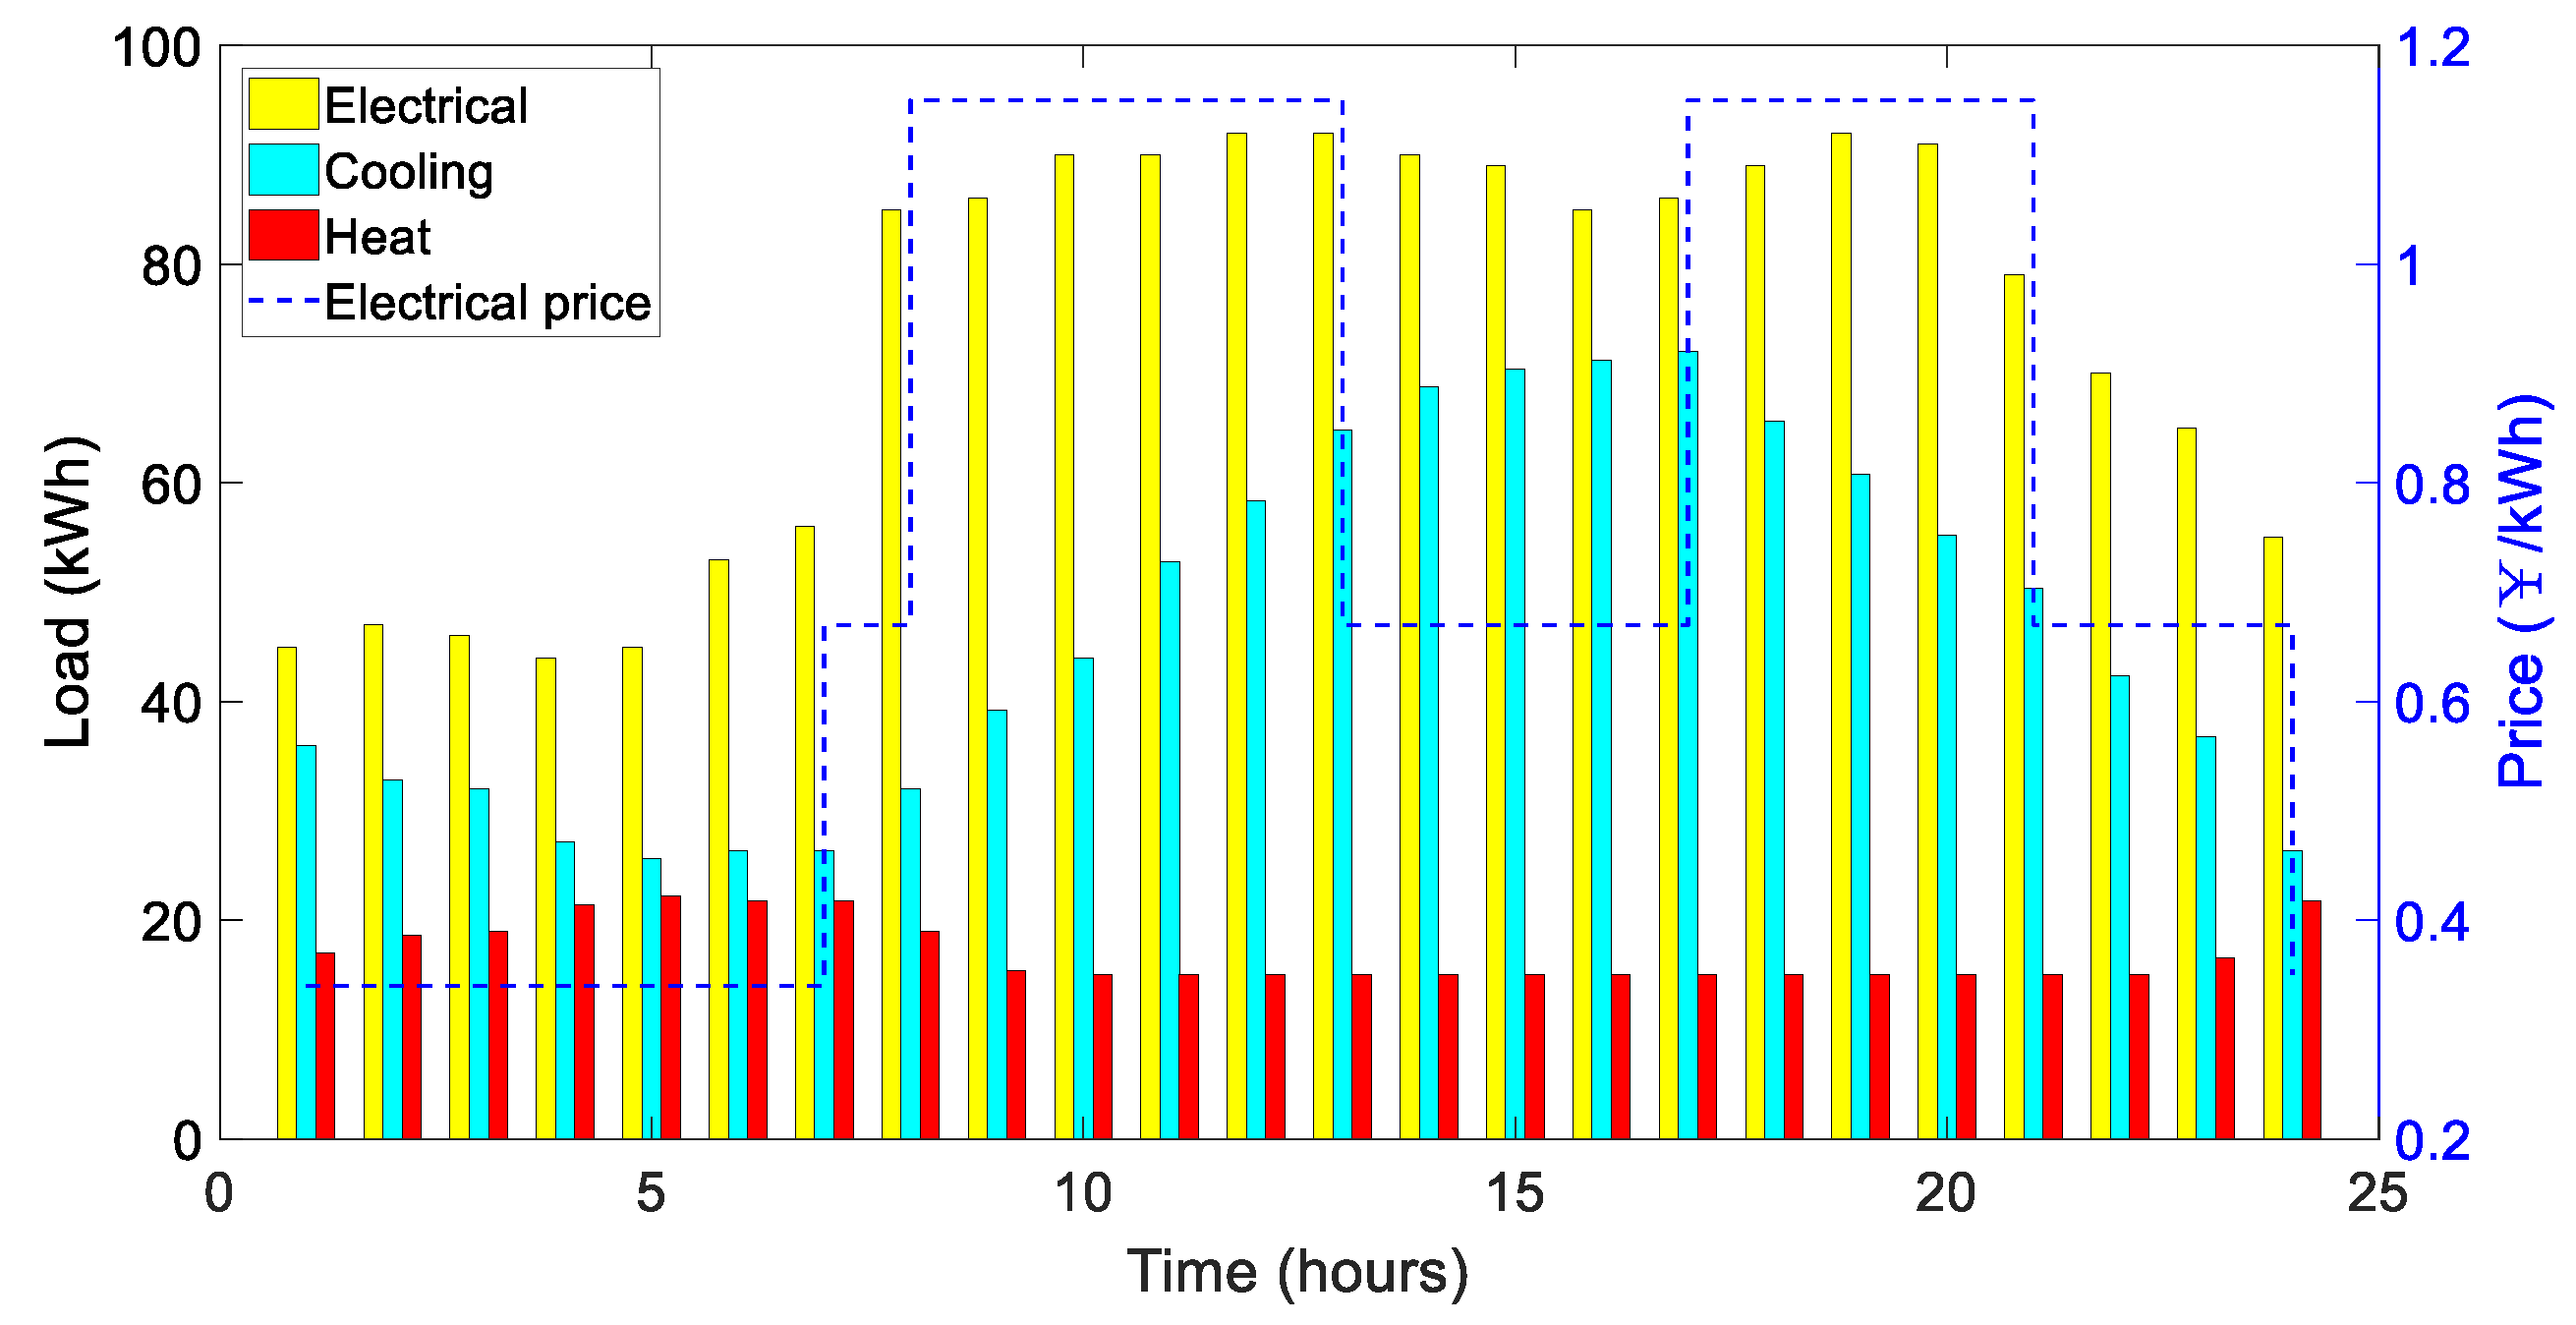
4. Case Studies
4.1. Optimization Results
4.1.1. Typical Summer Day
4.1.2. Typical Winter Day
4.2. Impact of Confidence Level
5. Conclusions and Future Works
Author Contributions
Funding
Institutional Review Board Statement
Informed Consent Statement
Data Availability Statement
Conflicts of Interest
References
- Rifkin, J. The Third Industrial Revolution: How Lateral Power is Transforming Energy, the Economy, and the World; Palgrave Macmillan Trade: New York, NY, USA, 2013; pp. 31–46. [Google Scholar]
- Wu, J.; Yan, J.; Jia, H.; Hatziargyriou, N.; Djilali, N.; Sun, H. Integrated energy systems. Appl. Energy 2016, 167, 155–157. [Google Scholar] [CrossRef]
- Ma, T.; Wu, J.; Hao, L. Energy flow modeling and optimal operation analysis of the micro energy grid based on energy hub. Energy Convers. Manag. 2017, 133, 292–306. [Google Scholar] [CrossRef]
- Zhang, Y.; Campana, P.E.; Lundlad, A.; Zheng, W.; Yan, J. Planning and operation of an integrated energy system in a Swedish building. Energy Convers. Manag. 2019, 199, 111920. [Google Scholar] [CrossRef]
- Mehrjerdi, H.; Hemmati, R.; Shafie-khah, M.; Catalao, J.P.S. Zero Energy Building by Multi-Carrier Energy Systems including Hydro, Wind, Solar and Hydrogen. IEEE Trans. Ind. Inform. 2020, 3034346. [Google Scholar] [CrossRef]
- Lia, J.; Xu, W.; Cui, P.; Qiao, B.; Feng, X.; Xue, H.; Wang, X.; Xiao, L. Optimization configuration of regional integrated energy system based on standard module. Energy Build. 2020, 229, 110485. [Google Scholar] [CrossRef]
- Mu, Y.; Chen, W.; Yu, X.; Jia, H.; Hou, K.; Wang, C.; Meng, X. A double-layer planning method for integrated community energy systems with varying energy conversion efficiencies. Appl. Energy 2020, 279, 115700. [Google Scholar] [CrossRef]
- Sun, J.; Ruze, N.; Zhang, J.; Shi, J.; Shen, B. Capacity Planning and Optimization for Integrated Energy System in Industrial Park Considering Environmental Externalities. Renew. Energy 2020, 167, 045. [Google Scholar]
- Yuan, J.; Li, Y.; Luo, X.; Zhang, Z. A new hybrid multi-criteria decision-making approach for developing integrated energy systems in industrial parks. J. Clean. Prod. 2020, 270, 122119. [Google Scholar] [CrossRef]
- Soroudi, A.; Amraee, T. Decision making under uncertainty in energy systems: State of the art. Renew. Sustain. Energy Rev. 2013, 28, 376–384. [Google Scholar] [CrossRef]
- REN21. Renewables 2019 Global Status Report. 2020. Available online: http://www.ren21.net/gsr-2019/ (accessed on 15 November 2020).
- Pazouki, S.; Haghifam, M.R. Optimal planning and scheduling of energy hub in presence of wind, storage and demand response under uncertainty. Int. J. Electr. Power 2016, 80, 219–239. [Google Scholar] [CrossRef]
- Dolatabadi, A.; Ivatloo, B.M. Stochastic Risk-constrained Scheduling of Smart Energy Hub in the Presence of Wind Power and Demand Response. Appl. Therm. Eng. 2017, 123, 40–49. [Google Scholar] [CrossRef]
- Jadidbonab, M.; Dolatabadi, A.; Ivatloo, B.M.; Abapour, M.; Asadi, S. Risk-constrained energy management of PV integrated smart energy hub in the presence of demand response program and compressed air energy storage. IET Renew. Power Gener. 2019, 13, 998–1008. [Google Scholar] [CrossRef]
- Li, Y.; Wang, K.; Gao, B.; Zhang, B.; Liu, X.; Chen, C. Interval optimization based operational strategy of integrated energy system under renewable energy resources and loads uncertainties. Int. J. Energy Res. 2020, 6009. [Google Scholar] [CrossRef]
- Li, Z.; Wang, C.; Ding, Y.; Yang, M.; Zhu, W. Probability-Interval-Based Optimal Planning of Integrated Energy System With Uncertain Wind Power. IEEE Trans. Ind. Appl. 2020, 56, 4–13. [Google Scholar] [CrossRef]
- Mirzaei, M.A.; Heris, M.N.; Ivatloo, B.M.; Zare, K.; Marzband, M.; Khah, M.S.; Moghaddam, A.A.; Catalão, J.P.S. Network-Constrained Joint Energy and Flexible Ramping Reserve Market Clearing of Power and Heat-Based Energy Systems: A Two-Stage Hybrid IGDT-Stochastic Framework. IEEE Syst. J. 2020, 99, 1–10. [Google Scholar]
- Afrashi, K.; Firouzi, B.B.; Nafar, M. IGDT-Based Robust Optimization for Multicarrier Energy System Management. Iran J. Sci. Technol. Trans. Electr. Eng. 2020. [Google Scholar] [CrossRef]
- Faqiry, M.N.; Edmonds, L.; Wu, H.; Pahwa, A. Distribution locational marginal price-based transactive day-ahead market with variable renewable generation. Appl. Energy 2020, 259, 114103. [Google Scholar] [CrossRef]
- Halstrup, D.; Schriever, M. The role of industrial energy storage solutions in a distributed energy system: Empirical findings and implications on cooperative ties. Int. J. SGCE 2018, 7, 53–63. [Google Scholar] [CrossRef]
- Gimelli, A.; Mottola, F.; Muccillo, M.; Proto, D.; Amoresano, A.; Andreotti, A.; Langella, G. Registered Optimal configuration of modular cogeneration plants integrated by a battery energy storage system providing peak shaving service. Appl. Energy 2019, 242, 974–993. [Google Scholar] [CrossRef]
- Ding, Y.; Xu, Q.; Yang, B. Optimal configuration of hybrid energy storage in integrated energy system. Energy Rep. 2020, 6, 739–744. [Google Scholar] [CrossRef]
- Sanjari, M.J.; Karamic, H. Optimal control strategy of battery-integrated energy system considering load demand uncertainty. Energy 2020, 210, 118525. [Google Scholar] [CrossRef]
- Aviles, D.A.; Sotomayor, D.; Proaño, J.L.; Guinjoan, F.; Marietta, M.P.; Pascual, J.L.; Marroyo, P.S. Fuzzy Energy Management Strategy Based on Microgrid Energy Rate-of-Change Applied to An Electro-Thermal Residential Microgrid. In Proceedings of the 2017 IEEE 26th International Symposium on Industrial Electronics (ISIE), Edinburgh, UK, 19–21 June 2017. [Google Scholar]
- Yu, L.; Lei, J.; Guo, X.; Li, P.; Li, C.; Song, G.; Wu, Y. Planning of Central Energy Station in Community Integrated Energy System with Electrical and Heat Storage Devices. In Proceedings of the 2019 IEEE Innovative Smart Grid Technologies—Asia (ISGT Asia), Chengdu, China, 21–24 May 2019. [Google Scholar]
- Heidari, A. Stochastic effects of ice storage on improvement of an energy hub optimal operation including demand response and renewable energies. Appl. Energy 2020, 261, 114393. [Google Scholar] [CrossRef]
- Li, Z.; Xu, Y.; Feng, X.; Wu, Q. Optimal Stochastic Deployment of Heterogeneous Energy Storage in a Residential Multi-Energy Microgrid with Demand-Side Management. IEEE Trans. Ind. Inform. 2020, 17, 991–1003. [Google Scholar] [CrossRef]
- Bukhsh, W.A.; Zhang, C.; Pinson, P. An Integrated Multiperiod OPF Model with Demand Response and Renewable Generation Uncertainty. IEEE Trans. Smart Grid 2016, 7, 1495–1503. [Google Scholar] [CrossRef]
- Bahrami, S.; Sheikhi, A. From demand response in smart grid toward integrated demandresponse in smart energy hub. IEEE Trans. Smart Grid 2015, 7, 650–658. [Google Scholar]
- Wang, J.; Zhong, H.; Ma, Z.; Xia, Q.; Kang, C. Review and prospect of integrated demand response in the multi-energy system. Appl. Energy 2017, 202, 772–782. [Google Scholar] [CrossRef]
- Lu, Y.; Yu, X.; Jin, X.; Jia, H.; Mu, Y. Bi-level Optimization Framework for Buildings to Heating Grid Integration in Integrated Community Energy Systems. IEEE Trans. Sustain. Energy 2020, 3023251. [Google Scholar] [CrossRef]
- Yongli, W.; Yuze, M.; Fuhao, S.; Yang, M.; Chengyuan, Q.; Feifei, H.; Juntai, X.; Fuwei, Z. Economic and efficient multi-objective operation optimization of integrated energy system considering electro-thermal demand response. Energy 2020, 205, 118022. [Google Scholar]
- Saatloo, A.M.; Rahvar, M.A.; Amin, M.; Behnam, M.; Mehdi, A.; Zare, K. Robust scheduling of hydrogen based smart micro energy hub with integrated demand response. J. Clean. Prod. 2020, 11, 122041. [Google Scholar] [CrossRef]
- Brusco, G.; Burgio, A.; Menniti, D.; Pinnarelli, A.; Sorrentino, N.; Scarcello, L. An Energy Box in a Cloud-Based Architecture for Autonomous Demand Response of Prosumers and Prosumages. Electronics 2017, 6, 98. [Google Scholar] [CrossRef]
- Salpakari, J.; Lund, P. Optimal and rule-based control strategies for energy flexibility in buildings with PV. Appl. Energy 2016, 161, 425–436. [Google Scholar] [CrossRef]
- Razmara, M.; Bharati, G.R.; Hanover, D.; Shahbakhti, M.; Paudyal, S.; Robinett, R.D. Building-to-grid predictive power flow control for demand response and demand flexibility programs. Appl. Energy 2017, 203, 128–141. [Google Scholar] [CrossRef]
- Daniel, A.; Amaral, L.R.; Laura, A.; Helder, G. Investigating the potential for energy flexibility in an office building with a vertical BIPV and a PV roof system. Renew. Energy 2019, 137, 189–197. [Google Scholar]
- Bloess, A.; Schill, W.P.; Zerrahn, A. Power-to-heat for renewable energy integration: A review of technologies, modeling approaches, and flexibility potentials. Appl. Energy 2018, 212, 1611–1626. [Google Scholar] [CrossRef]
- Kumar, A.V.; Sharma, S.; Verma, A. Optimal sizing and multi-energy management strategy for PV-biofuel-based off-grid systems. IET Smart Grid 2020, 3, 83–97. [Google Scholar]
- Lejeune, M.; Noyan, N. Mathematical programming approaches for generating p-efficient points. Eur. J. Oper. Res. 2010, 207, 590–600. [Google Scholar] [CrossRef][Green Version]
- ILOG CPLEX, ILOG CPLEX Homepage. 2019. Available online: http://www.ilog.com (accessed on 21 October 2019).


| Parameters | Value | Parameters | Value |
|---|---|---|---|
| 0.35/0.45 | 55 kW | ||
| 0.85 | 20 kW | ||
| 2.3 | 35 kW | ||
| 2.9 | 60 kW | ||
| 0.8 | 20 kW | ||
| 0.9 | 20 kW | ||
| 10 kWh | 90 kWh | ||
| 0.9 | 10 kW | ||
| 0 | 48 kWh | ||
| 0.001 | 0.001 |
| Confidence Level | IDR Configuration/% | Amounts of Load Shift/kWh | IDR Cost/¥ | Energy Cost/¥ | Total Cost/¥ |
|---|---|---|---|---|---|
| 0.95 | 8.9 | 82.35 | 21.86 | 898.54 | 920.4 |
| 0.90 | 10 | 90.76 | 24.47 | 881.3 | 905.8 |
| 0.85 | 10.6 | 95.47 | 25.90 | 865.11 | 891.01 |
| 0.80 | 13.5 | 118.06 | 30.51 | 838.84 | 869.34 |
| 0.75 | 15.1 | 132.64 | 33.81 | 817.86 | 851.67 |
Publisher’s Note: MDPI stays neutral with regard to jurisdictional claims in published maps and institutional affiliations. |
© 2021 by the authors. Licensee MDPI, Basel, Switzerland. This article is an open access article distributed under the terms and conditions of the Creative Commons Attribution (CC BY) license (http://creativecommons.org/licenses/by/4.0/).
Share and Cite
Wang, J.; Li, K.-J.; Liang, Y.; Javid, Z. Optimization of Multi-Energy Microgrid Operation in the Presence of PV, Heterogeneous Energy Storage and Integrated Demand Response. Appl. Sci. 2021, 11, 1005. https://doi.org/10.3390/app11031005
Wang J, Li K-J, Liang Y, Javid Z. Optimization of Multi-Energy Microgrid Operation in the Presence of PV, Heterogeneous Energy Storage and Integrated Demand Response. Applied Sciences. 2021; 11(3):1005. https://doi.org/10.3390/app11031005
Chicago/Turabian StyleWang, Jingshan, Ke-Jun Li, Yongliang Liang, and Zahid Javid. 2021. "Optimization of Multi-Energy Microgrid Operation in the Presence of PV, Heterogeneous Energy Storage and Integrated Demand Response" Applied Sciences 11, no. 3: 1005. https://doi.org/10.3390/app11031005
APA StyleWang, J., Li, K.-J., Liang, Y., & Javid, Z. (2021). Optimization of Multi-Energy Microgrid Operation in the Presence of PV, Heterogeneous Energy Storage and Integrated Demand Response. Applied Sciences, 11(3), 1005. https://doi.org/10.3390/app11031005