1. Introduction
Historically, data analytics has always been a core part of research enterprises and large scale tech companies. With the ongoing growth of the Internet of Things (IoT) market [
1], more and more enterprises have started to collect and analyze data, leading to new innovations in domains such as smart cities, home automation, or climate control. For some applications, such as the booming predictive maintenance market [
2], data analysis needs to be fast, resilient, and support high data throughput.
While most research publications solely focus on specific analysis algorithms, either data-driven algorithms using machine learning, or knowledge-driven algorithms using semantics, many other components are needed to create a complete data analysis flow. Whenever a measurement is made, it needs to be transferred to an analysis algorithm. In general, data is collected on dedicated machines and processed in bulk, though for some time-critical applications, trivial on-machine calculations may suffice. In either case, storage of measurements is useful for later investigations or when new analysis algorithms are retrospectively introduced. Proper documentation of all metrics is also vital at this step. When detecting anomalies, the user needs to be informed on the details in a timely manner. User feedback can also be valuable to optimize the algorithms or visualizations, for example by labeling events for future reference. Finally, the system should be able to scale to allow a rising amount of monitored devices and be resilient so no relevant events go undetected when the system experiences (partial) failure. To this day, a hybrid architecture that combines knowledge-driven and data-driven algorithms and takes into account all the above requirements does not exist.
In the imec.icon Dyversify project (
https://www.imec-int.com/en/what-we-offer/research-portfolio/dyversify, (accessed on 7 December 2021)), academia and industry partners collaborated to investigate how (data-driven) machine learning and semantic (knowledge-based) techniques can be combined for improved event and anomaly detection on time series originating from IoT sensors. We envision that by fusing semantics and machine learning, amongst others, state-of-the-art data-driven analysis systems can be improved, and expert feedback can enable automatic filtering of false positives and/or enable the shift from unsupervised towards supervised learning. In this article, we present the resulting Dyversify architecture that enables this fusion of data-driven and semantic techniques. We also provide high-level descriptions of the individual components, explain design choices made, and discuss open questions and challenges. A working, full-stack prototype combining all of the requirements listed has been created and validated using two use cases with real world data provided by our industry partners: Renson, Televic Rail, and Cumul.io. To the best of our knowledge, we are the first to present an architectural design and full-stack, hybrid implementation for (i) fusion of semantic technologies and machine learning and (ii) composed of solely open-source building blocks.
This article focuses on the Renson use case, where air quality metrics from consumer owned ventilation units are used for event and anomaly detection. While we do discuss the underlying data analysis techniques, they are not the focus of this article and mainly serve to give the reader a better understanding of the system. Instead we refer to dedicated works discussing those techniques where appropriate. The innovations in this work entail: (1) the description of a full-stack, hybrid time-series analysis microservice architecture and (2) the description of the experiences and challenges encountered while designing and testing this system. As such, we believe this work will be most interesting for parties who seek to build any type of hybrid data analysis pipeline going from sensor to dashboard but who lack relevant experience in designing such a system.
The remainder of this work is structured as follows. We start by giving background information about the Dyversify project and the Renson use case in
Section 2, as well as a brief introduction in the Semantic Web domain. An overview of related literature follows in
Section 3. We discuss the architecture and individual components in
Section 4 and its performance in
Section 5. We finish by discussing our experiences and lessons learned throughout the project in
Section 6 and conclude in
Section 7.
2. Background Information
2.1. The Dyversify Project
Dyversify is an imec.icon project, where multi-disciplinary teams from academia and industry work together to do demand-driven research. During the two-year project, seven different teams worked together: four different research teams from IDLab—Ghent University and three industry partners, i.e., Renson (ventilation and shading products), Televic Rail (train components and systems), and Cumul.io (dashboarding platform).
As a research project, each group worked on specific research topics including dynamic dashboarding using semantic technologies, adaptive anomaly and event detection for time series using both machine learning or semantic-driven techniques, and scalable services. All research was brought together in a working prototype for a full-stack data analysis pipeline that processed real-world data coming from Renson and Televic. This stack includes time-series data ingestion & persistence, time-series anomaly and event detection, data semantification, visualization in a dashboard using dynamically configured widget, and a user feedback mechanism. The prototype was built as a scalable and resilient microservice architecture.
This work does not cover all research topics of Dyversify but focuses on the integrating system as a whole that resulted from it. We discuss the stack architecture, give a high level insight into individual components, and describe the experiences we learned along the way. To streamline our story, we only discuss the Renson use case.
2.2. Renson Use Case
Renson is a Belgian company that produces and sells shading and facade cladding elements as well as ventilation products. Shortly before the Dyversify project, Renson had introduced their newest mechanical extraction ventilation unit for home use, the Healthbox 3.0. The Healthbox regulates the airflow in connected rooms, based on various air quality metrics such as air humidity, CO levels, or the presence of volatile organic compounds (odors). These metrics are measured using sensors located on the valves that connect the Healthbox to the ventilation shafts. Different types of valves exist, each having sensors tailored for a specific type of room. Each valve, as well as the Healthbox itself, tracks between 8 and 12 metrics.
The Healthbox can be configured to upload the valve and Healthbox metrics to Renson. This data is used to allow users to monitor their indoor air quality using an app. Besides this, Renson aims to use this data to monitor the performance of their units, to detect specific in-house events that affect air quality (e.g., showering), or to flag common installation errors for new customers. One such common installation error is a valve of a wrong room type being used, such as an (odor sensitive) toilet valve being used for a bedroom (which should be ventilated based on CO).
In the Dyversify project, all measured Healthbox 3.0 metrics were forwarded to our analysis platform. Specifically, each unit sent between 12 and 96 aggregated metrics (depending on the number of ventilated rooms) at 30 second intervals. We received data from all existing (upload-enabled) Healthbox 3.0 units, which steadily increased throughout the project, as more units were being installed.
2.3. Resource Description Framework and Semantic Reasoning
We limit our introduction of the Semantic Web to the two topics mentioned in this work: the semantic data model, i.e., the Resource Description Framework (RDF), and semantic reasoning.
RDF is an abstract data model that has to be serialized before it can be exchanged. Three common serializations are RDF/XML (XML based), JSON-LD (JSON based), and Turtle (text based). Traditionally, merging (non-semantic) datasets from different sources is cumbersome because different (local) identifiers are used, which do not match across datasources, or due to differences in the data format (e.g., JSON versus XML).
In RDF, instances and the relationships between them are identified using globally unique uniform resource identifiers (URIs) instead of names or numbers, allowing disambiguation between concepts that share the same name. When different data sources follow best practices and correctly reuse existing concepts to construct a dataset, these datasets can be merged without additional work. Conceptually, reuse is straightforward: properties are typically bundled in online vocabularies or ontologies and instance identifiers should be reused from an authoritarian source. RDF is a well suited means to exchange data between independent parties due to these properties [
3] and has been adopted by institutions who actively share data, such as government registries [
4] or libraries [
5].
By using non-ambiguous identifiers, data processing can happen in a more automated fashion. This has led to semantic reasoners, i.e., tools that derive new data by combining existing data with rules. These rules can express hierarchical properties (e.g., every ventilation machine is a machine) or expert knowledge (e.g., ventilation is required when CO
is above 600 ppm). Semantic reasoners vary in expressivity, with more expressive reasoners typically being slower [
6].
4. Dyversify Architecture
In this section we discuss the full-stack architecture of our system. We start with a high level overview and continue to discuss individual components in the order they are encountered by incoming data.
4.1. High-Level Overview
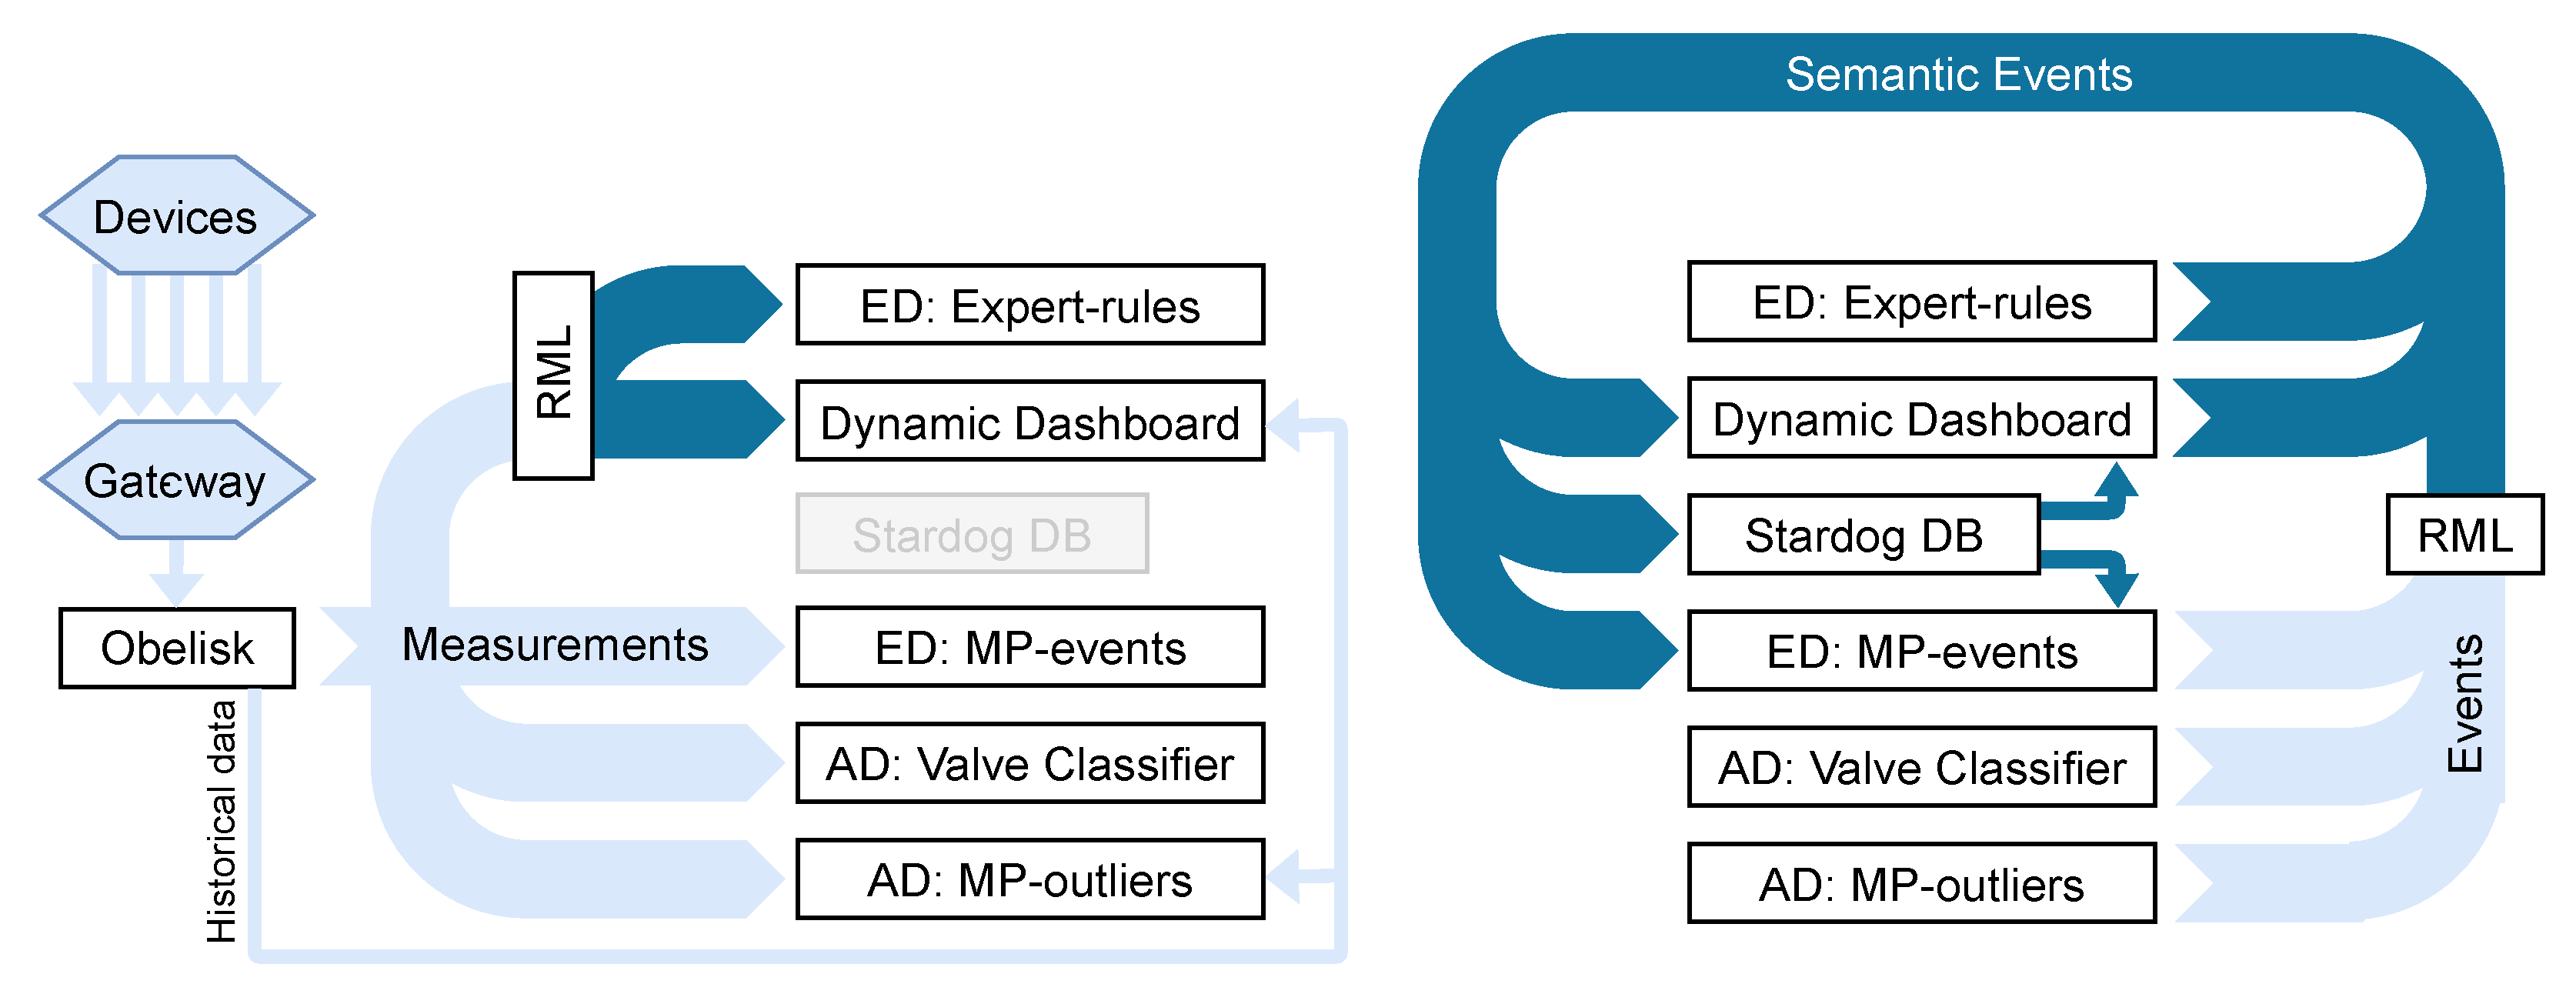
To understand the flow of data throughout the system, it is easiest to consider measurement data and event data (created by processing measurements) separately. Both flows are shown in
Figure 1.
The left of
Figure 1 shows the flow of measurements throughout the system. Measurements originate from individual Healthbox devices, as described in
Section 2.2, and are received by a gateway on Renson premises. The Healthboxes have an internal memory to buffer measurements to prevent data loss in case of connectivity issues to the gateway. The gateway forwards all measurements to the
Obelisk component, which serves as the ingestion and long term storage system. Obelisk pushes all measurements in a JSON format to a
Kafka message bus that is consumed by other components. Two
event detection (ED) and two
anomaly detection (AD) components consume all measurements and output an event message when a specific condition or pattern is observed. The
RML component is responsible for mapping measurements to their semantic form, which are needed by the expert rules and dashboard components. The
dynamic dashboard component is intended for user interaction: it can visualize the data streams for all devices, updating as new measurements flow in. We utilize the term
dynamic as the dashboard suggests visualization widgets based on the semantic annotations of the metrics that are to be visualized.
The event stream is shown on the right of
Figure 1. Events are generated by the anomaly and event detection components whenever they find a relevant pattern in the incoming measurements. All components output events in a JSON format which are converted to a semantic format by the RML component, except for the expert-rules component, which works internally using semantics as well. The semantic events are ingested by three different components. The dynamic dashboard triggers (or updates) user notifications whenever an event is ingested. Whenever the MP-events component receives a labeled event, it will start a new pattern detector to find that specific pattern in new measurements. Finally, the Stardog component is a database that permanently stores the semantic events and can be used by the dashboard and MP-events component to retrieve historical events. Note that the dashboard also outputs events; these are in fact previously ingested events that have been updated by user interaction, such as the labeling of an anomalous pattern.
The precise definition of “anomaly” varies from source to source. Some consider anomalies as
strictly undesired (e.g., a malfunction), others prefer
outside of normal conditions (e.g., machine maintenance), or simply as
previously unknown (e.g., higher power consumption for a specific configuration). In this work, we use the term “anomaly” to indicate a previously unknown pattern, which may be undesired (e.g., malfunction) or normal behavior (e.g., opening a window for the first time), and we use the term “event” to indicate patterns recognized using some known rule (e.g., a humidity peak in a bathroom indicates a shower). However, when discussing the Kafka message bus, the
event topic contains both events and anomalies, as hinted by
Figure 1.
4.2. Microservices and Deployment
A proper microservice-based system is defined by a number of properties [
23]: fine grained interfaces, business-driven practices, cloud-native design principles, polyglot programming and persistence, lightweight containers, decentralized continuous delivery, and DevOps with a large amount of automation. These properties make the microservice architecture an ideal choice when scalability and independent governance of its components is required. It enables different teams to collaborate on a project, as each team can develop, maintain, and deploy their own services independently.
The components in our platform, implemented as microservices, are deployed as Docker containers on a Kubernetes cluster, using Helm as management tool. Services that require basic data persistence are configured with Kubernetes persistent volumes, so data is not lost if a service is restarted. We used Kubernetes resource management to specify CPU and RAM quota for all services, so as to prevent system degradation in the case of misbehaving services, which is not uncommon in development. By using microservices, each team could independently develop and test their service; this allowed freedom in both planning and choice of technology. In stream processing frameworks such as Storm, Flink, or Spark, it can be more challenging to include techniques that are not available out of the box. The only downside we experienced from using a microservice architecture was the increased effort needed when the message exchange format (e.g., events) changed.
All services are deployed on the IDLab Virtual wall (
https://doc.ilabt.imec.be/ilabt/virtualwall/, (accessed on 7 December 2021)), a server park of over 350 machines. Practically, the Dyversify project uses four pcgen3 nodes (2x Hexacore Intel E5645 2.4 GHz CPU, 24 GB Ram, 250 GB harddisk) and two pcgen4 nodes (2x 8core Intel E5-2650v2 2.6 GHz CPU, 48 GB Ram, 250 GB harddisk) for all services except for Obelisk. Obelisk is deployed on a dedicated Kubernetes cluster and hardware but is used by 12 other projects alongside Dyversify. Obelisk is deployed on three nodes with the following hardware: Intel Xeon Silver 4114 2.2 Ghz CPU (40 cores) and 264 GB Ram.
4.3. Time-Series Ingestion and Persistence: Obelisk
The ingest system is responsible for accepting all IoT sensor data. For a general IoT case, this component needs to be secure, resilient, and able to handle parallel, high throughput streaming data. Long-term data persistence is also required for visualization, initializing new stream processing models or updating old ones.
As ingestion service, we use Obelisk [
40,
41], a scalable platform for building applications on IoT-centric time-series data that was developed in-house by Ghent University and imec in the scope of several IoT projects [
42,
43]. Obelisk provides a stateless HTTP API for storing and retrieving data and uses authentication based on OpenID and OAuth 2.0. Authorization is done by assigning users to project scopes. Internally, Obelisk consists of several distributed microservices that are managed by Kubernetes and are deployed on dedicated hardware with fail-over capacity (see
Section 4.2).
Obelisk is based on Vert.x, an event-driven and non-blocking JVM framework that can handle high concurrency using a small number of kernel threads. It uses InfluxDB to persist time series and mongoDB for storing metadata and allows rates of up to 6000 measurements per second [
41]. Obelisk is foreseen to become open-source by the first half of 2022.
Alternatives to Obelisk include the Open Source FiWare ecosystem. Testing showed scalability issues with passing data to and retrieving data from the FiWare context broker, and only in later versions was historical data aggregation added. These performance issues were also observed by external researchers [
44]. Other options include proprietary solutions like Microsoft Azure IoT Hub, Google Cloud IoT Core, and the AWS IoT Platform. As these latter solutions come with a substantial vendor lock-in (with no control over the evolution of APIs a.o.), the choice for Obelisk was made.
As shown in
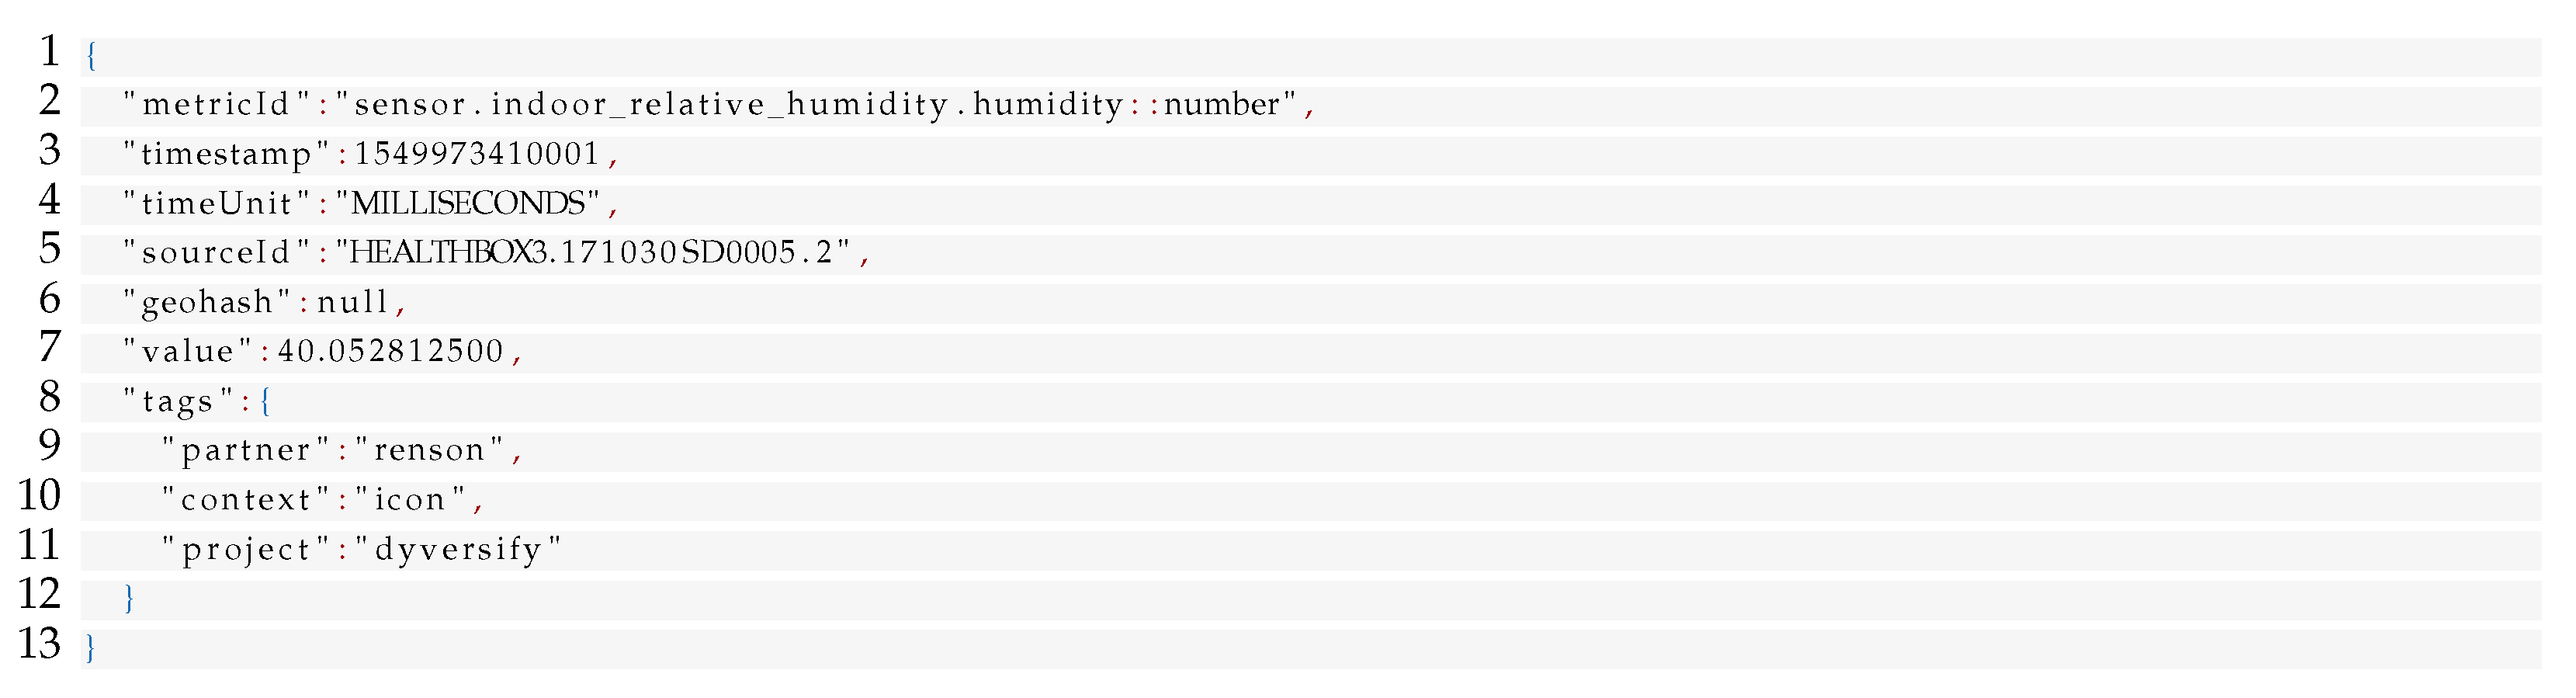
Figure 1, the measurements made by the Healthbox devices are sent to Obelisk. Once received, the measurements are validated, persisted, and forwarded to other components through the Kafka message broker. An example of a measurement message is shown in Listing 1; it contains a single humidity measurement from a single device for a specific timestamp.
| Listing 1. Example of a measurement JSON message. The geohash key specifies information regarding location of the measurement but was not used in Dyversify. |
![Applsci 11 11932 i001]() |
4.4. Message Broker: Kafka
The message broker is responsible for the communication between all other components. Together with the ingest system, it should provide enough throughput and be both scalable and fault tolerant. Additionally, our use of time-series analysis techniques required that messages remained ordered and were not lost in the case of failure, and messages had to be processed according to the at-least-once principle.
We selected Kafka as message broker. Kafka is a high-throughput, low-latency, resilient, and scalable message passing platform suitable for handling real-time data feeds. Message streams are organized in
topics that can be further subdivided into one or more disjoint
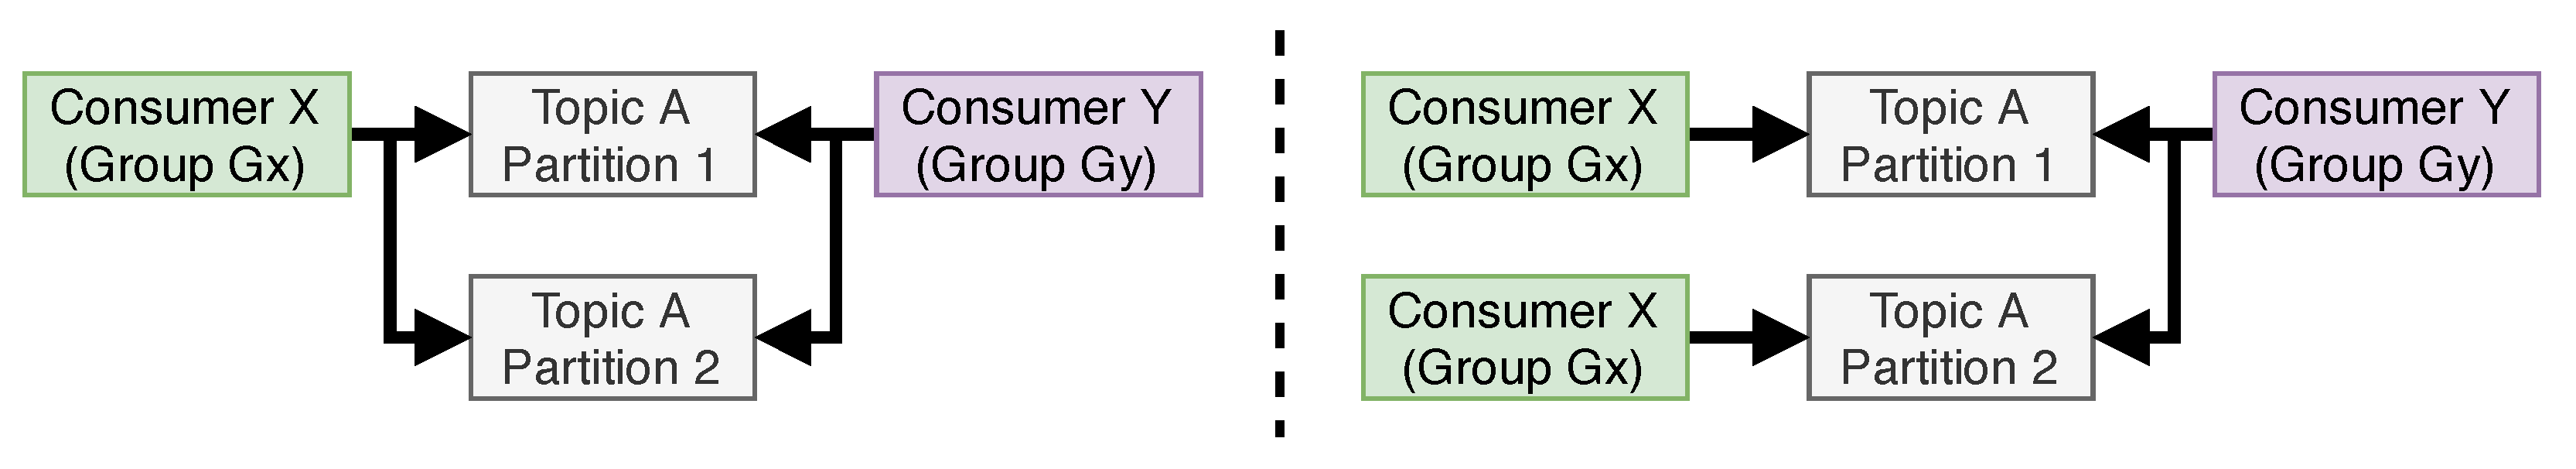
partitions. One topic typically corresponds to one type of message (e.g., measurements or events), whereas partitions divide a topic into logical groups (e.g., groups of machines being monitored). This structure supports Kafka consumers to be horizontally scalable through the use of
consumer groups. In Kafka, partitions are automatically divided amongst all consumers that belong to the same consumer group, meaning that the workload decreases as more consumer instances are created. This principle is visualized in
Figure 2.
Kafka also allows for resilient data processing by having data consumers commit their position in each stream at periodic intervals. When a consumer crashes or gets added in response to an increased system load, it can resume processing from the most recent checkpoint. This way, every message is guaranteed to be processed, though some messages may be processed multiple times as a result of a crash. Kafka itself is made resilient through its distributed, redundant deployment.
We utilize Kafka topics to differentiate four types of messages: measurements, semantic measurements, anomalies, and semantic anomalies. The measurement topics contain the sensor data as received by the ingest system, while the event topics contain information about the detected events. By using Kafka partitions, any consumer can be made horizontally scalable through consumer groups. For example, we use five partitions for the measurement topic, meaning that up to five instances of a single anomaly detection algorithm can process incoming measurements at the same time, if required.
Alternative message brokers would be RabbitMQ (a traditional message broker that does not focus on persisting messages), ZeroMQ (a lightweight messaging system that is aimed at high throughput but lacking advanced features), or Apache ActiveMQ (supports both broker and peer-2-peer messaging). We chose Apache Kafka due to its inherent focus on high reliability and scalability. Apache Pulsar was a considered alternative, as it had similar feature sets. Still, we found Kafka to have the more mature offering at the time this research was performed, especially when deployed in a Kubernetes cluster environment.
4.5. Semantic Conversion: RML
The Dyversify project combines machine learning and semantic technologies. As such, a step to transform data to a semantic format is needed. Specifically, the dynamic dashboard and expert-rule-based components rely only on semantic data. It would be possible to include this conversion for every data outputting service in our system, but this would require teams not familiar with semantic technology to include it in their service. This in turn would have required more testing and development effort for those teams. Furthermore, Dyversify wanted to actively explore how semantic and non-semantic services could work together, so introducing semantics in every component was not useful in this regard. We opted for a separate conversion service that could be reused by other services. Data throughput was the main requirement for this service.
We selected our in-house RMLStreamer [
45] for this component, which is a streaming implementation of the RMLMapper [
46], a tool that executes RML (RDF Mapping Language [
47]) mappings. Using RML, we can define a mapping from various common input formats, including JSON, XML, or CSV, to a semantic format. Note that RML mappings are themselves specified using RDF. The actual conversion is done by the RML-streamer, a tool that executes the mappings defined in RML. Under the hood, the RMLStreamer uses Apache Flink to distribute the workload to different nodes. We utilized four worker nodes and one supervising node in Dyversify.
The format of measurements was defined by Obelisk and always had the same structure, making mapping straightforward. However, the information in the event messages could differ depending on the origin service. To simplify conversion, we defined a JSON template (discussed in
Section 4.6) with optional fields for event messages that would be used by all event-generating components. As missing fields are simply ignored in the mapping process, we only need a total of two mappings: one for measurements and one for events.
The mappings were made by a semantic expert using YARRRML [
48], a more user-friendly textual format that compiles to RML. While several formats are possible to serialize semantic data, we selected JSON-LD since it allows data extraction using well-known JSON constructs (opposed to SPARQL constructs), which was again useful for lesser semantic-experienced teams and early prototyping. Mappings used the SSN (Semantic Sensor Network) [
49], SOSA (Sensor, Observation, Sample, and Actuator) [
50], and Folio [
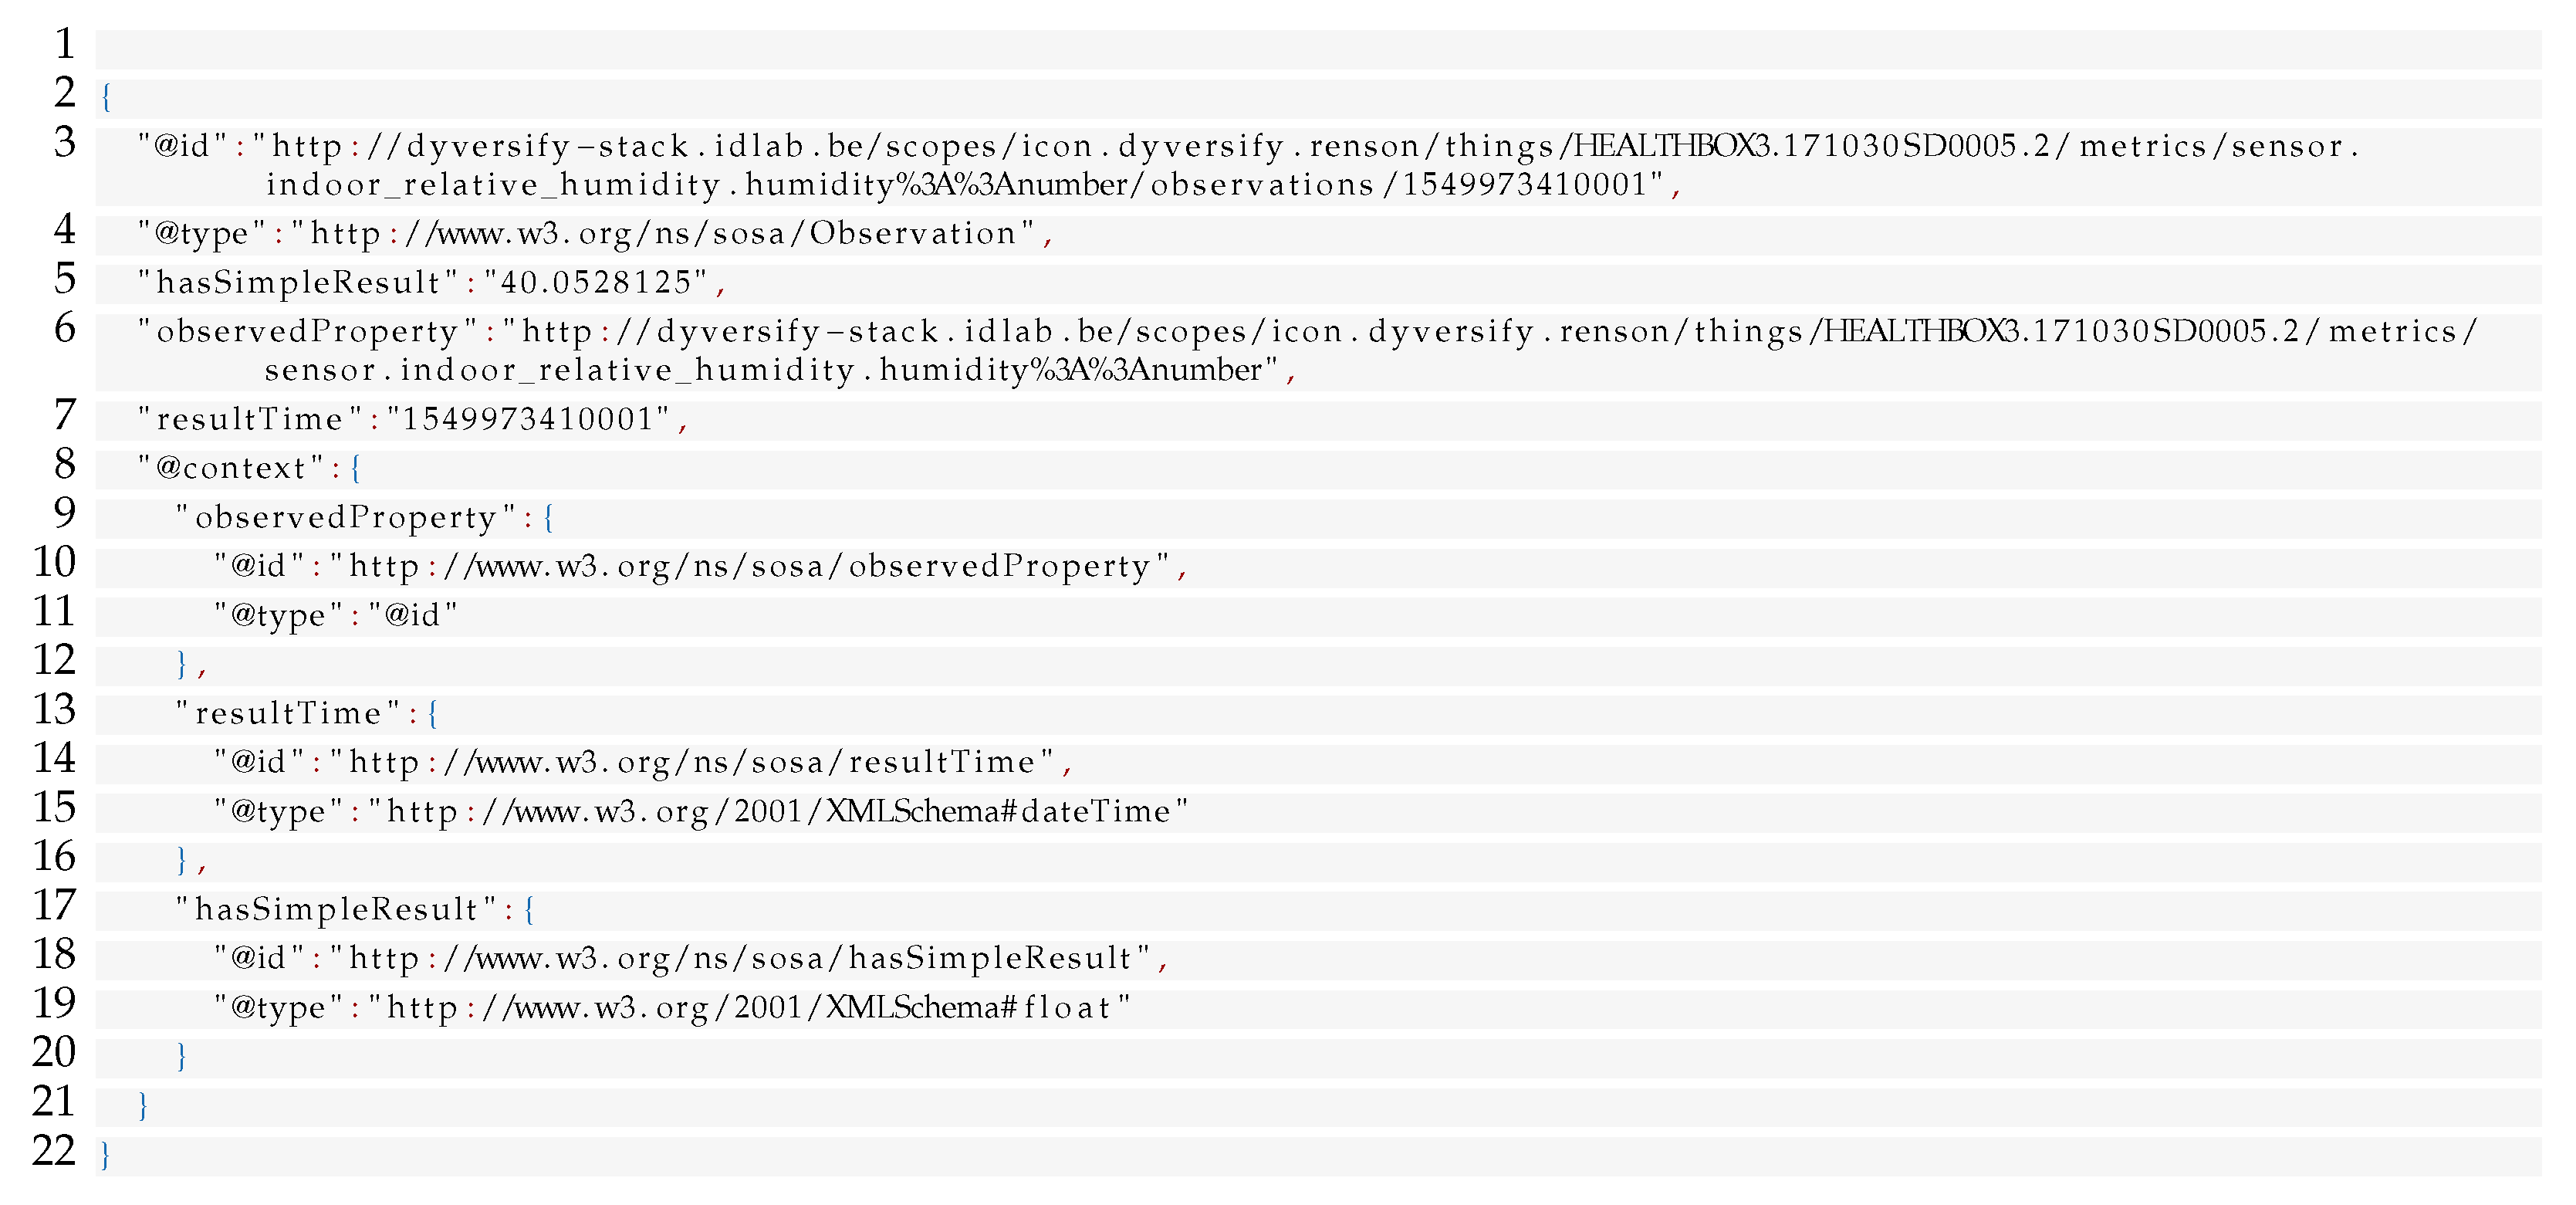
51] ontologies, the latter of which was developed specifically for both use cases in Dyversify. Listing 2 shows the semantic version of the measurement in Listing 1. Note that this example is not fully valid RDF, as the
resultTime does not specify a valid ISO timestamp but rather an epoch timestamp. This is due to a limitation in the RMLStreamer, which did not yet support functions in mappings at the time of the Dyversify project. Consumers of semantic events took this quirk into account instead.
SPARQL-Generate is an alternative tool for semantic conversion that is based on an extended SPARQL syntax [
52]. However, it is less performant than the RMLStreamer [
45]. RocketRML [
53] is a Node-JS based mapper that also uses RML mappings. It claims faster timings than the RMLMapper but does not implement the full functionality. Finally, CARML is a converter that struggles with large datasets in batch conversion but might be suited for streaming cases [
54]. Of course, mapping through a custom-made script is also possible, but this ignores the benefits that supporting tools might offer, such as graphical editing or correctness checking [
55].
| Listing 2. The semantic JSON-LD equivalent of the measurement shown in Listing 1. |
![Applsci 11 11932 i002]() |
4.6. Event/Anomaly Detection
A wide range of analysis techniques exists, as discussed in
Section 3. The choice of technique often depends on the use case, efforts to implement, and characteristics of the technique such as throughput or data requirements. Techniques can also be combined, either as single service using boosting or bagging approaches or as multiple, independent services to further improve performance [
56]. Some common requirements of techniques include availability of historic data, availability of labeled data, and scalability.
In Dyversify, we investigated how to leverage the Healthbox data to detect certain user events as well as anomalous system behavior. Three teams, each with different backgrounds and a focus on different techniques, implemented their techniques as separate microservices. This resulted in four different microservices, as shown in
Figure 1. We discuss each in detail below.
Each of the detector instances reads measurements from the (semantic) measurement Kafka topic and writes any detected anomaly/event to the (semantic) event Kafka topic. Components that require historic data query Obelisk for measurements or the Stardog database for anomalies and events. Each detected anomaly/event is described with an event identifier, the originating Healthbox, the metric(s), the time range of the event, the timestamp of the detection, a description, and an identifier of the detector.
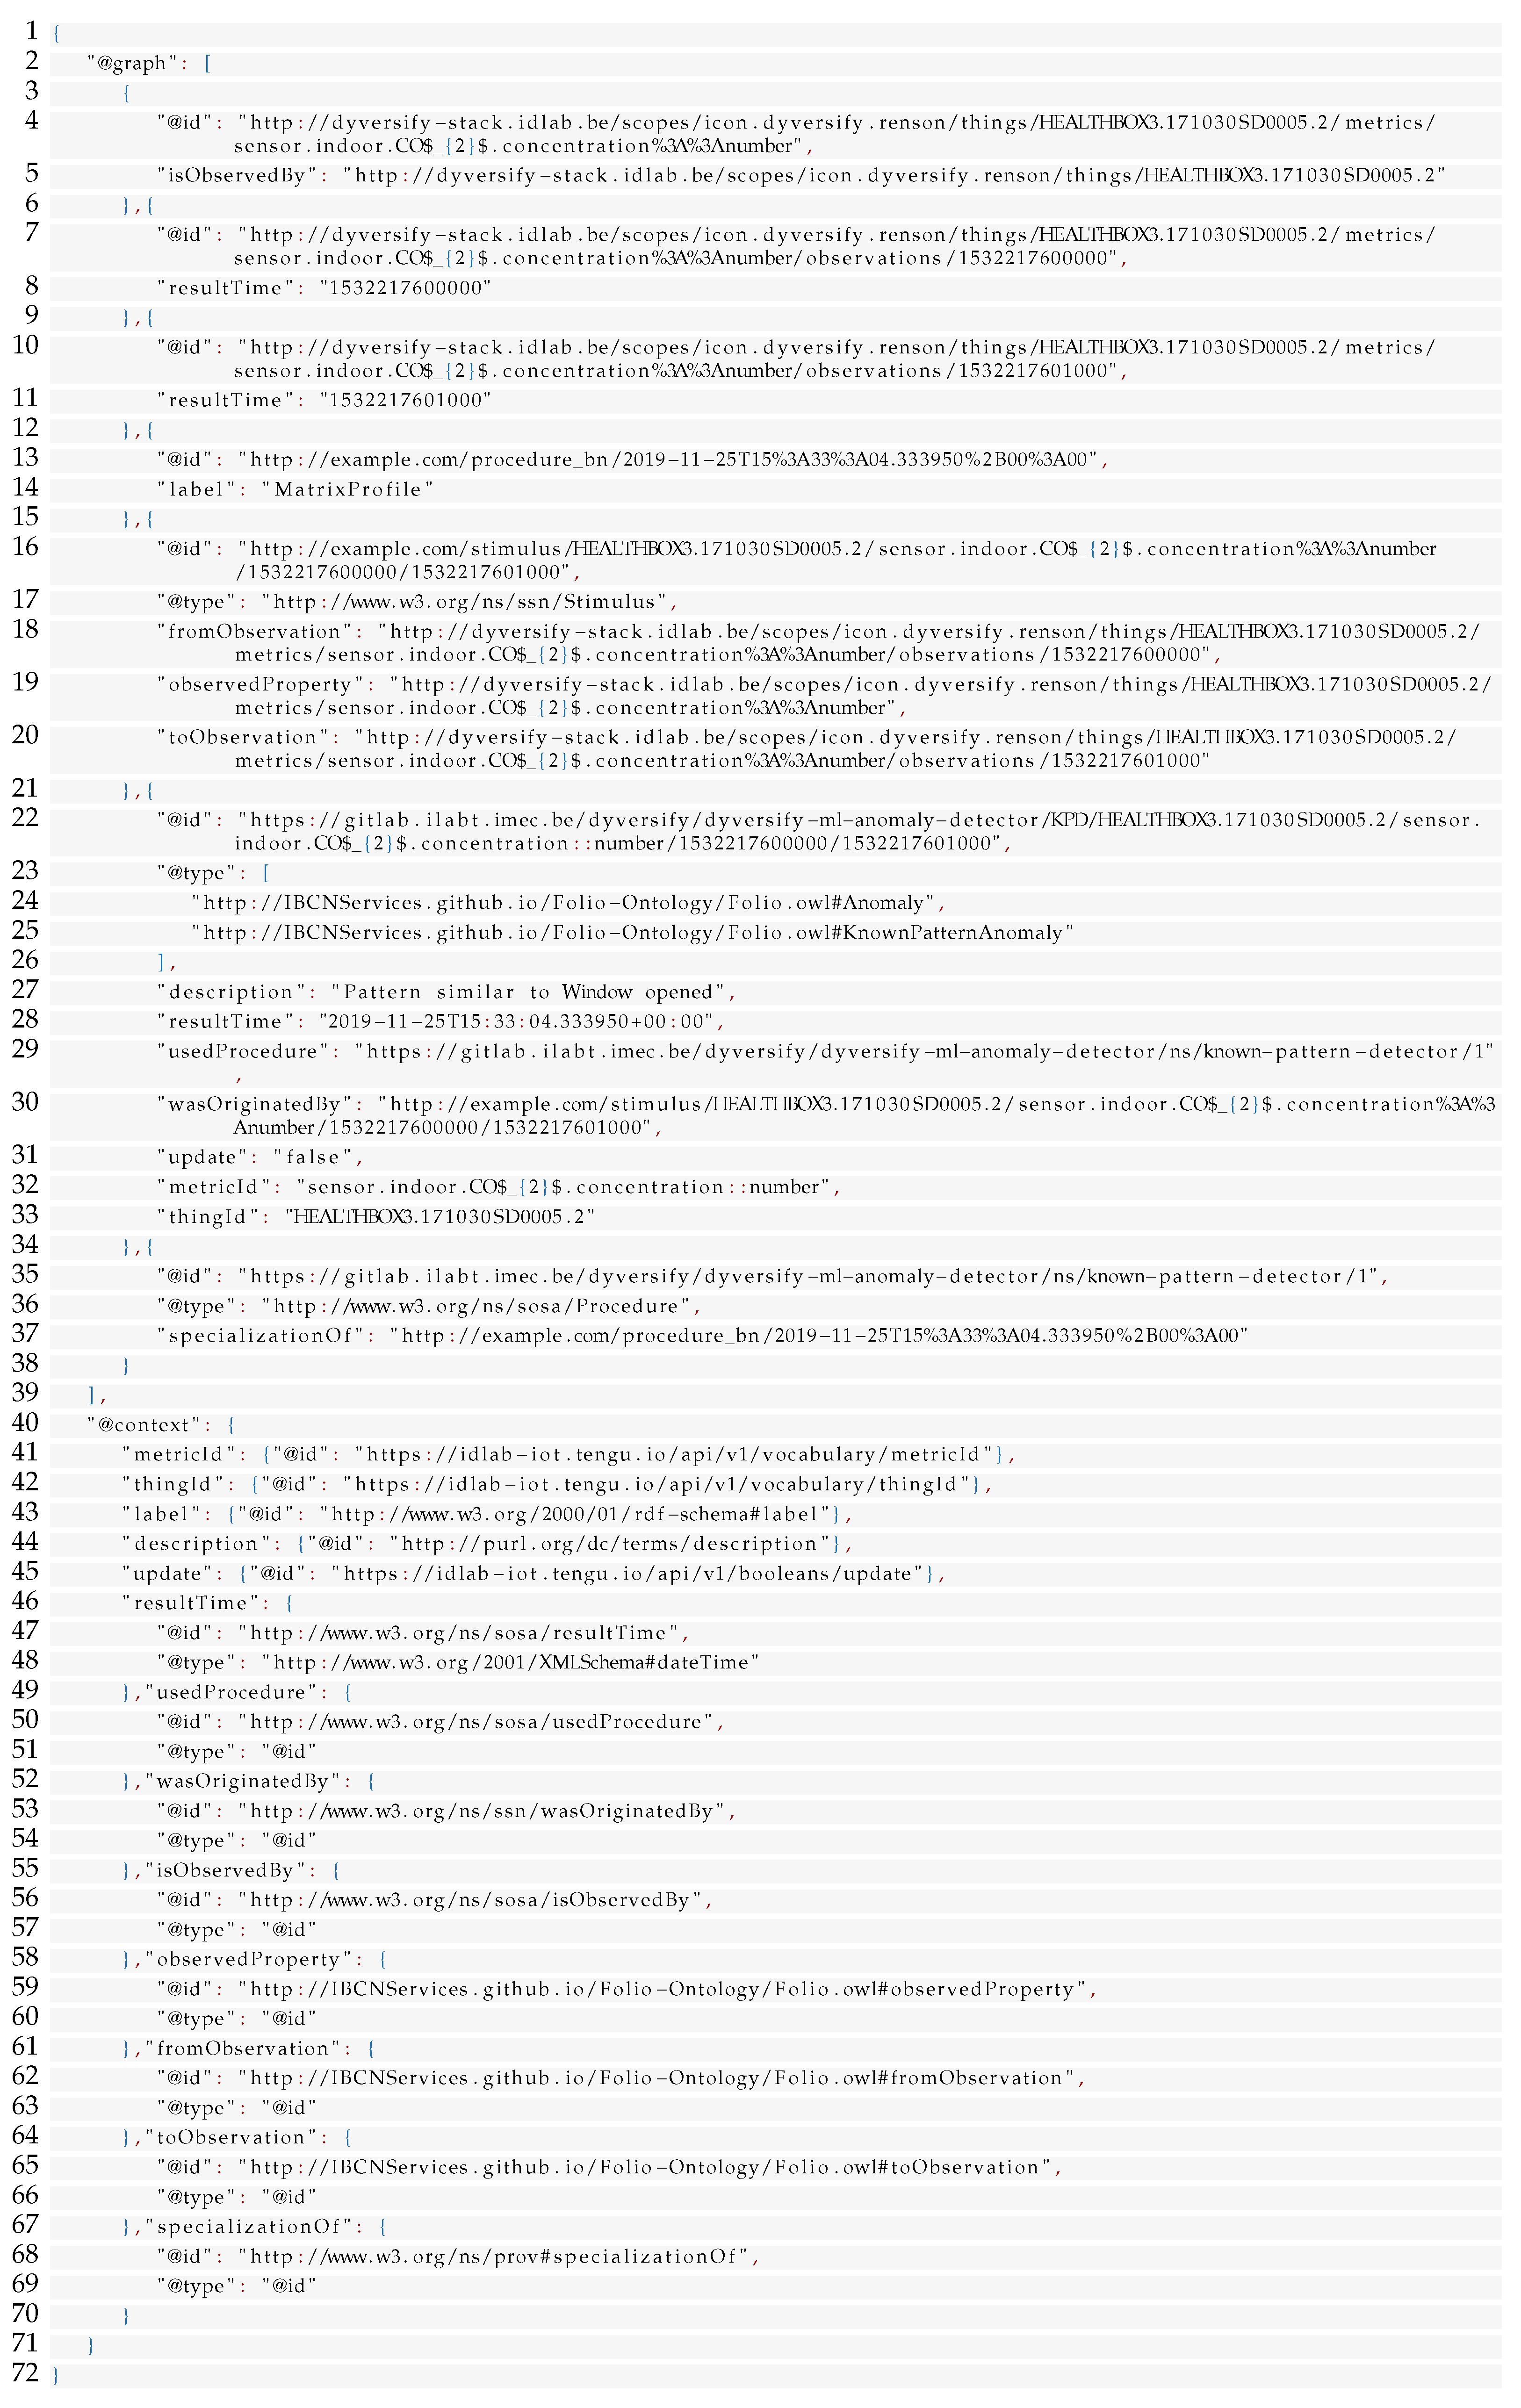
Listing 3 shows a JSON event as generated by the MP-events component. The id field contains an identifier for the event. We opted to have each component create HTTP ids so as to simplify the semantic conversion and for easier differentiation of the events when debugging. The update field indicates whether the event is an updated version of a previously published event and is used to update the records in Stardog. The generatedBy field provides provenance information. A versioning scheme for the component was foreseen but did not see real use in Dyversify. The timestamp indicates the detection time, and the anomaly field gives all information regarding the event, including the occurrence time of the event (in epoch time). Note that the timestamp and timing of the event may differ when older data is being processed, which might occur when a processor has been offline for a while. Finally, the matches field is specific to the MP-events component; it links the detection to the labeled pattern that was matched.
| Listing 3. JSON representation of an event detected by the MP-events service. |
![Applsci 11 11932 i003]() |
The same information is present in the semantic format shown in Listing A1 in
Appendix A. The JSON-LD version is more verbose due to constraints imposed by the used ontology and the need to include a JSON-LD context, which links the JSON keys to semantic concepts.
Because detector deployments may also crash or change due to rescaling, they use Kafka to persist their progress periodically. To avoid issues with reporting a single event multiple times when measurements are re-processed, we generate event identifiers based on the timestamp of the measurements. This way, duplicate detections will have the same identifier and require no special treatment.
4.6.1. Anomaly Detection: Valve Classifier
The valve classifier is the most straightforward analysis component. It aims to detect incorrectly installed valves, a common installation error as described in the use case explanation. It does this by using the measurements to determine the most likely room type and comparing this prediction against the type of configured vent.
Classification techniques evaluated include neural networks, decision trees, random forest, and Gaussian processes. Ultimately, we settled for a random forest classifier that discriminates between bedrooms, bathrooms, and an unknown type. Features were obtained by subsampling the measurements to 5 min intervals, collecting a full day of absolute humidity measurements, and generating 7 statistical features. The humidity signal was chosen as it is present in every possible valve type. The classifier was trained on available data (209 bathrooms and 114 bedrooms) and utilized oversampling to compensate the data imbalance.
The valve classifier service reads data from Kafka and buffers it until a complete day is ingested, then it uses the pretrained random forest to classify the room and outputs an anomaly message if there is a mismatch to the configured room type. As each prediction took only 50 ms per room, scalability was not an issue for this service. The classifier was built in Python using Scikit-learn [
57].
4.6.2. Anomaly Detection: MP-Outliers
This service was created to investigate how the Matrix Profile [
37] could be used to detect anomalies in the measurements. These anomalies in turn could indicate anomalous system behavior or specific user actions that affect air quality such as cooking, showering, or opening a window.
The Matrix Profile is a technique that analyzes temporal patterns rather than individual values and can be used to find both unique and repeating patterns. It works by sliding a window of a predefined size over the incoming series and calculating the distance to the best matching window in previous data. High distances indicate unique patterns (i.e., discords) and low distances indicate repeating patterns (i.e., motifs).
As measurements enter the component, they are subsampled to 1 min intervals and passed to a Matrix Profile instance specific for the originating device/metric pair. To ensure each Matrix Profile has reference data, historic data is queried from Obelisk when first encountering a new pair. If no historic data is available (as would be the case with a newly connected device), data is buffered until a predefined number of days is available after which a complete Matrix Profile is calculated. The resulting distances are normalized [
58] and checked against a predefined anomaly threshold. Anomalies are not triggered right away when the threshold is passed, but the next distances are also considered and used to find a local maximum. Once a local maximum is found, it is reported and a cooldown period is initiated to avoid new reports for the same underlying pattern. This approach avoids multiple anomalies being reported by the same underlying behavior.
The committing of progress to Kafka was somewhat complicated through the use of windows and delayed reporting: an index could only be committed if all preceding data was no longer used for a Matrix Profile window or in a delayed anomaly report. Horizontal scalability is straightforward and only limited by the number of partitions used in the measurements Kafka topic.
In Dyversify, we evaluated this technique for the CO
, temperature, and relative humidity measurements, as we expected these signals to be periodic in nature. Near the end of the project, we dropped the temperature signal as this signal produced the least interesting results. We configured each Matrix Profile to track one year of data (to have representative data for all seasons), used a window length of 1 h (humidity) or 8 h (CO
), and utilized a method to reduce the adverse effects of noise [
59]. Furthermore, we only allowed pattern comparisons for the humidity signal if the standard deviation ratio between both windows was similar (ratio below 1.5). This was needed to discriminate activity patterns from random noise in a period without activity. The MP-outliers component was implemented in Python using the in-house Series Distance Matrix library [
60].
Evaluations showed the MP-outliers processes around 2000 (non-filtered) measurements per minute or 1 measurement every 30ms. Since the average Healthbox generates 15 relevant measurements per minute, a single MP-outliers instance can process up to 133 Healthboxes in real-time. Further performance gains can be gained by using coarser subsampling, reducing the amount of reference data or by using GPU implementations of Matrix Profile [
61].
4.6.3. Event Detection: MP-Events
This component assumes that repeating patterns represent repeating system or consumer behavior and uses the Matrix Profile to search for new occurrences of relevant patterns. Relevant patterns are provided by the user interacting with the dashboard; any labeled event will be tracked.
This and the previous component differ in how they use the Matrix Profile. The MP-events component compares a
query pattern sequence against the incoming measurements, while the previous component performs a so-called
self-join [
37] to look for unique patterns in the incoming measurements. The processing flow and parameters are similar as the previous component, except here a local minimum is used, as we are interested in the best possible match for each query pattern.
The query patterns originate from two sources, as shown in
Figure 1. The first source is the Kafka event topic, where all detection events are submitted, but because we filter on labeled events, effectively only those of the dashboard are used. Still, by reading from the Kafka topic, rather than creating a direct link to the dashboard, we have a loose coupling that would allow transparent changes in the future. The second source of query patterns is the Stardog database, which is queried using a SPARQL HTTP API. Where Kafka acts as the live event feed, Stardog is the historical repository. Retrieval of historical events is needed in cases where an MP-events instance does not start processing a stream from the start. This can occur due to recovery of a crashed instance or due to reassignment after horizontal rescaling. Horizontal scalability is achieved in the same way as the MP-outliers component. Reading from two Kafka topics did pose some challenges; these are discussed in
Section 6.
As a Matrix Profile instance can only process a single measurement stream, MP-events creates one Matrix Profile per pattern. As MP-events consumes measurements, it forwards each measurement to all Matrix Profile instances tracking that specific stream. This does mean this approach will have scalability issues if the number of patterns would keep growing, though this was not a problem for Dyversify. Evaluations showed that incoming measurements for a single pattern were processed in 15ms.
4.6.4. Event Detection: Expert-Rules
This service processes the incoming measurements using expert rules that were converted into semantic rules. These rules follow an if-then structure, where both parts contain RDF triples with variables in them. Note that outputs of one rule may be used as input for a different rule. As semantic reasoners apply rules to collections of triples, rather than streams, we use windowing to reason over the most recent measurements per device/metric pair.
A semantic expert created the rules in cooperation with domain experts. As preparation, experts were asked to complete FMEA (failure mode and effects analysis [
62]) and FTA (fault tree analysis [
63]) documents, which were converted to semantic rules [
64]. An example rule, shown in Listing 4, describes the conditions for humid weather and is used as condition for other rules. Reasoning is done by an internal Stardog database. This database is loaded with the rules, the last 10 measurements, and any available metadata of the device. When the reasoner outputs an anomaly, it is submitted to Kafka.
| Listing 4. A semantic rule that expresses humid weather based on available measurements. |
![Applsci 11 11932 i004]() |
As the reasoner only uses static metadata and measurements coming from a single device, this service is horizontally scalable. We deployed three instances of this service, where each instance ran on a 10 CPU core node with 10 Stardog instances. Evaluations showed that on average, a single instance processes bedroom measurements in 320 ms and bathroom measurements in 730 ms. This difference in timings can be attributed to the complexity of the applicable rules. Further details can be found in a dedicated work [
51].
4.7. Semantic Database: Stardog
The semantic database is needed to persist all relevant semantic data. This includes all reported events, as well as available metadata about all Healthbox devices. Notably, the semantic measurements are not persisted, as semantic databases are simply less optimized for storing large collections of time-series data.
Stardog was selected based on previous experiences of the semantic team as well as practical considerations towards the project partners regarding licensing. One advantage of Stardog is that it is not just a RDF store but also a Graph DBMS, which facilitated data isolation for the industry partners. Some alternatives include Virtuoso, which has a more complex setup, or Apache Jena, which is limited to Java.
4.8. Dynamic Dashboard and Feedback
The last step in the system is a dashboard where users can visualize the various metrics and investigate any event in detail. Dashboards need to balance between flexibility and ease of use. Many dashboards require the user to specify and configure the widgets of each desired visualization. While wizards somewhat ease this task, they can still be burdensome when the number of devices or metrics grows. Dashboards are also a location to gather user input or feedback, since they are typically the only point of interaction.
In Dyversify, we further developed a semantics-driven dynamic dashboard [
65,
66]. This dashboard suggests suitable visualizations by reasoning over the semantic descriptions of the sensors and supported visual widgets. The dynamic reasoning component was also developed as an independent microservice, so it could be used to suggest visualizations in other, commercial dashboards, as was tested by our industry partner cumul.io. When an event is selected by a user, the dashboard automatically selects and configures a set of widgets that are suited to investigate it, and manual configuration of widgets remains possible.
The dashboard is implemented as an Angular application interacting with three other microservices: a data streamer, broker, and gateway. These are written in Kafka Streams, Django REST framework, and AIOHTTP respectively. The data streamer acts as the data access point to which dashboard widgets subscribe for data. The relevant metrics are then filtered from Kafka and forwarded to the widgets. Note that the streamer service is foreseen to be integrated into the gateway in future versions of the dashboard. The broker stores and provides user state (e.g., dashboard layout), keeps track of the available metrics, and houses the semantic reasoner that suggests widgets based on the semantic description of visualized data. Finally, the gateway acts as an API to retrieve the metadata and assets for dashboard widgets.
Only the dashboard microservices in our stack are exposed to the public. This way the dashboard can provide real-time updates, while all other services of our system remain in an isolated, secure setting.
Users can validate or remove events flagged by the system and can assign labels to events. These interactions act as feedback for the other components of the system. After user interaction, the label and semantic type of the event are updated and the updated event is resubmitted to the event Kafka topic where it can be picked up again by other services.
The dashboard is described in more detail in other works. Vanden Hautte et al. describe the dashboard in the context of Dyversify and include a demo movie (
https://www.dropbox.com/s/lhg7v5wz09ffvun/Dyversify%20demo.avi?dl=0, (accessed on 3 October 2021)) in their work [
66]. Moens et al. describe the interaction between the dashboard and Obelisk in more detail for a different, industrial IoT case [
43].
4.9. Monitoring
Ensuring components are behaving as expected is of vital importance both during development and in production settings. Monitoring systems give insight into the underlying system to ensure this is the case. Even if different teams do not know the specifics of components maintained by other teams, it is straightforward to interpret metrics such as CPU usage, message throughput, or Kafka messages to quickly validate that components are behaving well.
As a monitoring solution, we compared the TICK stack and Prometheus. TICK (Telegraf, InfluxDB, Chronograf, and Kapacitor) is a set of open-source tools that can be combined together or used separately to collect, store, visualize, and manipulate time-series data. It is developed by InfluxData, mostly known for its time-series database InfluxDB. The second candidate, Prometheus is a fully open-source monitoring solution inspired by Google Borg Monitor [
67]. It was initially developed by SoundCloud and later donated to the Cloud Native Computing Foundation, which also houses Kubernetes, fluentd, Helm, Envoy, and others. Each Prometheus server is standalone, ensuring correct functioning of Prometheus even when other parts of the infrastructure are broken. While both monitoring systems have the same capabilities, we chose Prometheus as a monitoring solution because it collects metrics in a pull-based manner, has a more streamlined data store, has a less verbose query language, and found it easier to configure for small setups.
Monitoring solutions such as Prometheus collect metrics can be broadly divided into three categories: service metrics (e.g., input or error rate), resource metrics (e.g., CPU usage or network I/O), and events (e.g., alerts or configuration changes). Some metrics like cache hits or database locks cannot be put in any of these categories but may still prove to be useful in representing the operability of the system. Existing methodologies can prove good starting grounds for deciding which metrics to collect. The USE-method [
68] is a system-agnostic methodology that focuses on the resource utilization, saturation, and errors. Another methodology comes from the Google Site-Reliability Engineering (SRE) team; they formulated four golden signals: latency, traffic, errors, and saturation [
67]. Finally, the RED-method (rate, errors, duration) was created by Tom Wilkie, a former Google SRE employee, and focuses on microservice monitoring.
All of the metrics above were made available in a Grafana dashboard. Still, we found the Kafka consumer lag and latest Kafka messages the most useful metrics during service development. We also experimented with a fully automatic rule-based scaling mechanism for the microservices, based on the number of incoming messages, the number of consumed messages, the average consumer lag, and the derivation thereof. This approach proved successful, but it took some time before the system reached a stable state after rescaling, so specific configuration for every use case would be required in order to be truly efficient.
6. Lessons Learned
After this overview of the architecture of the Dyversify stack, we now discuss lessons we learned while developing and testing our stack.
6.1. Scalability Requirements
Scalability is achieved by up- or downscaling the instances of components based on the workload and having each instance process a subset of the incoming data. When these components and their data flow adhere to certain guidelines, the complexity can be greatly reduced.
First, each instance should be able to work independently, so there is no need for synchronization between all instances. Ideally, the input data also forms disjoint logical groups. In our proof-of-concept, we wanted to perform event detection across all ventilated rooms per building, so the data had to be partitioned in such a way that all streams originating from a single building were assigned to the same Kafka partition.
Here, we encountered an issue for the MP-events component which also uses user feedback. The event topic contains the patterns that need to be tracked, while the measurement topic contains the actual data being tested. The issue originates from the need to process two Kafka topics at the same time (with the event topic having priority), which is not supported by Kafka. We solved this by interweaving the reads from both topics, though this introduces a timing-dependent non-deterministic behavior that might be undesired for some use cases.
A second requirement for reactive scalability is that each instance should have a short startup (ideally around or less than one minute) and perform a clean and fast shutdown when it receives a termination signal. Here, we experienced many problems with the MP-outliers service, which determines anomalies by referencing one year of historic data. Because of the way different device/metric pairs are interwoven on the measurement topic, all relevant historic data will be loaded before the detector achieves normal operating speed. As fetching historic data could take several minutes for a single sensor, this resulted in an effective startup time of 30 to 60 min before the service could start processing at normal speed. We observed cases where data fetching for a single sensor took exceptionally long, up to 12 min. These occurrences triggered the mechanism in Kafka to detect stalled processors, which terminated these processors and redistributed the workload, effectively re-triggering the issue. We solved the cascade problem by using manual partition assignment and starting the instances one at a time to avoid all instances querying Obelisk at the same moment. The long data fetches could be solved by caching the historic datasets on a shared drive, avoiding the need for lengthy data retrieval queries, and by increasing Kafka timeouts through configuration.
6.2. Setting up a Complex Microservice-Based Backend
There is a need for a number of essential enablers during multi-team collaborative R&D on complex microservice-based systems such as the one described here. For one, in-depth monitoring of individual service endpoints in terms of, e.g., load, resource consumption, and response times allowed us to rapidly gain insights into the dynamics of the service backend. This aided in identifying erroneous or misbehaving service instances, e.g., due to overconsumption of memory. In Dyversify, we chose to employ Prometheus as a monitoring and alerting toolkit, monitoring all Dockerised services deployed on Kubernetes, with metrics visualized on Grafana dashboards and automated push-based developer alerting in case a back-end issue was detected. Service mesh technologies (e.g., Istio) can provide additional monitoring, specifically network metrics, by adding sidecars or proxies to each service that is deployed. However, due to the constraints of our architecture, i.e., high speed IoT data, we opted not to implement this technology due to the impact on performance.
A second important lesson learned was that when multiple development teams deploy services on the same container orchestration infrastructure (e.g., Kubernetes), it is important to enforce infrastructural bulkheads (fixed resource constraints per team supplying services). This follows the embrace failure principle, as deployment of an erroneous service version (which can and will happen) cannot escape the confines of the bulkhead and therefore has a more limited impact on other well-behaving service instances.
Thirdly, as data in our architecture was sent over Kafka, it became clear that input validation of posted messages should be mandatory. To give an example: faulty sensors were at times emitting NaN (Not a Number) as value. As consuming services expected these values to be of floating point type, these messages remained unconsumed and cluttered the different topics. Dedicated alerting or data offloading strategies for data that does not adhere to the expected input should therefore be installed.
6.3. Early Testing for Library Limitations
Any high-level software component relies on libraries made by third parties for certain functionality. The availability or maturity of these libraries may differ between programming languages and should be considered during the design of any component. Unfortunately, desired functionality may not be fully known in advance, or limitations of certain libraries may not be apparent through documentation.
For us, the choice of programming language was mainly based on the expertise of each team, but we did not foresee problems related to libraries. Still, two library related problems arose during the course of the project. First, we encountered problems with the Python Kafka client implementation. One issue entailed internal timeouts leading to costly consumer rebalances and were due to the inner workings of the client library. Later versions of the library fixed this issue, months after we reported the issue. Another issue was missing functionality to avoid the previously mentioned initialization cascade, which is available in the Java Kafka client but not in the Python client. Both problems required workarounds that cost multiple weeks of work to get right. The second library problem was related to the RMLStreamer, and was due to an undocumented interaction between Kafka and Apache Flink (used internally by the RMLStreamer). Here, we learned the hard way that Flink does not follow the consumer group semantics of Kafka. This caused input partitions to be processed zero or multiple times, leading to both duplicate and missing semantic messages. Tests had missed this problem because the testing environment only used one data partition, whereas the production environment used multiple. This highlights the need to test early during development and to match the testing and production environment as best as possible.
6.4. Semantic Microservice Communication
The independence of components in microservice architectures imposes a need for well-defined message formats. Once established, changes may affect multiple other components and should be avoided. A known solution is for each microservice to provide versioned, well-defined contracts to clients. New versions incorporate changes and are used in parallel with older, deprecated contracts during a grace period.
Our stack uses two types of messages in the Kafka topics: measurements and events. Both types have a JSON and semantic JSON-LD model, and a mapping is possible from one format to the other. The measurement format is straightforward, as it is only outputted by the ingest system. The event format consists of a single specification with optional fields that are filled depending on the producer.
While semantics are well suited for streamlining communication from different sources, we experienced no benefit from using semantic messages over plain JSON for microservice communication. As mentioned in the introduction, semantic graphs can be serialized in multiple ways. Even in the JSON-LD serialization, there are multiple formats to represent the same data. This means developers either have to use a technique called JSON-LD framing to transform it to a desired JSON structure or load the data into a triple store so it can be queried using SPARQL. While framing and SPARQL are well supported, they are unfamiliar to developers and introduce an extra level of complexity. Because the microservice environment is isolated and the format of messages is well defined, the streamlining value of semantics is somewhat lost and we are left with a complex data container.
Another aspect to take into account is the verbosity of semantic messages. Because URIs are used to identify concepts and relations, and values should be specified explicitly (i.e., they should not be extracted from URIs), semantic messages are typically longer than a pure JSON representation. Methods exist to reduce verbosity, such as the use of a context that maps (long) URIs to short, simple string keys, as is done in Listings 2 and A1. However, this has no effect for short messages such as measurements or events because the mapping context has to be included in the message as well. The JSON-LD context can also be included as an external link in a HTTP header. Conceptually, this requires clients to validate the context for every message they process, incurring a processing overhead instead. For us, semantic messages were 1.5 to 6 times larger than their equivalent JSON messages.
7. Conclusions
In this paper we discussed the architecture designed and validated within the Dyversify project to create a working, scalable, and resilient proof-of-concept software stack that combines machine learning and semantic technologies. This stack is used for event detection on time-series data stemming from internet-enabled ventilation devices. The stack was developed in cooperation with three industry partners and validated using real data from train bogie monitoring and ventilation monitoring systems, though this paper only discusses the former.
We explain how data ingest, storage, transfer, processing, visualization and capturing of user feedback are performed by interacting, independent microservices. Event and anomaly detection is performed by multiple machine learning and semantic expert-based components, whose output is unified to a semantic format. A dashboard uses semantic sensor descriptions to dynamically generate visualizations for events with only limited human intervention. We also discuss our system monitoring approach and considerations to guarantee scalability. We believe ideas and lessons described in this work can provide a valuable starting reference for parties considering IoT event or anomaly detection, parties who want to combine both data-driven and semantic analytics, as well those looking at full-stack design.
To show general applicability of the presented stack for real-life monitoring beyond the presented use case, and given the current pandemic of COVID-19, we are currently researching the potential of the Dyversify stack for COVID-19 airborne transmission monitoring in buildings.
Research continues on all techniques mentioned in this work, as well as their integration. Anomaly detection methods for IoT still suffer from the varying deployment situations and uncertainty on what should be considered anomalous. Incorporating the context of sensors into anomaly detection might prove useful. Monitoring of distributed systems faces similar challenges, since the normal system behavior changes as services are added or replaced on the network. Finally, more fine grained models might also be useful for recommending anomaly visualizations, since users will have different focuses based on their company role or expertise.


 ,
, 

