
Effect of Pulsed Electric Field (PEF) on Bacterial Viability and Whey Protein in the Processing of Raw Milk

 and
and 
Abstract
1. Introduction
1.1. Application of Pulsed Electric Fields (PEF) in Food Processing and Pasteurization
1.2. Nutritional Properties of Raw Whey Proteins
2. Materials and Methods
2.1. Bacterial Culture
2.2. Media Preparation
2.3. PEF Treatment
2.4. Dertermination of the Most Effective PEF Parameters
2.5. Determination of Bacterial Activity in Milk
2.6. Determination of Undenatured Whey Protein Content in Milk
2.7. Determination of β-Lactoglobulin in Milk
2.8. Temperature Measurements
2.9. Statistics
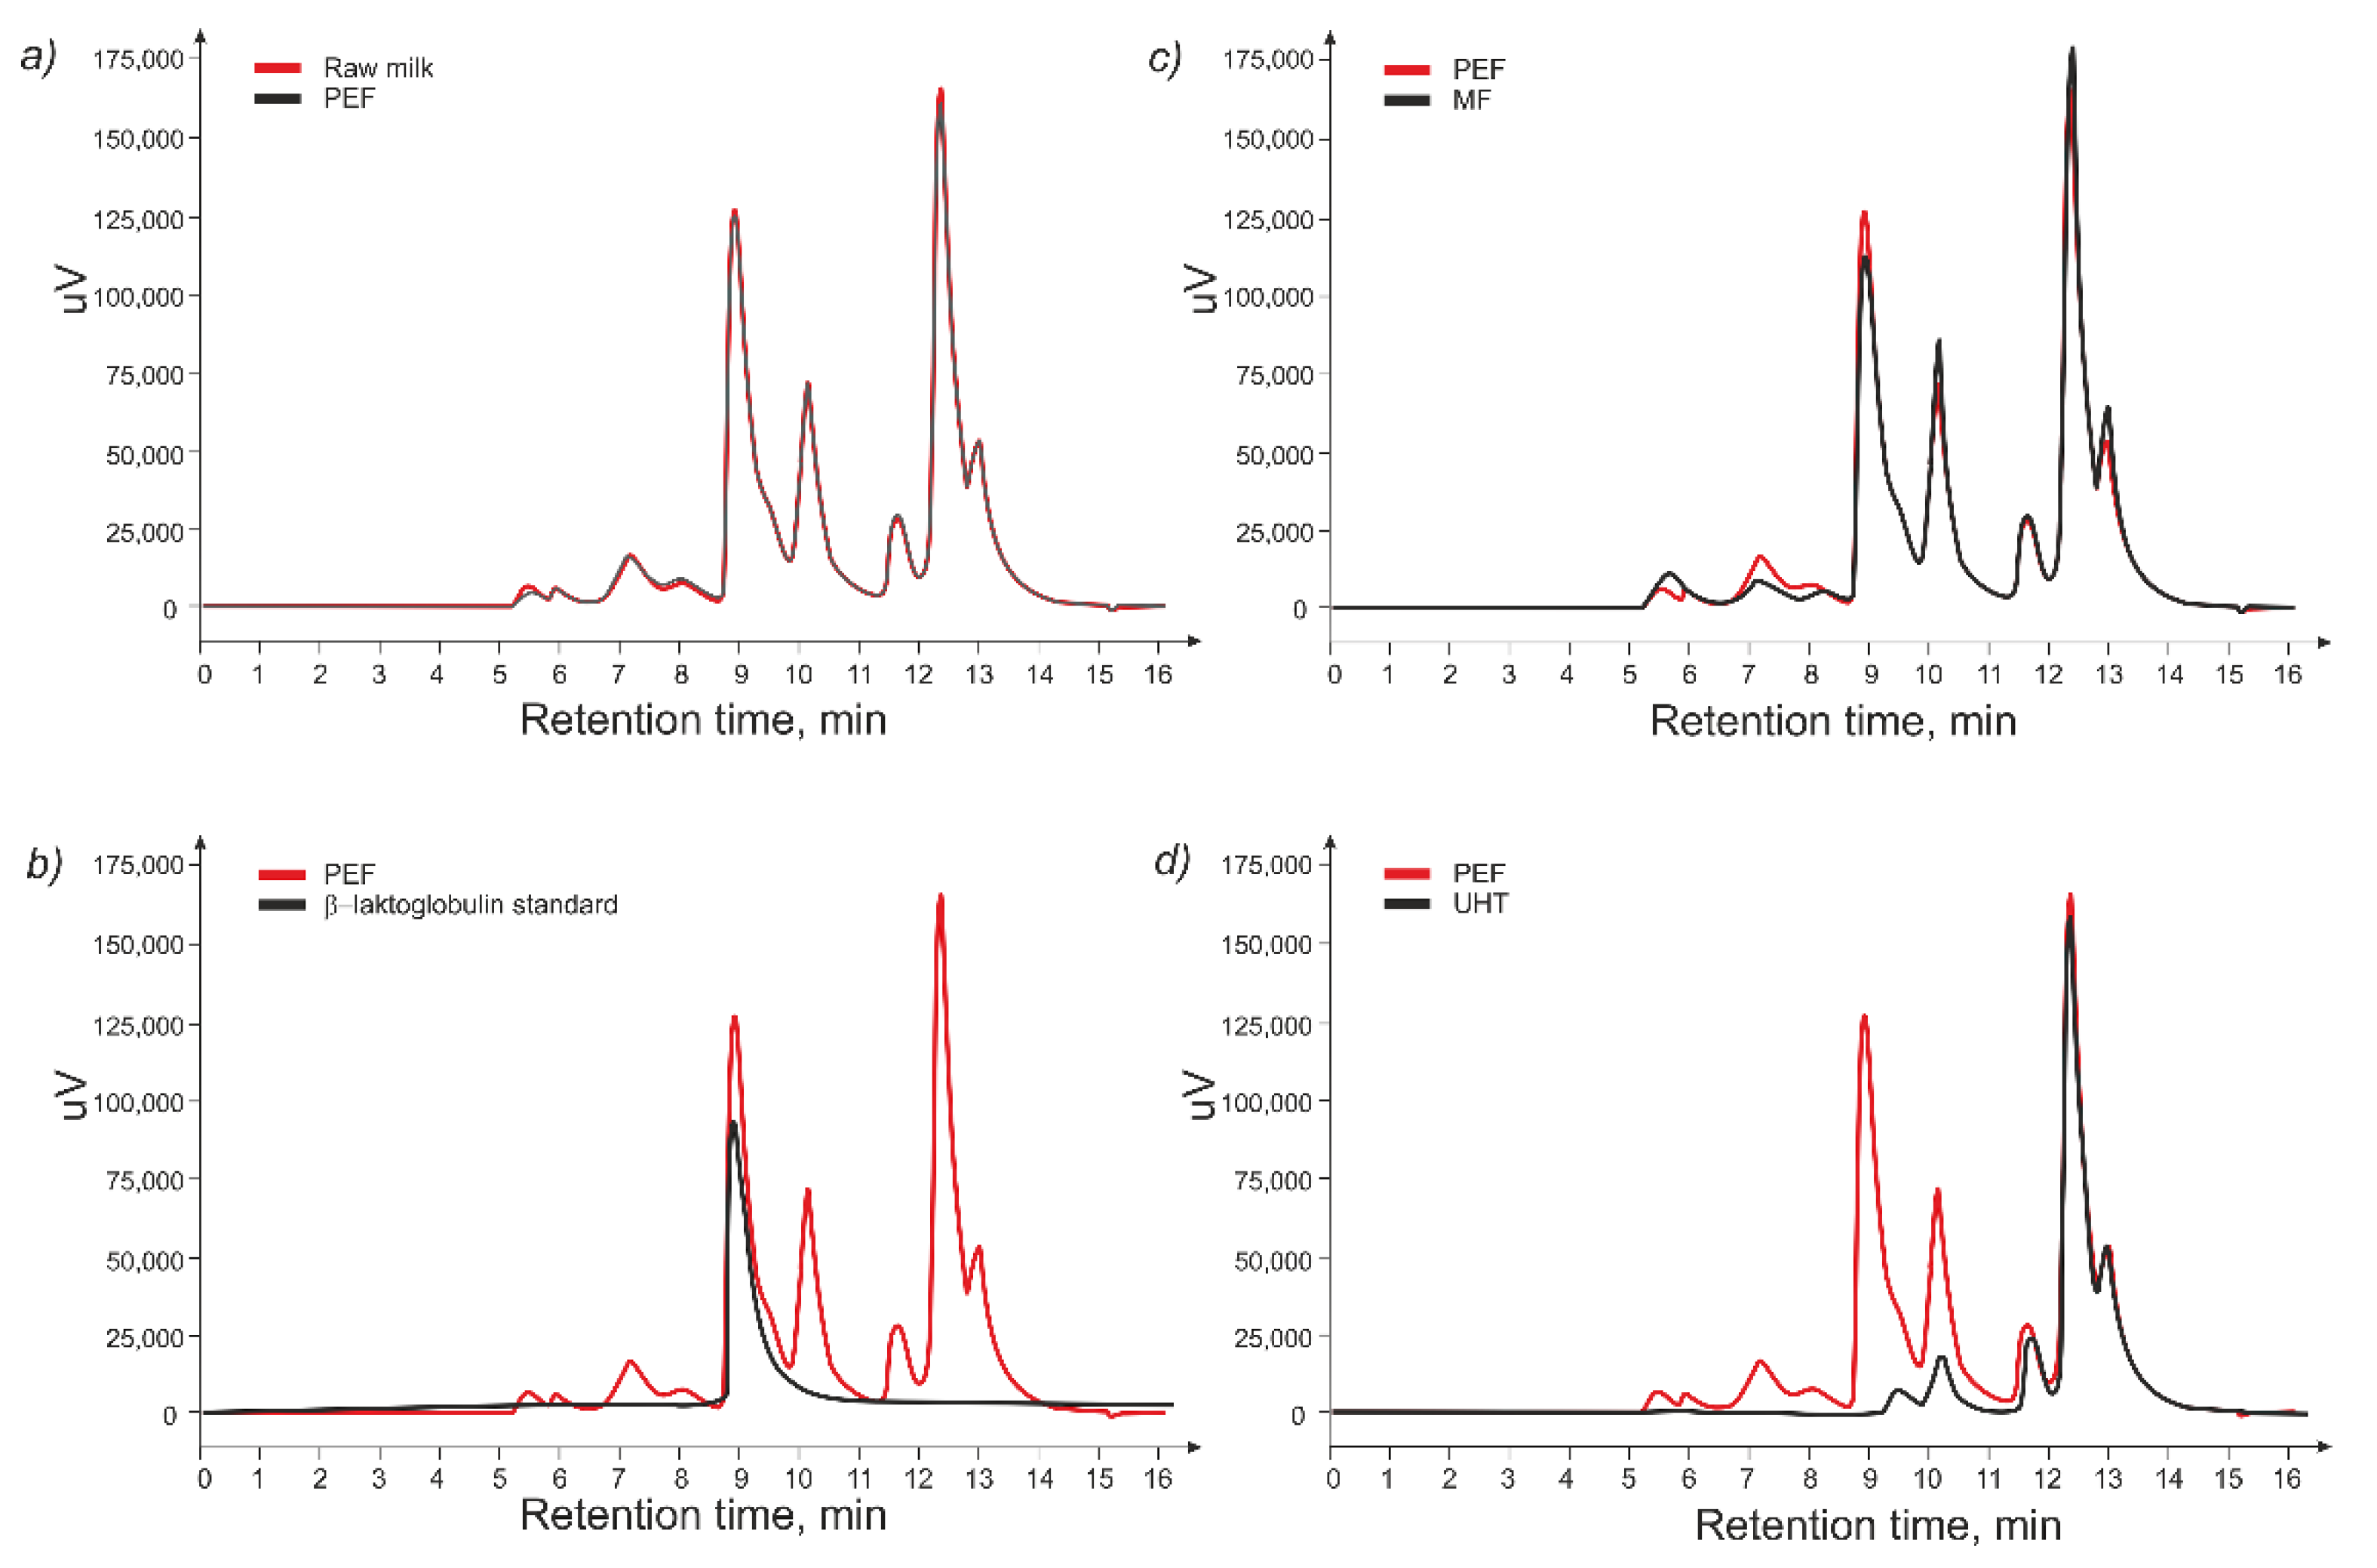
3. Results
4. Discussion
4.1. Differences in Bacterial Inactivation
4.2. Downside of Microfiltration Technology
4.3. Whey Protein Content Dependency
4.4. PEF Treatment Optimization
4.5. PEF in Production of Whey Protein Powder
4.6. Potential Limitations of the Study
5. Conclusions
Author Contributions
Funding
Institutional Review Board Statement
Informed Consent Statement
Acknowledgments
Conflicts of Interest
References
- Petruzzi, L.; Campaniello, D.; Speranza, B.; Corbo, M.R.; Sinigaglia, M.; Bevilacqua, A. Thermal Treatments for Fruit and Vegetable Juices and Beverages: A Literature Overview. Compr. Rev. Food Sci. Food Saf. 2017, 16, 668–691. [Google Scholar] [CrossRef] [PubMed]
- de Wit, J.N.; Klarenbeek, G. Effects of Various Heat Treatments on Structure and Solubility of Whey Proteins. J. Dairy Sci. 1984, 67, 2701–2710. [Google Scholar] [CrossRef]
- Sorgentini, D.A.; Wagner, J.R.; Añón, M.C. Effects of Thermal Treatment of Soy Protein Isolate on the Characteristics and Structure-Function Relationship of Soluble and Insoluble Fractions. J. Agric. Food Chem. 1995, 43, 2471–2479. [Google Scholar] [CrossRef]
- Muller, O. Malnutrition and Health in Developing Countries. Can. Med Assoc. J. 2005, 173, 279–286. [Google Scholar] [CrossRef]
- Sitzmann, W.; Vorobiev, E.; Lebovka, N. Pulsed Electric Fields for Food Industry: Historical Overview. In Handbook of Electroporation; Miklavčič, D., Ed.; Springer International Publishing: Cham, Switzerland, 2017; pp. 2335–2354. ISBN 978-3-319-32886-7. [Google Scholar]
- Buchmann, L.; Mathys, A. Perspective on Pulsed Electric Field Treatment in the Bio-Based Industry. Front. Bioeng. Biotechnol. 2019, 7, 265. [Google Scholar] [CrossRef]
- Nuccitelli, R. Application of Pulsed Electric Fields to Cancer Therapy. Bioelectricity 2019, 1, 30–34. [Google Scholar] [CrossRef]
- Mohamed, M.; Eissa, A. Pulsed Electric Fields for Food Processing Technology. Struct. Funct. Food Eng. 2012, 11, 275–306. [Google Scholar]
- Gehl, J. Electroporation: Theory and Methods, Perspectives for Drug Delivery, Gene Therapy and Research. Acta Physiol. Scand. 2003, 177, 437–447. [Google Scholar] [CrossRef]
- Radomska, H.S.; Eckhardt, L.A. Mammalian Cell Fusion in an Electroporation Device. J. Immunol. Methods 1995, 188, 209–217. [Google Scholar] [CrossRef]
- Shi, J.; Ma, Y.; Zhu, J.; Chen, Y.; Sun, Y.; Yao, Y.; Yang, Z.; Xie, J. A Review on Electroporation-Based Intracellular Delivery. Molecules 2018, 23, 3044. [Google Scholar] [CrossRef]
- Fauster, T.; Schlossnikl, D.; Rath, F.; Ostermeier, R.; Teufel, F.; Toepfl, S.; Jaeger, H. Impact of Pulsed Electric Field (PEF) Pretreatment on Process Performance of Industrial French Fries Production. J. Food Eng. 2018, 235, 16–22. [Google Scholar] [CrossRef]
- Ignat, A.; Manzocco, L.; Brunton, N.P.; Nicoli, M.C.; Lyng, J.G. The Effect of Pulsed Electric Field Pre-Treatments Prior to Deep-Fat Frying on Quality Aspects of Potato Fries. Innov. Food Sci. Emerg. Technol. 2015, 29, 65–69. [Google Scholar] [CrossRef]
- Jaeger, H.; Schulz, M.; Lu, P.; Knorr, D. Adjustment of Milling, Mash Electroporation and Pressing for the Development of a PEF Assisted Juice Production in Industrial Scale. Innov. Food Sci. Emerg. Technol. 2012, 14, 46–60. [Google Scholar] [CrossRef]
- Bermúdez-Aguirre, D.; Dunne, C.P.; Barbosa-Cánovas, G.V. Effect of Processing Parameters on Inactivation of Bacillus Cereus Spores in Milk Using Pulsed Electric Fields. Int. Dairy J. 2012, 24, 13–21. [Google Scholar] [CrossRef]
- Mosqueda-Melgar, J.; Raybaudi-Massilia, R.M.; Martín-Belloso, O. Non-Thermal Pasteurization of Fruit Juices by Combining High-Intensity Pulsed Electric Fields with Natural Antimicrobials. Innov. Food Sci. Emerg. Technol. 2008, 9, 328–340. [Google Scholar] [CrossRef]
- Timmermans, R.A.H.; Mastwijk, H.C.; Berendsen, L.B.J.M.; Nederhoff, A.L.; Matser, A.M.; van Boekel, M.A.J.S.; Nierop Groot, M.N. Moderate Intensity Pulsed Electric Fields (PEF) as Alternative Mild Preservation Technology for Fruit Juice. Int. J. Food Microbiol. 2019, 298, 63–73. [Google Scholar] [CrossRef]
- Taylor, P.; Qin, B.L.; Pothakamury, U.R.; Cánovas, G.V.B.; Swanson, B.G. Nonthermal Pasteurization of Liquid Foods Using High-Intensity Pulsed Electric Fields. Crit. Rev. Food Sci. Nutr. 1996, 36, 603–627. [Google Scholar]
- Saldaña, G.; Álvarez, I.; Condón, S.; Raso, J. Microbiological Aspects Related to the Feasibility of PEF Technology for Food Pasteurization. Crit. Rev. Food Sci. Nutr. 2014, 54, 1415–1426. [Google Scholar] [CrossRef] [PubMed]
- Walkling-Ribeiro, M.; Rodríguez-González, O.; Jayaram, S.; Griffiths, M.W. Microbial Inactivation and Shelf Life Comparison of “cold” Hurdle Processing with Pulsed Electric Fields and Microfiltration, and Conventional Thermal Pasteurisation in Skim Milk. Int. J. Food Microbiol. 2011, 144, 379–386. [Google Scholar] [CrossRef] [PubMed]
- Jeyamkondan, S.; Jayas, D.S.; Holley, R.A. Pulsed Electric Field Processing of Foods: A Review. J. Food Prot. 1999, 62, 1088–1096. [Google Scholar] [CrossRef] [PubMed]
- Jaeger, H.; Janositz, A.; Knorr, D. La Réaction de Maillard et Son Contrôle Pendant La Fabrication Des Aliments. Le Potentiel Des Nouvelles Technologies. Pathol. Biol. 2010, 58, 207–213. [Google Scholar] [CrossRef] [PubMed]
- Mosqueda-Melgar, J.; Elez-Martínez, P.; Raybaudi-Massilia, R.M.; Martín-Belloso, O. Effects of Pulsed Electric Fields on Pathogenic Microorganisms of Major Concern in Fluid Foods: A Review. Crit. Rev. Food Sci. Nutr. 2008, 48, 747–759. [Google Scholar] [CrossRef] [PubMed]
- Joannes, C.; Sipaut, C.S.; Dayou, J.; Yasir, S.M.; Mansa, R.F. The Potential of Using Pulsed Electric Field (PEF) Technology as the Cell Disruption Method to Extract Lipid from Microalgae for Biodiesel Production. Int. J. Renew. Energy Res. 2015, 5, 598–621. [Google Scholar] [CrossRef]
- Kandušer, M.; Belič, A.; Čorović, S.; Škrjanc, I. Modular Serial Flow Through Device for Pulsed Electric Field Treatment of the Liquid Samples. Sci. Rep. 2017, 7, 8115. [Google Scholar] [CrossRef] [PubMed]
- Schottroff, F.; Knappert, J.; Eppmann, P.; Krottenthaler, A.; Horneber, T.; McHardy, C.; Rauh, C.; Jaeger, H. Development of a Continuous Pulsed Electric Field (PEF) Vortex-Flow Chamber for Improved Treatment Homogeneity Based on Hydrodynamic Optimization. Front. Bioeng. Biotechnol. 2020, 8, 340. [Google Scholar] [CrossRef]
- Ivorra, A.; Villemejane, J.; Mir, L.M. Electrical Modeling of the Influence of Medium Conductivity on Electroporation. Phys. Chem. Chem. Phys. 2010, 12, 10055–10064. [Google Scholar] [CrossRef]
- Góngora-Nieto, M.M.; Pedrow, P.D.; Swanson, B.G.; Barbosa-Cánovas, G.V. Impact of Air Bubbles in a Dielectric Liquid When Subjected to High Field Strengths. Innov. Food Sci. Emerg. Technol. 2003, 4, 57–67. [Google Scholar] [CrossRef]
- Morren, J.; Roodenburg, B.; de Haan, S.W.H. Electrochemical Reactions and Electrode Corrosion in Pulsed Electric Field (PEF) Treatment Chambers. Innov. Food Sci. Emerg. Technol. 2003, 4, 285–295. [Google Scholar] [CrossRef]
- Pataro, G.; Falcone, M.; Donsì, G.; Ferrari, G. Metal Release from Stainless Steel Electrodes of a PEF Treatment Chamber: Effects of Electrical Parameters and Food Composition. Innov. Food Sci. Emerg. Technol. 2014, 21, 58–65. [Google Scholar] [CrossRef]
- Knorr, D.; Geulen, M.; Grahl, T.; Sitzmann, W. Food Application of High Electric Field Pulses. Trends Food Sci. Technol. 1994, 5, 71–75. [Google Scholar] [CrossRef]
- Hamilton, W.A.; Sale, A.J.H. Effects of High Electric Fields on Microorganisms. II. Mechanism of Action of the Lethal Effect. BBA-Gen. Subj. 1967, 148, 789–800. [Google Scholar] [CrossRef]
- Barsotti, L.; Cheftel, J.C. Food Processing by Pulsed Electric Fields. II. Biological Aspects. Food Rev. Int. 1999, 15, 181–213. [Google Scholar] [CrossRef]
- Choi, J.; Wang, D.; Namihira, T.; Katsuki, S.; Akiyama, H.; Lin, X.; Sato, H.; Seta, H.; Matsubara, H.; Saeki, T. Inactivation of Spores Using Pulsed Electric Field in a Pressurized Flow System. J. Appl. Phys. 2008, 104, 094701. [Google Scholar] [CrossRef]
- Hoffman, J.R.; Falvo, M.J. Protein—Which Is Best? J. Sports Sci. Med. 2004, 3, 118–130. [Google Scholar] [PubMed]
- Naclerio, F.; Seijo, M. Whey Protein Supplementation and Muscle Mass: Current Perspectives. Nutr. Diet. Suppl. 2019, 11, 37–48. [Google Scholar] [CrossRef]
- Patel, S. Emerging Trends in Nutraceutical Applications of Whey Protein and Its Derivatives. J. Food Sci. Technol. 2015, 52, 6847–6858. [Google Scholar] [CrossRef] [PubMed]
- West, D.W.D.; Sawan, S.A.; Mazzulla, M.; Williamson, E.; Moore, D.R. Whey Protein Supplementation Enhances Whole Body Protein Metabolism and Performance Recovery after Resistance Exercise: A Double-Blind Crossover Study. Nutrients 2017, 9, 735. [Google Scholar] [CrossRef]
- Abou-Samra, R.; Keersmaekers, L.; Brienza, D.; Mukherjee, R.; Macé, K. Effect of Different Protein Sources on Satiation and Short-Term Satiety When Consumed as a Starter. Nutr. J. 2011, 10, 139. [Google Scholar] [CrossRef]
- Luhovyy, B.L.; Akhavan, T.; Anderson, G.H. Whey Proteins in the Regulation of Food Intake and Satiety. J. Am. Coll. Nutr. 2007, 26, 704S–712S. [Google Scholar] [CrossRef]
- Almario, R.U.; Buchan, W.M.; Rocke, D.M.; Karakas, S.E. Glucose-Lowering Effect of Whey Protein Depends upon Clinical Characteristics of Patients with Type 2 Diabetes. BMJ Open Diabetes Res. Care 2017, 5, e000420. [Google Scholar] [CrossRef]
- Patel, S. Functional Food Relevance of Whey Protein: A Review of Recent Findings and Scopes Ahead. J. Funct. Foods 2015, 19, 308–319. [Google Scholar] [CrossRef]
- van Calcar, S.C.; Ney, D.M. Food Products Made with Glycomacropeptide, a Low-Phenylalanine Whey Protein, Provide a New Alternative to Amino Acid-Based Medical Foods for Nutrition Management of Phenylketonuria. J. Acad. Nutr. Diet. 2012, 112, 1201–1210. [Google Scholar] [CrossRef] [PubMed]
- Nastaj, M.; So, B.G.; Terpi, K.; Mleko, S. Effect of Erythritol on Physicochemical Properties of Reformulated High Protein Meringues Obtained from Whey Protein Isolate. Int. Dairy J. 2020, 105, 104672. [Google Scholar] [CrossRef]
- Nastaj, M.; Sołowiej, B.G.; Gustaw, W.; Peréz-Huertas, S.; Mleko, S.; Wesołowska-Trojanowska, M. Physicochemical Properties of High-Protein-Set Yoghurts Obtained with the Addition of Whey Protein Preparations. Int. J. Dairy Technol. 2019, 72, 395–402. [Google Scholar] [CrossRef]
- Farrell, H.M.; Jimenez-Flores, R.; Bleck, G.T.; Brown, E.M.; Butler, J.E.; Creamer, L.K.; Hicks, C.L.; Hollar, C.M.; Ng-Kwai-Hang, K.F.; Swaisgood, H.E. Nomenclature of the Proteins of Cows’ Milk—Sixth Revision. J. Dairy Sci. 2004, 87, 1641–1674. [Google Scholar] [CrossRef]
- Madureira, A.R.; Pereira, C.I.; Gomes, A.M.P.; Pintado, M.E.; Xavier Malcata, F. Bovine Whey Proteins—Overview on Their Main Biological Properties. Food Res. Int. 2007, 40, 1197–1211. [Google Scholar] [CrossRef]
- McIntosh, G.H.; Regester, G.O.; le Leu, R.K.; Royle, P.J.; Smithers, G.W. Dairy Proteins Protect against Dimethylhydrazine-Induced Intestinal Cancers in Rats. J. Nutr. 1995, 125, 809–816. [Google Scholar] [CrossRef] [PubMed]
- de Wit, J.N. Nutritional and Functional Characteristics of Whey Proteins in Food Products. J. Dairy Sci. 1998, 81, 597–608. [Google Scholar] [CrossRef]
- Rynne, N.M.; Beresford, T.P.; Kelly, A.L.; Guinee, T.P. Effect of Milk Pasteurization Temperature and in Situ Whey Protein Denaturation on the Composition, Texture and Heat-Induced Functionality of Half-Fat Cheddar Cheese. Int. Dairy J. 2004, 14, 989–1001. [Google Scholar] [CrossRef]
- Golberg, A.; Belkin, M.; Rubinsky, B. Irreversible Electroporation for Microbial Control of Drugs in Solution. AAPS PharmSciTech 2009, 10, 881–886. [Google Scholar] [CrossRef][Green Version]
- Raso, J.; Frey, W.; Ferrari, G.; Pataro, G.; Knorr, D.; Teissie, J.; Miklavčič, D. Recommendations Guidelines on the Key Information to Be Reported in Studies of Application of PEF Technology in Food and Biotechnological Processes. Innov. Food Sci. Emerg. Technol. 2016, 37, 312–321. [Google Scholar] [CrossRef]
- Capodaglio, A.G. Pulse Electric Field Technology for Wastewater and Biomass Residues’ Improved Valorization. Processes 2021, 9, 736. [Google Scholar] [CrossRef]
- Kuramoto, S.; Jenness, R.; Coulter, S.T.; Choi, R.P. Standardization of the Harland-Ashworth Test for Whey Protein Nitrogen. J. Dairy Sci. 1959, 42, 28–38. [Google Scholar] [CrossRef]
- Akkerman, M.; Rauh, V.M.; Christensen, M.; Johansen, L.B.; Hammershøj, M.; Larsen, L.B. Effect of Heating Strategies on Whey Protein Denaturation-Revisited by Liquid Chromatography Quadrupole Time-of-Flight Mass Spectrometry. J. Dairy Sci. 2016, 99, 152–166. [Google Scholar] [CrossRef]
- Kontopidis, G.; Holt, C.; Sawyer, L. Invited Review: β-Lactoglobulin: Binding Properties, Structure, and Function. J. Dairy Sci. 2004, 87, 785–796. [Google Scholar] [CrossRef]
- Schottroff, F.; Gratz, M.; Krottenthaler, A.; Johnson, N.B.; Bédard, M.F.; Jaeger, H. Pulsed Electric Field Preservation of Liquid Whey Protein Formulations—Influence of Process Parameters, PH, and Protein Content on the Inactivation of Listeria Innocua and the Retention of Bioactive Ingredients. J. Food Eng. 2019, 243, 142–152. [Google Scholar] [CrossRef]
- Sui, Q.; Roginski, H.; Williams, R.P.W.; Versteeg, C.; Wan, J. Effect of Pulsed Electric Field and Thermal Treatment on the Physicochemical and Functional Properties of Whey Protein Isolate. Int. Dairy J. 2011, 21, 206–213. [Google Scholar] [CrossRef]
- Xiang, B.Y.; Ngadi, M.O.; Ochoa-Martinez, L.A.; Simpson, M.V. Pulsed Electric Field-Induced Structural Modification of Whey Protein Isolate. Food Bioprocess Technol. 2011, 4, 1341–1348. [Google Scholar] [CrossRef]
- Malicki, A.; Oziembłowski, M.; Molenda, J.; Trziszka, T.; Bruzewicz, S. Effect of Pulsed Electric Field (PEF) on Escherichia Coli within the Liquid Whole Egg. Bull. Vet. Inst. Pulawy 2004, 48, 371–373. [Google Scholar]
- Tao, X.; Chen, J.; Li, L.; Zhao, L.; Zhang, M.; Sun, A. Influence of Pulsed Electric Field on Escherichia Coli and Saccharomyces Cerevisiae. Int. J. Food Prop. 2015, 18, 1416–1427. [Google Scholar] [CrossRef]
- Grahl, T.; Märkl, H. Killing of Micro-Organisms by Pulsed Electric Fields. Applied Microbiology and Biotechnology. Appl. Microbiol. Biotechnol. 1996, 45, 148–157. [Google Scholar] [CrossRef] [PubMed]
- El-Hag, A.H.; Jayaram, S.H.; Rodriguez Gonzalez, O.; Griffiths, M.W. The Influence of Size and Shape of Microorganism on Pulsed Electric Field Inactivation. IEEE Trans. Nanobiosci. 2011, 10, 133–138. [Google Scholar] [CrossRef] [PubMed]
- Feng, X.; Jiang, Q.; Zhu, M.; Jiang, J.; Yin, W.; Li, H. Damaging Effects of Pulsed Electric Field Process Parameters on Rhizoctonia Solani Cells Using Response Surface Methodology. Appl. Sci. 2019, 9, 4706. [Google Scholar] [CrossRef]
- Beveridge, T.J. Structures of Gram-Negative Cell Walls and Their Derived Membrane Vesicles. J. Bacteriol. 1999, 181, 4725–4733. [Google Scholar] [CrossRef]
- Silhavy, T.J.; Kahne, D.; Walker, S. The Bacterial Cell Envelope. Cold Spring Harb. Perspect. Biol. 2010, 2, a000414. [Google Scholar] [CrossRef]
- García, D.; Gómez, N.; Mañas, P.; Condón, S.; Raso, J.; Pagán, R. Occurrence of Sublethal Injury after Pulsed Electric Fields Depending on the Micro-Organism, the Treatment Medium Ph and the Intensity of the Treatment Investigated. J. Appl. Microbiol. 2005, 99, 94–104. [Google Scholar] [CrossRef]
- Trevors, J.T.; Chassy, B.M.; Dower, W.J.; Blaschek, H.P. Electrotransformation of Bacteria by Plasmid DNA. Guide Electroporation Electrofusion 2012, 265–290. [Google Scholar] [CrossRef]
- Álvarez, I.; Condón, S.; Raso, J. Microbial Inactivation by Pulsed Electric Fields. Food Eng. Ser. 2006, 97–129. [Google Scholar] [CrossRef]
- Ross, A.I.V.; Griffiths, M.W.; Mittal, G.S.; Deeth, H.C. Combining Nonthermal Technologies to Control Foodborne Microorganisms. Int. J. Food Microbiol. 2003, 89, 125–138. [Google Scholar] [CrossRef]
- Buckow, R.; Ng, S.; Toepfl, S. Pulsed Electric Field Processing of Orange Juice: A Review on Microbial, Enzymatic, Nutritional, and Sensory Quality and Stability. Compr. Rev. Food Sci. Food Saf. 2013, 12, 455–467. [Google Scholar] [CrossRef]
- Pillet, F.; Formosa-Dague, C.; Baaziz, H.; Dague, E.; Rols, M.P. Cell Wall as a Target for Bacteria Inactivation by Pulsed Electric Fields. Sci. Rep. 2016, 6, 19778. [Google Scholar] [CrossRef]
- Mañas, P.; Pagán, R. Microbial Inactivation by New Technologies of Food Preservation. J. Appl. Microbiol. 2005, 98, 1387–1399. [Google Scholar] [CrossRef] [PubMed]
- Htilsheger, H.; Potel, J.; Niemann, E. Electric Field Effects on Bacteria and Yeast Cells. Radiat. Environ. Biophys. 1983, 22, 149–162. [Google Scholar] [CrossRef] [PubMed]
- Lee, S.; Tai, Y. A Micro Cell Lysis Device. Sens. Actuators A Phys. 1999, 73, 74–79. [Google Scholar] [CrossRef]
- Rockenbach, A.; Sudarsan, S.; Berens, J.; Kosubek, M.; Lazar, J.; Demling, P.; Hanke, R.; Mennicken, P.; Ebert, B.E.; Blank, L.M.; et al. Microfluidic Irreversible Electroporation—A Versatile Tool to Extract Intracellular Contents of Bacteria and Yeast. Metabolites 2019, 9, 211. [Google Scholar] [CrossRef] [PubMed]
- Strahlenkunde, M.; Erlangen-niirnberg, U. On the Generation of Potential Differences across the Membranes of Ellipsoidal Cells in an Alternating Electrical Field. Biophysik 1973, 10, 89–98. [Google Scholar]
- Davis, K.M.; Weiser, J.N. Modifications to the Peptidoglycan Backbone Help Bacteria to Establish Infection. Infect. Immun. 2011, 79, 562–570. [Google Scholar] [CrossRef]
- Pyne, M.E.; Moo-Young, M.; Chung, D.A.; Chou, C.P. Development of an Electrotransformation Protocol for Genetic Manipulation of Clostridium Pasteurianum. Biotechnol. Biofuels 2013, 6, 50. [Google Scholar] [CrossRef]
- Vitzthum, F. Amplifiable DNA from Gram-Negative and Gram-Positive Bacteria by a Low Strength Pulsed Electric Field Method. Nucleic Acids Res. 2000, 28, E37. [Google Scholar] [CrossRef][Green Version]
- Griep, E.R.; Cheng, Y.; Moraru, C.I. Efficient Removal of Spores from Skim Milk Using Cold Microfiltration: Spore Size and Surface Property Considerations. J. Dairy Sci. 2018, 101, 9703–9713. [Google Scholar] [CrossRef]
- Wang, Y.; Hammes, F.; Düggelin, M.; Egli, T. Influence of Size, Shape, and Flexibility on Bacterial Passage through Micropore Membrane Filters. Environ. Sci. Technol. 2008, 42, 6749–6754. [Google Scholar] [CrossRef] [PubMed]
- Loveday, S.M. β-Lactoglobulin Heat Denaturation: A Critical Assessment of Kinetic Modelling. Int. Dairy J. 2016, 52, 92–100. [Google Scholar] [CrossRef]
- Patel, H.A.; Anema, S.G.; Holroyd, S.E.; Singh, H.; Creamer, L.K. Methods to Determine Denaturation and Aggregation of Proteins in Low-, Medium- and High-Heat Skim Milk Powders. Dairy Sci. Technol. 2007, 87, 251–268. [Google Scholar] [CrossRef]
- Abram, F.; Smelt, J.P.P.M.; Bos, R.; Wouters, P.C. Modelling and Optimization of Inactivation of Lactobacillus Plantarum by Pulsed Electric Field Treatment. J. Appl. Microbiol. 2003, 94, 571–579. [Google Scholar] [CrossRef] [PubMed]
- Puligundla, P.; Pyun, Y.R.; Mok, C. Pulsed Electric Field (PEF) Technology for Microbial Inactivation in Low-Alcohol Red Wine. Food Sci. Biotechnol. 2018, 27, 1691–1696. [Google Scholar] [CrossRef] [PubMed]
- Wouters, P.C.; Dutreux, N.; Smelt, J.P.P.M.; Lelieveld, H.L.M. Effects of Pulsed Electric Fields on Inactivation Kinetics of Listeria Innocua. Appl. Environ. Microbiol. 1999, 65, 5364–5371. [Google Scholar] [CrossRef]
- Sarker, M.R.; Akhtar, S.; Torres, J.A.; Paredes-Sabja, D. High Hydrostatic Pressure-Induced Inactivation of Bacterial Spores. Crit. Rev. Microbiol. 2015, 41, 18–26. [Google Scholar] [CrossRef]
- Reineke, K.; Mathys, A.; Heinz, V.; Knorr, D. Mechanisms of Endospore Inactivation under High Pressure. Trends Microbiol. 2013, 21, 296–304. [Google Scholar] [CrossRef] [PubMed]
- Nguyen Thi Minh, H.; Dantigny, P.; Perrier-Cornet, J.M.; Gervais, P. Germination and Inactivation of Bacillus Subtilis Spores Induced by Moderate Hydrostatic Pressure. Biotechnol. Bioeng. 2010, 107, 876–883. [Google Scholar] [CrossRef] [PubMed]
- Lin, Y.; O’Mahony, J.A.; Kelly, A.L.; Guinee, T.P. Seasonal Variation in the Composition and Processing Characteristics of Herd Milk with Varying Proportions of Milk from Spring-Calving and Autumn-Calving Cows. J. Dairy Res. 2017, 84, 444–452. [Google Scholar] [CrossRef] [PubMed]
- Casper, J.L.; Wendorff, W.L.; Thomas, D.L. Seasonal Changes in Protein Composition of Whey from Commercial Manufacture of Caprine and Ovine Specialty Cheeses. J. Dairy Sci. 1998, 81, 3117–3122. [Google Scholar] [CrossRef]
- Regester, G.O.; Smithers, G.W.; Mangino, M.E.; Pearce, R.J. Seasonal Changes in the Physical and Functional Properties of Whey Protein Concentrates. J. Dairy Sci. 1992, 75, 2928–2936. [Google Scholar] [CrossRef]
- Dellamonica, E.S.; Holden, T.F.; Calhoun, M.J.; Aceto, N.C. Effect of Season on the Whey Protein Nitrogen Distribution of Pooled Milk. J. Dairy Sci. 1965, 48, 1585–1590. [Google Scholar] [CrossRef]


| No. | Milk Samples | Total Number of Bacteria Found in Milk Samples, cfu/mL | Coliform Bacteria, cfu/mL | L. monocytogenes bacteria | ||
|---|---|---|---|---|---|---|
| Mean | SD | Mean | SD | |||
| 1. | RM | 33.33 × 10⁴ | 5.77 × 10⁴ | 1333.00 | 57.70 | Not detected |
| 2. | PEF | 4.43 × 10⁴ | 0.35 × 10⁴ | 5.00 | 1.00 | Not detected |
| 3. | Milk MF1 | 53.67 | 2.52 | <1 | - | Not detected |
| 4. | Milk MF2 | 15.00 | 2.00 | <1 | - | Not detected |
| 5. | Milk LTLT | 36.67 | 3.21 | <1 | - | Not detected |
| 6. | Milk UHT1 | <1 | - | <1 | - | Not detected |
| 7. | Milk UHT2 | <1 | - | <1 | - | Not detected |
| 8. | Milk UHT3 | <1 | - | <1 | - | Not detected |
Publisher’s Note: MDPI stays neutral with regard to jurisdictional claims in published maps and institutional affiliations. |
© 2021 by the authors. Licensee MDPI, Basel, Switzerland. This article is an open access article distributed under the terms and conditions of the Creative Commons Attribution (CC BY) license (https://creativecommons.org/licenses/by/4.0/).
Share and Cite
Šalaševičius, A.; Uždavinytė, D.; Visockis, M.; Ruzgys, P.; Šatkauskas, S. Effect of Pulsed Electric Field (PEF) on Bacterial Viability and Whey Protein in the Processing of Raw Milk. Appl. Sci. 2021, 11, 11281. https://doi.org/10.3390/app112311281
Šalaševičius A, Uždavinytė D, Visockis M, Ruzgys P, Šatkauskas S. Effect of Pulsed Electric Field (PEF) on Bacterial Viability and Whey Protein in the Processing of Raw Milk. Applied Sciences. 2021; 11(23):11281. https://doi.org/10.3390/app112311281
Chicago/Turabian StyleŠalaševičius, Aivaras, Dovilė Uždavinytė, Mindaugas Visockis, Paulius Ruzgys, and Saulius Šatkauskas. 2021. "Effect of Pulsed Electric Field (PEF) on Bacterial Viability and Whey Protein in the Processing of Raw Milk" Applied Sciences 11, no. 23: 11281. https://doi.org/10.3390/app112311281
APA StyleŠalaševičius, A., Uždavinytė, D., Visockis, M., Ruzgys, P., & Šatkauskas, S. (2021). Effect of Pulsed Electric Field (PEF) on Bacterial Viability and Whey Protein in the Processing of Raw Milk. Applied Sciences, 11(23), 11281. https://doi.org/10.3390/app112311281