Article

Feasibility of Application of Near Infrared Reflectance (NIR) Spectroscopy for the Prediction of the Chemical Composition of Traditional Sausages

by
Eleni Kasapidou
1,*,
Vasileios Papadopoulos
1 and
Paraskevi Mitlianga
2
1
Department of Agriculture, School of Agricultural Sciences, University of Western Macedonia, 53100 Florina, Greece
2
Department of Chemical Engineering, School of Engineering, University of Western Macedonia, 50100 Kozani, Greece
*
Author to whom correspondence should be addressed.
Appl. Sci. 2021, 11(23), 11282; https://doi.org/10.3390/app112311282
Submission received: 22 October 2021 / Revised: 21 November 2021 / Accepted: 26 November 2021 / Published: 29 November 2021

Abstract

:

Featured Application

A potential application is the prediction of the chemical composition of sausages with near infrared reflectance (NIR) spectroscopy devices in small scale production conditions.

Abstract

In the present study, the potential of application of near infrared reflectance (NIR) spectroscopy for the estimation of the chemical composition of traditional (village style) sausages was examined. The chemical composition (moisture, ash, protein and, fat content) was determined by standard reference methods. For the development of the calibration model, 39 samples of traditional fresh sausages were used, while for external validation, 10 samples of sausages were used. The correlation coefficients of calibration (RMSEC) and standard errors (SEC) were 0.92 and 1.58 (moisture), 0.77 and 0.18 (ash), 0.87 and 0.89 (protein) and 0.93 and 1.73 (fat). The cross-validation correlation coefficients (RMSECV) and standard errors (SECV) were 0.86 and 2.13 (moisture), 0.56 and 0.26 (ash), 0.78 and 1.17 (protein), and 0.88 and 2.17 (fat). The results of the calibration model showed that NIR spectroscopy can be applied to estimate with very good precision the fat content of traditional village-style sausages, whereas moisture and protein content can be estimated with good accuracy. The external validation confirmed the ability of NIR spectroscopy to predict the chemical composition of sausages.

1. Introduction

Traditional (village style) Greek sausages are the most commonly consumed meat products in Greece. In the past, sausages were prepared at home shortly before Christmas. Nowadays, sausages are produced throughout the year in the adjacent premises of butcher shops and sold, non-package, in bulk. Sausage ingredients such as seasonings vary between different regions influenced by culture, history, climate, and agriculture, but the production technology is the same. In general, pork meat and fat are coarsely chopped and thoroughly mixed with salt, pepper, and other seasonings, and the sausage batter is stuffed in natural casings. The sausages are partially dried and kept chilled until consumption [1].
According to the Greek Code of Foodstuffs, Beverages, and Objects of Common Use [2], as amended in 2014, traditional sausages are characterized as raw sausages, prepared only from lean meat and fat, salt and seasonings, that should be consumed only after heat processing. The sausage batter is stuffed into edible cases, and the sausages are air dried, and sometimes they are subjected to smoking. The addition of nitrites or nitrates and poultry meat is not allowed. Muscle protein content should not be lower than 12% and fat content should not be higher than 35%. The chemical composition of traditional sausages has been studied in the past [3,4,5] and the results showed significant variability even between different production batches from the same butcher shop [6]. However, Regulation 1169/2011 of the European Union [7], on the provision of food information to the consumers, does not apply to traditional sausages because they are produced in small quantities. Consequently, consumers do not have the option to choose products with improved chemical composition and nutritional value during purchase. In addition to that, the chemical composition of meat products also affects products’ eating quality [8].
Near infrared reflectance (NIR) spectroscopy is a valuable, cost-effective, and reliable tool for the estimation of various quality parameters of meat and meat products such as pH(u), color, eating quality characteristics, and chemical composition [9]. With regard to chemical composition, NIR spectroscopy has been used successfully in the industry to determine the content of the principal components (moisture, fat, and protein) in meat products [10]. However, in the vast majority of the studies, NIR spectroscopy has been used for the estimation of the chemical composition of intact or minced muscle, and in only a few studies has NIR spectroscopy has been applied for the estimation of the chemical composition of sausages that were produced in the laboratory following standard procedures commonly applied in the meat industry [11,12]. Furthermore, to the best of our knowledge, there are no studies on the applicability of NIR spectroscopy for the prediction of the composition of retail meat products produced in small quantities, such as traditional sausages that are prepared in the premises of butcher shops. Finally, the development of portable handheld NIR spectroscopy devices that will allow the in situ accurate estimations of meat and meat products’ chemical composition is considered a research priority [10,13], and it is attracting attention for application in the production of traditional products [14].
The purpose of this preliminary study was to develop a calibration model to evaluate the potential of NIR spectroscopy to predict the chemical composition of commercial samples of traditional sausages produced in small quantities in butcher shops.

2. Materials and Methods

2.1. Sampling

2.1.1. Samples for the Development of the Calibration Model

Sausage samples (39) used for the development of the calibration models were occasionally analyzed in the laboratory in the period 2016–2018. In detail, 24 samples came from the same six different butcher shops as part of another trial that monitored the variability in basic composition per production batch [6]. The remaining samples (n = 15) came from other butcher shops also located in the Region of Western Macedonia, Greece. In any case, all samples used in the study came from different production batches, independently if they were purchased from the same shop. All butcher shops produced the sausages on their premises, in accordance with the Greek legislation [15]. Samples were purchased one to two days after their production, according to information provided by the seller. The drying period following sausage production was chosen to be similar in an attempt to standardize the moisture content of the samples and take into consideration that weight loss during drying is approximately 30% [1]. The samples used in the present study were collected from the same region in order to avoid matrix differences since ingredients such as spices, condiments, and seasonings vary between different regions.

2.1.2. Samples for Validation of the Calibration Model

The calibration model was validated with ten samples of traditional sausages that were purchased from different butcher shops also located in the Region of Western Macedonia in June 2018, after one or two days from their production. Samples from these shops were not used in the development of the calibration model, to achieve an independent set of data for the validation [16]. The ratio between calibration samples and validation samples was approximately 4:1. The same analogy between calibration samples and validation samples was reported by Ortiz-Somovilla et al. [11] for pork sausages whereas in the study of Ritthiruangdej et al. [17] the ratio between calibration samples and validation samples was 3:1. Additionally, according to Anderson [18] at least ten samples are required for external validation of a calibration model for meat and meat products.

2.2. Preparation of Samples for Proximate Analysis

Analyses were performed in samples of 1 kg each, consisting of 2–4 sausages, to ensure product homogeneity because the sausage batter often is mixed manually. Sausages were minced in a domestic type food chopper, taking care to produce a uniform finely ground sample to avoid physical variation between the samples reducing calibration error sources [19] and improve NIR spectroscopy predictability [20]. The homogenized samples were stored in plastic containers with tight-fitting lids to protect them from moisture interchange. Care was taken to minimize the air gap between the sample and the lid of the container to avoid sample deterioration during storage at 0 °C [21]. The homogenized sausage samples were thoroughly mixed by hand, with a spatula, before the determination of the chemical composition either by the standard reference methods or by NIR spectroscopy.

2.3. Proximate Analysis (Reference Methods)

The chemical composition of the sausages was determined according to the recommended standard methods described in AOAC [22]. Moisture content was determined by the 950.46 method after drying of the homogenized sample in a convection chamber (ED-115, Binder GmbH, Tuttlingen, Germany) at 102 °C until a constant weight was obtained. Dishes were placed in a desiccator and weighed when they obtained room temperature. Moisture was reported as weight loss from pre- and post-drying weights. Ash content was determined using the 920.153 method. Samples were incinerated at 550 °C for 12 h in a muffle furnace (model LM 412.07, Linn High Therm GmbH, Eschenfelden, Germany) until light grey ash was obtained. Ashing dishes were placed in a desiccator and weighted after reaching room temperature. Ash content was calculated by weight loss before and after incineration. Protein content was determined according to the method 928.08 by using nitrogen digestion (Turbotherm type TT/12M) and distillation (Vapodest type 40) apparatuses (Gerhardt Apparate GmbH & Co. KG, Königswinter, Germany) and converted to crude protein by multiplying the nitrogen content by 6.25. Fat content was determined according to the 991.36 method by extraction with petroleum ether using a Soxtherm/Multistat type SE-416 macro automated system (Gerhardt Apparate GmbH & Co. KG, Königswinter, Germany). Fat content was calculated as the proportional difference between the sample’s weight before and after solvent extraction. All analyses were conducted in duplicate, and they were completed within one week following sample collection. Summations of the constituents falling within the range of 97–103% of the analytical sample weight were generally considered as acceptable [23].

2.4. NIR Spectroscopy

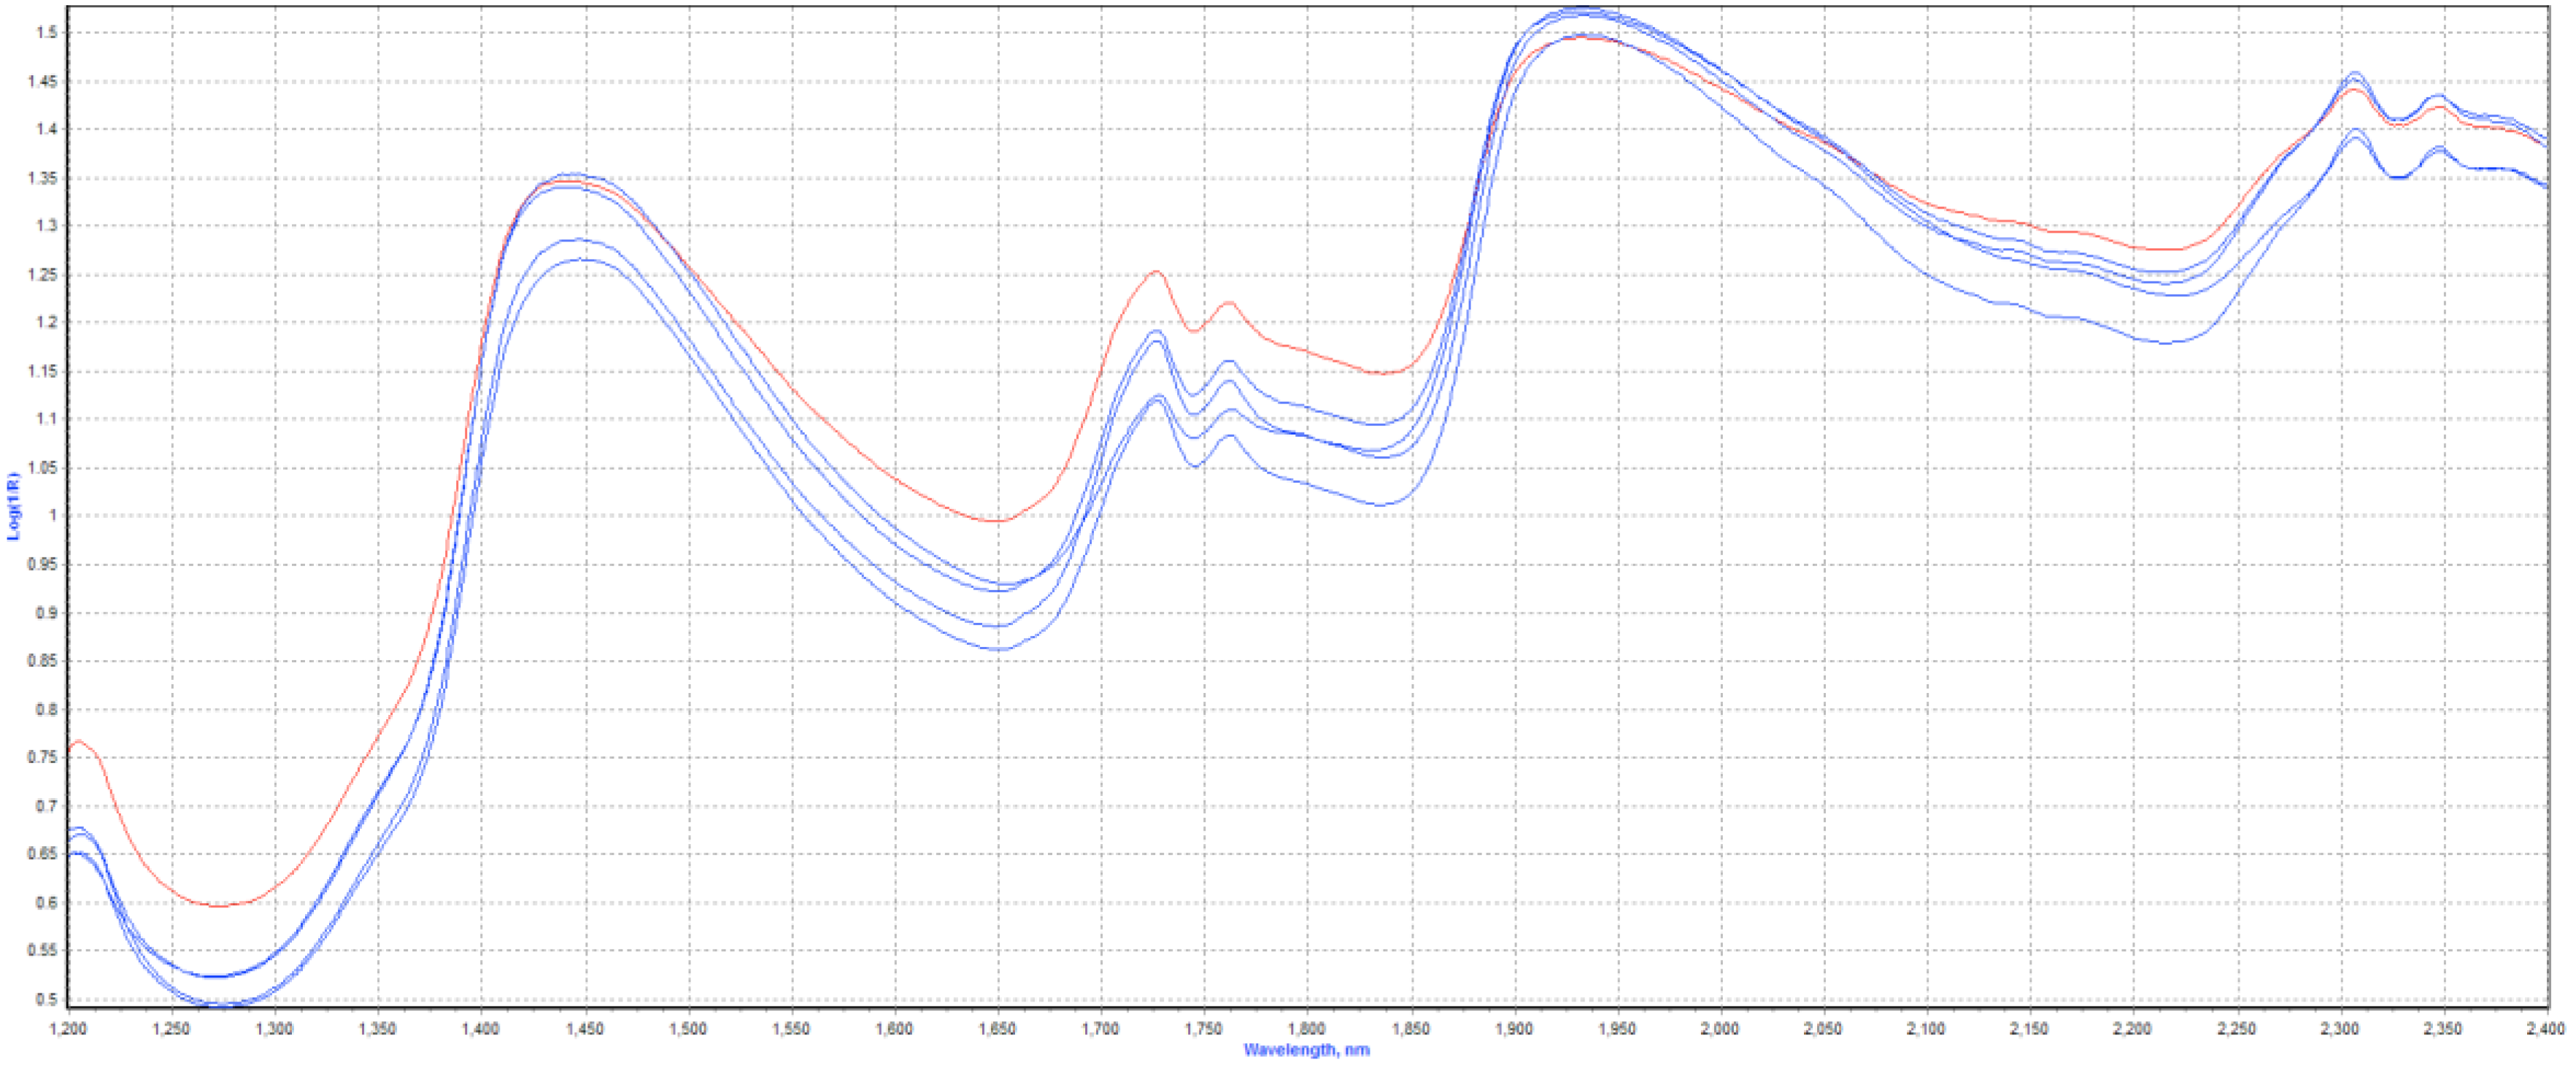
2.4.1. Spectra Acquisition

The homogenized sausage samples were subjected to NIR spectroscopy using a Spectra Star 2400-D spectrophotometer (Unity Scientific, Milford, MA, USA). The samples were placed in a rotating circular sample cup, set in stepped mode at 24 scans, and scanned at 2 nm intervals over the 1200–2400 nm spectral range. The spectrum was automatically recorded as log (1/Transmittance). The samples were prepared in duplicate, and two spectra were collected per individual sample, i.e., a total of four spectra per sausage.

2.4.2. Spectra Analysis

The calibration models for each parameter (moisture, ash, protein, and fat contents) were developed using UcalTM software suite (version 3.0.0.23; Unity Scientific, Brookfield, CT, USA) which supports the Partial Least Squares PLS optimized chemometric models and by applying “leave-one-out” cross-validation. Before the development of the calibration models, the chemical composition data, obtained by the application of the reference methods, were checked to exclude any erroneous results. The calibration data set was screened for anomalous spectra, and the outliers were excluded from the calibration process. Standard calibration error (SEC), root mean square standard calibration error (RMSEC), standard cross-validation error (SECV) and root mean square cross-validation error (RMSECV) were calculated for each examined variable.

2.4.3. Regression Analysis

Linear regression analysis of reference values and predicted values for each analyzed component was performed using Microsoft Excel for Office 365 software (version 2107). Pearson correlation coefficients for the reference values and predicted values for each analyzed component were performed using SPSS software (version 26.0).

3. Results and Discussion

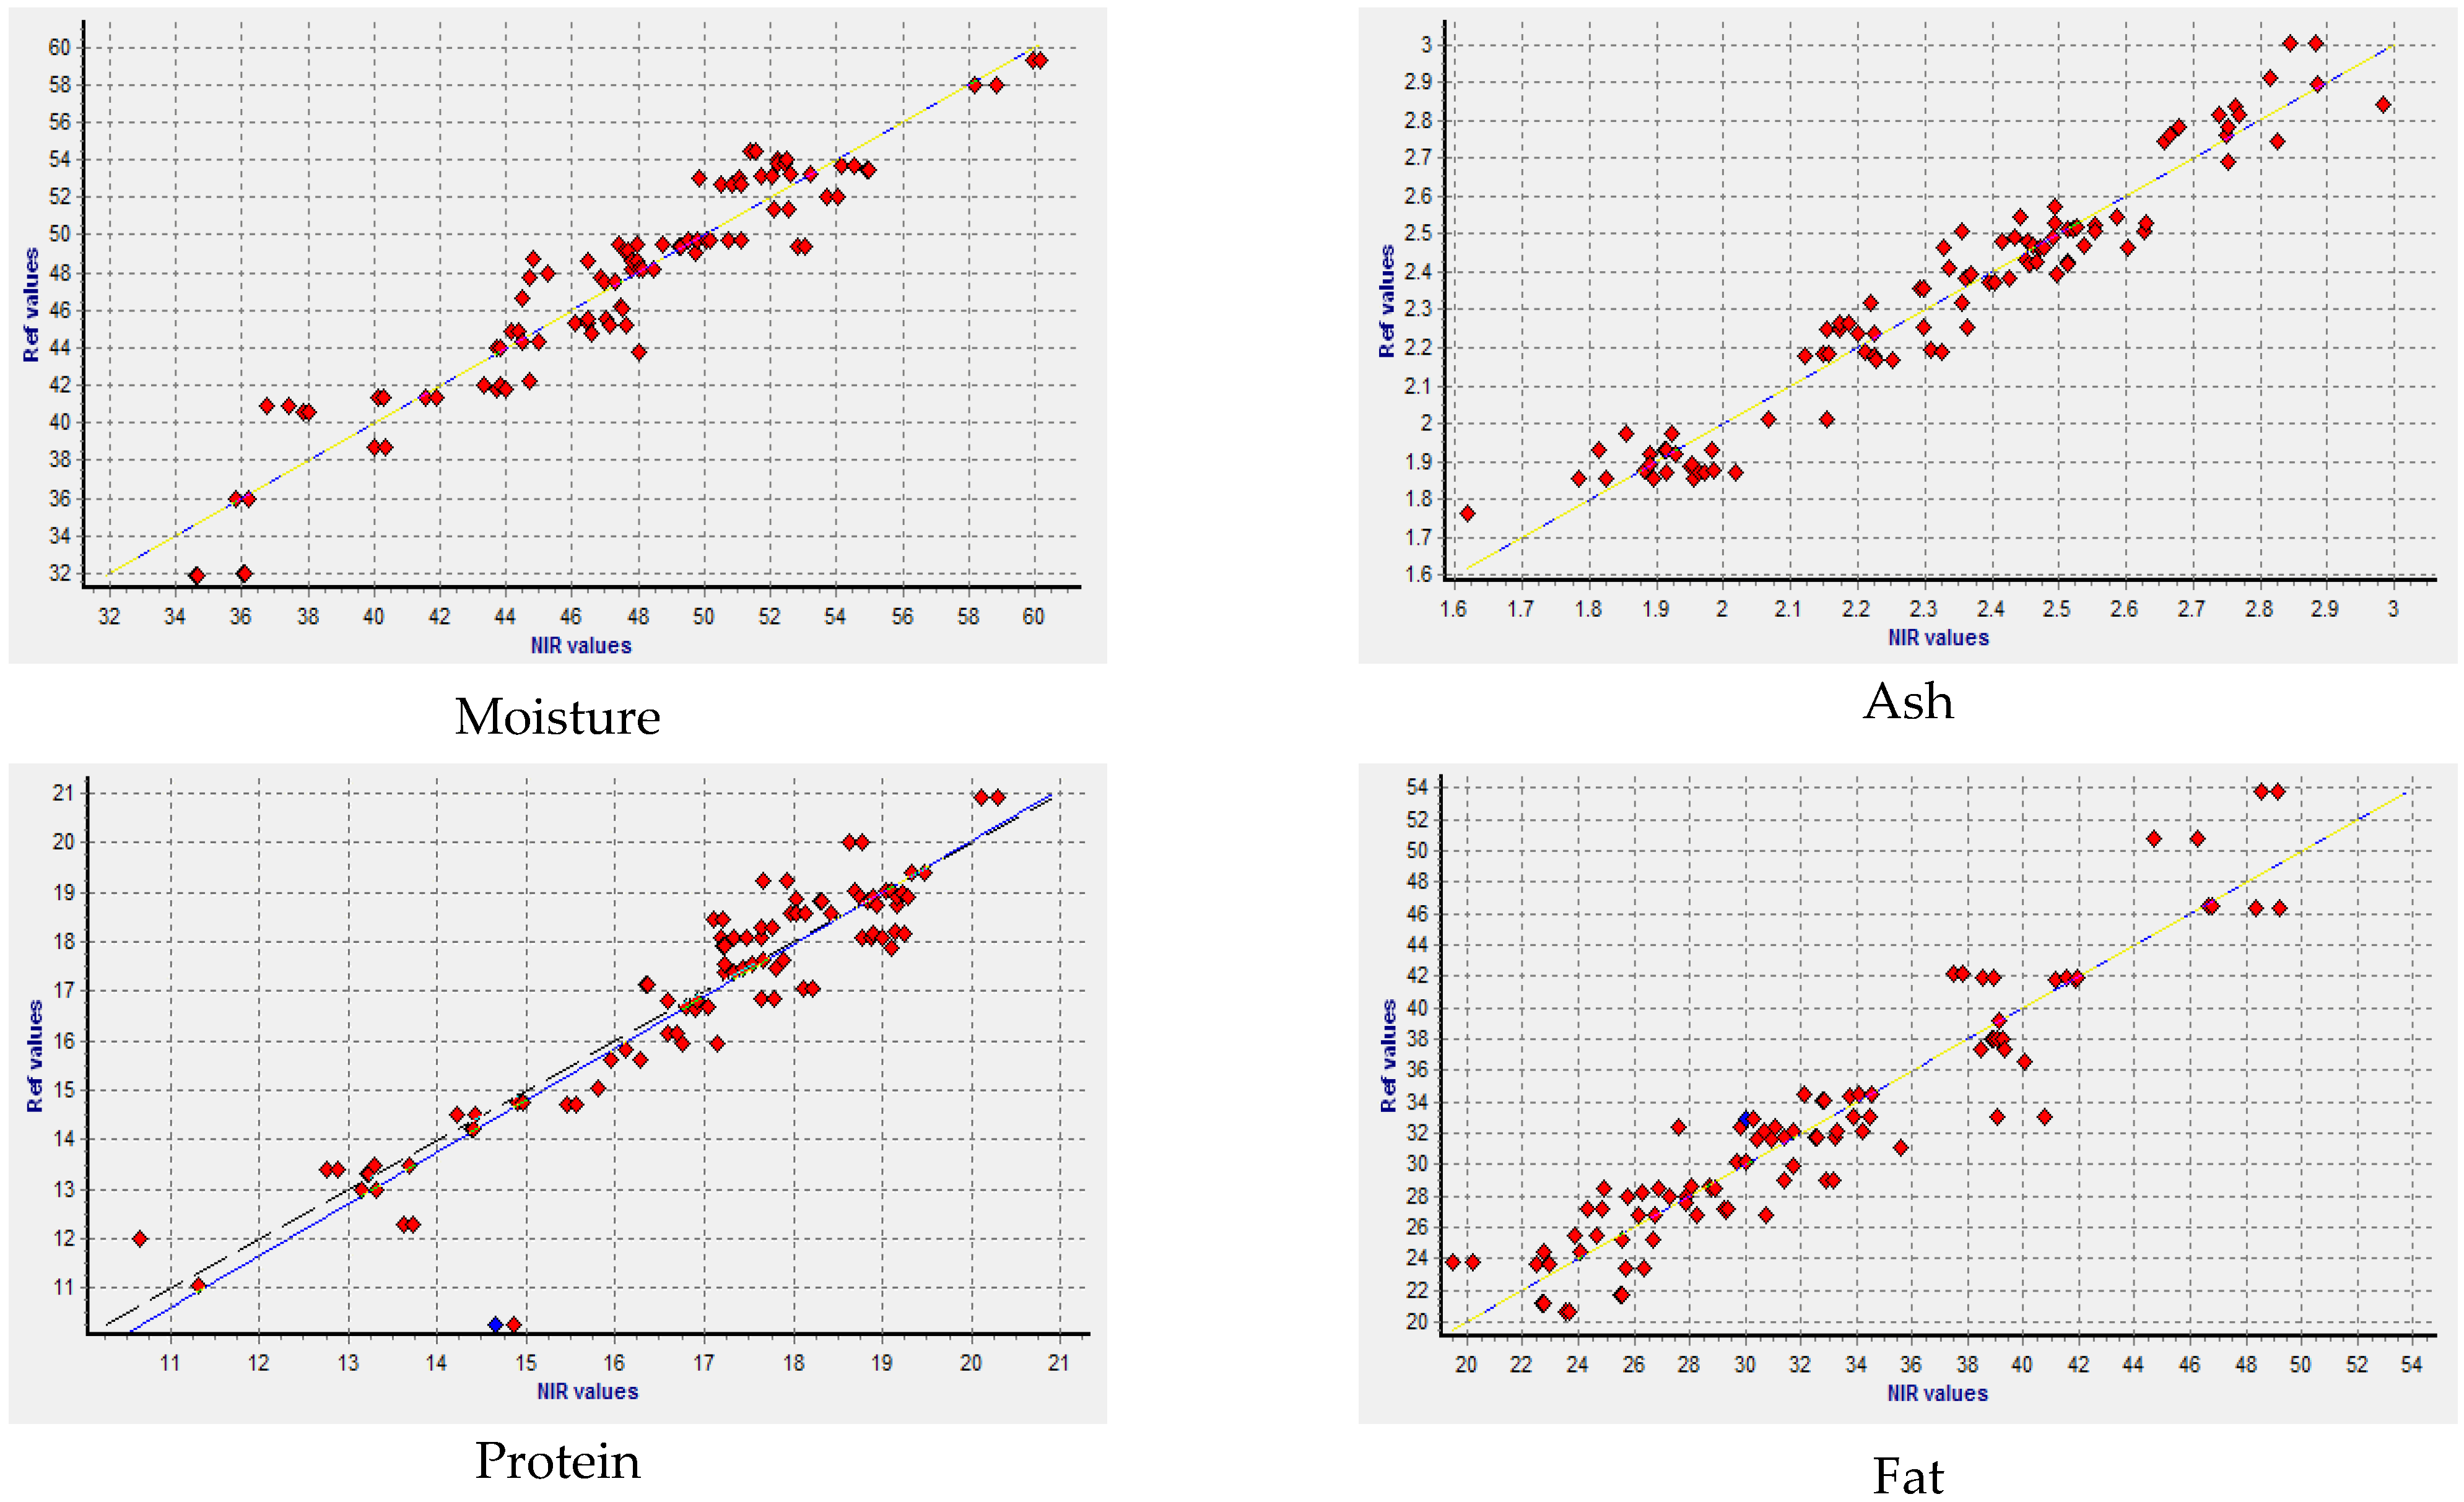
3.1. Development of the Calibration Model

Table 1 presents the chemical composition (mean, standard deviation, and range of values) of the traditional sausages, as determined by application of the reference methods and by application of NIR spectroscopy for the calibration set of samples. The basic composition was similar to the one reported in the market surveys of Papadima et al. [3], Ambrosiadis et al. [4] and Konstantinidis et al. [5].
Moisture content varied to almost 30% between samples even though sausages were purchased one to two days after their production in an attempt to standardize their moisture content. The differences are related to the fact that some producers use drying chambers whereas others prefer to air dry the sausages. Variations in ash content are related to differences in spices, condiments, and seasonings used by the producers in their attempt to create product differentiation. The average protein content was higher than 12% and in accordance with the requirements of the Greek Code of Foodstuffs, Beverages, and Objects of Common Use [2]. There was one sample that the protein content was lower than 12%. Finally, the average fat content did not exceed the highest permitted value of 35%, by the Greek Code of Foodstuffs, Beverages, and Objects of Common Use [2]. However, in 23% of the examined samples, this value was exceeded. The findings in relation to protein and fat content enhance the need for in situ monitoring of the chemical composition of the sausage batter to enable compliance with the legislation.
The contents of all components were very variable, but according to González-Mohino et al. [14], this is expectable due to the limited degree of mechanization and control of the final product, causing a higher degree of heterogeneity. This finding is corroborated by the findings of the study of Parasolglou et al. [6] that reported batch variability in the range of 2.40–18.05%, 7.55–17.66%, 2.34–11.11%, and 9.52–26.71% for moisture, ash, protein and fat contents respectively, in sausages produced by the same butcher shop.
Typical spectra of traditional sausages with NIR spectroscopy, are presented in Figure 1. The ability of NIR spectroscopy to estimate the chemical composition of traditional sausages is presented in Table 2.
The calibration correlation coefficients (RMSEC) in all components were greater than 0.80, indicating that NIR spectroscopy can reliably estimate the chemical composition of meat and meat products [24]. The highest correlation coefficient for the calibration (RMSEC) was observed for the prediction of the fat content and the lowest to the protein content. Ortiz-Somovilla et al. [11] and Gaitán-Jurado et al. [12] observed comparable results for pork sausages. As reported in the review studies of Prieto et al. [10,25] and Prevolnik et al. [24], ash content is not frequently determined in trials examining the applicability of NIR spectroscopy for the prediction of the chemical composition of meat and meat products. The ash and protein cross-validation correlation coefficients (RMSECV) were less than 0.80, suggesting uncertainty in estimating the contents of the above components. Figure 2 presents the prediction plots for moisture, ash, protein, and fat contents for the calibration set of sausages. The majority of data points for all measured components were clustered along the regression lines.
The accuracy of the estimation is defined as good when the cross-validation correlation coefficient (RMSECV) lies in the range between 0.70–0.89, whereas coefficients higher than 0.90 are related to an excellent prediction of the chemical composition [26]. Values of both standard calibration errors (SEC) and standard cross-validation errors (SECV), for all examined variables, were within the range of those reported in the bibliography [10,24,25,27] on the use of NIR spectroscopy to assess the chemical composition of meat and meat products. The highest standard calibration (SEC) and cross-validation (SECV) errors were observed in the estimation of the moisture and fat contents, and the lowest values were observed in the estimation of the protein content. Reference data showed that the range was wider for moisture and fat (31.87–59.94 and 20.72–53.76 respectively) contents and narrower for protein (11.08–22.41) content, and this fact could account for differences in the accuracy of the estimation since variability can positively affect the NIR spectroscopy predictability [28]. The limited ability of NIR spectroscopy to estimate the protein content of traditional sausages was also confirmed in the studies by Prieto et al. [10,25] and Alomar et al. [29] and is due to the relatively small range of values for the protein content that hampers the detection of differences between samples. NIR spectroscopy is not usually applied for the estimation of the ash content in meat and meat products because inorganic compounds, in ionic forms, show no absorption in the near infrared spectrum and, therefore, such a calibration model would have minimal use [10,30]. Furthermore, Ritthiruangdej et al. [17] also reported poor accuracy in the prediction of ash content in Thai steamed pork sausages. The latter workers related the poor accuracy to very small range of ash content. Collell et al. [31] reported lower accuracy in the prediction of NaCl content, a major component of ash, in fermented pork sausages.
Due to endogenous variances in the meat and fat used for the production of sausages, a considerable number of samples is required for the development of an adequate calibration model. These variations are related to the type of meat, which includes different animal species and anatomical parts of the carcass [10]. However, Prevolnik et al. [24] reported that between 30 and 150 samples are necessary to construct a calibration model with sufficient range for the individual components. The samples used for the development of the model must have significant variability in their chemical composition because high variability results in a robust calibration model [18]. This is feasible to a certain extent since retail samples such as the ones used in the present study should comply with the various regulations for food production and meet consumer criteria for their acceptability.
Finally, in foods produced from muscle tissue (meat and fish), the primary source of variability arises from their compact and heterogeneous nature, making it difficult to collect high-quality spectra. Scattering effects are primarily related to textural inhomogeneity due to variations in protein fiber arrangements and to the presence of intramuscular fat and connective tissue [30].
In this study, 39 samples were used for the development of the calibration model and many of these samples were produced in the same butcher shops. However, the great variability between production batches [6] allowed the use of these samples in the development of the calibration model. Additionally, the calibration model was initially constructed with 33 samples, as reported in the study of Tzemou et al. [32]. The additional 6 samples, used in the construction of this model were purchased from completely different butcher shops than the ones used for the first calibration model. It was observed that there were little differences in the calibration statistics between the two models indicating that the possibility to further improve the model was limited. This finding is attributed to the fact that the same level of variation was maintained. In any case, analysis of a greater number of samples results in better calibration statistics. However, the acceptable level of accuracy defines the number of analyzed samples since it is also associated with increased analytical costs.

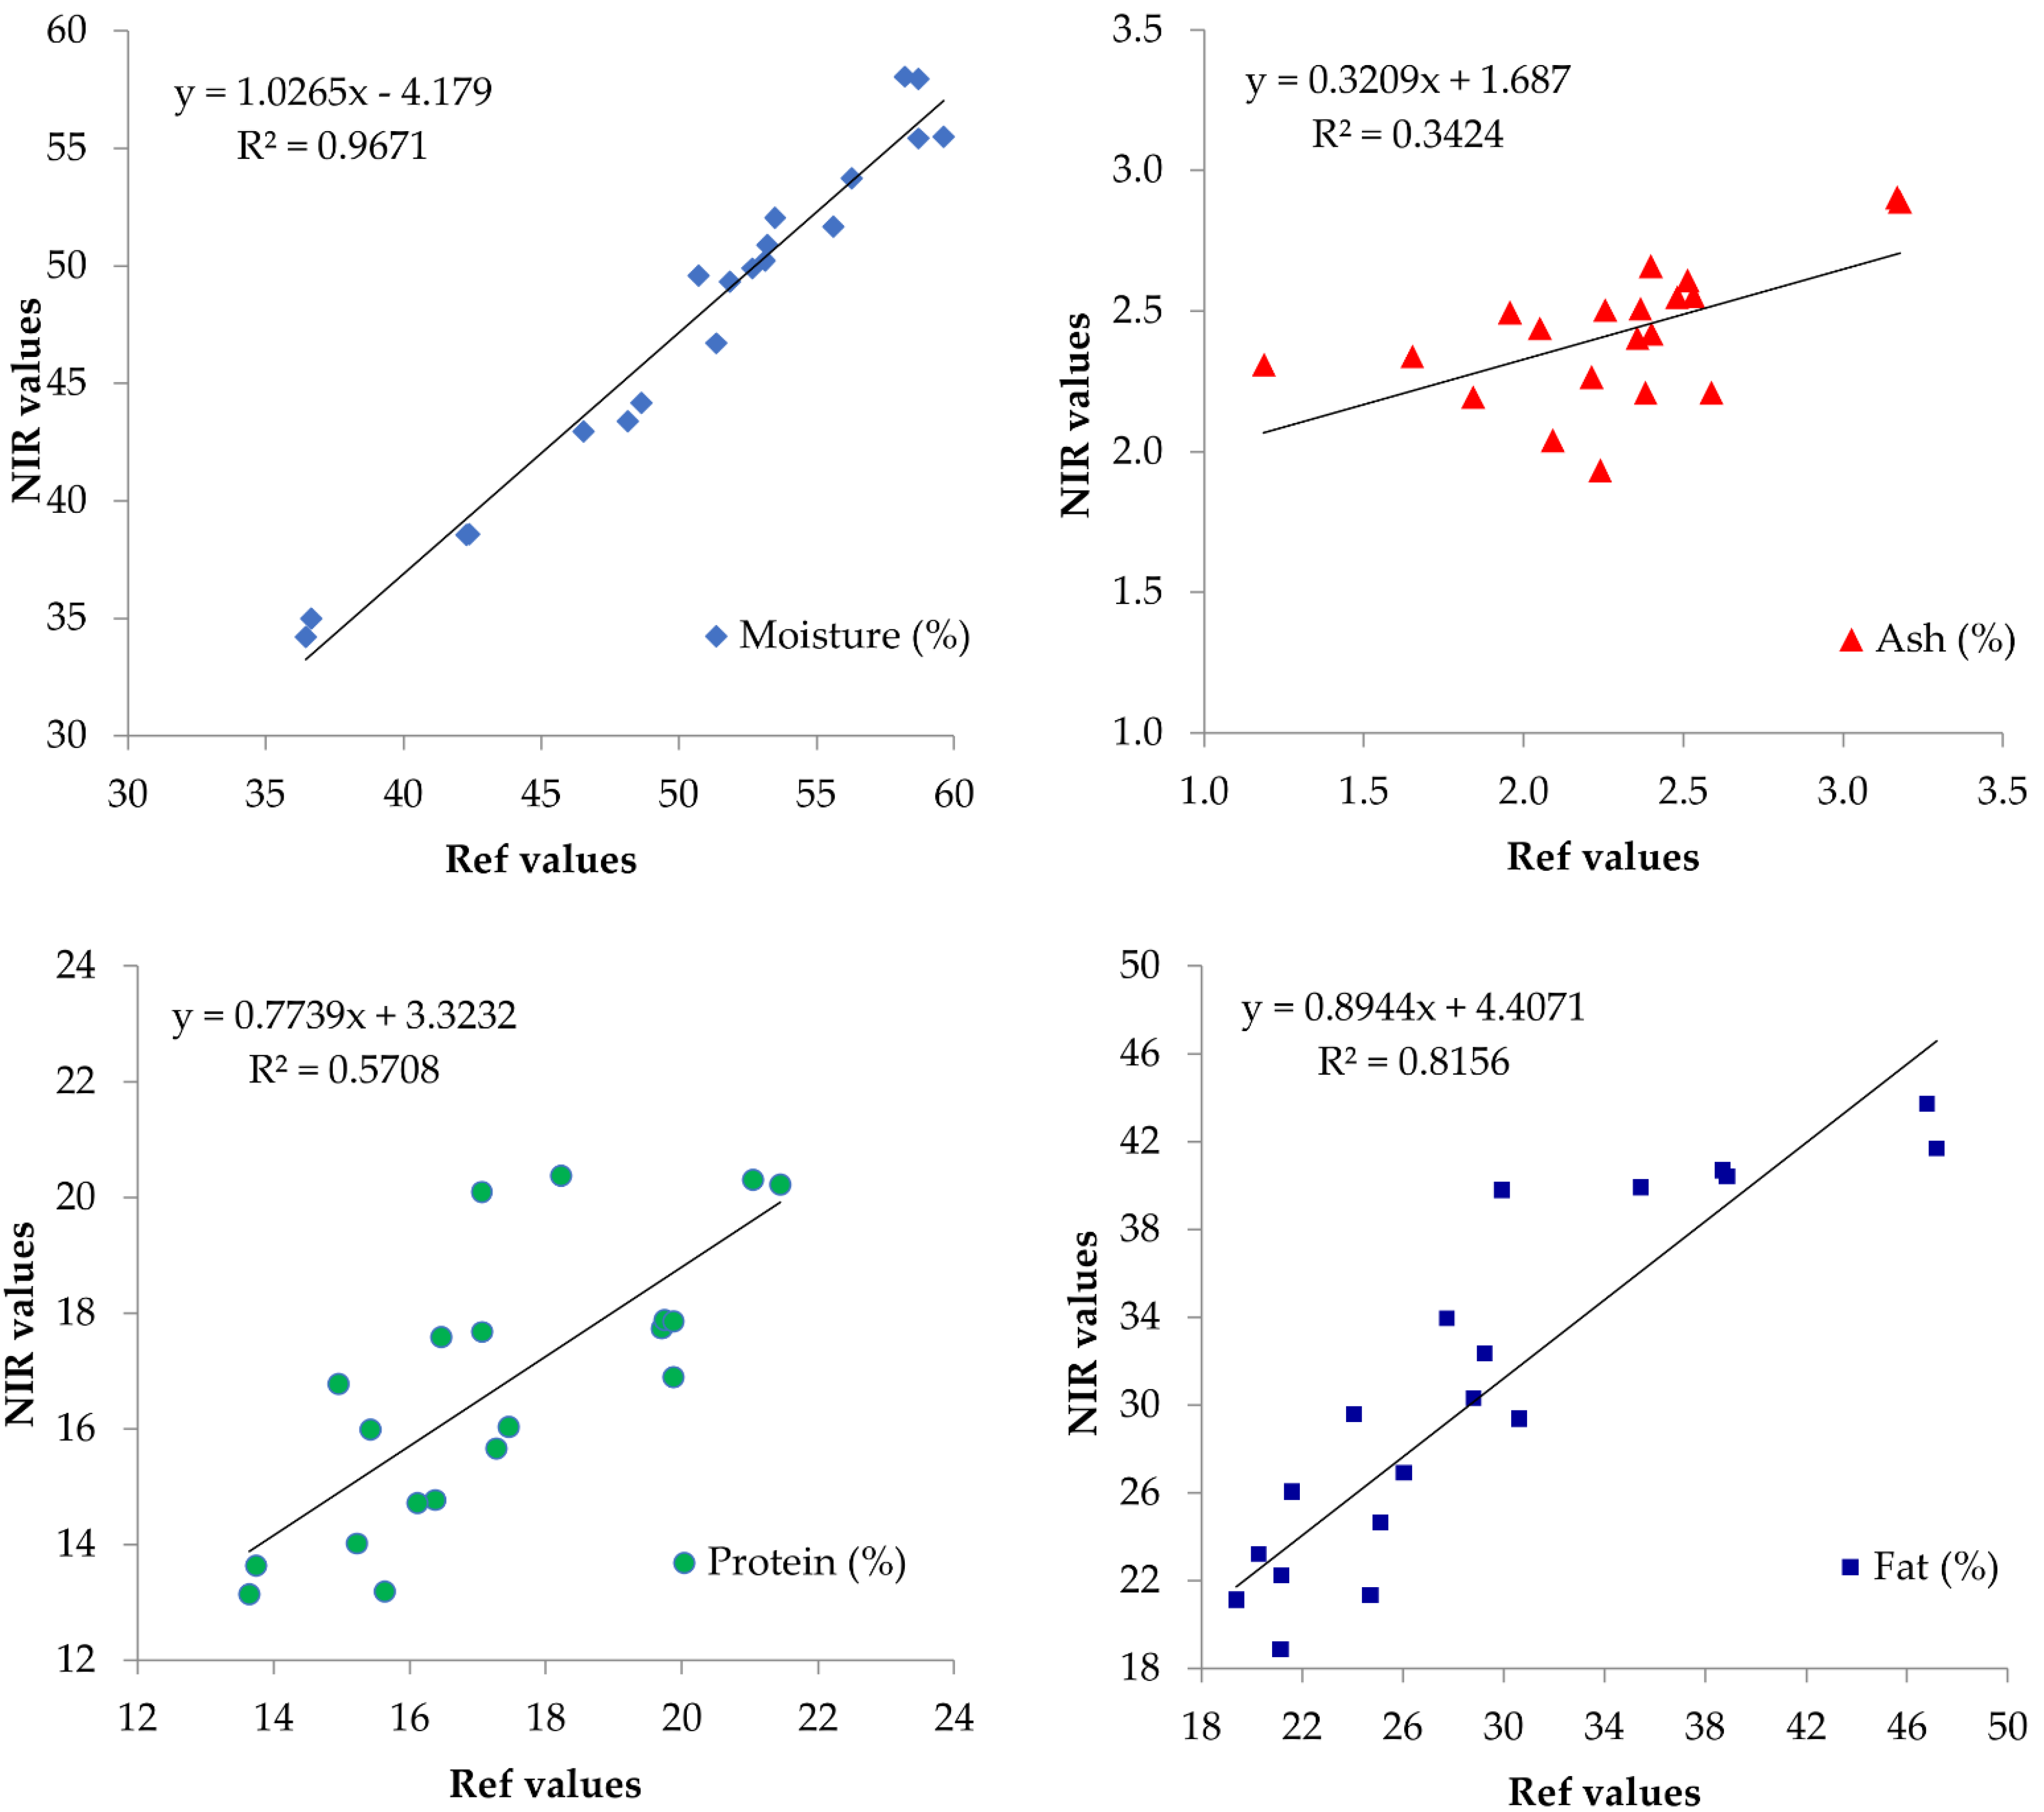
3.2. Validation of the Calibration Model

Table 3 shows the chemical composition (mean, standard deviation, and range of values) of traditional sausages, according to the reference methods and NIR spectroscopy, for the validation set of samples. The composition was also very variable and similar to the composition of the samples used for the development of the calibration model. With regard to fat content, failure to comply with the legislation was also observed in 20% of the samples where the content was higher than 35%.
The highest deviation between the standard reference methods values and the NIR spectroscopy values was observed in the moisture content, and this can be attributed to changes occurring during the time elapsing between the two types of analyses. Whereas in the present study, the homogenized sausage samples’ storage period did not exceed one week, at laboratory conditions, for routine analysis, changes in the moisture content during storage are dependent on the laboratory capacity to process the analyses and available equipment for sample storage such vacuum packaging. Thus, changes in the moisture content during analyses cannot be excluded.
Concerning nutrients such as protein and fat, whose content is declared in food labels, deviations in their contents fell within the allowances (tolerance) for variation between nutrient values declared on a label and values established by the monitoring authorities. The limits of permissible deviations are ±20% when either the protein or the fat content ranges from 10–40 g/100 g of product [33]. In the present study, NIR spectroscopy values and reference methods values deviated approximately ±3% for protein content and approximately −5% to 10% for fat content. It is also noted that NIR spectroscopy was successful in detecting the samples that failed to comply with the legislation with regard to the fat content. In other words, determination of the chemical composition of traditional sausages with NIR spectroscopy will not significantly differ from the chemical composition determined with standard reference methods, enabling the application of NIR spectroscopy for fast routine determination of the sausage composition.
Regression values for measured (Ref) and estimated (NIR) values for moisture, ash, protein, and fat content of traditional sausages used for the external validation are presented in Figure 3. The highest R2 (0.9671) value was observed between the reference values and the NIR values for moisture content, whereas the lowest R2 value was observed for ash content (0.3424). There was a good agreement between reference values and NIR values for fat content (0.8156), whereas an average agreement was found between reference values and NIR values for protein content (0.5708).
Table 4 shows the Pearson correlation coefficients between the measured and the estimated (NIR) values for moisture, ash, protein, and fat contents. Significant positive correlations (p < 0.001–0.01) were observed for all examined parameters. The highest coefficient is observed for moisture content, followed by the coefficients for fat and protein contents.
It is noted that this calibration model is valid when the samples’ characteristics are the same as those used in the external validation. Therefore, if there are changes in the degree of drying or in the regulations for either fat or protein content, the application of the calibration model may lead to invalid results. However, it is also worth reporting that the main advantage for the application of NIR spectroscopy in the estimation of the composition of food products is the fact the database can be constantly expanded with the addition of the compositional data from new samples, leading to the development of a new calibration model that incorporates changes in the product composition.

4. Conclusions

The present study results showed that NIR spectroscopy can be applied as a screening technique when a high but not an absolute level of accuracy is required. NIR spectroscopy can estimate moisture and fat contents of traditional sausages with high accuracy, whereas prediction of the protein content can also be achieved with reasonable accuracy. However, the development of a model for the estimation of the chemical composition of sausages, representing variations in sausage ingredients and/or production conditions, requires analysis of a greater number of samples. Future research should focus on developing calibration models for the next generation of low-cost, simple-operation portable NIR spectroscopy instruments that would help butcher shop owners produce healthier sausages that are in compliance with the specifications of the Greek Food Legislation.

Author Contributions

Conceptualization, E.K. and P.M.; methodology, P.M.; investigation E.K. and V.P.; formal analysis, E.K.; resources, P.M.; data curation, E.K. and V.P.; writing—original draft preparation, E.K.; writing—review and editing, E.K. and P.M. All authors have read and agreed to the published version of the manuscript.

Funding

This research received no external funding.

Institutional Review Board Statement

Not applicable.

Informed Consent Statement

Not applicable.

Data Availability Statement

Data is contained within the article.

Acknowledgments

The authors would like to thank the company Unity, Ltd., Cholargos, Athens, Greece, for the development of the calibration model.

Conflicts of Interest

The authors declare no conflict of interest.

References

  1. Papagianni, M.; Ambrosiadis, I.; Filiousis, G. Mould growth on traditional Greek sausages and penicillin production by Penicillium isolates. Meat Sci. 2007, 76, 653–657. [Google Scholar] [CrossRef] [PubMed]
  2. Greek state. Code of Foodstuffs, Beverages and Objects of Common Use—Part A: Foodstuffs and beverages (Classification, specifications and definitions of meat products and meat preparations). Gov. Gaz 2014, 91. (In Greek) [Google Scholar]
  3. Papadima, S.N.; Arvanitoyannis, I.; Bloukas, J.G.; Fournitzis, G.C. Chemometric model for describing Greek traditional sausages. Meat Sci. 1999, 51, 271–277. [Google Scholar] [CrossRef]
  4. Ambrosiadis, J.; Soultos, N.; Abrahim, A.; Bloukas, J.G. Physicochemical, microbiological and sensory attributes for the characterization of Greek traditional sausages. Meat Sci. 2004, 66, 279–287. [Google Scholar] [CrossRef]
  5. Konstandinidis, K.; Kasapidou, E.; Govaris, A.; Mitlianga, P. Evaluation of the chemical composition and the nutritional quality of traditional (village) style Greek Sausages. In Proceedings of the 59th International Congress of Meat Science and Technology, Izmir, Turkey, 18–23 August 2013; p. 129. [Google Scholar]
  6. Parasoglou, V.-K.; Tzemou, M.; Mitlianga, P.; Kasapidou, E. Variation in the chemical composition of traditional sausages per production batch. In Proceedings of the 4th Panhellenic Conference of Production Animals and Food Hygiene, Volos, Greece, 12–14 May 2017. [Google Scholar]
  7. Regulation (EU) No 1169/2011 of the European Parliament and of the Council of 25 October 2011 on the Provision of Food Information to Consumers, Amending Regulations (EC) No 1924/2006 and (EC) No 1925/2006 of the European Parliament and of the Council, and Repealing Commission Directive 87/250/EEC, Council Directive 90/496/EEC, Commission Directive 1999/10/EC, Directive 2000/13/EC of the European Parliament and of the Council, Commission Directives 2002/67/EC and 2008/5/EC and Commission Regulation (EC) No 608/2004. Available online: https://eur-lex.europa.eu/eli/reg/2011/1169/2018-01-01 (accessed on 25 January 2021).
  8. Sheard, P.R.; Hope, E.; Hughes, S.I.; Baker, A.; Nute, G.R. Eating quality of UK-style sausages varying in price, meat content, fat level and salt content. Meat Sci. 2010, 85, 40–46. [Google Scholar] [CrossRef]
  9. Dixit, Y.; Casado-Gavalda, M.P.; Cama-Moncunill, R.; Cama-Moncunill, X.; Markiewicz-Keszycka, M.; Cullen, P.J.; Sullivan, C. Developments and challenges in online NIR spectroscopy for meat processing. Compr. Rev. Food Sci. Food Saf. 2017, 16, 1172–1187. [Google Scholar] [CrossRef]
  10. Prieto, N.; Roehe, R.; Lavín, P.; Batten, G.; Andrés, S. Application of near infrared reflectance spectroscopy to predict meat and meat products quality: A review. Meat Sci. 2009, 83, 175–186. [Google Scholar] [CrossRef] [PubMed]
  11. Ortiz-Somovilla, V.; España-España, F.; Gaitán-Jurado, A.J.; Pérez-Aparicio, J.; de Pedro-Sanz, E.J. Proximate analysis of homogenized and minced mass of pork sausages by NIRS. Food Chem. 2007, 101, 1031–1040. [Google Scholar] [CrossRef]
  12. Gaitán-Jurado, A.J.; Ortiz-Somovilla, V.; España-España, F.; Pérez-Aparicio, J.; De Pedro-Sanz, E.J. Quantitative analysis of pork dry-cured sausages to quality control by NIR spectroscopy. Meat Sci. 2008, 78, 391–399. [Google Scholar] [CrossRef]
  13. Zamora-Rojas, E.; Pérez-Marín, D.; de Pedro-Sanz, E.; Guerrero-Ginel, J.E.; Garrido-Varo, A. Handheld NIRS analysis for routine meat quality control: Database transfer from at-line instruments. Chemom. Intell. Lab. Syst. 2012, 114, 30–35. [Google Scholar] [CrossRef]
  14. González-Mohino, A.; Pérez-Palacios, T.; Antequera, T.; Ruiz-Carrascal, J.; Olegario, L.S.; Grassi, S. Monitoring the Processing of Dry Fermented Sausages with a Portable NIRS Device. Foods 2020, 9, 1294. [Google Scholar] [CrossRef] [PubMed]
  15. Greek state. Regulation of operation subjects for the production of meat products in the premises of butcher shops. Gov. Gaz 2014. (In Greek) [Google Scholar]
  16. Harrington, P.D.B. Multiple versus single set validation of multivariate models to avoid mistakes. Crit. Rev. Anal. Chem. 2018, 48, 33–46. [Google Scholar] [CrossRef] [PubMed]
  17. Ritthiruangdej, P.; Ritthiron, R.; Shinzawa, H.; Ozaki, Y. Non-destructive and rapid analysis of chemical compositions in thai steamed pork sausages by near-infrared spectroscopy. Food Chem. 2011, 129, 684–692. [Google Scholar] [CrossRef] [PubMed]
  18. Anderson, S. Determination of fat, moisture, and protein in meat and meat products by using the FOSS FoodScan near-infrared spectrophotometer with FOSS artificial neural network calibration model and associated database: Collaborative study. J. AOAC Int. 2007, 90, 1073–1083. [Google Scholar] [CrossRef]
  19. Workman, J.J. NIR spectroscopy calibration basics. In Handbook of Near-Infrared Analysis, 3rd ed.; Burns, D.A., Ciurczak, E.W., Eds.; CRC Press: Boca Raton, FL, USA, 2008; pp. 123–150. [Google Scholar]
  20. Cozzolino, D.; Murray, I. Effect of sample presentation and animal muscle species on the analysis of meat by near infrared reflectance spectroscopy. J. Near Infrared Spectrosc. 2002, 10, 37–44. [Google Scholar] [CrossRef]
  21. Williams, P. Sampling, sample preparation, and sample selection. In Handbook of Near-Infrared Analysis, 3rd ed.; Burns, D.A., Ciurczak, E.W., Eds.; CRC Press: Boca Raton, FL, USA, 2008; pp. 267–295. [Google Scholar]
  22. Association of Analytical Communities International. Official Methods of Analysis of AOAC International, 17th ed.; AOAC International: Gaithersburg, MD, USA, 2003. [Google Scholar]
  23. Greenfield, H.; Southgate, D.A.T. Food Composition Data—Production, Management and Use, 2nd ed.; Food and Agriculture Organization of the United Nations: Rome, Italy, 2003. [Google Scholar]
  24. Prevolnik, M.; Candek-Potokar, M.; Skorjanc, D. Ability of NIR spectroscopy to predict meat chemical composition and quality: A review. Czech J. Anim. Sci. 2004, 49, 500–510. [Google Scholar] [CrossRef]
  25. Prieto, N.; Pawluczyk, O.; Dugan, M.E.R.; Aalhus, J.L. A review of the principles and applications of near-infrared spectroscopy to characterize meat, fat, and meat products. Appl. Spectrosc. 2017, 71, 1403–1426. [Google Scholar] [CrossRef] [Green Version]
  26. Shenk, J.S.; Westerhaus, M.O. Calibration the ISI Way. In Near Infrared Spectroscopy: The Future Waves; Davies, A.M.C., Williams, P.C., Eds.; NIR Publications: Chichester, UK, 1996; pp. 198–202. [Google Scholar]
  27. Porep, J.U.; Kammerer, D.R.; Carle, R. On-line application of near infrared (NIR) spectroscopy in food production. Trends Food Sci. Technol. 2015, 46, 211–230. [Google Scholar] [CrossRef]
  28. Su, H.; Sha, K.; Zhang, L.; Zhang, Q.; Xu, Y.; Zhang, R.; Li, H.; Sun, B. Development of near infrared reflectance spectroscopy to predict chemical composition with a wide range of variability in beef. Meat Sci. 2014, 98, 110–114. [Google Scholar] [CrossRef]
  29. Alomar, D.; Gallo, C.; Castaneda, M.; Fuchslocher, R. Chemical and discriminant analysis of bovine meat by near infrared reflectance spectroscopy (NIRS). Meat Sci. 2003, 63, 441–450. [Google Scholar] [CrossRef]
  30. Weeranantanaphan, J.; Downey, G.; Allen, P.; Sun, D.W. A review of near infrared spectroscopy in muscle food analysis: 2005–2010. J. Near Infrared Spectrosc. 2011, 19, 61–104. [Google Scholar] [CrossRef]
  31. Collell, C.; Gou, P.; Picouet, P.; Arnau, J.; Comaposada, J. Feasibility of near-infrared spectroscopy to predict aw and moisture and NaCl contents of fermented pork sausages. Meat Sci. 2010, 85, 325–330. [Google Scholar] [CrossRef] [PubMed]
  32. Tzemou, M.; Parasoglou, V.K.; Ioannidou, T.; Papadopoulos, V.; Mitlianga, P.; Kasapidou, E. Prediction of chemical composition of Greek traditional sausages by near-infrared reflectance spectroscopy. In Proceedings of the 3rd IMEKO Foods Conference: Metrology Promoting Harmonization and Standardization in Food and Nutrition, Thessaloniki, Greece, 1–4 October 2017; P27. pp. 236–239. [Google Scholar]
  33. European Commission. Guidance Document for Competent Authorities for the Control of Compliance with EU Legislation on: Regulation (EU) No 1169/2011 of the European Parliament and of the Council of 25 October 2011 on the Provision of Food Information to Consumers, Amending Regulations (EC) No 1924/2006 and (EC) No 1925/2006 of the European Parliament and of the Council, and Repealing Commission Directive 87/250/EEC, Council Directive 90/496/EEC, Commission Directive 1999/10/EC, Directive 2000/13/EC of the European Parliament and of the Council, Commission Directives 2002/67/EC and 2008/5/EC and Commission Regulation (EC) No 608/2004 and Council Directive 90/496/EEC of 24 September 1990 on Nutrition Labelling of Foodstuffs and Directive 2002/46/EC of the European Parliament and of the Council of 10 June 2002 on the Approximation of the Laws of the Member States Relating to Food Supplements with Regard to the Setting of Tolerances for Nutrient Values Declared on a Label. 2012. Available online: https://ec.europa.eu/food/sites/food/files/safety/docs/labelling_nutrition-vitamins_minerals-guidance_tolerances_1212_en.pdf (accessed on 10 February 2021).
Figure 1. Near infrared spectra of traditional sausages.
Applsci 11 11282 g001
Figure 2. Plots for measured (Ref) versus estimated (NIR) values for moisture, ash, protein, and fat content of traditional sausages. Dashed lines represent the reference lines for the expected behavior. Solid lines are the actual regression lines.
Applsci 11 11282 g002
Figure 3. Regression values for measured (Ref) and estimated (NIR) values for moisture, ash, protein, and fat content of traditional sausages used for the external validation.
Applsci 11 11282 g003
Table 1. Chemical composition according to the reference measurements and NIR spectroscopy for the calibration set of samples (n = 39).
ParameterMean ValuesStandard DeviationRange
Reference Methods
Moisture (%)47.735.21531.87–59.24
Ash (%)2.490.3691.85–3.28
Protein (%)17.612.22211.08–22.41
Fat (%)31.416.88820.72–53.76
NIR Spectroscopy
Moisture (%)47.214.86534.65–59.94
Ash (%)2.410.3051.62–3.09
Protein (%)17.822.41210.65–21.88
Fat (%)31.336.32019.48–49.32
Table 2. Calibration statistics for estimating the chemical composition of traditional sausages for the calibration samples.
ParameterSECRMSECSECVRMSECV
Moisture (%)1.580.922.130.86
Ash (%)0.180.770.260.56
Protein (%)0.890.871.170.78
Fat (%)1.730.932.170.88
SEC = standard calibration error; RMSEC = root mean square standard calibration error; SECV = standard cross-validation error; RMSECV = root mean square standard cross-validation error.
Table 3. Chemical composition according to reference measurements and NIR spectroscopy for external validation samples and deviations between NIR spectroscopy values and reference methods values (n = 10).
ParameterMean ValuesStandard DeviationRange
Reference Methods
Moisture (%)50.736.93436.46–59.62
Ash (%)2.290.4521.19–3.18
Protein (%)17.322.32113.64–21.45
Fat (%)28.838.51319.38–47.18
NIR Spectroscopy
Moisture (%)47.907.23834.21–58.06
Ash (%)2.420.2481.94–2.91
Protein (%)16.732.37713.14–20.37
Fat (%)30.208.43117.84–43.72
Deviations between NIR spectroscopy values and reference methods values
Moisture (%)−2.831.326−4.73–−0.15
Ash (%)0.130.367−0.38–1.12
Protein (%)−0.591.643−2.99–3.04
Fat (%)1.363.730−5.48–9.87
Table 4. Pearson correlation coefficients for measured (Ref) and estimated (NIR) values for moisture, ash, protein, and fat content of traditional sausages were used for the external validation.
ParameterCorrelation CoefficientSignificance
Moisture (%)0.983***
Ash (%)0.585**
Protein (%)0.756***
Fat (%)0.903***
** = p < 0.01; *** = p < 0.001.
Publisher’s Note: MDPI stays neutral with regard to jurisdictional claims in published maps and institutional affiliations.

