1. Introduction
The tire is one of the most important components of vehicles, being responsible for a large set of functions: connecting the transmission to the ground with the forces necessary for motion, supporting the vehicle loads, ensuring the directionality of the vehicle by enabling steering in the driver’s desired trajectory, and improving passengers’ comfort by contributing to the vehicle suspension [
1]. The pneumatic tire design is the market leader because of four main advantages over the NPT used in the past: lower energy loss on rough surfaces, lower radial stiffness, lower contact pressure, and lower mass [
2]. Nevertheless, relying upon the containment of pressurized air, it is susceptible to be punctured and eventual burst may cause fatal accidents. Moreover, the air pressure inside the tire should be kept in a proper range, representing a potential discomfort for its users: the loss of pressure—caused by the leaking around the wheel rim and by the oxygen absorption in rubber—leads the tire to flatten in the contact area, increasing wear and fuel consumption. To overcome these disadvantages, researchers developed an innovative concept, the Non-Pneumatic tire (NPT), that does not require compressed air to work [
3,
4]. This concept was designed to own the key characteristics of the pneumatic tire, bringing advantages such as the absence of maintenance for proper internal pressure, a wider range of application in fields where the pneumatic tire struggles—such as the military and agricultural fields, and the recyclability of its components, so its production can be environmentally friendly and more efficient in the use of resources [
5]. A proper definition of the NPT is reported in the code of Federal regulations of the United States of America [
6], where it is defined as a mechanical device that transmits the vertical load and tractive forces from the roadway to the vehicle, generates the tractive forces that provide the directional control of the vehicle, and does not rely on the containment of any gas or fluid for providing those functions. Although this definition does not specify a structure, an NPT is generally composed of the following elements: a rigid hub connected to an annular outer ring, called shear band or shear beam, by means of flexible polyurethane elements called spokes and a tread. Since the rigid hub and the tread explicate the exact same functions of the ones in the pneumatic tire, the peculiar elements are the shear beam and spokes. The shear beam is constituted by two inextensible membrane layers separated by a relatively low modulus elastic layer [
2].
For what concerns the spokes, researchers and tire makers developed a huge variety of structures that differ from each other in geometries and material characteristics. Several comparative studies were conducted to evaluate the effects of different spokes’ structures on performance parameters. Aboul-Yazid et al. [
7] compared three different concepts to investigate the influence of spokes structures on the contact pressure, radial stiffness, and stresses. Each concept was also modeled with and without the shear band to highlight its influence. Results showed that the presence of the shear band has a great influence on the deformed shapes of the spokes and on the contact pressure distribution. The objects of the aforementioned work were also modeled using finite element (FE) method by Kucewicz et al. [
8] to perform a static radial test with the aim of assessing the effects of different spoke structures on vertical displacement of the rim, deformation shape, stress distribution, and contact pressure. Mathew N. J. et al. [
9] introduced a model of NPT with natural rubber material instead of synthetic one for the tread. Moreover, a comparison study was conducted on various structures such as the honeycomb, plate spokes, triangular, and diamond shape to identify the structure that exhibits the least deformation. The diamond shape was found to perform better. Vinay et al. [
10] studied the hexagonal honeycomb structure developing three models varying the geometric dimensions of the hexagon. They noted that even small changes in honeycomb’s geometry strongly affect the vertical displacement values; in particular, the increase in the spoke’s thickness causes a reduction in spokes’ deformation. Rugsaj et al. [
11] developed a 3D FE model of a commercially available NPT for designing the proper radial spoke. Further, a test campaign on specimens taken from the NPT was developed to obtain the hyperelastic constants that describe the material behavior. The numerical simulations were aimed at selecting the optimal thickness to replicate the radial characteristics of the tire. For the same NPT, Suvanjumrat et al. [
12] studied the possibility of using 3D printing technique to build the complex shape of spoke. They compared the mechanical properties of 3D printing material with the one of the actual spokes. They found that the performances of the 3D printed spoke do not differ significantly from the ones of the original NPT, so the 3D printing technique can be used in future developments. Zhao Y. et al. [
13] developed a new concept named “MEW”, i.e., mechanical elastic wheel, whose peculiarity was represented by the use of mechanical hinges for the spokes. In their work, they performed numerical and experimental studies with the aim of investigate the wheel’s overall stiffness and its relationship with the number of hinges used. An unconventional spokes design was proposed by Zhang et al. [
14]. Studying the kangaroo’s lower limb structure, they proposed spokes having the same shape and proportions of the kangaroo’s thighs and calves and developed numerical simulation to compare the overall stiffness of the NPT designed with a pneumatic tire showing that the former has better load-bearing characteristics, better handling performance, and better comfort.
Besides the comparative tests and innovative designs of specific elements of the NPT, researchers also focused on the overall performances. Jackowski et al. [
15] estimated the energy consumption of a pneumatic and non-pneumatic tire, chosen for size and application, evaluating experimentally the rolling resistance of both. Results showed that for the smaller values of load, the NPT is characterized by lower or quite the same rolling resistance. Veeramurthy et al. [
16] studied the effect of geometric and material parameters of non-pneumatic tire elements on overall performances. In particular, the effects of design variables such as the thickness of spokes, shear band, and the material of spokes on radial stiffness and rolling resistance were analyzed. Xiaochao Jin et al. [
17], using the finite element analysis (FEA), investigated both static and dynamic behavior of NPTs with different honeycomb spoke structures to find the optimal geometric characteristics that minimize the rolling resistance, a key factor for the fuel consumption.
All the aforementioned works used the FEA, a powerful tool for engineers since it can be used to design NPTs [
18] by predicting the performance parameters upon different testing conditions with varying sizes, geometries, and materials of the NPT itself. With FEA, tires can be analyzed in static condition, whose main purpose is the evaluation of the radial stiffness and stress–deformation distribution, and dynamic condition, in which the tire is rolling and the interaction forces between the tire and the road are evaluated. In recent years, to perform dynamic simulation, transient FEA has been extensively applied using an explicit FE code whose computational cost is very high [
19]. However, a steady state rolling analysis, which uses an implicit time integration method, is becoming widely preferred due to its effectiveness and efficiency [
20]. To the author’s knowledge, no studies about the dynamic behavior of a non-pneumatic tire applying the steady state analysis to an NPT with plate spoke structures and detailed tread pattern have been conducted.
The aim of this work comprises the development of a methodology capable of analyzing the static and dynamic behavior of an NPT, assessing the radial stiffness and contact patch in the static step and the longitudinal interaction, along with the dynamic radial stiffness, in the dynamic one. All the FE models created in this work were developed, processed and postprocessed in Abaqus CAE, a widely used software in FE application.
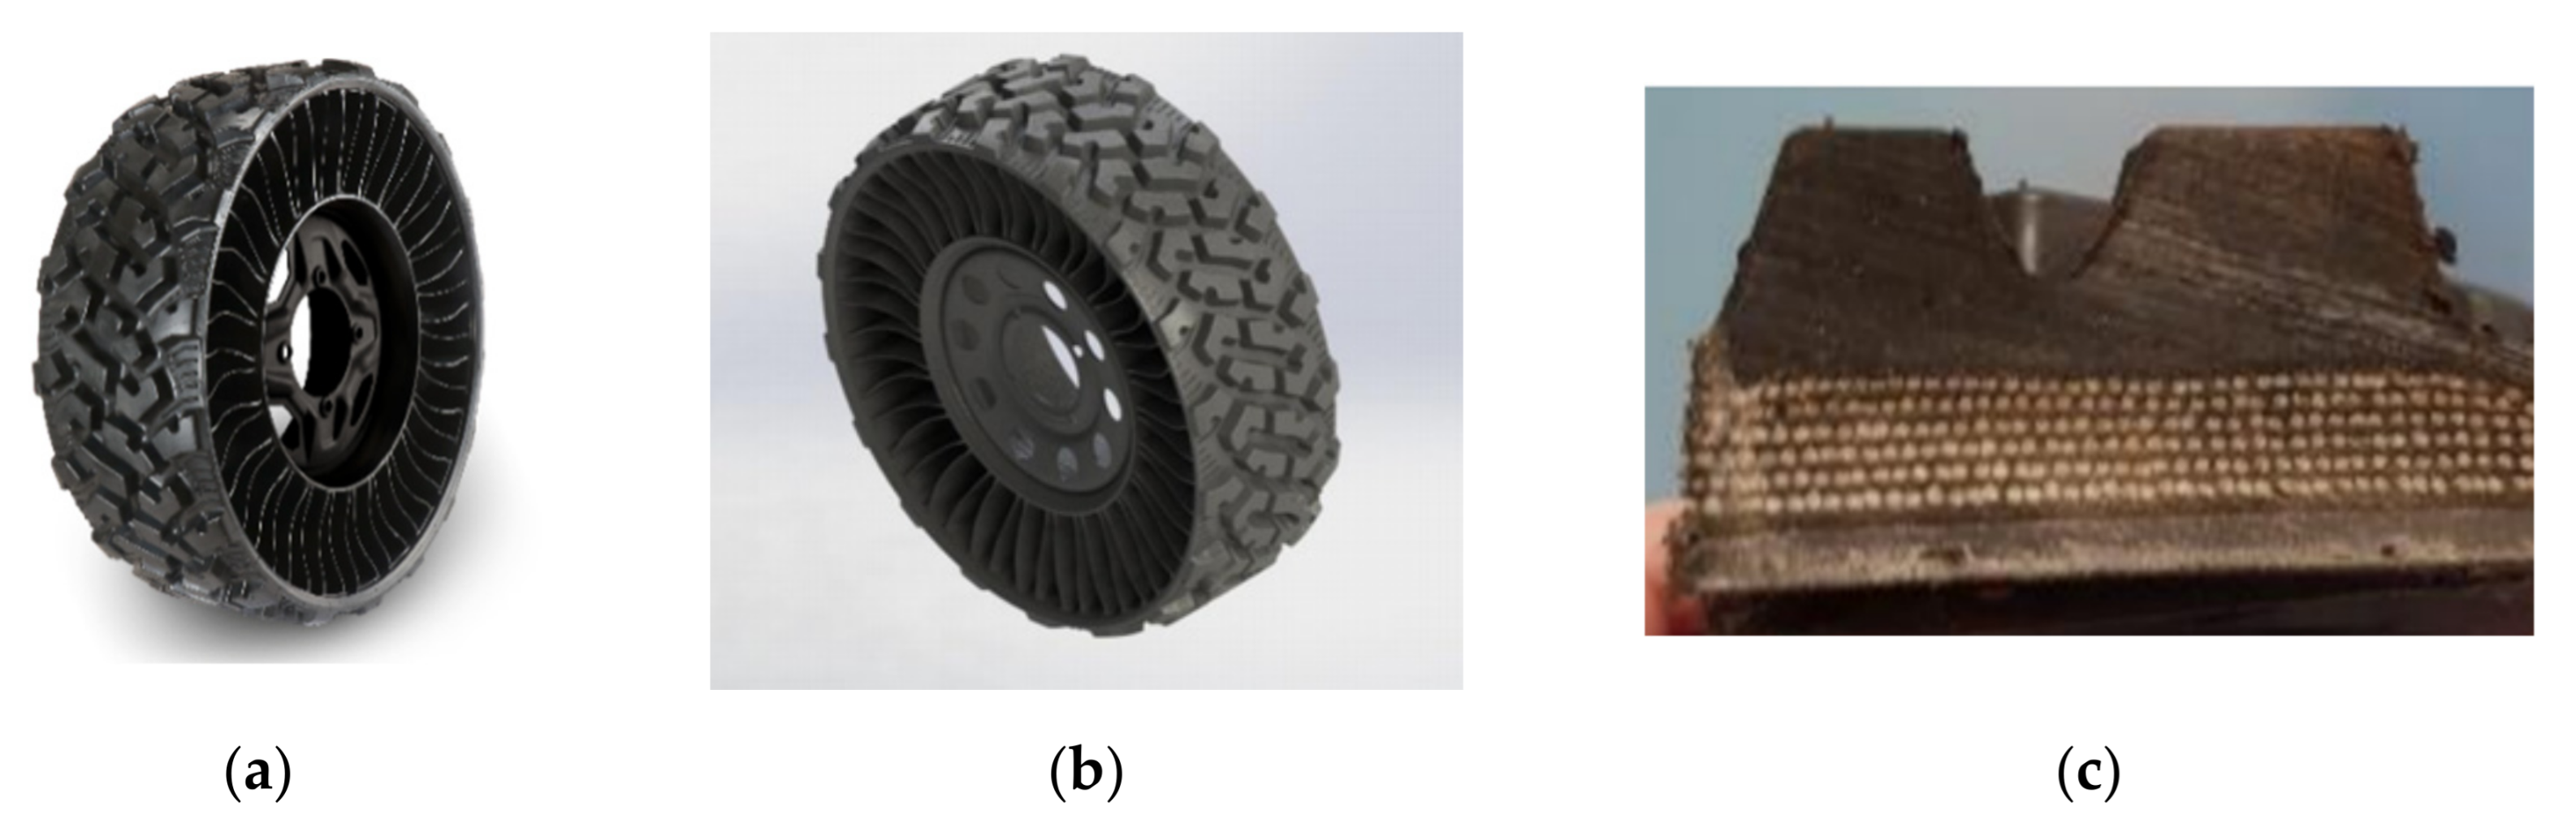
As a case study, the Michelin X-Tweel UTV was chosen, which is a non-pneumatic tire suitable for side-by-side vehicles or utility vehicles. The technical data regarding the case study, taken from the datasheet provided by the manufacturer, are summarized in
Table 1.
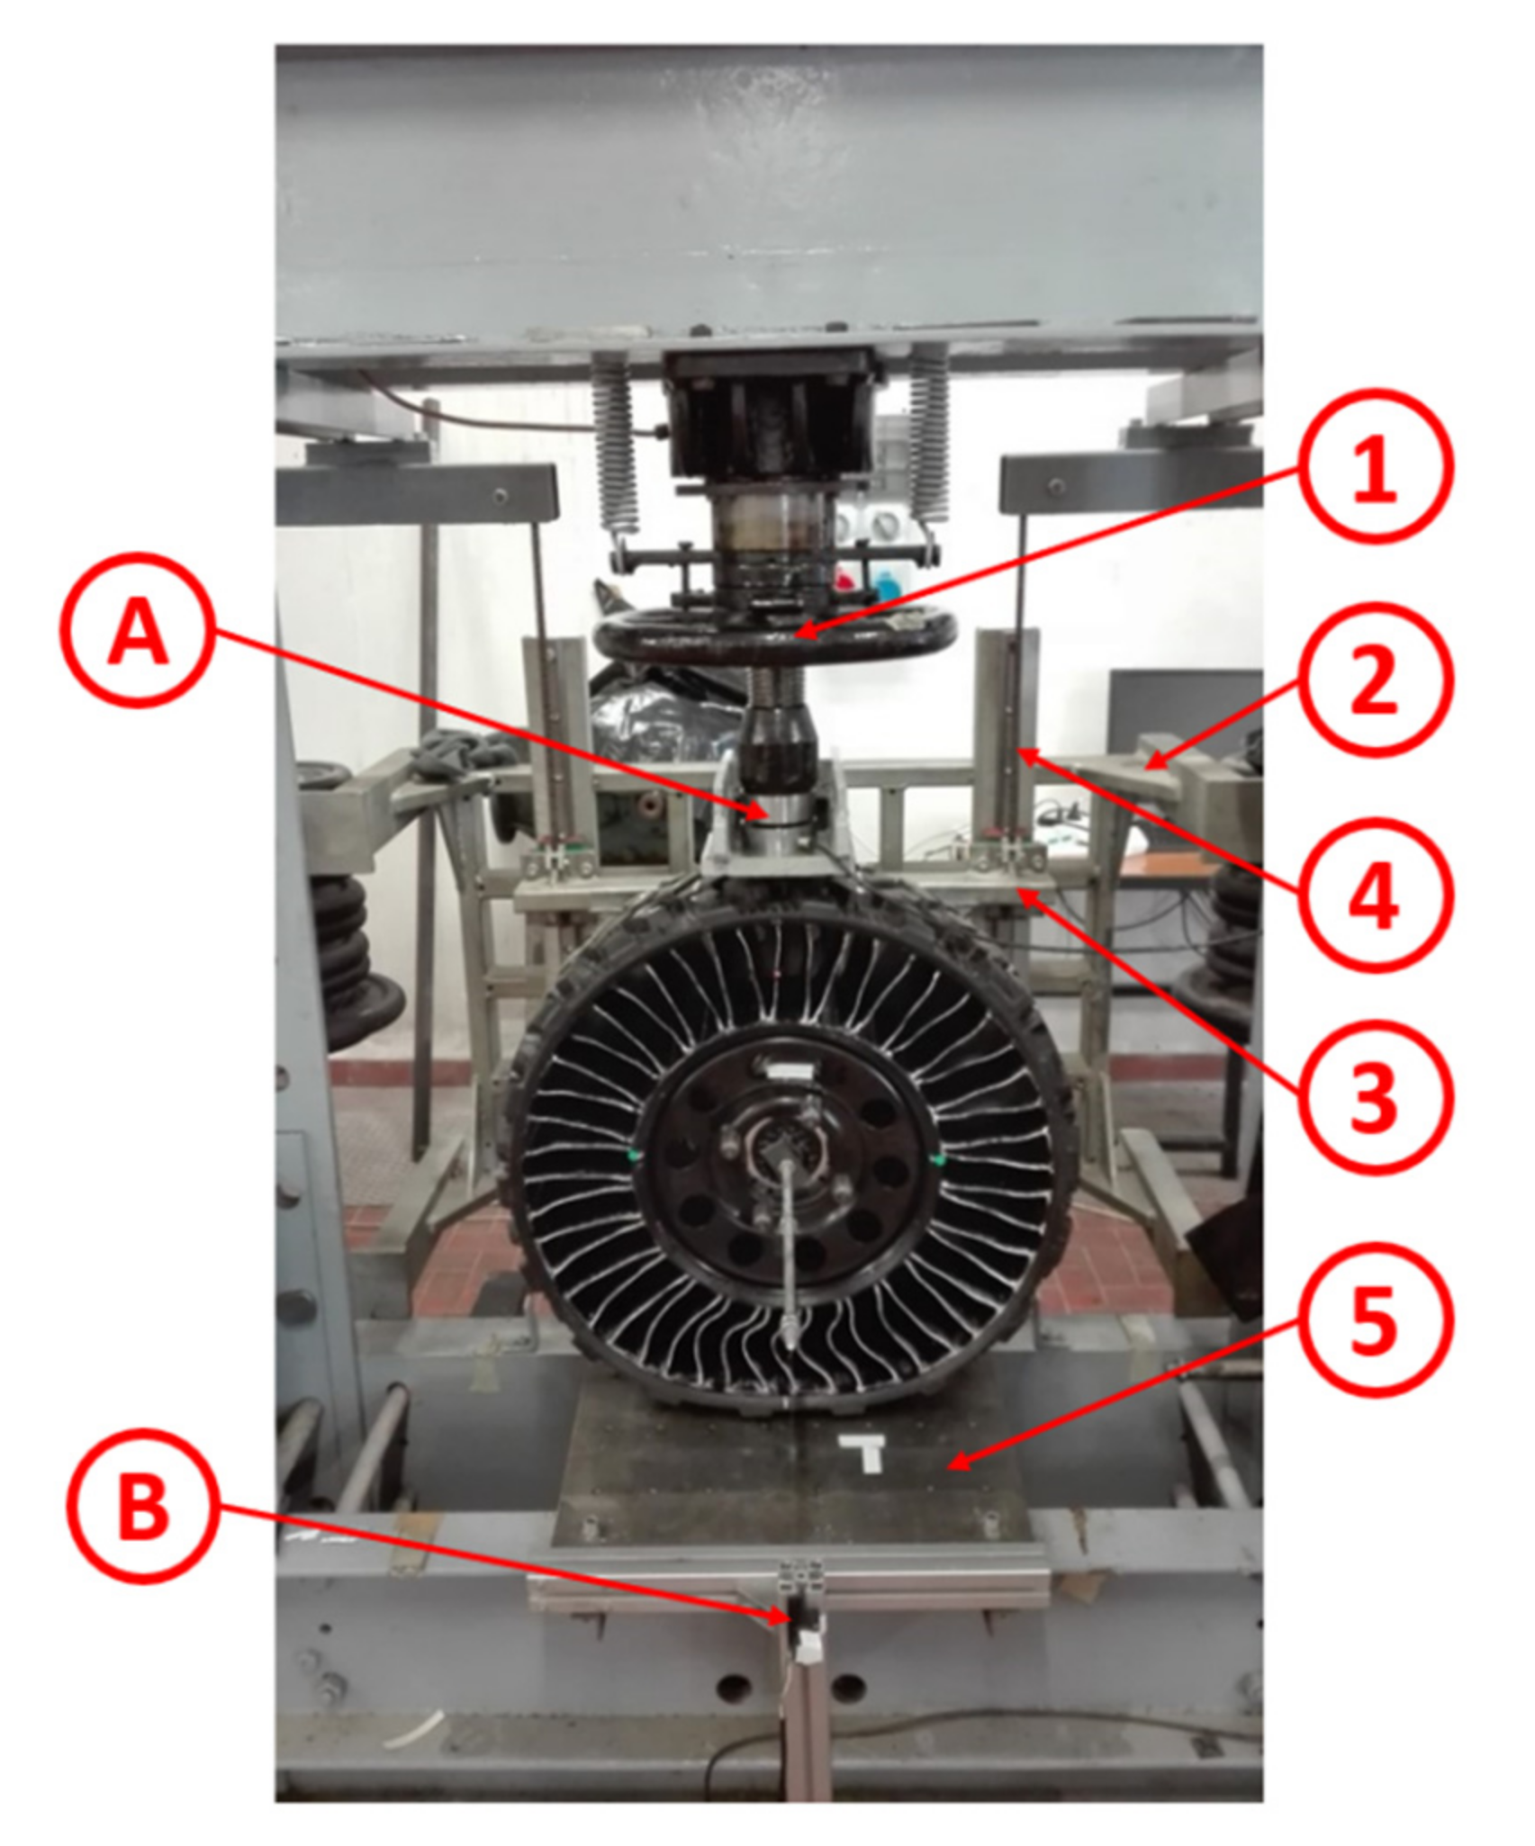
The experimental activities conducted on the NPT consisted of a laser scanning operation and a footprint analysis. Moreover, the NPT was also prepared for the application of Digital Image Correlation (DIC), a tool that allows a more specific study of spokes’ deformation.
With the information acquired by the scanner, the FE model of the NPT was built and subjected to the same test conditions of the real tire. In order to validate the FE model, the results of the FEA were compared with the experimental ones. Once the FE model was statically validated, the dynamic behavior of the tire was investigated by submitting it to a steady state transport analysis, in which the longitudinal interaction was obtained.
3. Static Analysis Using FE Method
With the aim to create a model that actually reproduces the mechanical behavior of the tire, matching the experimental results previously obtained, and investigating its dynamic behavior, the process developed to submit the reference tire to the footprint analysis by means of the FE method is presented.
3.1. FE Modeling
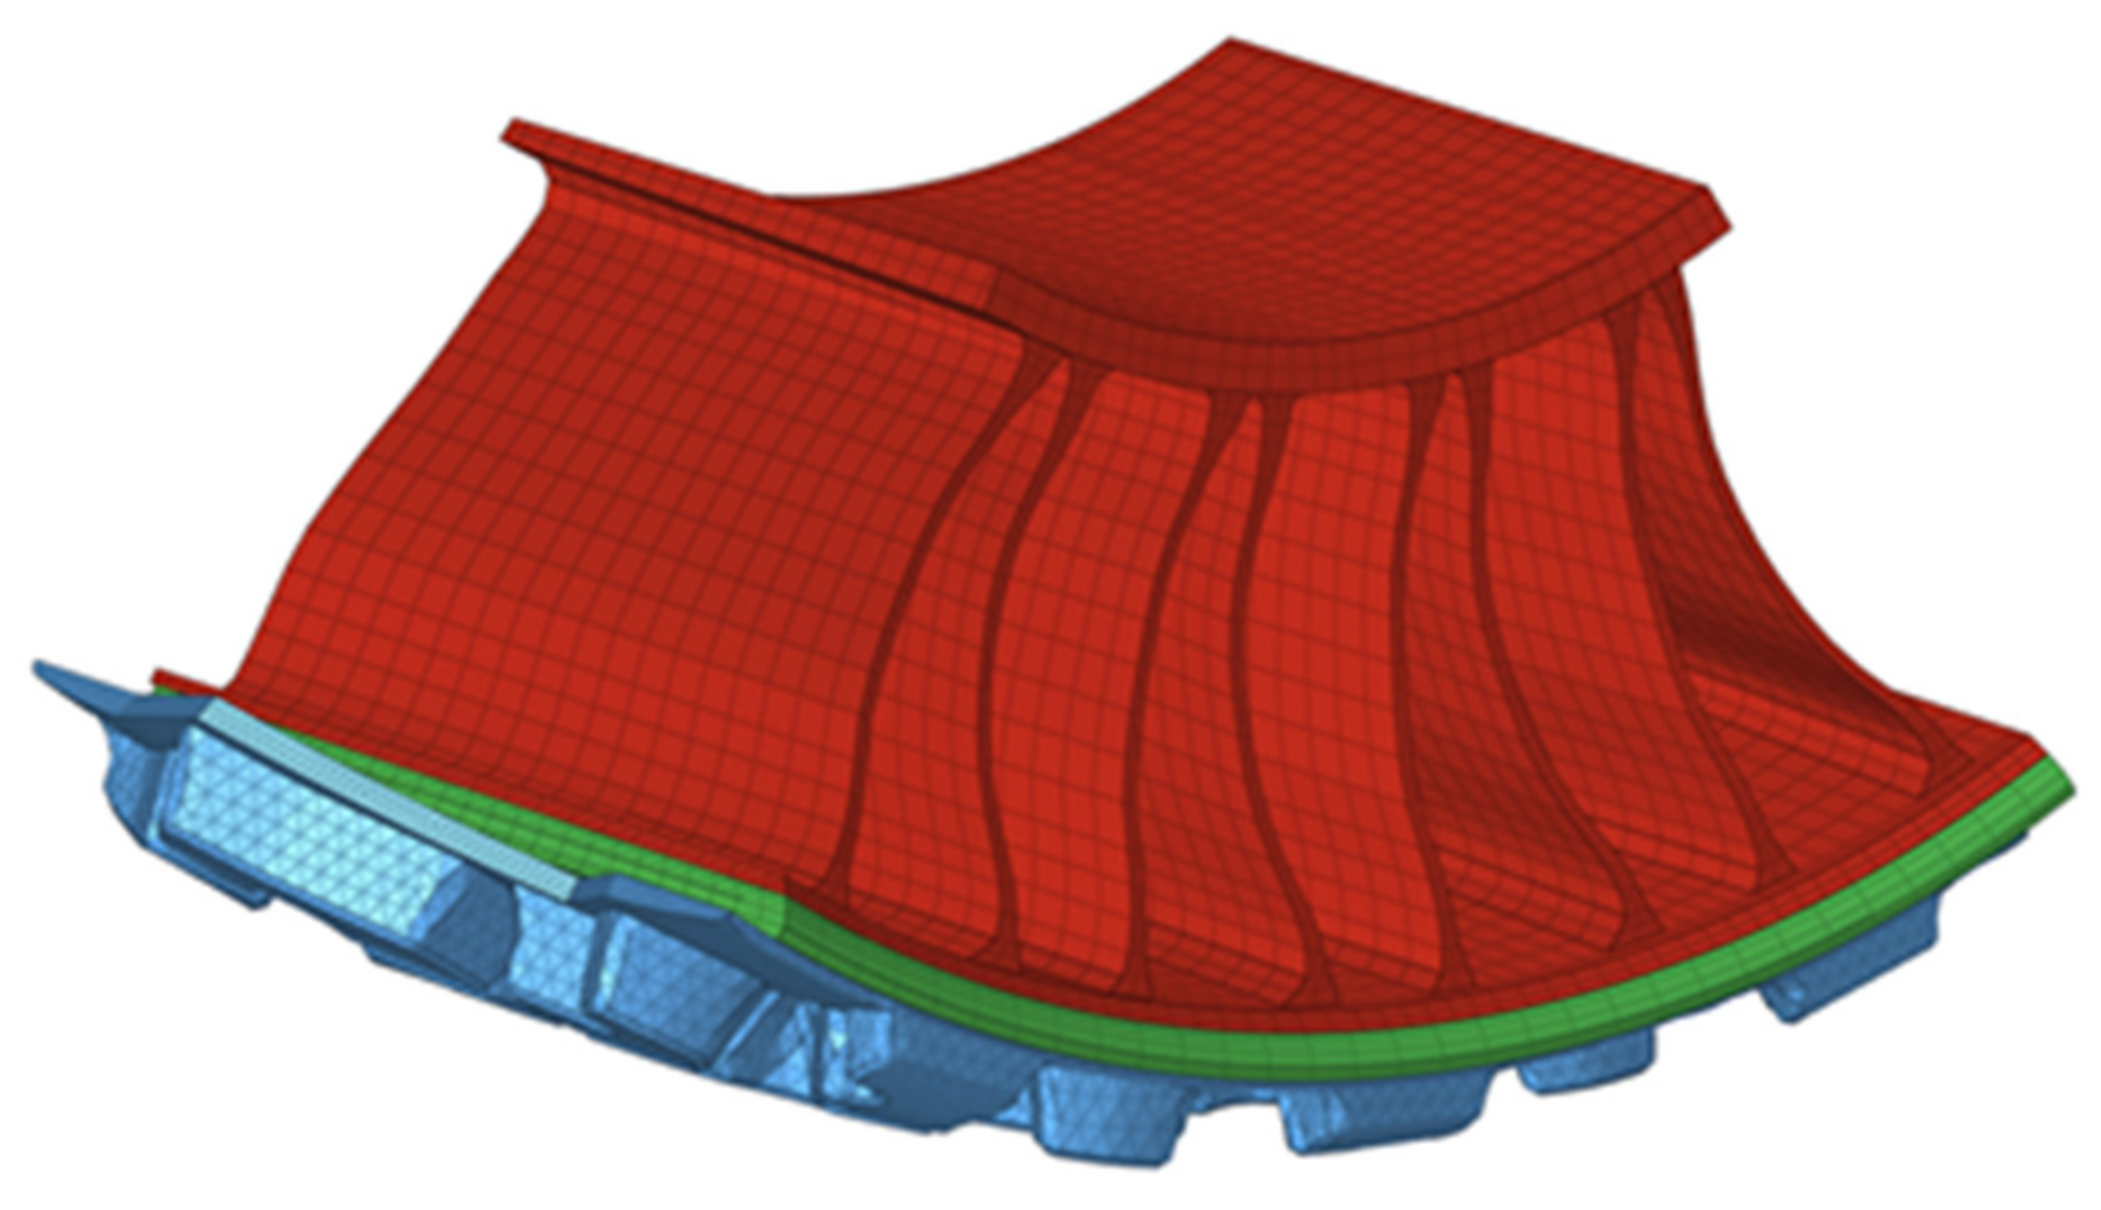
Starting from the outcome of the laser scanning operation, the FE model of the Michelin X-Tweel UTV was developed. In the modeling phase, five elements were considered: spokes, inner ring, shear band, belt plies, and tread.
The spokes modeling was a critical step, since they strongly affect both the radial behavior of the tire and the elements number. They can be modeled using solid elements starting from the geometry acquired with the laser scanner, realizing a 3D model. However, to minimize the elements number and thus, the computational time, a 2D–3D mixed model was studied. The mixed model is made of 4-node linear shell elements placed on the mid-surface of the spokes for thinner zone and 8-node linear solid elements for the thicker one, which is the interface of the spokes with the inner ring and the shear band. The connection between 3D and 2D elements was realized with shell elements located inside the solid elements, with the nodes equivalenced. This transition zone is required to ensure the continuity of the component because solid elements nodes have 3 degrees of freedom while shell elements nodes have 6 degrees of freedom. The model of the spoke is shown in
Figure 7a whilst a focus on the transition zone is shown in
Figure 7b. In the mentioned figure, some solid elements were hidden to allow the view of the internal shell elements.
The inner ring and the shear band were modeled with 8-node linear solid elements with the hybrid formulation or Hermann formulation, which consists of the separated integration of pressure and displacement field in order to prevent volumetric locking that may occur during compression of hyperelastic materials, which may cause convergence problems. To recreate the chemical linking existing between the top and bottom surfaces of the spokes and, respectively, the inner ring and shear band, and between the shear band and the tread, a tie surface to surface constraint was used.
The belt plies were reproduced using a simplifying technique that consists of modeling a belt ply with surface elements [
23]. Each surface element is integrated into the three-dimensional structure using the embedded elements technique while the mechanical behavior of the plies is simulated through the introduction of the rebar layers. The information about the location of the surfaces that reproduce the belt plies can be deduced from the cross-section of the shear band obtained in the sectioning step previously described. The adopted rebar properties were 1.5
as resistant area of the single fiber with a distance between two bar equal to 1.33 mm and an orientation angle equal to 0°. The orientation angle is defined as the angle between the direction of the fibers and the direction of the wheel travel.
The tread is composed by the repetition, about the axial direction of the tire, of a pattern constituted by six blocks that repeats itself every 20°. Each element was modeled with a 4-node linear tetrahedron with hybrid formulation. Since the tread elements were meshed only in the contact zone in order to not increase excessively the number of elements and because they do not work, outside the contact zone, during the contact patch simulation, a slightly smaller element size was used to better describe the contact between the tread and the road.
Finally, the road was modeled with a rigid quadrilateral element with 4 nodes, placed in a one-point contact position with the tread. The road was assumed to be rigid and modeled as a discrete rigid body. In
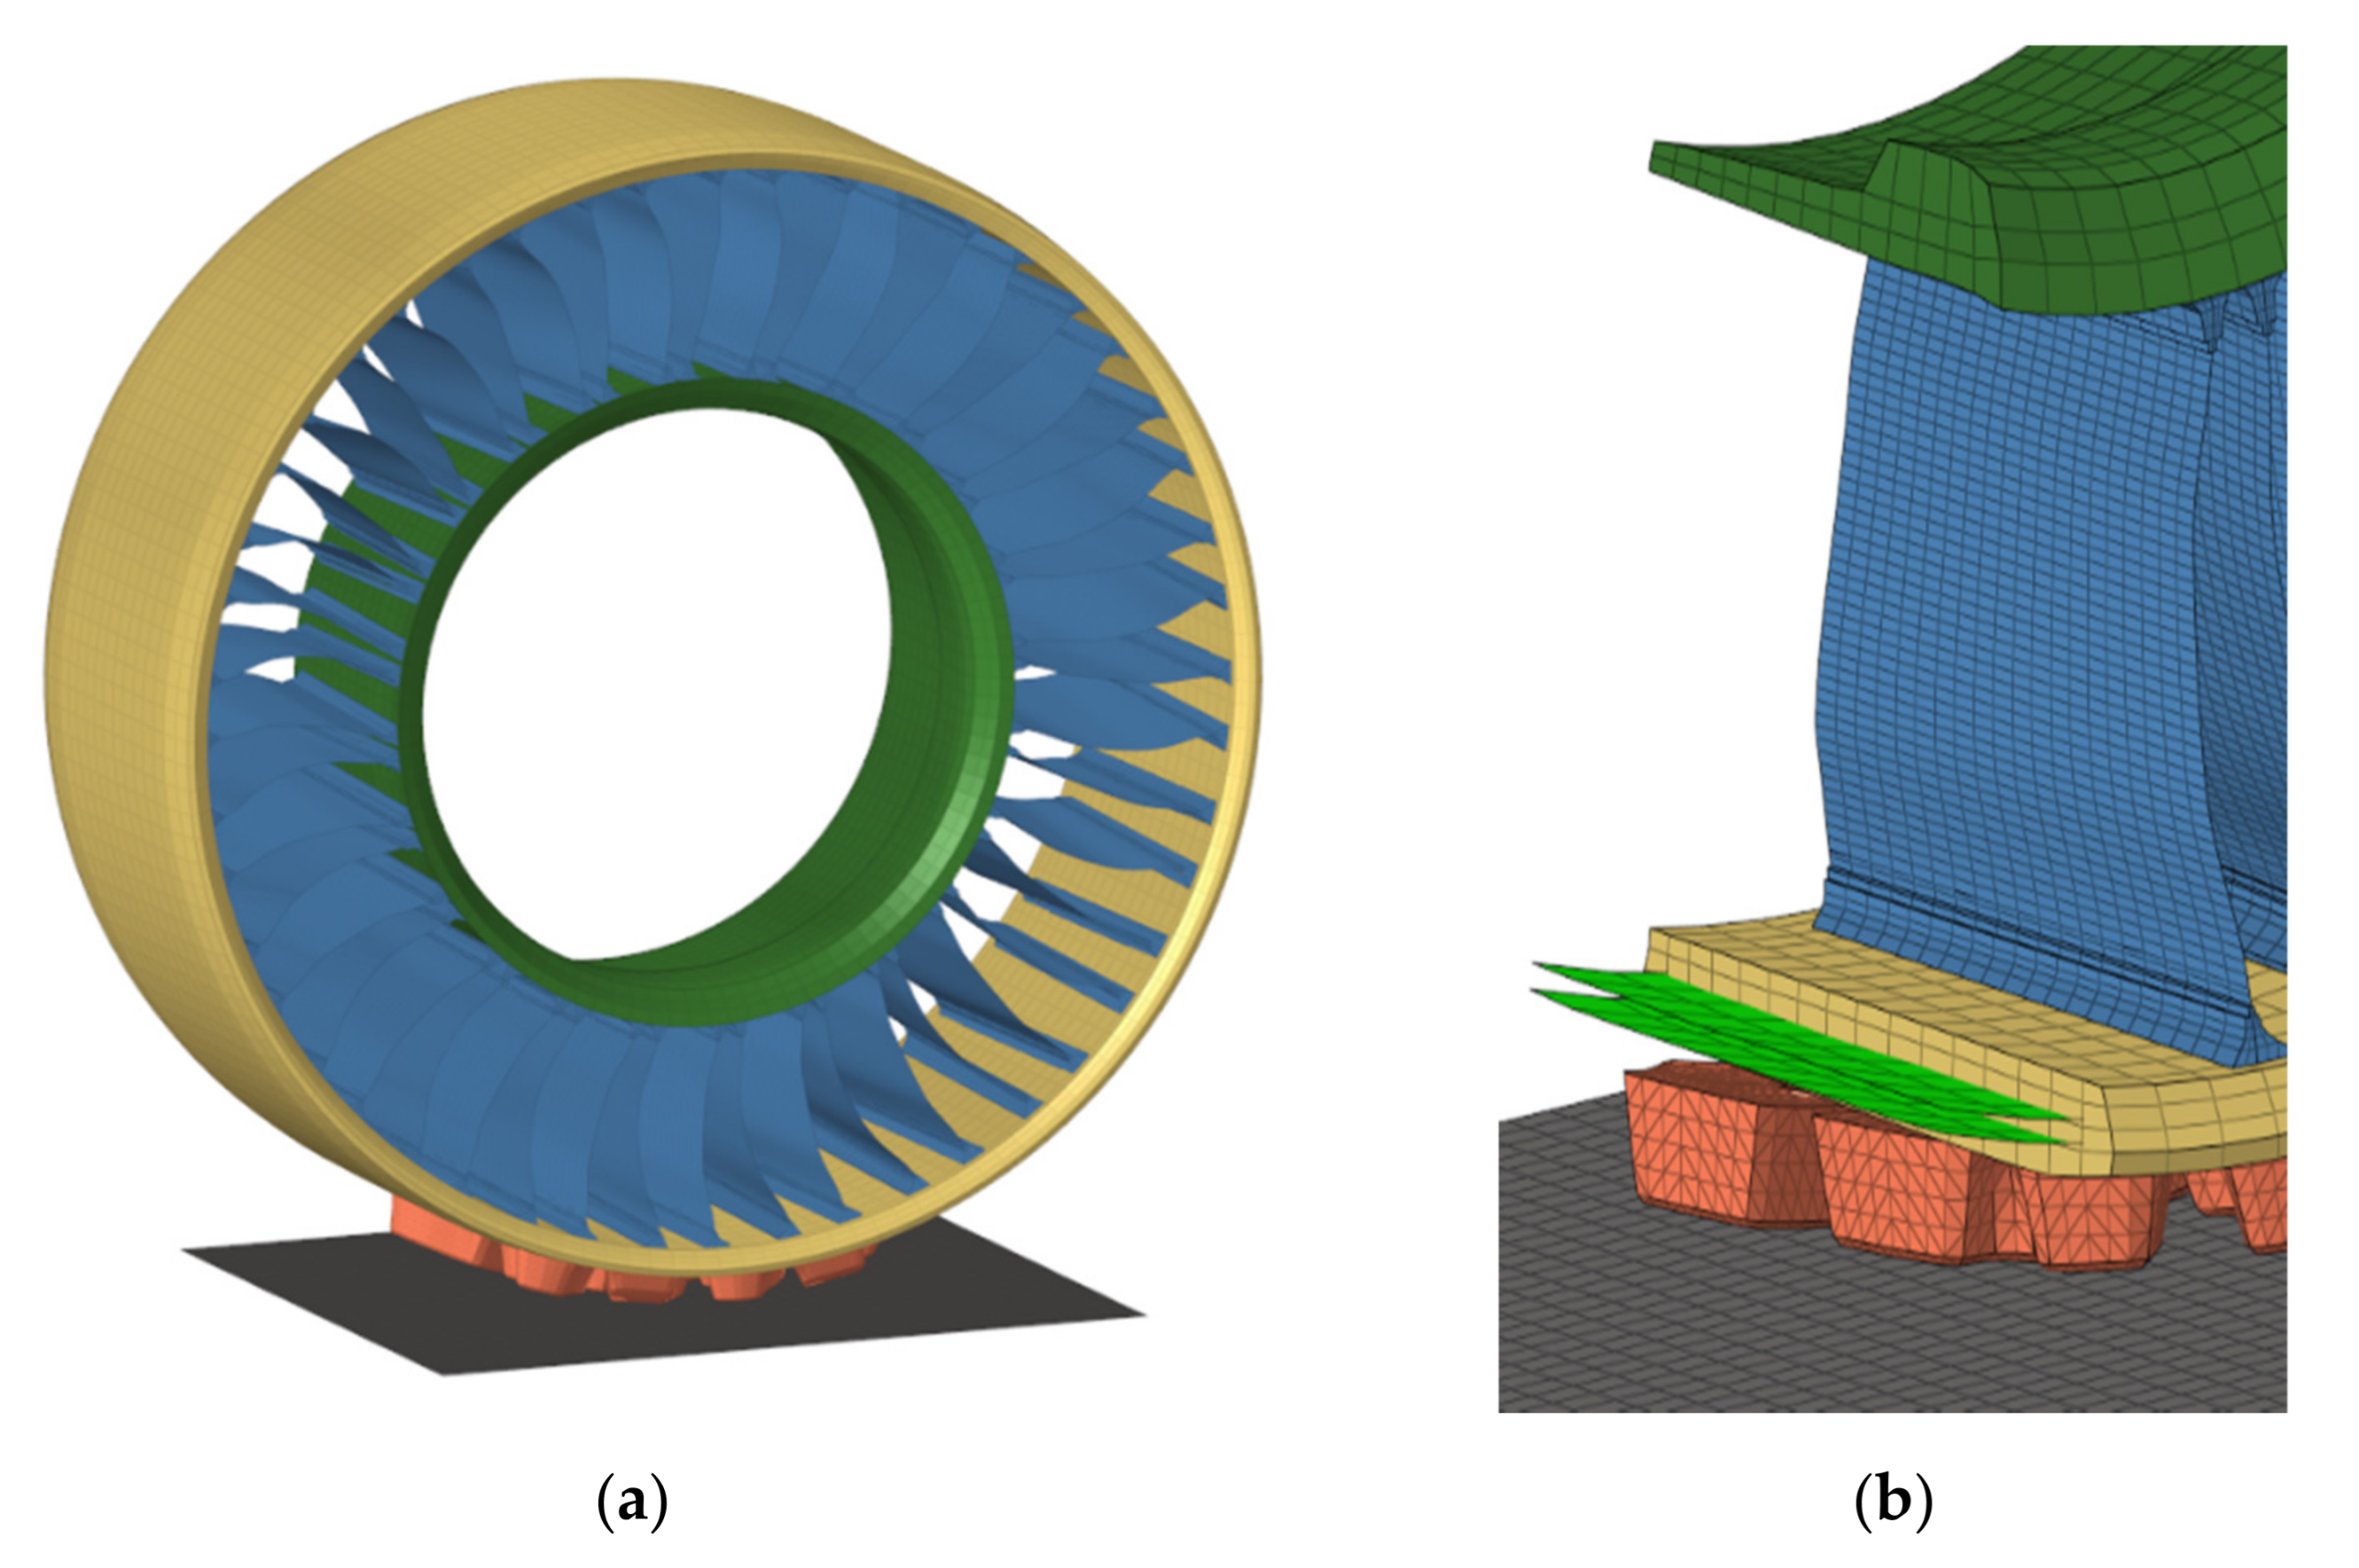
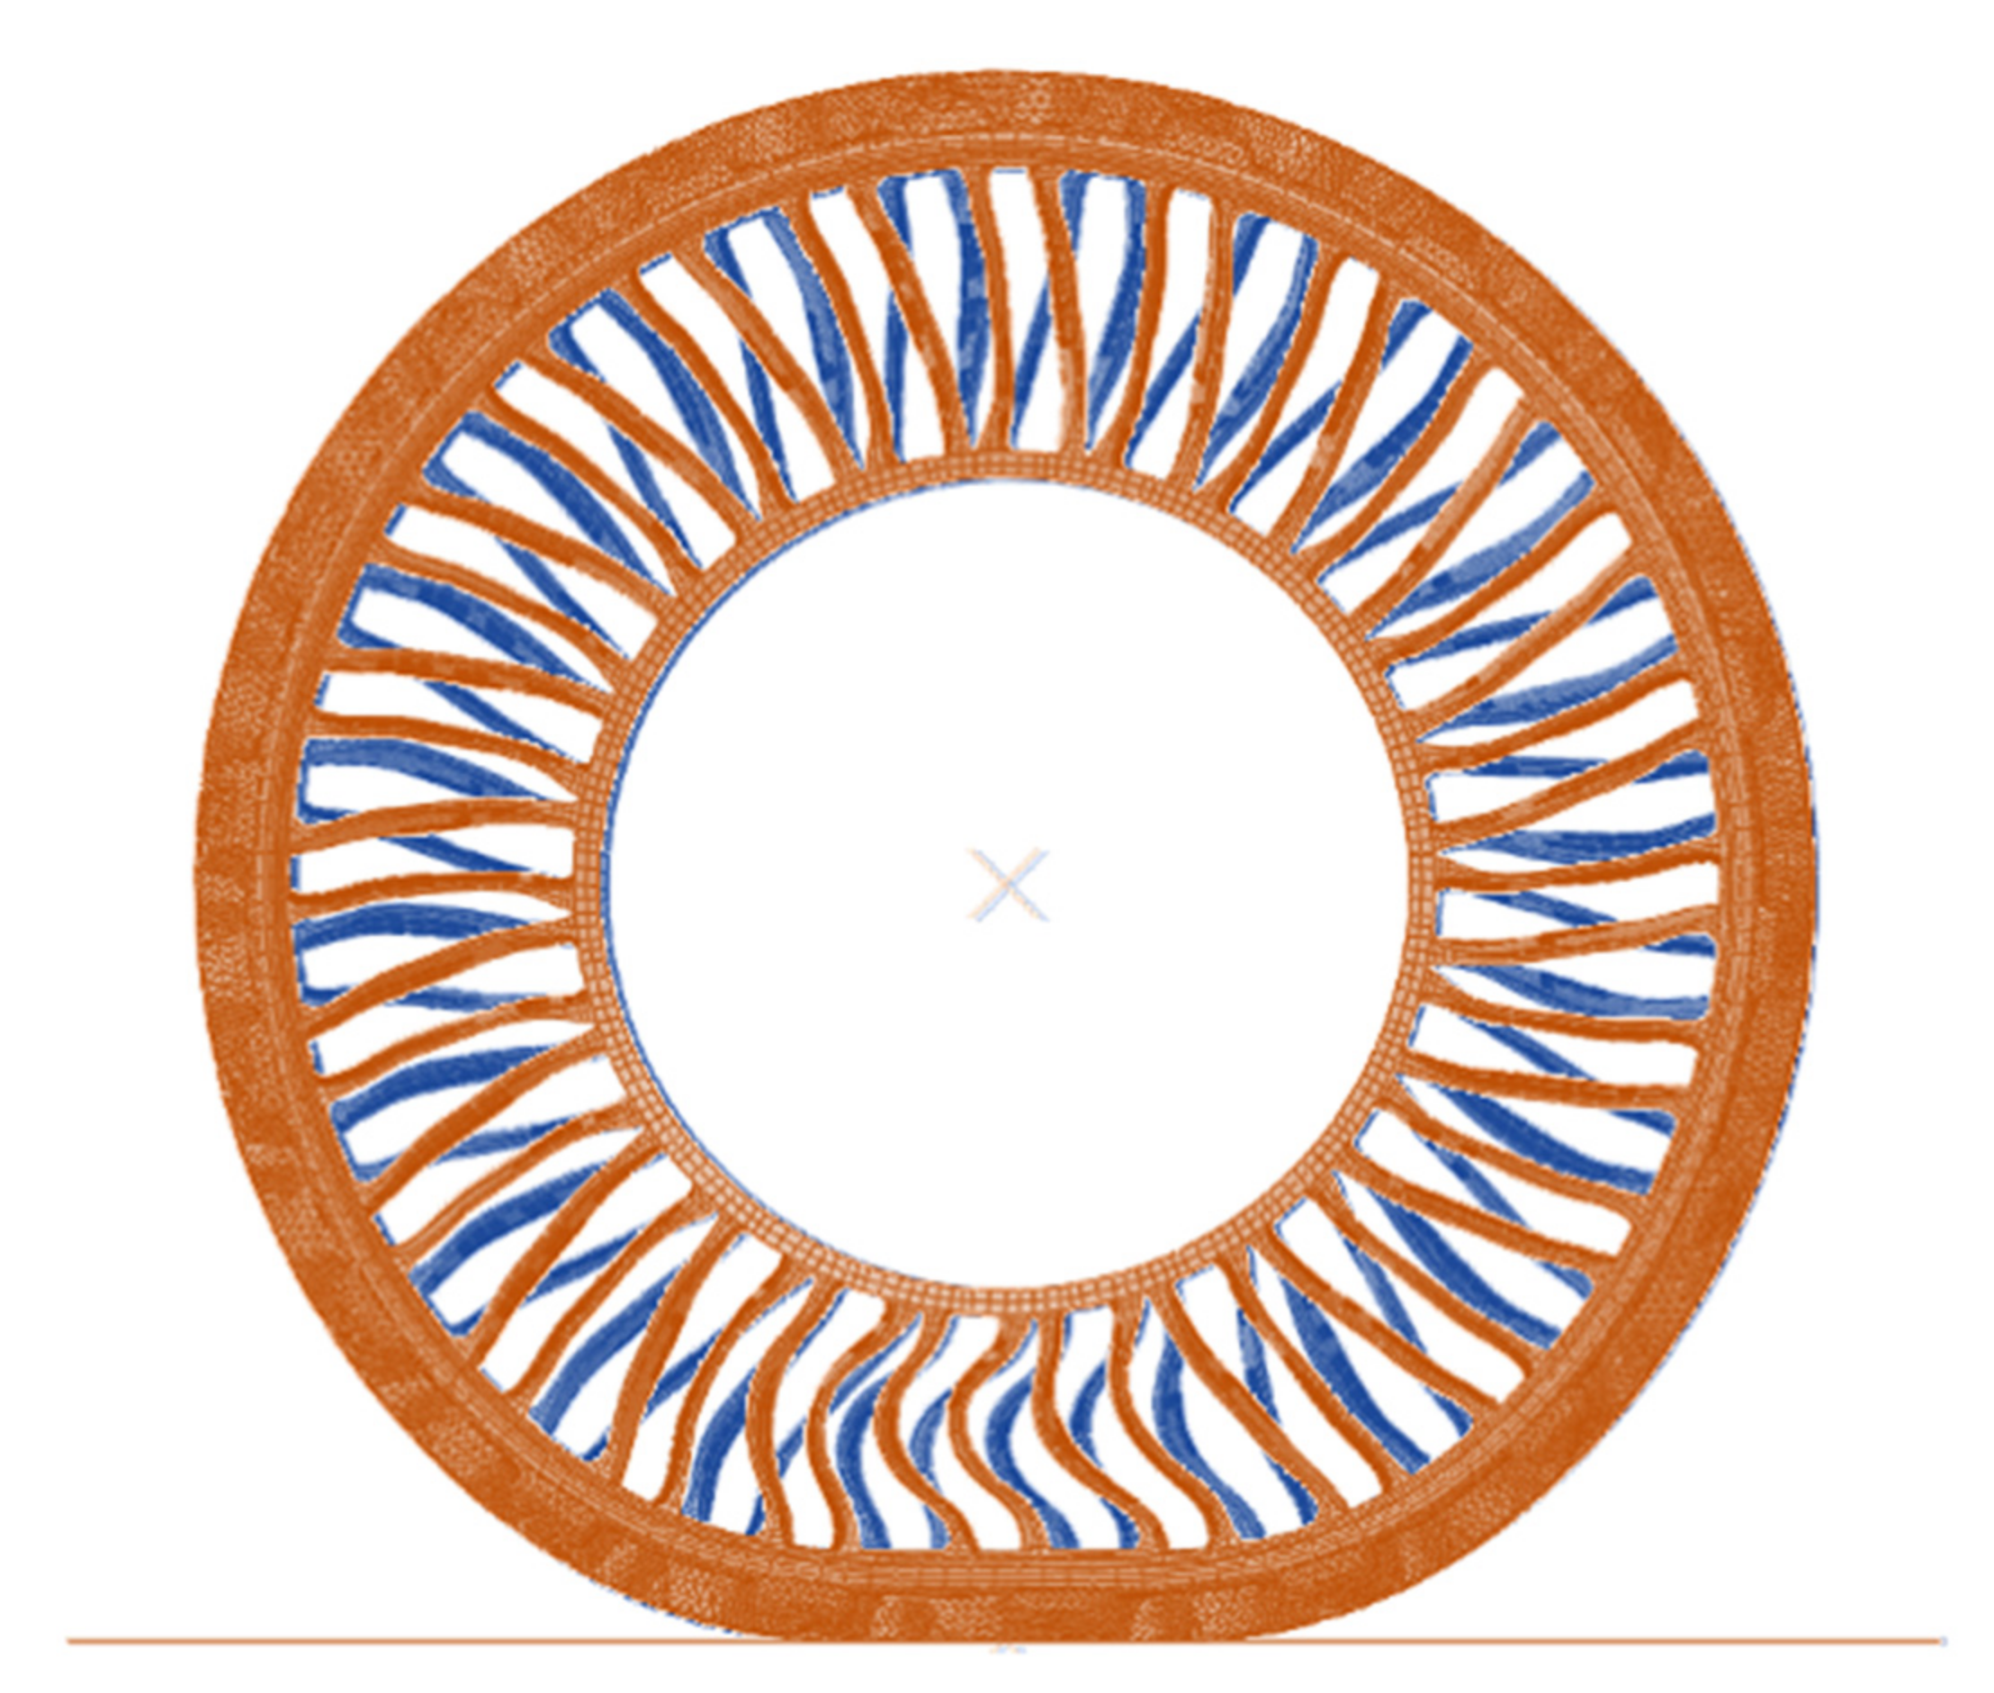
Figure 8a, the entire FE model of the NPT is presented, whilst in
Figure 8b, some elements are hidden to allow the view of the surfaces representing the belt plies embedded in the shear band.
For what concern the material properties to be assigned to the elements of the NPT, Żmuda et al. [
24] provided the material coefficients needed to describe the mechanical behavior of the rubber constituting the tread. The inner ring, the spokes, and shear band are made of PU and modeled with a linear elastic material model with a Young modulus found by Rugsaj et al. [
25] by means of the inverse method, whilst the belt plies are made of nylon. The material properties adopted for the analysis are summarized in
Table 2.
The Neo-Hookean hyperelastic model was chosen to describe the tread elements to provide more accuracy in portions characterized by large deformations and where the material is highly confined, especially when the loading is highly compressive. Concerning the polyurethane, the use of a linear elastic material model represents a simplification that allows for reduction of the computational time, maintaining the approximation in a small range of error. Notice that more precise results can be obtained by using more complex, nonlinear material models, without affecting the validity of the proposed procedure.
In order to reproduce the experimental test conditions, the right set of constraints and boundary conditions must be applied. Starting from the constraints, the hub of the tire was replaced by the kinematic coupling between the hub reference point and its external nodes. This constraint was applied to replace the hub since it is infinitely stiffer than the other elements of the tire.
To model the mechanical behavior of the road, a rigid body constraint was imposed between a reference point, placed outside the contact zone and the road elements. In this way, the displacements and rotations imposed to the reference point are equal to the ones of the nodes of the road.
Concerning the boundary conditions, a reference point was defined in the center rim of the tire and to that, a displacement, representing the crushing of the tire against the surface, was imposed.
To simulate the tire–road contact, the penalty method was chosen. It provides for the identification of the surfaces experiencing the contact dividing them into a master surface—in this case, the road—and a slave surface, the portion of the tread placed in contact with the road. This operation is mandatory for the individuation of the nodes that, during the crashing, could experience the interpenetration of bodies. In the hypothesis of finite sliding between the two surfaces, the friction is simulated by Coulomb’s law assuming equal to 0.8 the coefficient of friction. The same friction model and value was used for the following steady state transport analysis.
3.2. Results and Model Validation
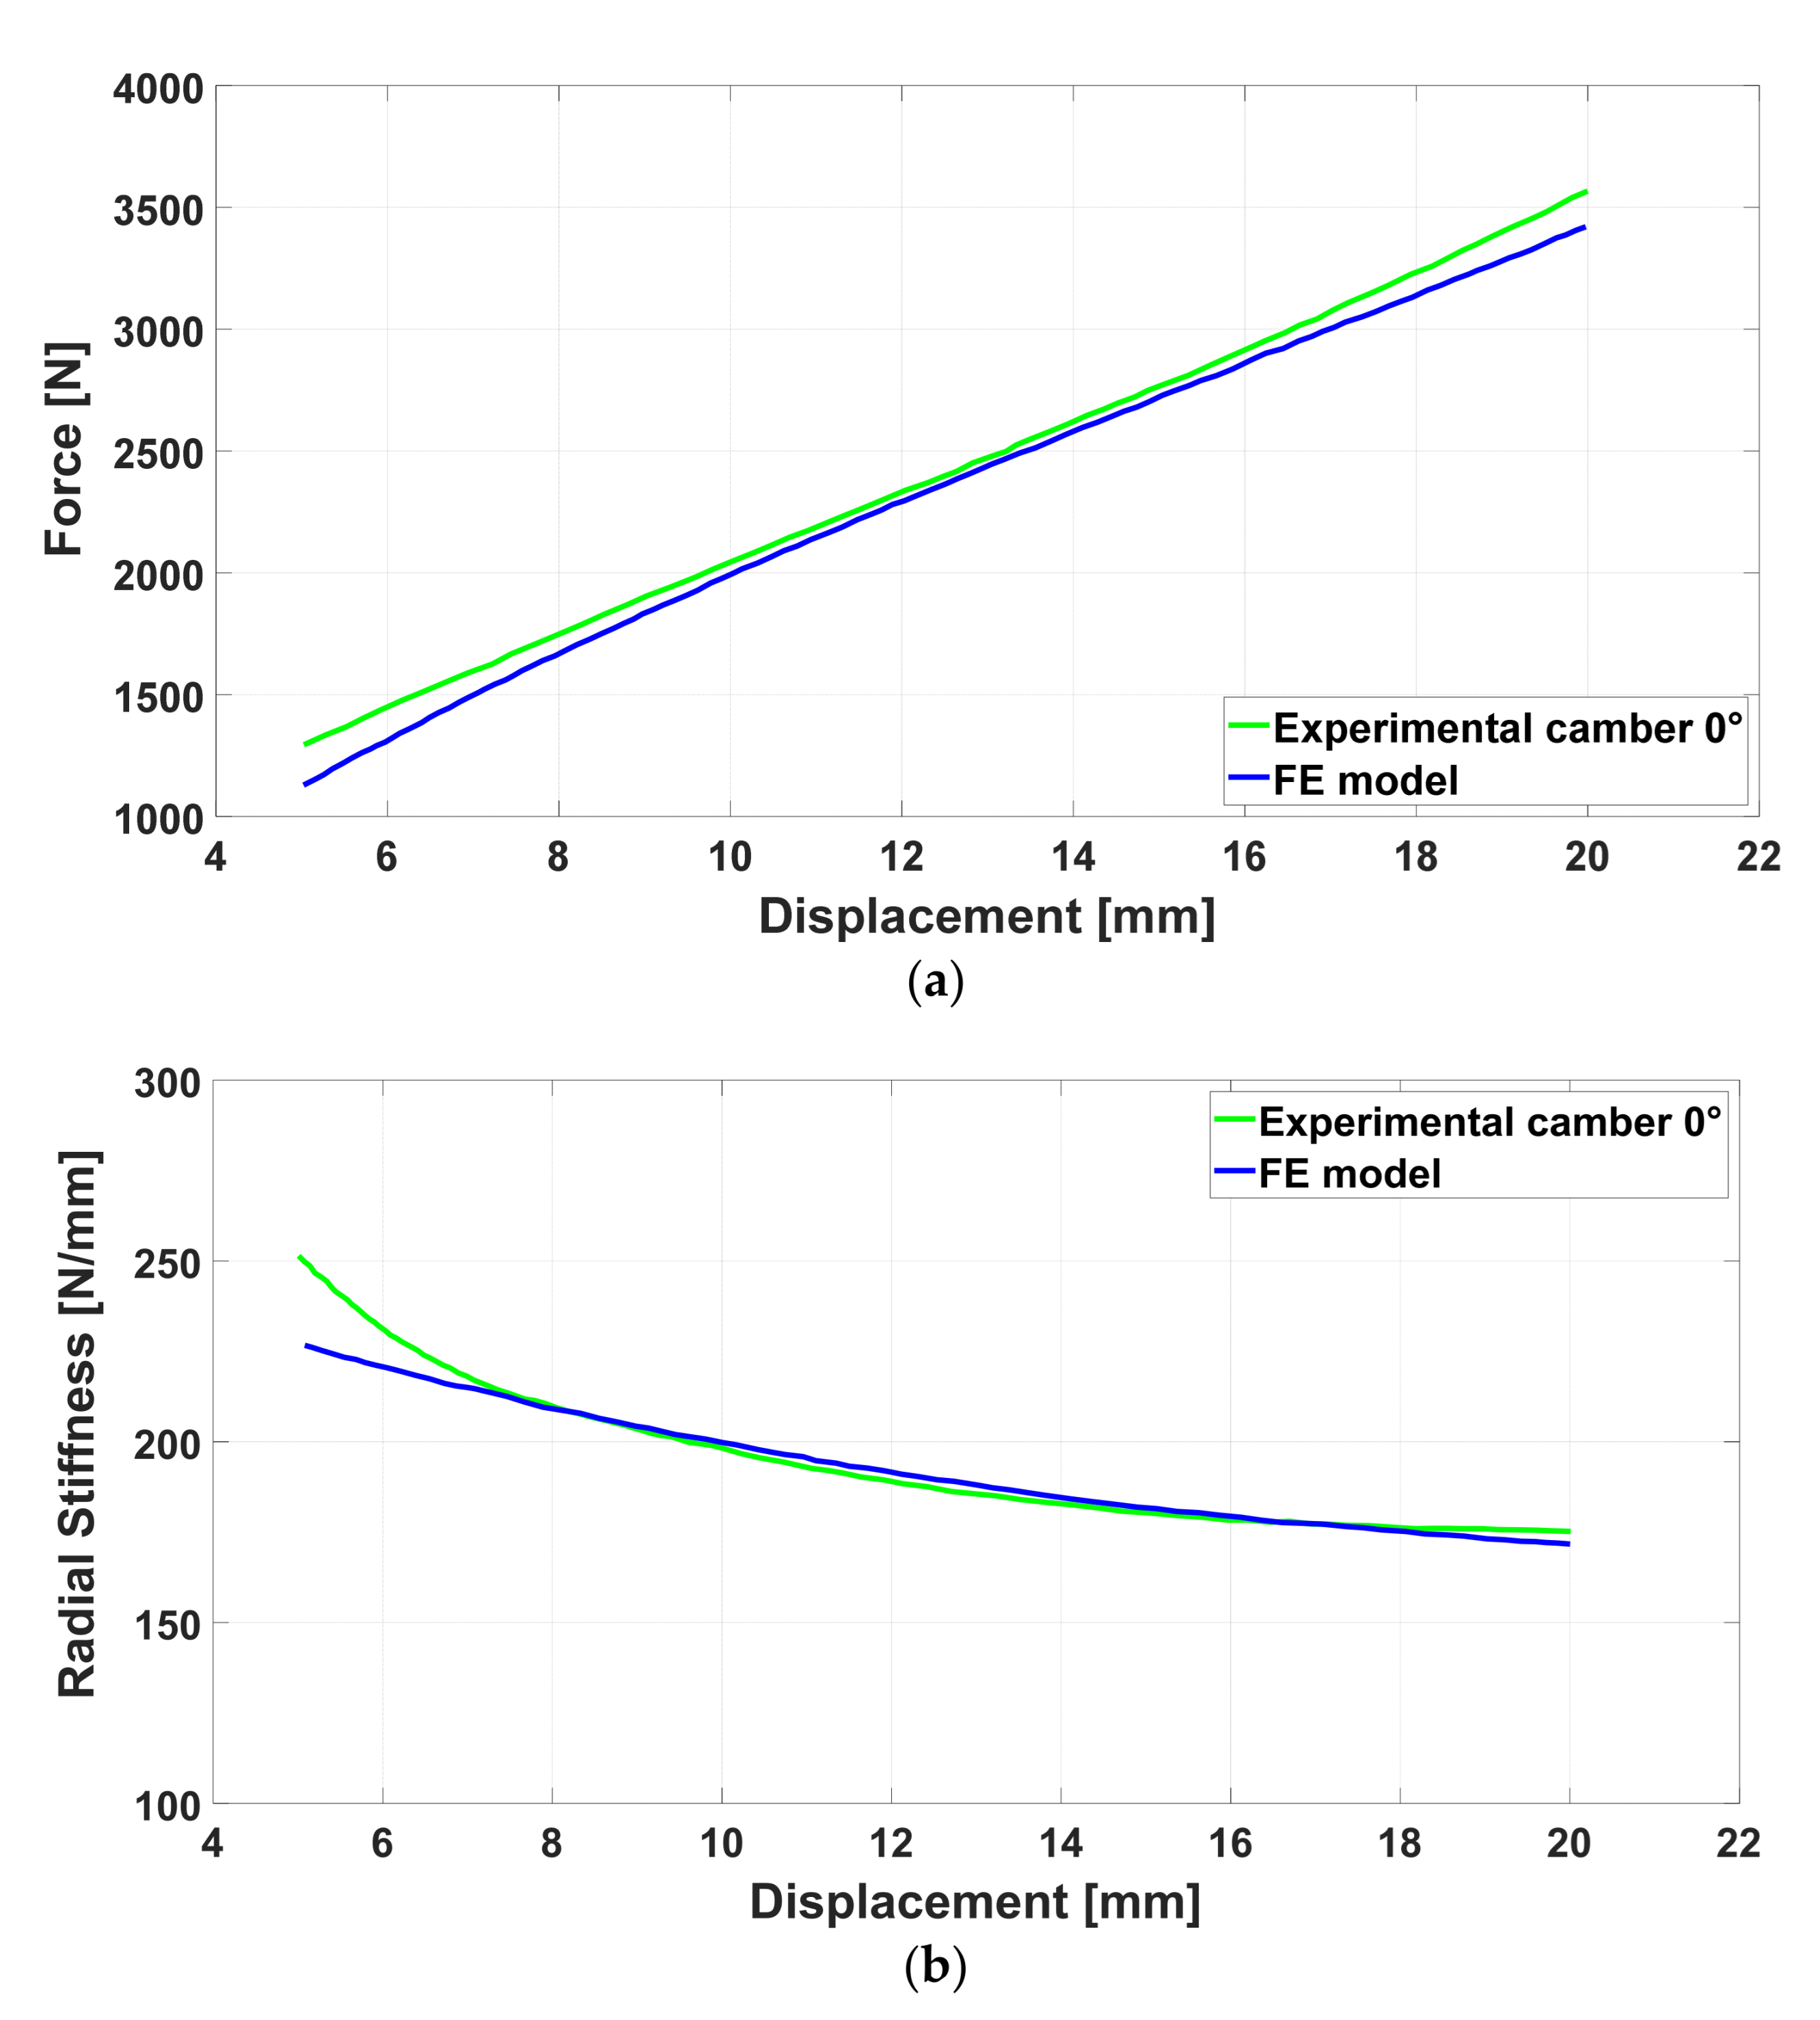
In order to validate the methodology, the results of the FEA were compared with the experimental ones. The comparison was carried out on two different planes: a qualitative comparison that involves the deformation shapes of the experimental and FE model, and a quantitative comparison that includes the following: the Force and Radial Stiffness vs. Displacement diagrams that globally analyze the mechanical behavior of the tire; the DIC results that locally study the deformation of the spokes; the contact patch comparison that focuses on the contact phenomenon of the tread elements in terms of pression.
The qualitative comparison between simulation and experimental results is shown in
Figure 9, where the deformed shape of the FE model is overlapped with the real deformed shape, obtained with a 3500 N load with 0° camber.
In order to quantitative validate the model behavior, in
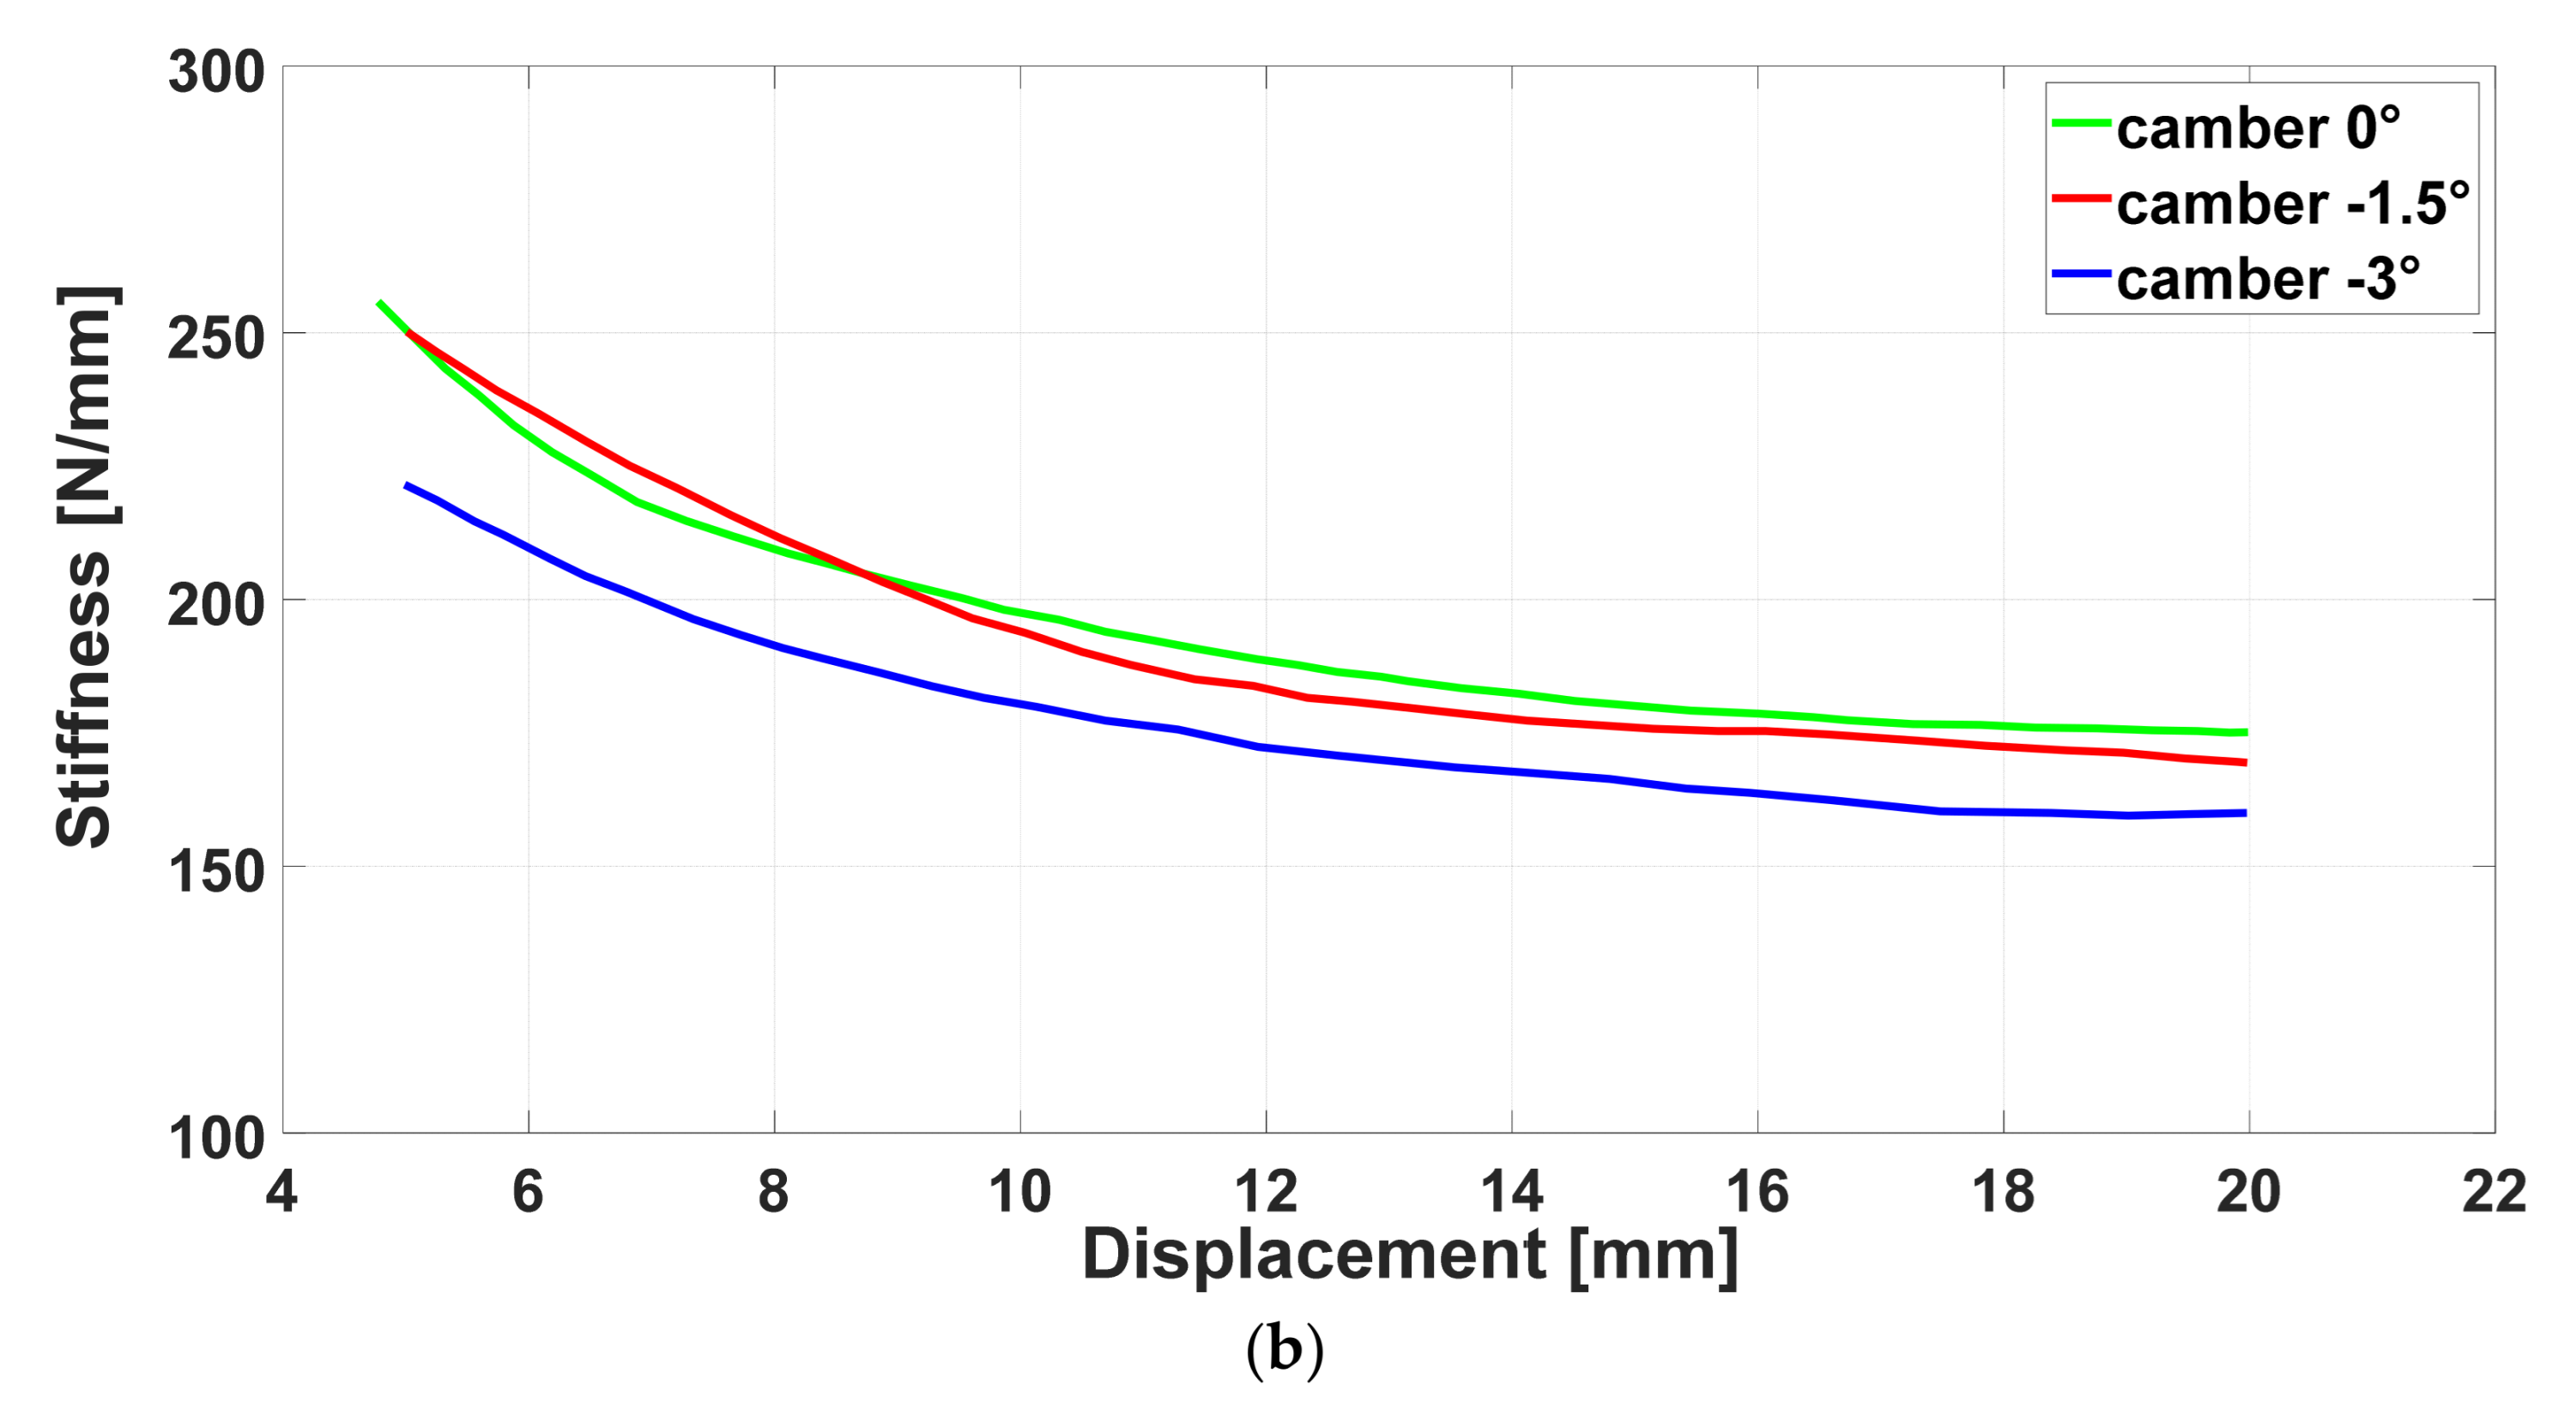
Figure 10a, the Force vs. Displacement diagram of the FEA is shown, which is in good agreement with the experimental one. For a wide range of displacements, the reaction force is quite the same for both with a diverging behavior only present for the smallest and largest displacements. At the smallest displacements, the divergences can be explained by the errors that affect the measurement instruments when they acquire the displacement signals at low loads whilst, for the largest displacements, the differences can be explained by the highly nonlinear behavior of the material that constitutes the tire and does not allow to match the exact force trend for the entire range of deformation. For what concerns the Radial Stiffness vs. Displacement diagrams are shown in
Figure 10b; further, in this case, the FE model is in good agreement, replicating the softening spring characteristic behavior of a NPT, which means that the radial stiffness of the tire decreases with an increasing displacement applied to center of the rim.
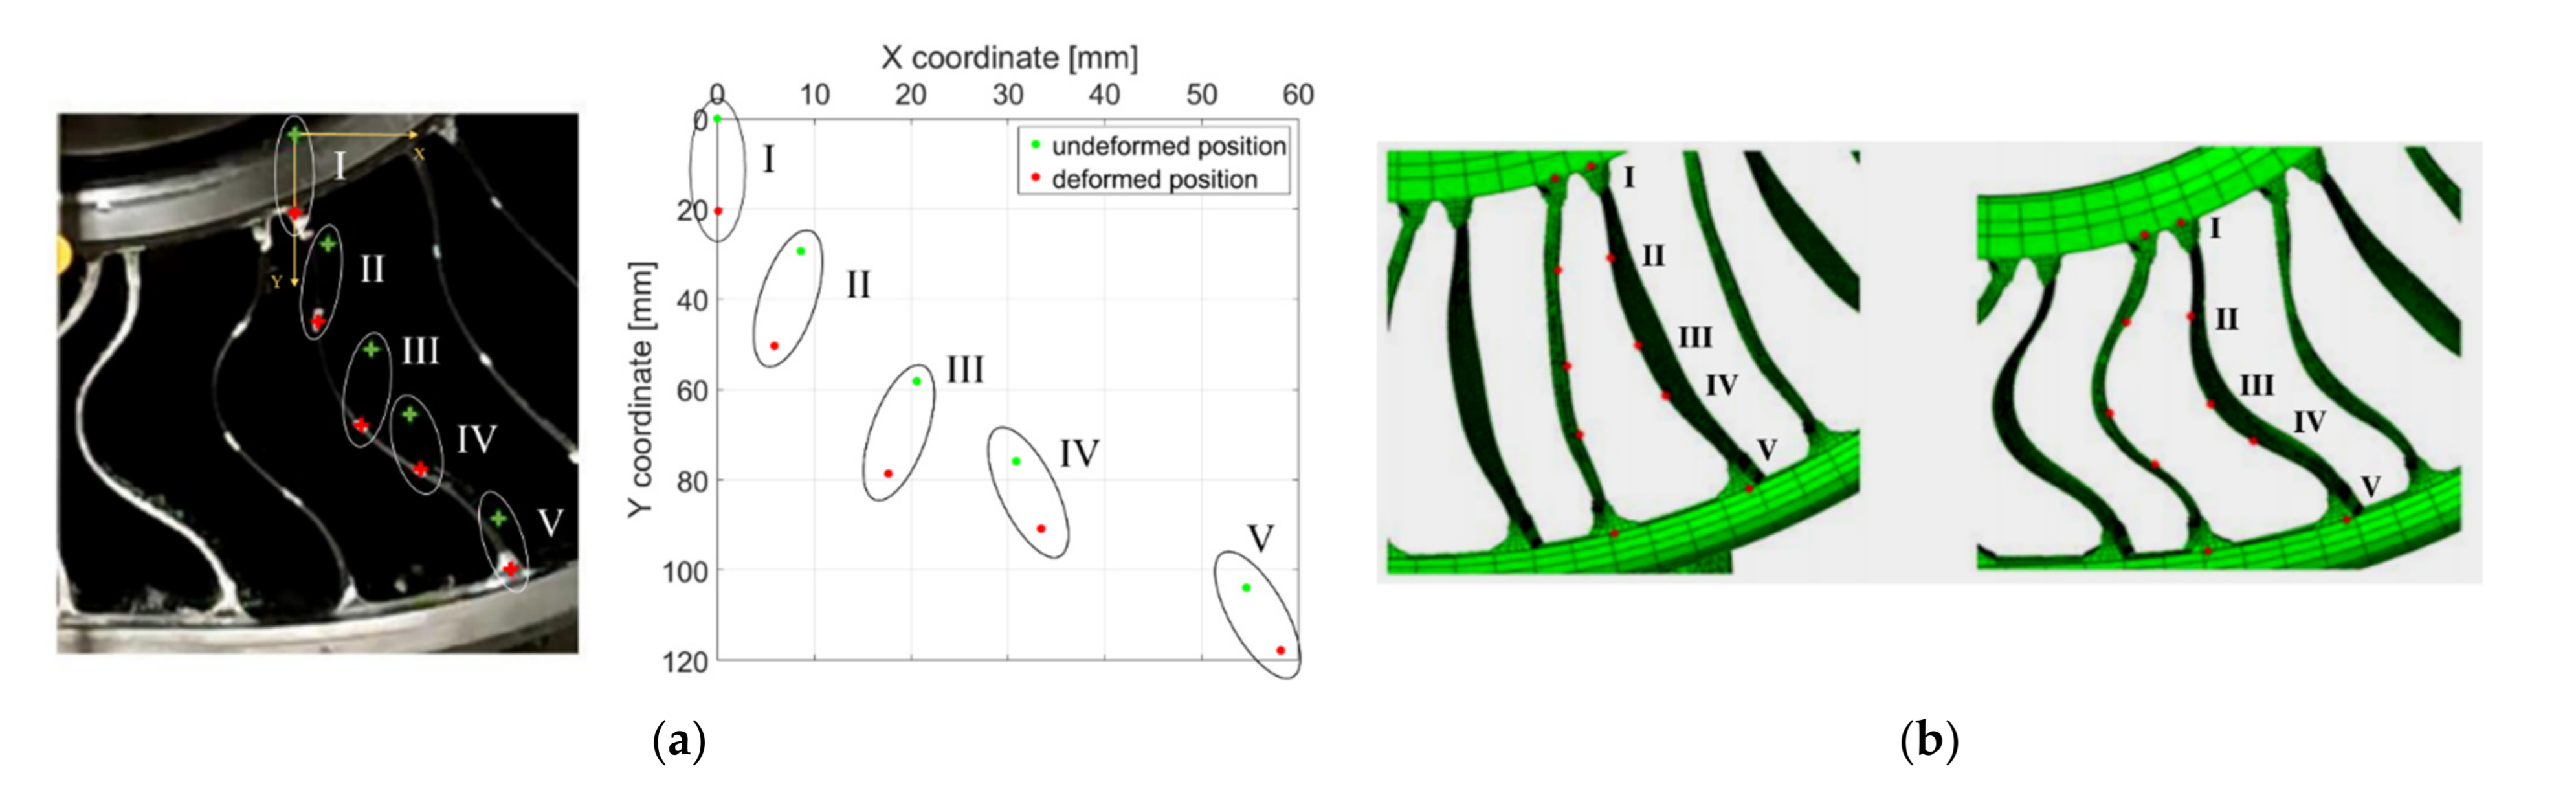
The spokes deformations were compared with the ones obtained from the application of the DIC method. It was performed on three pairs of spokes but, in this paragraph, we present the results of only one to show the methodology applied. On each spoke, five reference points (I–V) were chosen to investigate the deformation in specific points. In
Figure 11a, the deformed shape of the NPT is shown with the red markers representing the position of the points of interests after the deformation, whilst the green before, both on the tire and on a coordinate axis system placed on a plane normal to the optical axis of the camera sensor and with the origin corresponding to the undeformed position of the first marker. The same was done in the FE model, querying the displacement of the nodes that in the model represent the markers, as shown in
Figure 11b. In
Table 3, we report the values of the displacement of each marker, along the x and y direction of the coordinate axis system previously defined and shown in
Figure 11a, obtained experimentally with the DIC tool and numerically with FEA and compared with the calculus of the percentage error, found as follows:
The largest displacement in the X direction was experienced by the III point, since it is placed in the middle of the spokes where the bending is higher. Instead, the largest displacement in the Y direction was found in the first points, being directly under the load application. The DIC tool validated the FE model realized to model the spokes since the values of error found, caused by the discretization of the spokes in the FE model that did not allow to place the markers in the exact same positions occupied in the experimental phase, are within the target values set for all the spokes analyzed with the DIC tool.
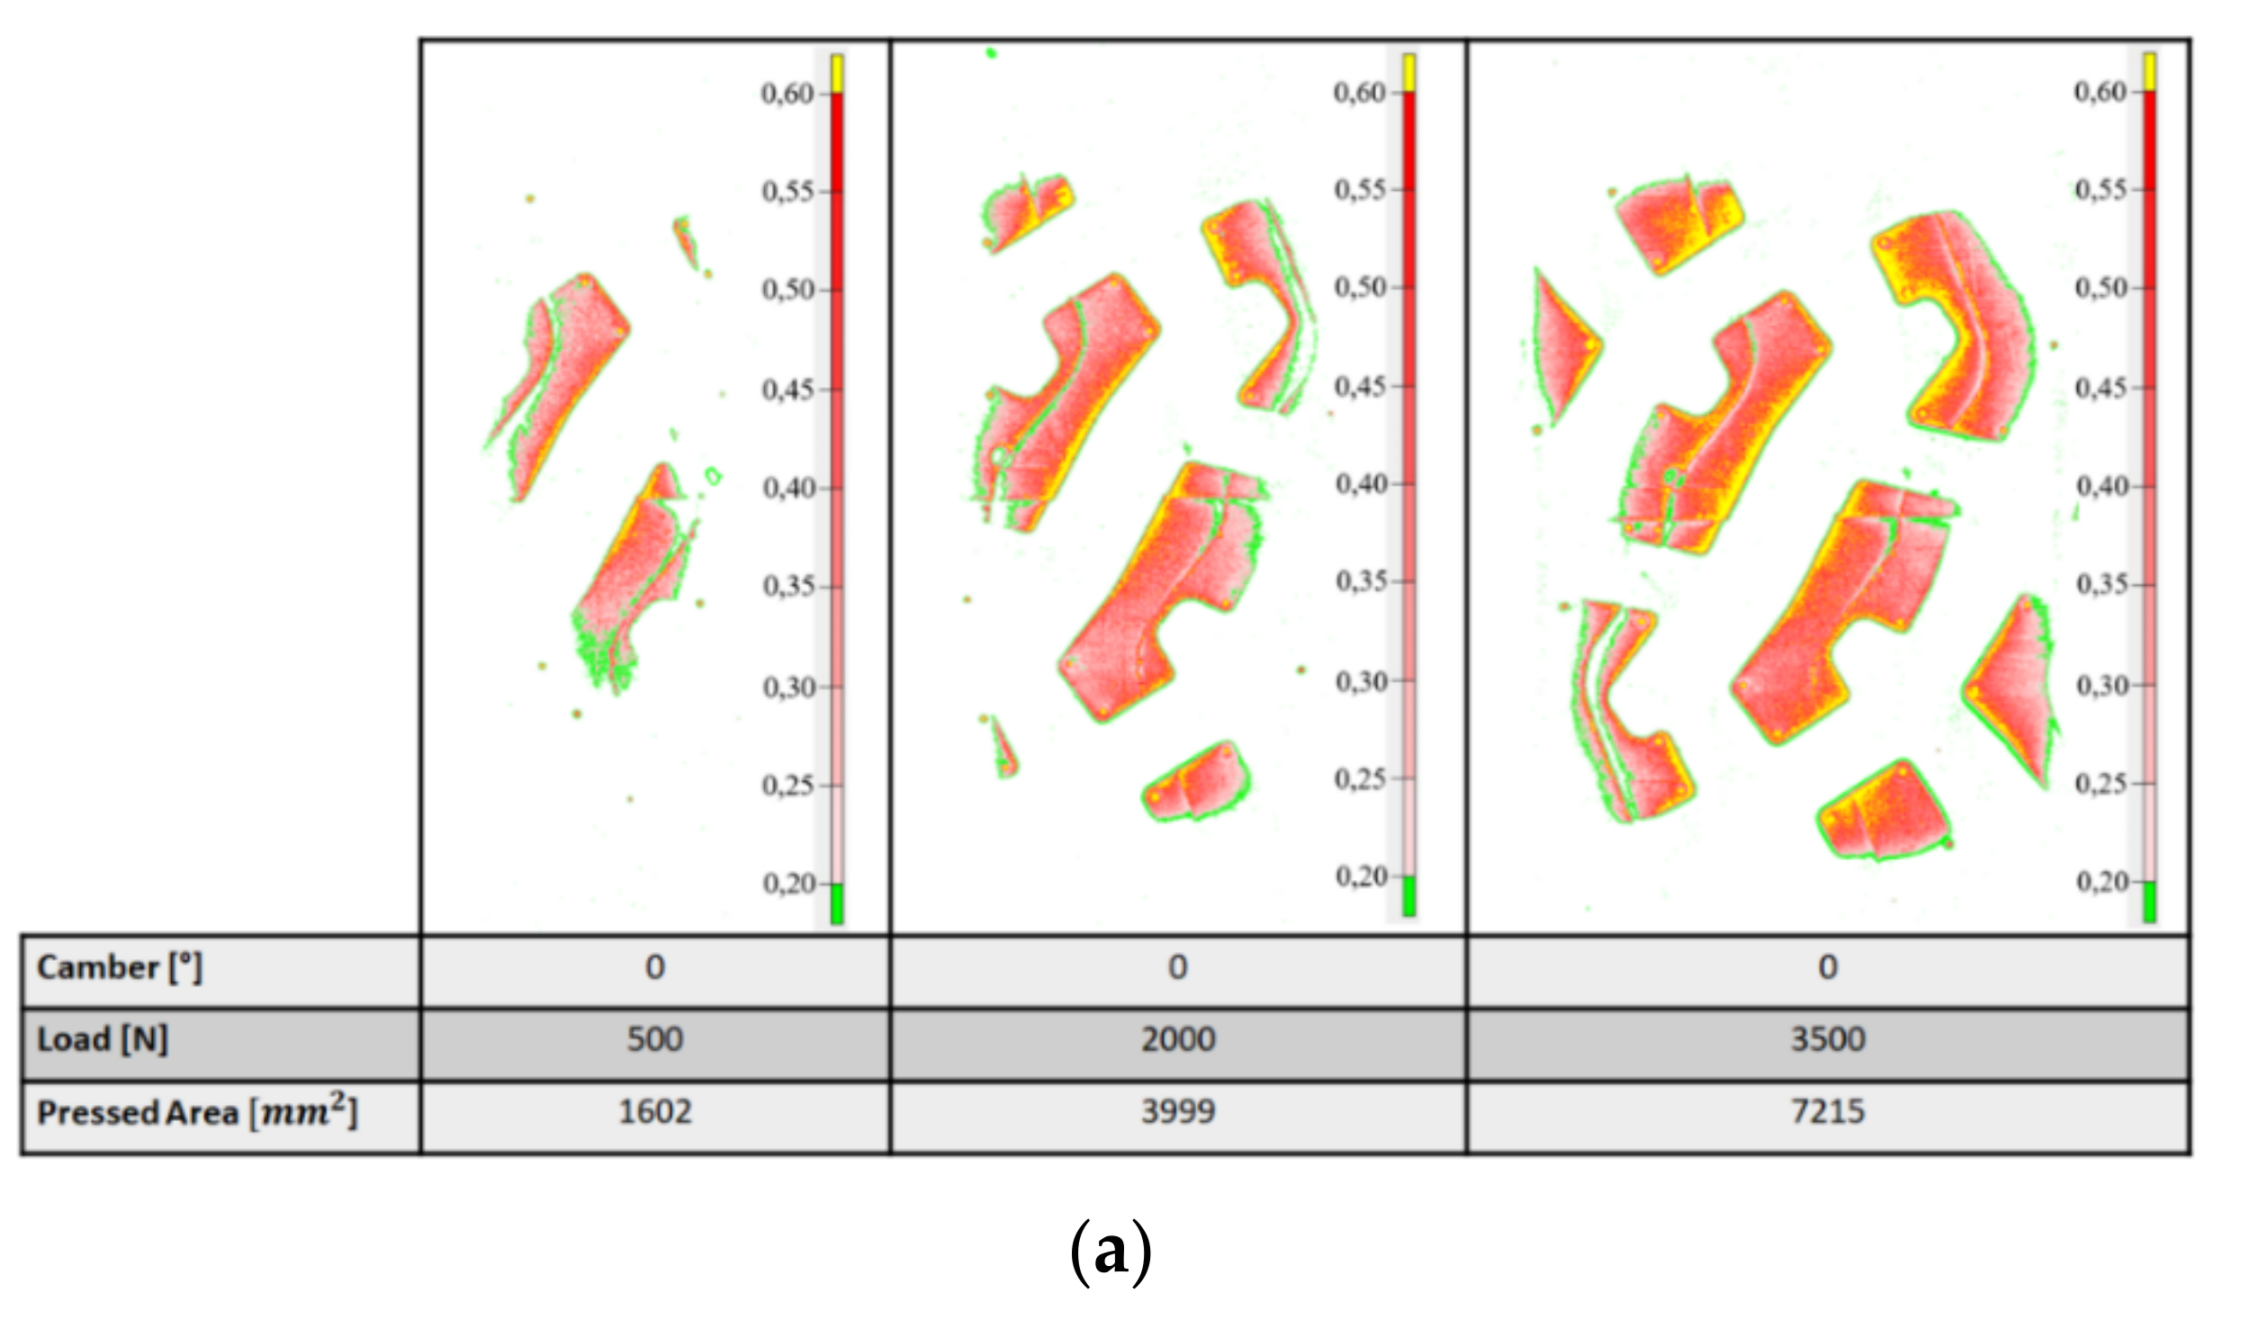
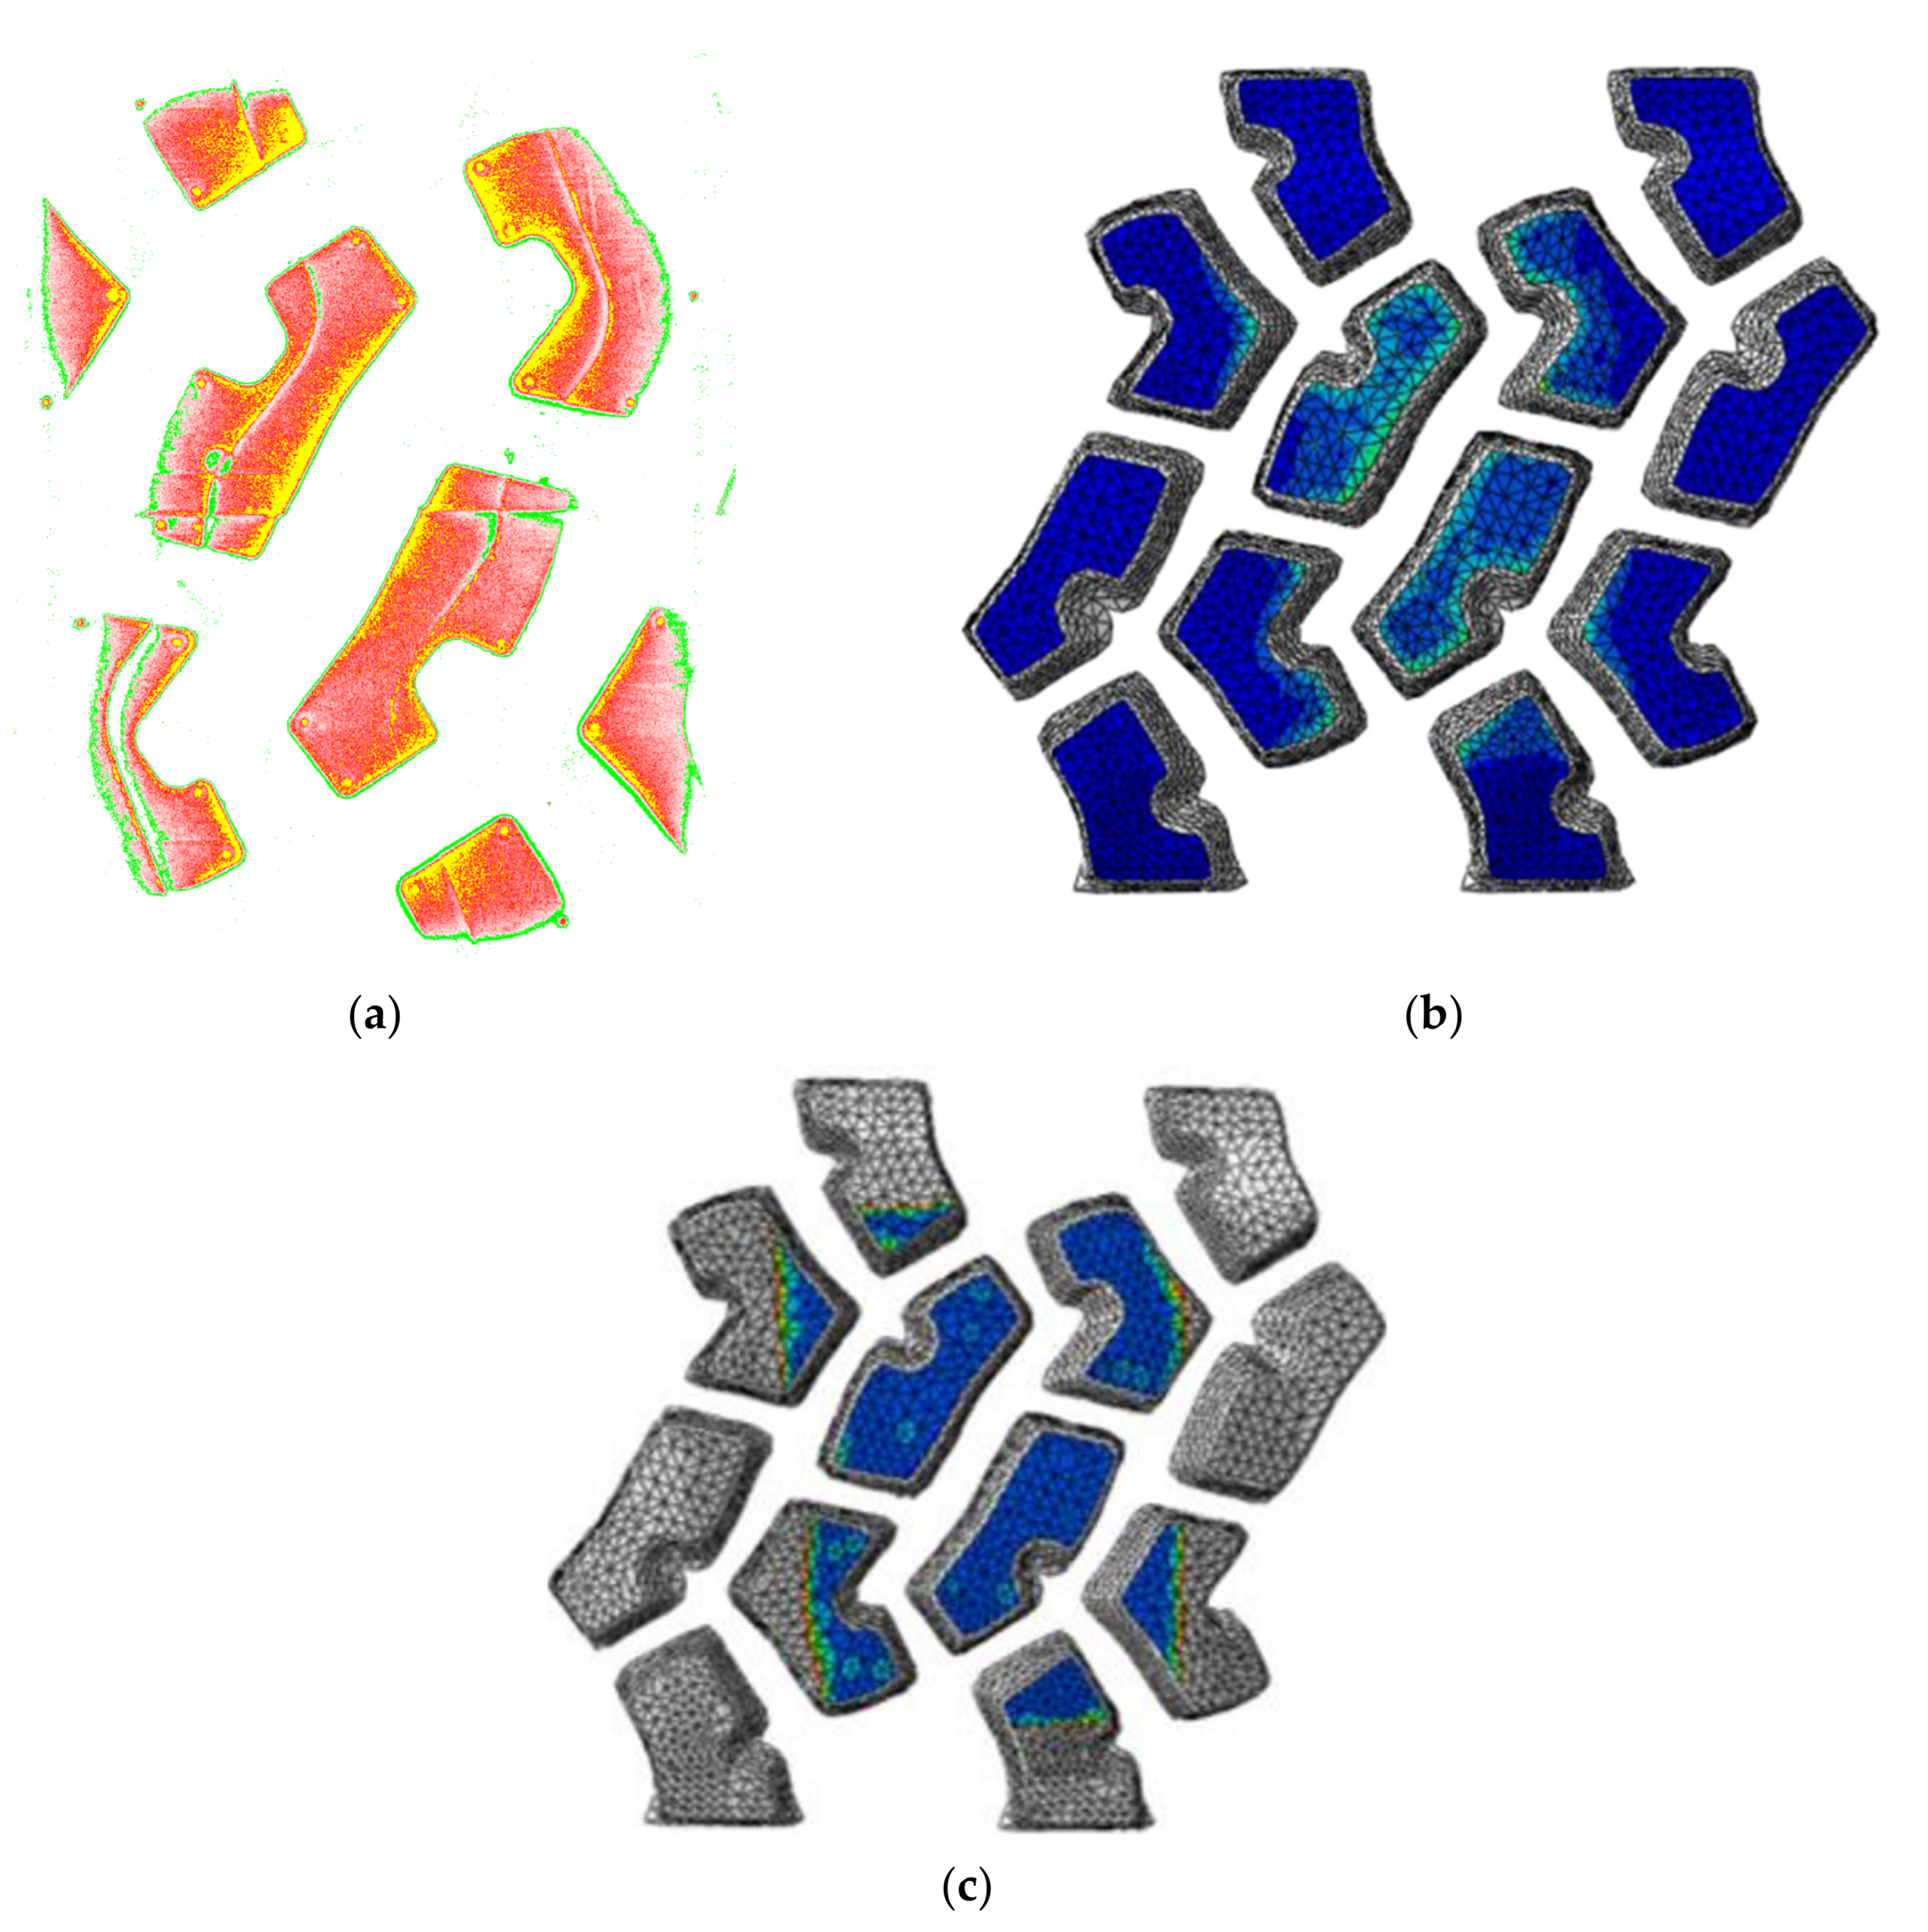
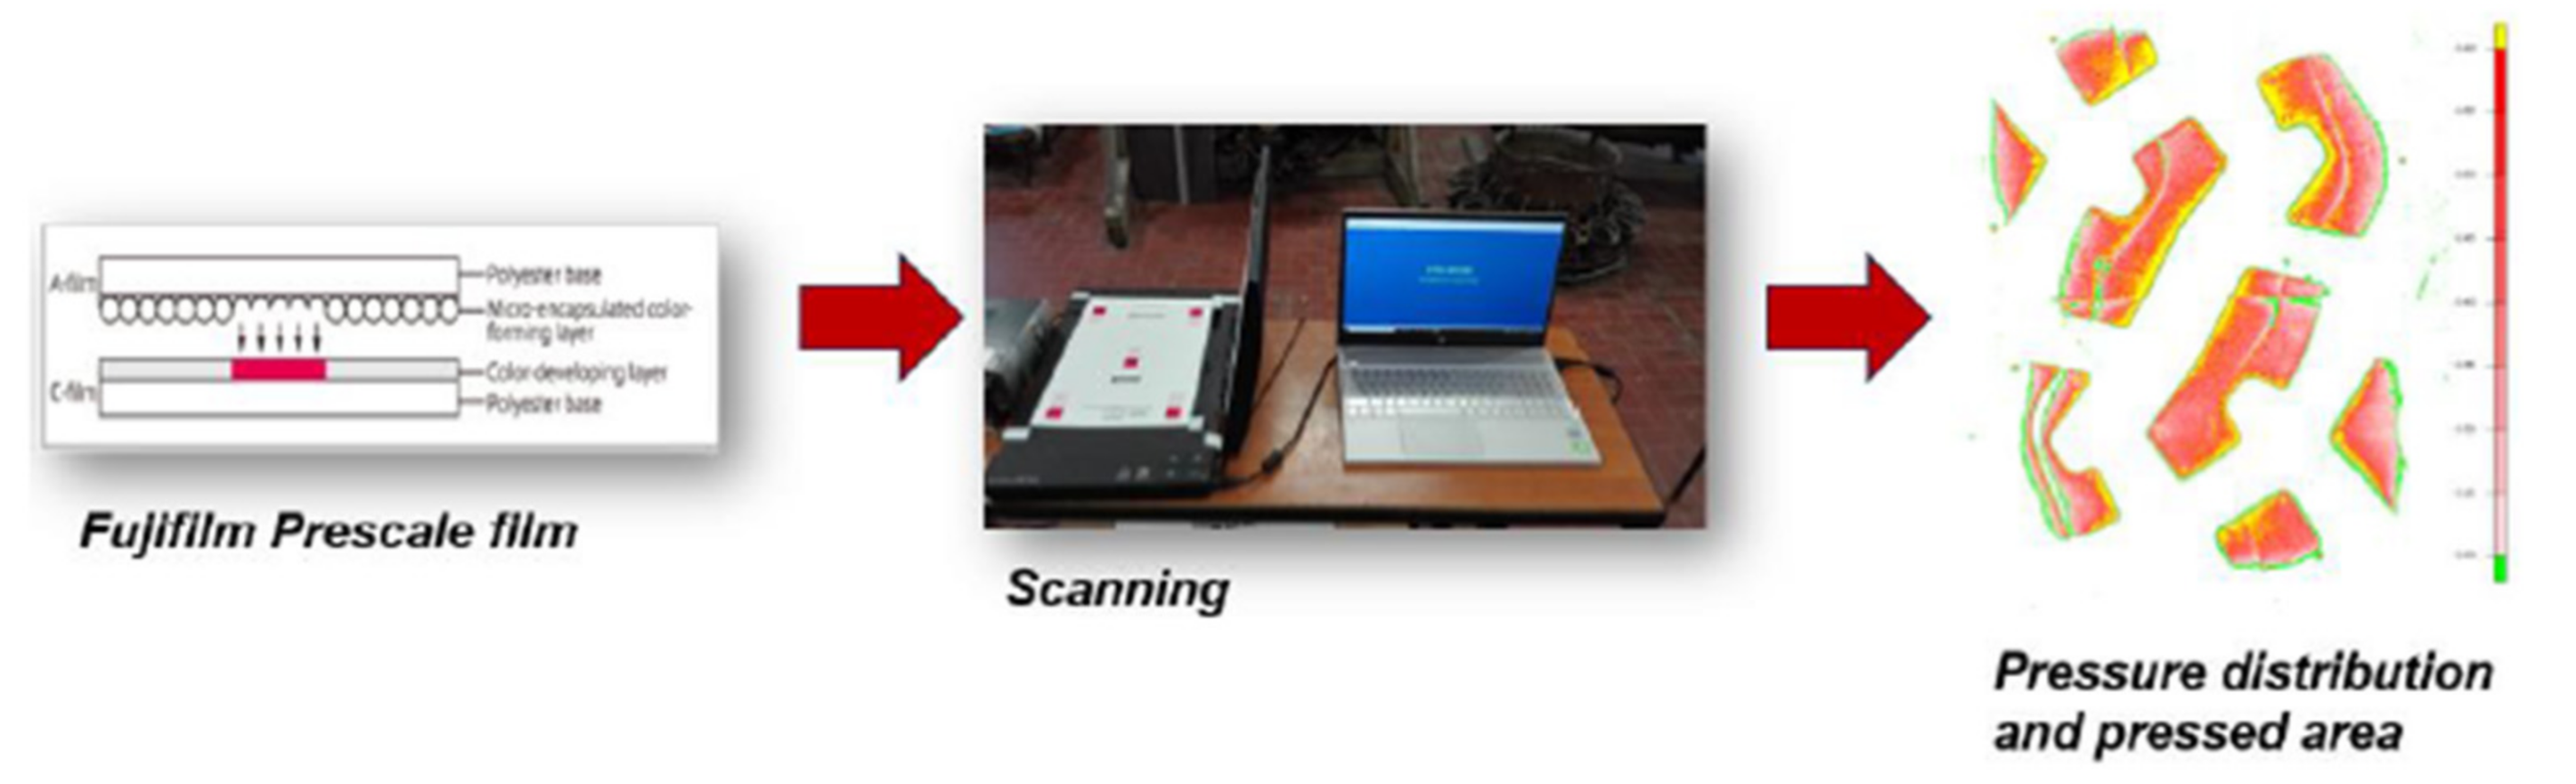
For what concerns the contact patch, the footprint shows the same agreement as the previous comparisons. In
Figure 12a,b is represented the pressure distribution of the contact patch of both experiments, one obtained with the pressure sensitive film during the experimental step, and one obtained with FEA. The FE result shows the same distribution of the experiment, with the pressure peaks detected in the same points indicated by the yellow area in the film. In
Figure 12c is shown the contact opening between the tread and road surfaces, in which the blue color is representative of the contact condition whilst the red color is the detachment. Further, in this case, the extension of the contact area obtained with FEA matches the experimental one. Particularly, the contact area obtained with the experimental activity is 5495.26
, whilst the contact area obtained with FEA is 5136.42
, with a percentage error of 6.53%.
4. Dynamic Study: Steady State Analysis
The phenomenon of rolling structures can be studied in a steady or transient state. Although the transient analysis allows to simulate the rolling, imposing directly the value of acceleration, the computational cost is very high. Therefore, the steady state analysis, using a specific kinematic formulation to describe the phenomenon, shows a less-expensive computational cost, though it needs some mesh requirements. In this paragraph, we introduce the kinematic description at the basis of the steady state transport analysis—a specific procedure of the Abaqus environment [
26]—and the guidelines for the creation of a FE model capable of meeting its requirements explained.
Only in recent periods, in FE codes, objects with complex geometric shape were allowed to undergo the steady state simulation. Korunovic et al. [
27] showed the approach to submit a pneumatic tire with a detailed tread pattern to a steady state analysis. This analysis was also applied to NPTs. Deng et al. [
28] simulated the steady state rolling of the “MEW”—the NPT with a slick tread developed by Zhao Y.—obtaining a good match between the experimental and FEM analysis results, for what concerns the graph of longitudinal force vs. slip ratio and contact patch.
The mathematical formulation behind this analysis forced the construction of a FE model with a methodology different from the one shown in the static analysis and this step was also complicated by the complex geometry of the case study.
In fact, the model must be generated starting from the rotation of a bidimensional surface or three-dimensional sector along about an axis. This requirement is a consequence of the peculiar kinematic description of the phenomenon that removes the time dependence in favor of a spatially dependent analysis, using specific coordinates. The rolling movement of an axisymmetric body is described in a reference frame that moves with the ground motion of the body and, in this moving frame, the rigid body rotation is described in spatial or Eulerian manner whilst the deformation in a Lagrangian manner, introducing the requirement of continuous lines in the circumferential direction—streamlines that define a static mesh in which the material can flow. In this case, the presence in the circumferential direction of voids between the spokes and the treads can cause nonconvergence issues because, during the rotation, the elements of these components leave the mesh defined in the static step. To overcome this problem, the spokes and the treads cannot be meshed individually, as was made for the static analysis, but together, with the inner and outer ring for the spokes and the shear band for the treads. Thus, all nodes and elements at the interface of these components must be the same and equivalenced without any kind of discontinuity. In this way, the elements and nodes of the inner and outer ring can easily flow inside the streamlines thanks to their cylindrical geometry and can transmit the deformation status to the elements and nodes of the spokes. The same is for the tread blocks.
With the previous guidelines, the FE model of the NPT was made, revolving a single sector, shown in
Figure 13, along the tire axis. It is recommended to choose the sector with the smallest angle to be as close as possible to the revolution of a bidimensional cross-section. In this case, the sector has a 60° extension due to the repetition pattern of its elements. In fact, the single pair of spokes has an angular extension of 15° whilst the tread pattern repeats itself every 20°. The meshing process of the components was the same as the one shown before, aside from some changes in the spokes modeling. In addition, the constraints and the boundary condition applied were the same as the static analysis, including the value of friction coefficient imposed between the road and tread surfaces equal to 0.8.
As was explained at the beginning of this chapter, the spokes were meshed with the inner and outer ring. Unlike the model used in the footprint analysis, the spokes here were modeled completely with 8-node linear solid elements instead of shell.
Steady State Analysis
The rolling simulation consisted of two main steps: in the first step, the FE model was built rotating the 60° sector and the footprint analysis was reproduced imposing the same vertical displacement of the static tests (20 mm). The static footprint is an essential requirement for the second step, in which the steady state analysis was performed. The first simulation step is fundamental to check if the radial stiffness of the FE model built for the dynamic simulation matches the one of the FE model built for the static characterization, verifying that it behaves the same way. This check was carried out calculating the percentage error between the values of Forces obtained for homologous values of Displacements for the two different models, finding that the maximum value of percentage error was 6%.
The computational cost of the footprint analysis for this model was higher than the one previously described due to the modeling of the tread along the entire circumference of the tire and the modeling of the spokes with 3D elements that led to a higher number of elements and nodes. In fact, the previous FE model was constituted by 139,543 nodes and 129,042 elements, whilst the model created for the steady state analysis was made up of 274,984 nodes and 805,836 elements. Once the footprint analysis was realized, the steady state analysis was performed. At first, it was mandatory to define the longitudinal velocity of the center rim and the angular velocity of the tire, the value of which is found by means of an iterative process. In the free rolling motion, the following equations are verified:
where
is the speed of the center of the rim,
is the angular velocity of the tire,
is the effective rolling radius of the tire,
is the longitudinal force, and
is the torque. When the simulation is set, both
and
are unknown and the only input is the longitudinal velocity
, set equal to
. The iteration started with an approximated value of
obtained using the following equation deduced from geometric consideration [
29]:
where
is the nominal radius and
is the vertical deflection imposed in the footprint analysis. This equation gives a first attempt at effective rolling radius
equal to 323.4
and from the first equation of (2) can be derived an angular velocity
of 8.6
. With these inputs, the simulation was set imposing at first, an angular velocity of 7.7
, and subsequently, it was varied to a value of 9.7
. Covering this range of values of angular velocity, the one corresponding to a value of longitudinal force
equal to zero will be the angular velocity of free rolling condition. In
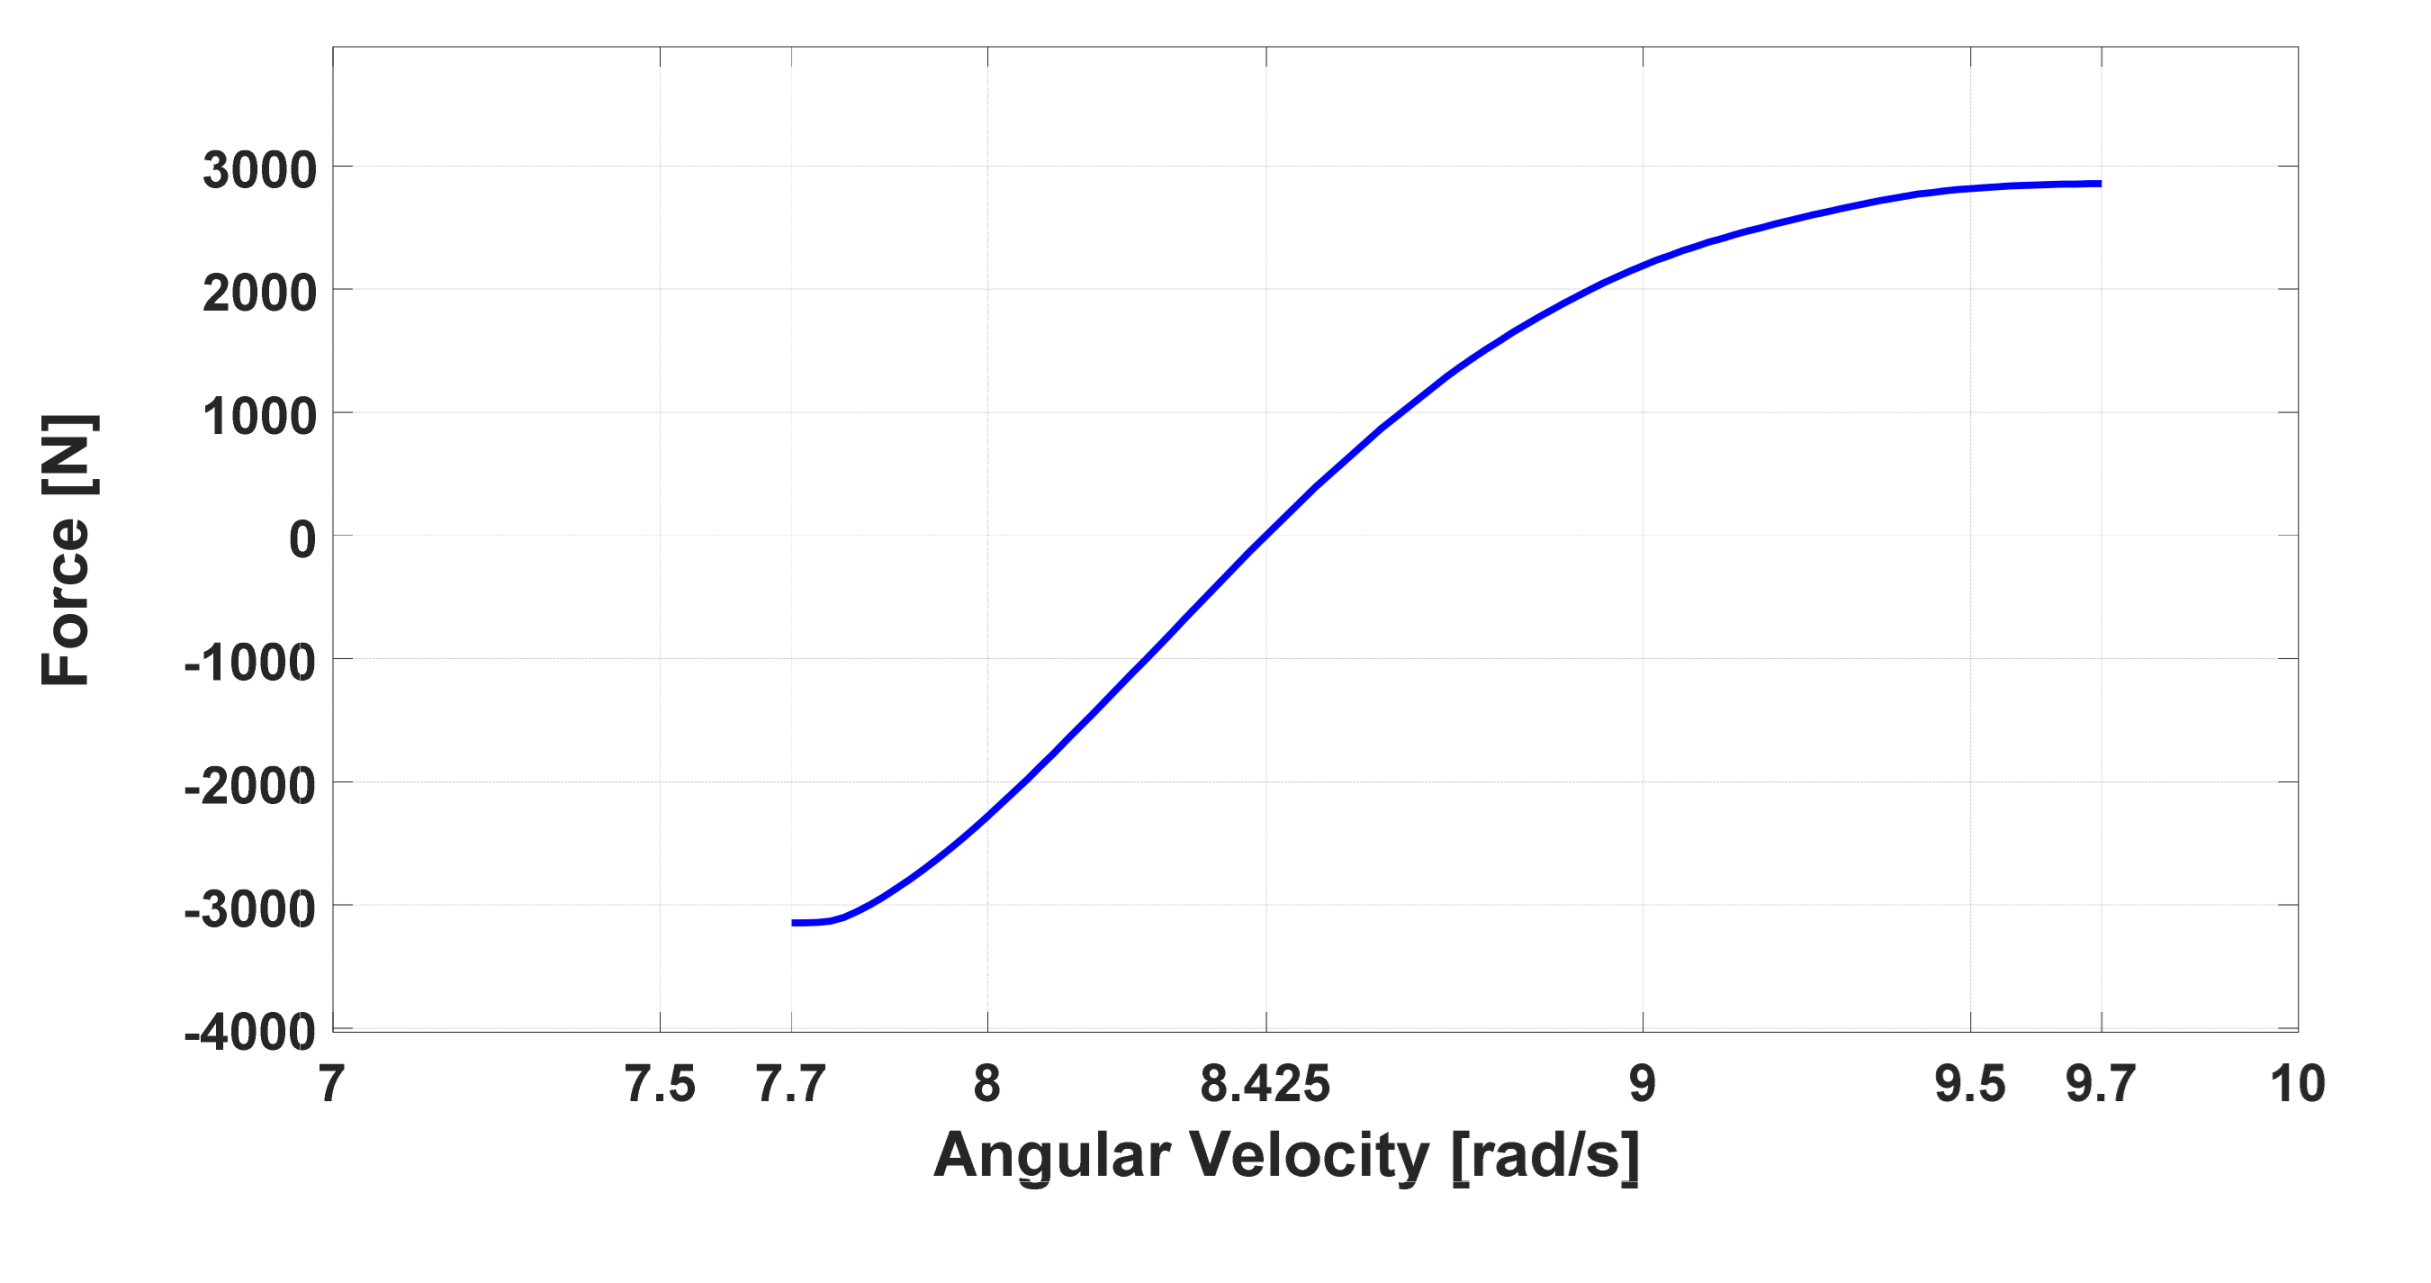
Figure 14 is represented the longitudinal force
vs. the angular velocity
diagram, from which can be observed that
is zero for an angular velocity of 8.425
. For the first Equation (2), the effective rolling radius
is
where the velocity
of 10
was transformed into
.
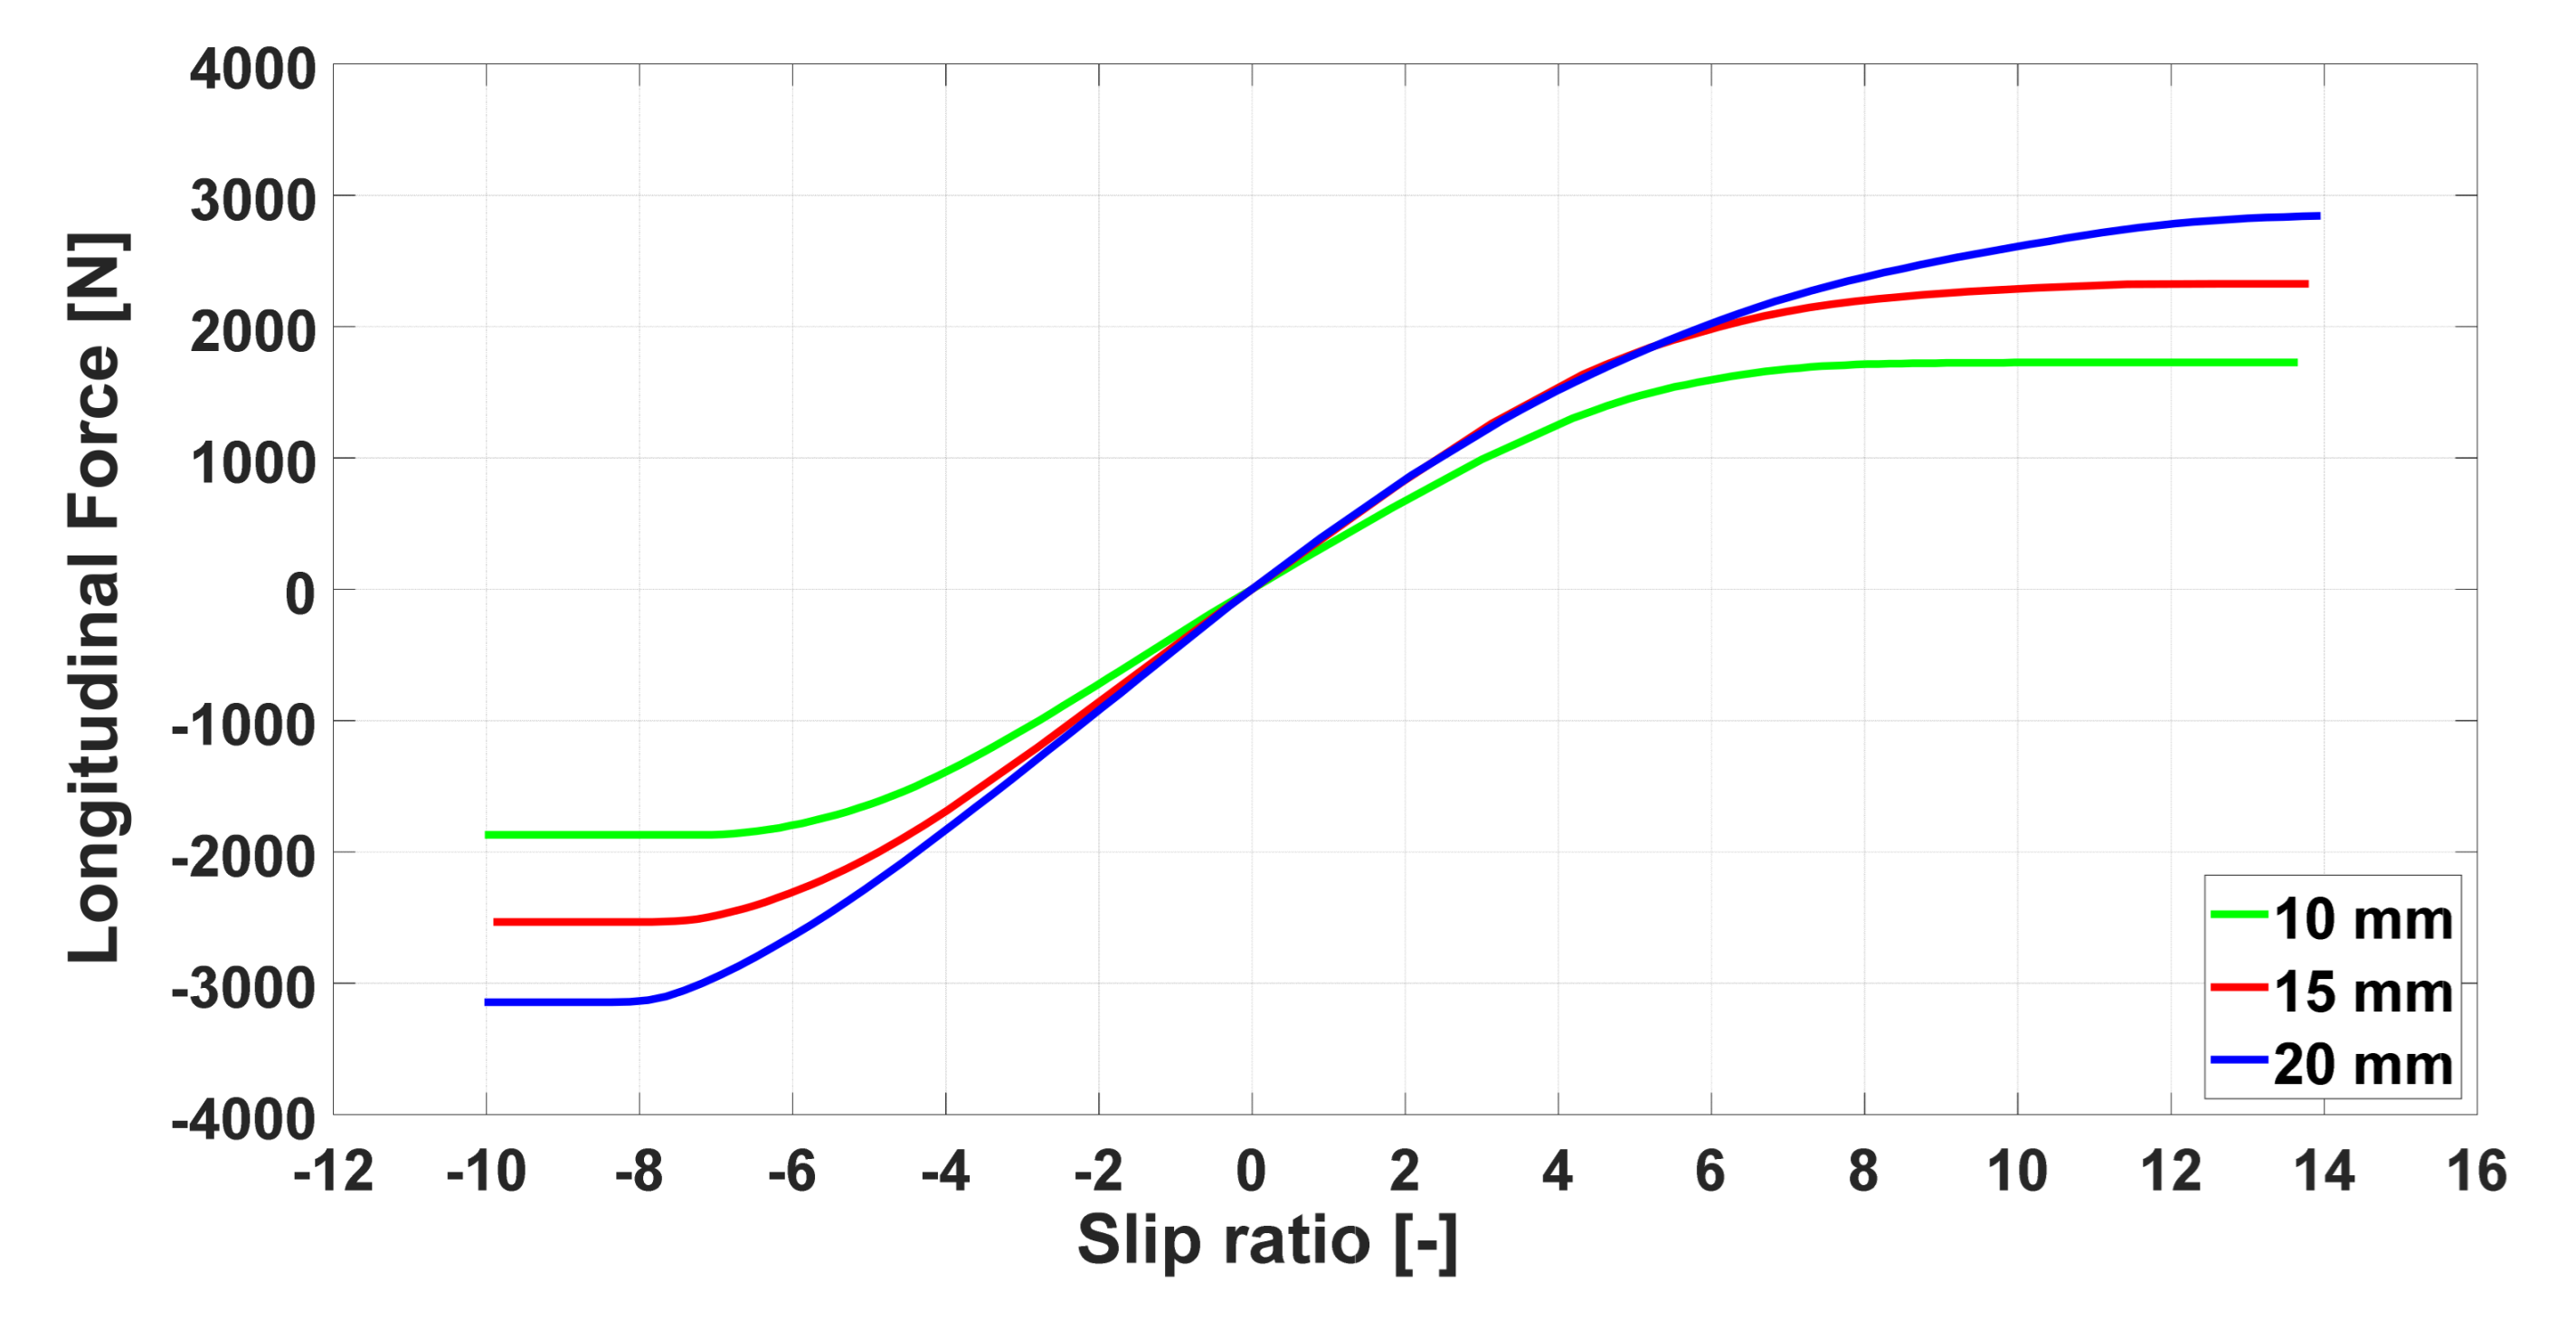
The effective rolling radius is necessary also for the slip ratio definition:
with which it is possible to define the longitudinal force vs. slip diagram, shown in
Figure 15 for three different values of vertical deflection. The diagrams are not symmetric with respect to the y-axis, representing a different behavior in braking and driving condition. Nevertheless, the linear trend lasts until the slip ratio reaches the value of about −5% and 5% for all the conditions, before reaching the nonlinear shape and the plateau for higher values of slip ratio.
The results of the simulation also showed a peculiar aspect regarding the vertical reaction, the index of the radial stiffness of the NPT, as a function of the slip ratio. Observing
Figure 16, it is possible to note the variation of the vertical reaction with the slip ratio for a
longitudinal speed. This diagram highlights two interesting features of the dynamic behavior of the NPT: 1—In free rolling condition (slip ratio equal to 0), the dynamic stiffness decreases as soon as the tire starts rolling, according to the Pacejka studies on pneumatic tires [
30]; 2—the vertical reaction presents a lower value at zero slip than the one calculated in static condition and then it grows with the slip ratio, in a nonsymmetric manner for negative or positive value of the slip ratio. The latter result could be explained analyzing the spokes’ deformation. During the nonzero slip conditions, the spokes are tensioned by the relative motion between the shear band and the hub, stiffening the vertical reaction.
Moreover, the nonsymmetric shape of the spokes in radial direction induces a different deformation for negative or positive values of slip ratio, as showed in
Figure 17, where the deformed shapes corresponding to the braking and driving states are reported, overlapped to highlight the differences. During braking, the spokes placed inside the contact patch exhibited a translation to the left in the opposite direction of motion, which in these figures, is from left to right. This deformation is caused by the relative velocity (slip velocity) existing between the road and the tire. The opposite happens for the driving condition, as can be imagined, with the spokes being deformed to the right.
5. Conclusions
The purpose of this paper is to present the development of a methodology capable of characterizing both statically and dynamically a non-pneumatic tire by means of experimental activities and numerical simulations. The methodology provides for the digital acquisition of the shape of the NPT, in this case, the Michelin X-Tweel UTV chosen as reference, realized using the 3D scanner FARO CAM2 Edge ScanArm HD that allowed us to subsequently obtain the exact geometry used to build the FE model. The footprint analysis of the NPT was realized in the DII department of Federico II University of Naples, obtaining the radial stiffness and the contact patch pressure distribution. From the output of the 3D scanning operation, a FE model of the reference tire was built and submitted to the footprint analysis using FEA. The numerical simulations showed a good agreement with the experimental data, with regard to the radial stiffness and spokes deformation, for which a study was performed with DIC technique. Once the model was statistically validated, a steady state analysis was performed on a FE model specifically built for this simulation, studying the rolling at a velocity of 10 km/h. From the simulation, the effective rolling radius, the longitudinal force vs. slip ratio graph, and the vertical reaction vs. slip graph were obtained, allowing us to perform an analysis on the longitudinal interaction and the dynamical behavior.
The methodology, composed of both an experimental and numerical method, allowed us to obtain interesting results in the static and dynamic characterization of complex objects such as NPTs. However, it is affected by some limitations. The simulation of the dynamic condition was realized through the steady state analysis, which does not allow the study of transient state in which important effects occur. Furthermore, the numerical approach needs a set of information regarding the geometry and materials of the object of the simulation that force the reverse engineering approach to be obtained if they are not possessed, leading also to destructive operations.
Further studies will be focused on the effect of different camber values on the longitudinal characteristic of the NPT, the application of the methodology to the study of lateral dynamics, and to the outdoor validation of the obtained results.


