Abstract
In photoacoustic imaging, the use of arrayed laser sources brings several advantages. Acoustic waves can be generated with flexible control of wavefronts, bringing functionality such as ultrasonic beam steering and focusing. The use of arrays reduces the optical intensity while increasing the strength of the ultrasonic wave, bringing the advantages of improved signal-to-noise ratio (SNR) while avoiding laser-induced damage. In this paper, we report a numerical model for studying the generation and shaping of acoustic wavefronts with laser arrays. The propagation of mechanical waves, photoacoustically generated by thermal expansion, is simulated and discussed in detail. In addition, a partially delayed distributed array is studied both theoretically and quantitatively. The developed model for wavefront control through time-delayed laser pulses is shown to be highly suited for the optimization of laser array generation schemes.
1. Introduction
Photoacoustic imaging as a non-invasive detection technology has been widely used in biomedical imaging [1], nondestructive testing [2], and other fields. Due to the thermoelastic effect [3], when a laser beam irradiates a sample, optical absorption in the material causes the light energy to initiate thermal expansion, resulting in deformation of the illuminated area and its surroundings. If the illumination is a fast transient pulse or if the light is modulated periodically, then the material and its surroundings deform correspondingly, thereby generating an acoustic wave.
In photoacoustic imaging, structural features or defects in the object can be characterized by detecting reflections or other perturbations in the ultrasonic waves. The spatiotemporal features of the ultrasonic wave are related to those of the incident laser light, but although an intense beam can generate strong acoustic waves, it may damage the material. However, laser intensities far below the damage threshold generate acoustic waves that are relatively weak. The signal-to-noise ratio (SNR) of the reconstructed image can be quantitatively expressed as
where S is the photo-generated ultrasound intensity, γ is the sensitivity of the detector, A is the imaging area, P is the number of projections, M is the number of signal averages, and N is the noise floor of the system [4]. Thus, if the excited ultrasound signal intensity, which is proportional to the optical energy, is reduced by a factor of K, to recover the SNR, averaging over K2 times is needed. Therefore, in order to obtain a higher SNR, researchers tend to increase the magnitude of the generated photoacoustic signal. In current biomedical photoacoustic imaging research, to enhance the imaging quality or increase the imaging depth, the laser pulse energy density used in the experiment is usually higher than the ANSI specified threshold of 20 mJ/cm2 [5], which can result in ablation of the tissue [6,7]. It is vital to explore methods for generating strong acoustic waves using energy densities below the laser ablation threshold. To achieve efficient photoacoustic wave generation, Murray et al. used a continuous wave laser with intensity modulation to excite ultrasound waves [8], which greatly improved the SNR and simultaneously kept the sample surface intact. However, this method resulted in the generation of multiple acoustic modes and reflected waves, and interpretation of the signals was complicated. Huang et al. proposed a photoacoustic method that uses a laser array instead of a single light source to excite acoustic waves [9], which increases the intensity of the ultrasonic wave without increasing the energy density illuminating the sample surface.
Research of Matt Clark’s group demonstrated that waves can be focused and steered using a spatially distributed laser source, with a spatial light modulator or specially designed computer-generated holograms [10,11,12,13]. They also developed a method using laser-induced phased arrays (LIPAs) to detect defects in metals and provide in-process monitoring during additive manufacturing (AM) [13,14]. It has also been shown that temporal control of the elements in a linearly arrayed laser source is an efficient way to enhance the intensity of the generated acoustic wave or steer the propagation direction [15,16,17,18,19,20,21]. Although wave steering and signal enhancement by controlling the spatial or temporal distribution of the generated laser source have been demonstrated, the method for manipulating the wavefront of a laser-generated acoustic wave is still uninvestigated.
The use of acoustic metamaterials to manipulate the wavefront of propagating acoustic waves from various sources has been proposed and developed. However, it is difficult to apply these to laser-generated acoustic waves due to the operation bandwidth and the requirement of the wave to be transmitted through or reflected from the meta-surface.
Beamforming of acoustic waves through array sensors has been widely used to improve the contrast, spatial resolution, and signal-to-noise ratio of ultrasound images. Based on our understanding of previous research, two categories of techniques are conceptualized as the beamformer approaches, either at the excitation-side and the probing-side of acoustic waves.
The traditional probe-side beamforming method achieves the purpose of signal enhancement by processing the received signal from the perspective of signal acquisition rather than directly generating stronger acoustic signals from the perspective of excitation. This is a fatal flaw in extremely absorbent biological tissues.
Traditional probe-side beamformer methods include the delay and sum (DAS) method [22], the minimum variance (MV) method [23,24], etc. The principle of these methods is to align the target beams according to the delay time and add them sequentially to enhance the signal. DAS is independent of echo data, which leads to the main lobe width being too wide and the side lobes intensity being too high [24]. The minimum variance (MV) method, e.g., adaptive beam synthesis, calculates a dynamic weight value based on the echo data, makes full use of the characteristics of the echo signal, reduces the side lobe signal, and improves the resolution of the image. The basic principle is to minimize the array output by keeping the gain in the desired direction constant.
For traditional excitation-side forming, Von Ramm et al. achieved beam steering and enhancement by applying a time delay to each piezoelectric plate in an 8-element line array [25]. The distance between the line sources is about one wavelength. The delay time is controlled by the line source spacing and rotation angle.
Shi-Chang Wooh [26] proposed that a larger inter-element spacing can help improve the directivity of the steered wave, yet only to a certain extent; the grating lobes will be introduced (or the beam is not steerable) when the inter-element spacing exceeds its critical value, which is about half the wavelength of the sound wave and controlled by the desired maximum steering angle.
The traditional excitation-side beamformer can achieve controllable superposition between different sources, thereby achieving high-degree-of-freedom beam direction control. In principle, it can also achieve the wavefront formation and control discussed in this article. However, a systematic study of the process of exciting, shaping, and steering photoacoustic waves using laser array sources is therefore still essential. The purpose of this article is to explore whether it is feasible to realize the formation and control of the wavefront in the process of photoacoustic excitation, as well as the mechanism of its formation and propagation.
In this paper, the characteristics of surface and bulk waves excited by a laser array with partial time delay are numerically simulated using the finite element method (FEM). We verify whether, by applying a time delay between different elements of the laser array, the photoacoustic wave can be enhanced and whether this enhanced wave still propagates as a wavefront maintaining its complete shape.
2. Theoretical Model and Simulation
2.1. Numerical Simulation
Both the finite element method (FEM) and finite-difference time-domain (FDTD) method can be used to model the process of light-excited acoustic waves. In terms of computational speed, FDTD has a great advantage. However, considering the complexity of photoacoustic imaging, the FEM method was selected as it is more versatile and rigorous.
Three configurations for exciting photoacoustic waves were simulated, namely single-pulse single-point excitation (Model 1), single-pulse laser array excitation (Model 2), and laser array with time-delayed excitation between spots (Model 3). Except for the number of excitation light sources and the time delay between the spots, other parameters in the simulation remained unchanged, including the sample size, material, energy density, and pulse duration.
The modeled sample was a homogeneous, isotropic cylindrical aluminum block with a height of 4 mm and a radius of 4 mm. The laser array was incident perpendicularly to the top surface of the cylinder. Material parameters of aluminum from reference [27] were used for the simulation, with a surface wave sound velocity of 2940 m/s, a transverse wave sound velocity of 3080 m/s, and a longitudinal wave sound velocity of 6320 m/s. A laser source was used to generate the ultrasound, with a pulse width of 20 ns, pulse energy of 160 µJ, and energy density of 510 mJ/cm2. The laser spot radius on the sample surface was 100 µm, and it was assumed that 80% of the light was absorbed. Figure 1 shows the aluminum cylinder in the Cartesian coordinate system, with three laser spots A, B, and C focused on the top surface. The simulation used the solid heat transfer module and the solid mechanics module of COMSOL Multiphysics to simulate in the transient field
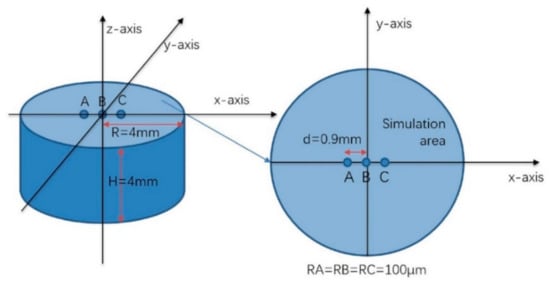
Figure 1.
Cylindrical aluminum block and the three laser illumination spots A, B, and C on its top surface.
Model 1 and Model 2 were used as reference simulations to compare with Model 3. In Model 1, a single excitation pulse was used to illuminate the single spot “B”. Model 2 was based on Model 1, with excitation spots “A” and “C” added on either side of the single laser spot B. The size and energy density of these three laser spots were the same as for Model 1. As shown in Figure 1, through pre-simulation results, the distance between adjacent laser sources was selected as 0.9 mm, which is about one wavelength of the excited acoustic wave. Model 3 was based on Model 2 with a time delay imposed on the central spot B. It can be seen from the geometric properties of the propagation of acoustic waves in Figure 2a that as the waves propagate, the difference between d1 and d2 becomes smaller. When the distance between adjacent sources is much smaller than d1, and the wavefront has traveled sufficiently far, δd = d2 − d1 < ε × v. ε is defined as the allowable time error, which is chosen to be as same as the simulation time step, i.e., 0.01 µs, v is the velocity of the excited acoustic waves. During this time, the acoustic wave travels about one-tenth of the acoustic wavelength. The new merged wavefront due to superposition can be considered as a continuous wavefront that can propagate in an infinite medium.
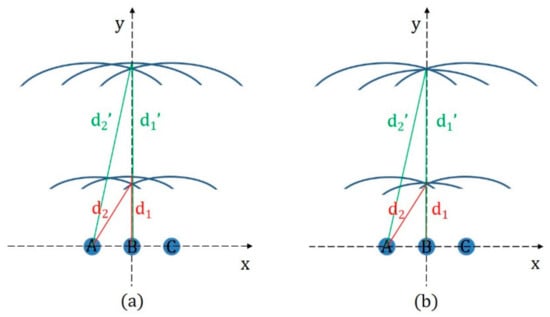
Figure 2.
(a) Schematic diagram of laser array excitation with no time delay between pulses. (b) Schematic diagram of laser array excitation with a central pulse (B) delayed.
The distance Y at which the superposed acoustic waves add constructively on the y-axis can be calculated from
where L is the distance between adjacent sources, and ε × v is the maximum acceptable error. In Model 2, the distance Y for acoustic waves without a time delay was calculated to be 13.5 mm, which is larger than the size of the sample. The corresponding traveling time is about 4.5 µs, calculated from the velocity of the surface acoustic wave. Furthermore, using this arrangement in practical applications would make it difficult to image features such as defects or impurities within the sample.
Y2 + L2 = (Y + ε × v)2
Figure 2b shows the propagation of acoustic waves when excitation of the central source B is delayed. If the delay in exciting the central source B is δt, the delayed acoustic wave from B adds constructively to the acoustic waves from the symmetrical sources A and C at a time t, which can be calculated from
when the delay time is chosen to be 0.1 μs, constructive wave superposition occurs 0.5 µs after the first excitation at a distance on the y-axis of about 1.2 mm, which is less than 10% of the distance without any time delay. When the delay time is increased to 0.2 µs, the time for constructive superposition is shortened to 0.325 µs with a propagation distance of only 0.375 mm.
[v × (t + δt)]2 = (v × t)2 + L2
To ensure that the superposed propagating waves do not separate again, δd is required to be always less than the acceptable error value.
where t is the propagation time after constructive interference, t0 is the time that constructive interference first occurs, and δt is the delay time. For all times t > 0, δd < ε × v, that is, there is no solution when δd ≥ ε × v. We can see that when the delay time is 0.1 or 0.2 µs, the solution of the inequality is an empty set. Therefore, after constructive superposition occurs, the enhanced wavefront propagates as a complete new wavefront without separating again. In the results and discussions section, we will confirm that the enhanced wavefront propagates as a complete wavefront by fitting and reconstructing the wavefront.
2.2. Solid Heat Transfer
The energy distribution of the laser can be described as
where I0 is the maximum power density, and f(r) and g(t) are the spatial and temporal distributions of the laser pulse, respectively.
I = I0 × f(r) × g(t)
The thermal conduction equation can be written as
where T(r, z, t) represents the temperature distribution at time t; ρ is the material density; Cp is the thermal capacity of the material; and k is the thermal conductivity.
We consider the excited spot as a heat source loaded at the center of the cylinder surface. To simplify the simulation and reduce the computation time, we consider other boundaries of the cylinder as thermally insulated boundaries. The boundary conditions of the other surfaces can therefore be written as
And the boundary conditions of the absorption layer can be written as
where A(T) is the optical absorptivity of the focus plane [28].
2.3. Solid Mechanics
When the laser pulse is focused on the surface of the sample, a transient displacement field is excited due to thermoelastic expansion. In a homogeneous medium, the displacement satisfies:
where u is the transient displacement, ρ is the density of the material, α is the thermoelastic expansion coefficient, and λ and μ are the first-order and second-order Lamé constants, which are determined by the material-related quantities represented by the strain-stress relationship. The first-order Lamé constant λ represents the compressibility of the material, which is equivalent to the bulk elastic modulus or Young’s modulus, and the second-order Lamé constant μ represents the shear modulus of the material. The values of λ and μ for aluminum are 6.10 and 2.49, respectively [29].
3. Results and Discussions
Figure 3 shows the z-direction displacement due to the surface wave propagating in the xy-plane. Comparing Model 1, Model 2, and Model 3, we can see that a wavefront showing constructive superposition appears first in Model 3. The color bar used in each subfigure in Figure 3 is the same, ranging from −1 × 10⁻⁶ (dark blue) to 0 (light blue) to 3 × 10⁻⁶ mm (red). It can be seen that due to the time delay, the wavefront in Model 3 lags behind Model 1 and Model 2, but its intensity is significantly enhanced.
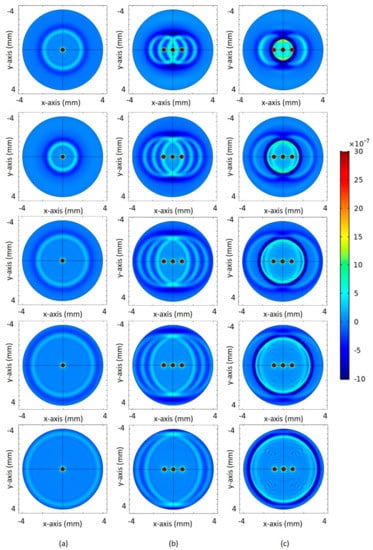
Figure 3.
Displacement in the z-direction due to the surface wave propagating in the xy-plane at different times. (a) Model 1; (b) Model 2; (c) Model 3. The corresponding times are 0.6, 0.8, 1, 1.2, and 1.4 µs (from top to bottom).
In Figure 4, we plot the displacement for the three models at points at which the distance to the x-axis and y-axis are both 1, 1.5, 2, and 2.5 mm, referred to as point 1, point 2, point 3, and point 4, respectively. It can be seen that the peak displacement for Model 3 is much larger than that for Model 1 and Model 2 because of the constructive superposition of the acoustic wavefronts. The simulation results agree closely with the theoretical model, but the noise of Model 3 is larger than that of Model 1 and Model 2, and this problem needs to be considered in the subsequent data processing.
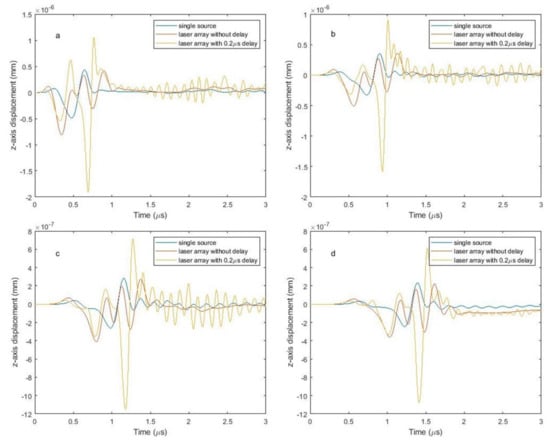
Figure 4.
Displacement in the z-direction as a function of time of Model 1, Model 2, and Model 3 for (a) point 1, (b) point 2, (c) point 3, and (d) point 4.
MATLAB was used to fit the wavefront data to confirm that the enhanced wavefront continues to propagate in the form of a constructively superposed wave. A surface composed of points of equal amplitude is considered a wavefront surface. For the purpose of choosing a fitting method with a simple form and high accuracy, we used second to fifth-order polynomial fitting with the Zernike polynomial. Rayleigh waves propagate in the form of cylindrical wavefronts along the free surface of the medium [30], so only the first three orders were considered when using Zernike polynomials for fitting. The first three orders of the Zernike polynomial are shown in Table 1.

Table 1.
First 3 orders of the Zernike polynomial in Cartesian coordinate.
Due to symmetry, only the region with x > 0 was considered when fitting. Due to acoustic absorption, the surface wave decays exponentially inside the material. The surface wave on the z-axis far from the heat source is very weak and can barely be discriminated from noise, so only data within 0.1 mm of the heat source was used for fitting.
Figure 5 depicts the wavefronts of Model 1, Model 2, and Model 3 fitted by polynomials of different orders. The fitting error is displayed in Table 2. For higher-order polynomials, the fitting error is reduced. The results using third-order Zernike polynomial fitting are similar to third-order polynomial fitting. In both Model 1 and Model 3, fitting using fourth-order and fifth-order polynomials offers significantly better accuracy compared with second-order and third-order fitting, and it is recommended to adopt the fourth-order polynomial fitting as the difference between fourth- and fifth-order polynomial fitting is marginal. Regardless of the order of fitting for Model 2, the fitting error is larger than that for Model 1 and Model 3, and the fitted results are also not ideal. It can be seen from the original data of Model 2 in Figure 5 that weaker wavefronts appear distinct from the main wavefront. This implies that the use of multiple sources without time delay for simultaneous excitation not only cannot form a single enhanced wavefront, but the weaker wavefronts also lead to difficulties in interpreting ultrasonic images and extracting data.
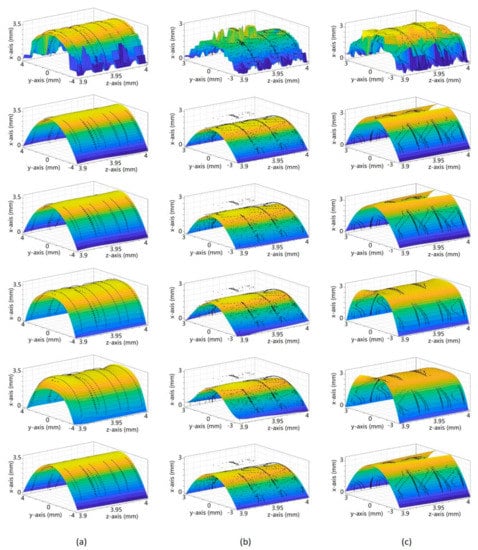
Figure 5.
Processed data fitted with 2–5 order polynomials and Zernike polynomials at 1.2 µs. From top to bottom: original data interpolation results, second, third, fourth, and fifth-order polynomial fitting, Zernike polynomial fitting. (a) Model 1 (single heat source); (b) Model 2 (three heat sources without delay); (c) Model 3 (three heat sources with delay).

Table 2.
Fitting error: SSE (sum of squares for error), R-square, and RMSE (root mean squared error).
For further verification, we conducted numerical calculations based on the parametric indirect microscopic imaging (PIMI) method [31], which is a method that can optically visualize the sound field wavefront by measuring the phase retardation and polarization ellipse orientation angle of the probe light. Linearly polarized light with rotation of its polarization angle was used as the probe beam incident on the surface of the sample. The polarization states of the reflected light were perturbed by the surface acoustic wave. By measuring the reflected light at four different polarization angles, I(0°), I(90°), I(45°), and I(135°), the Stokes parameters, the phase delay δ, and the polarization orientation angle ψ were calculated. The calculated polarization parametric images of the probe beam can be related to the ultrasonic wave field via the photo-elastic effect [31].
The visualization of the acoustic field is shown in Figure 6. The Stokes parameters S0, S1, S2, S3 phase delay δ and polarization orientation angle ψ can be obtained from I(0°), I(90°), I(45°), I(135°). I(0°) is the intensity of the linearly horizontal polarized light component, I(90°) is the intensity of the linearly vertical polarized light component, I(45°) is the intensity of the linearly +45° polarized (L+45P) light component (L for linearly and P for polarization), I(135°) is the intensity of the linear −45° polarized (L−45P) light components. From Figure 6, we found that S3 and ψ show high sensitivity to the laser-induced surface acoustic wave, while the wavefront can barely be seen in the phase retardation δ.
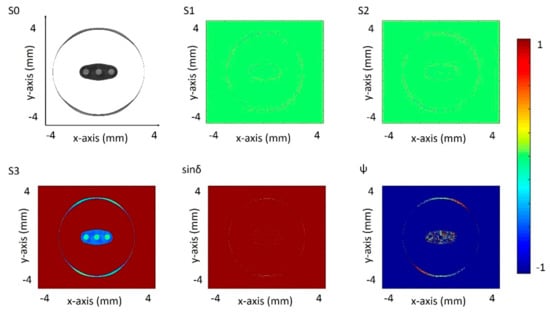
Figure 6.
Modeled Stokes parameter images of S0, S1, S2, S3, sinδ, ψ.
As a comparison, the propagation of acoustic waves in the xy-plane induced by three acoustic emitters at the same locations as the laser array source was simulated using MATLAB’s k-wave toolbox [32]. The heat sources in Model 1, Model 2, and Model 3 were replaced by sound sources with the same size, shape, distributions, and delay time. The simulation area was a square with a side length of 8 mm, and an 800 × 800 mesh was used. The speed of sound in the medium was taken to be 2940 m/s, the same as the surface wave sound velocity of aluminum. The uniformly distributed source was defined by the acoustic pressure, which was assigned a value of −0.1 Pa because thermally induced SAWs have a negative initial acoustic pressure. The initial frequency of the acoustic signal was specified as 3.3 MHz, approximately equal to the frequency of the sound wave excited in the FEM simulation. The input signals of the acoustic sources A, B, and C in Model 3 are shown in Figure 7. The input signal for source B has a time delay of 200 ns relative to sources A and C.
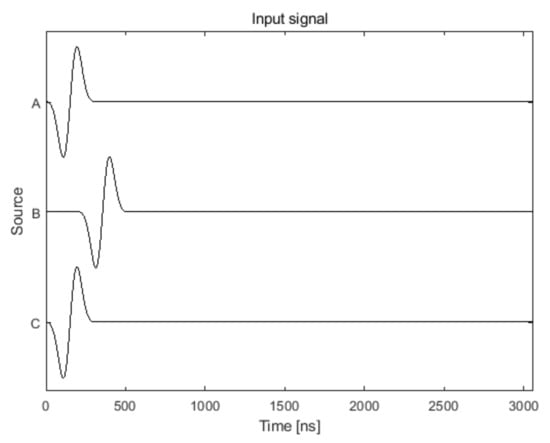
Figure 7.
The input signals of the acoustic sources A, B, and C.
The wavefronts for Model 1, Model 2, and Model 3 at different times, shown in Figure 8, are generally consistent with the sound field distributions simulated by FEM. Four probes were placed at Points 1, 2, 3, and 4 (at 1, 1.5, 2, and 2.5 mm to both x-axis and y-axis), the same as in the FEM simulation. Data collected by these probes for Model 1, Model 2, and Model 3 are plotted in Figure 9. Sensor data of Model 1 (red curve) only has one peak, probe data of Model 2 (green curve) has three peaks with similar amplitude, while probe data of Model 3 (blue curve) has two peaks and the second peak is stronger than the first peak.
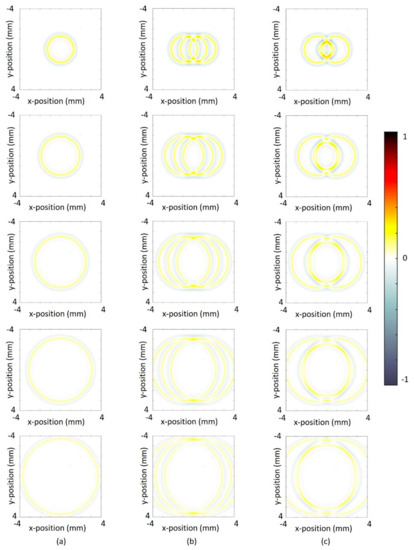
Figure 8.
Wavefront at different time. (a) Model 1, (b) Model 2, and (c) Model 3 at 0.6, 0.8, 1, 1.2, and 1.4 µs (from top to bottom).
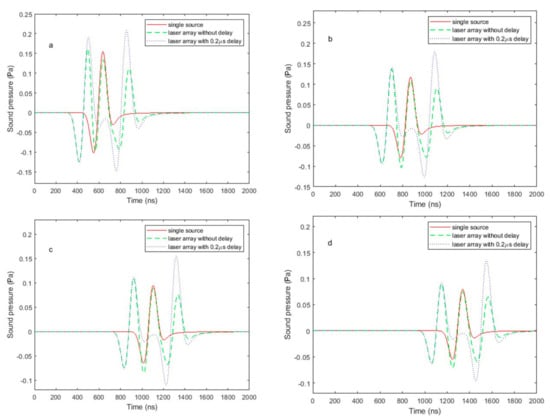
Figure 9.
Sound pressure measured by sensors that were placed at (a) Point 1, (b) Point 2, (c) Point 3, and (d) Point 4.
Figure 10 shows normalized FEM simulation results and k-wave simulation results separately displayed on the same graph. The simulation results of the two methods have the same trend, but there are slight differences in details, k-wave simulations are simply based on a superposition of sound waves, while FEM simulates the complete process of sound waves generated by thermal expansion. There are also some differences between the different methods. In Model 1, Model 2, and Model 3, the arrival time of sound waves at detection points in FEM is earlier than that in k-wave. This is because the starting point of sound wave propagation in FEM is at the boundary of the heat source (strain caused by temperature gradient), while the starting point of sound wave propagation in the k-wave simulation is at the center of the sound source. The propagation distance of photo-generated acoustic waves in FEM is reduced by half the heat source radius compared to k-wave, which leads to the sound waves in the FEM simulation at the detection point arriving earlier.
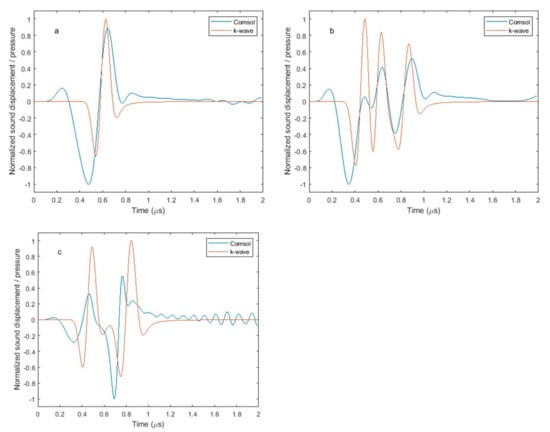
Figure 10.
Normalized sound pressure field (k-wave) and displacement field (FEM) detected at Point 1 for (a) Model 1, (b) Model 2, and (c) Model 3.
In addition to the main wave, there are waves that are generated by multi-point excitation in Models 2 and 3, but these fail to fully participate in the superposition. The k-wave approach was only used as a comparative simulation to verify the suitability of the model. The actual photoacoustic process is closer to FEM simulation. Therefore, only the signal differentiation problem in the FEM model is considered here. Figure 10 shows that the excited sound wave has only a single peak in the negative direction, which can be used as the main peak of detection.
In the FEM simulation, there is slight vibration after the sound wave passes. This is because of the coarsening of edge mesh and the inhomogeneity of mesh division due to the compromise of calculation time. This kind of slight vibration can be eliminated by refining the mesh and decreasing the time step.
Simulations of the bulk wave are shown in Figure 11. Clearly, the laser array enhances the intensity of the bulk wave. As expected, the amplitude of the acoustic wave generated by the laser array is larger than that generated by a single laser source with the same energy density. In Figure 11a–c, the difference between the arrival times of the peak of the bulk wave in Model 1 and Model 2 at Points 5, 6, and 7 (The points on the z-axis that are 1, 2, and 3 mm away from the central heat source B) are 0.22, 0.10, and 0.06 µs, respectively, after the excitation time. This is because, for detection points further from the excitation source, the propagation paths of bulk waves originating from spots A and C (symmetrically located on either side of spot B) gradually approach the propagation path of the wave originating from spot B. Because there are two sources, the dominant bulk wave propagating along the z-axis results from a superposition of the waves excited at spots A and C. In Figure 11a, the smaller peak is the acoustic wave excited by source B. In Figure 11b,c, this peak adds constructively to the waves excited by A and C, which increases the width of the wave. Comparing the peak amplitudes of waves at locations 1, 2, and 3 mm from spot B on the z-axis, it can be seen that the amplitudes of the bulk waves generated in Model 2 are, respectively, 1.1, 1.9, and 2.4 times of those excited by Model 1. In the far-field, the bulk wave excited by a distributed laser array is enhanced by a factor of more than 2 compared to a single spot. This phenomenon is analogous to the mechanism of the widely used synthetic aperture method for the enhancement of the detection SNR [33].
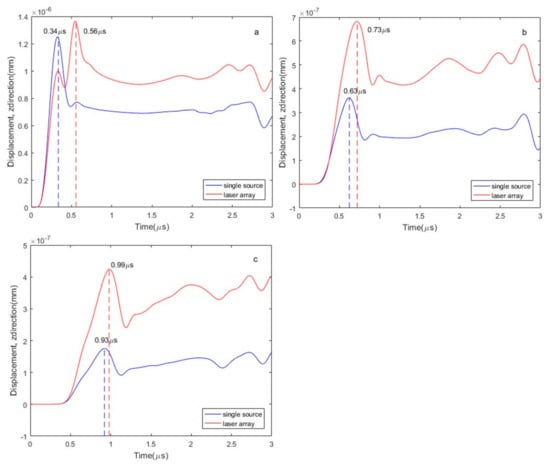
Figure 11.
Displacement in the z-direction as a function of time for Model 1 (single laser source) and Model 2 (laser array) at (a) Point 5, (b) Point 6, and (c) Point 7.
Figure 12 shows the attenuation curve, obtaining the amplitude of the z-direction displacement at six points along the z-axis: 1, 1.5, 2, 2.5, 3, and 3.5 mm away from source B. It can be seen that the slope of the attenuation curve for Model 1 is steeper than that for Model 2. This phenomenon arises because the wave has a plane component.
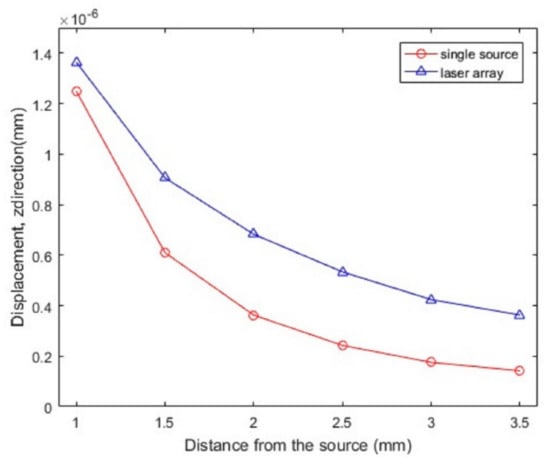
Figure 12.
The peak z-direction displacement of the wave for different locations for the cases of single laser and laser array sources.
4. Conclusions
This study compares surface and bulk acoustic waves excited by a single laser source, a laser array composed of three sources without time delay, and a laser array of three sources with a time delay imposed on the central source. It is shown that for the same excitation energy density, arrayed photoacoustic excitation leads to surface acoustic waves that are around four times stronger in particular directions than that of a single source. Moreover, by applying an appropriate time delay to the center source, the time and distance required for constructive superposition to form a complete wavefront can be effectively shortened. The use of the laser array has a significant enhancement on the amplitude of bulk acoustic waves propagating into the object, analogous to the synthetic aperture method in ultrasonic detection. In a future study, we will systematically investigate the characteristics of wave generation by laser array sources with different energy spatial distributions, temporal profiles, and delays between pulses in order to obtain a better understanding of the mechanisms of wave generation using laser arrays. Using a laser array with an appropriate delay time can enhance the intensity of the excited acoustic signal without damaging the sample, and the excited acoustic wavefront still propagates in a regular shape with little clutter. This method provides a new way to manipulate the wavefront and improve the generation efficiency in nondestructive photoacoustic imaging applications.
Author Contributions
Conceptualization, J.X., X.L., J.H.M. and L.H.; software, R.H., B.X. and Y.Z.; writing—original draft preparation, R.H.; writing—review and editing, J.X., Z.X., W.L. and C.G.; supervision, J.X. and X.L. All authors have read and agreed to the published version of the manuscript.
Funding
This research was funded by the National Major Scientific Instruments and Equipment Development Project, grant no. 61827814, Beijing Natural Science Foundation, grant no. Z19J0018, the Fundamental Research Funds for the Central Universities, grant no. 30920010011, the Ministry of Education collaborative project (B17023). This research was supported by the U.K. Engineering and Physical Sciences Research Council (grant EP/R042578/1).
Institutional Review Board Statement
Not applicable.
Informed Consent Statement
Not applicable.
Conflicts of Interest
The authors declare no conflict of interest.
References
- Xu, M.; Wang, L.V. Photoacoustic Imaging in Biomedicine. Rev. Sci. Instrum. 2006, 77, 41101. [Google Scholar] [CrossRef]
- Shen, Z.; Xu, B.; Ni, X.; Lu, J. Numerical Simulation of Laser-Generated Ultrasonic Waves in Layered Plates. J. Phys. D Appl. Phys. 2004, 37, 2364–2370. [Google Scholar] [CrossRef]
- Pitarresi, G.; Patterson, E.A. A Review of the General Theory of Thermoelastic Stress Analysis. J. Strain Anal. Eng. Des. 2003, 38, 405–417. [Google Scholar] [CrossRef]
- Ma, R.; Taruttis, A.; Ntziachristos, V.; Razansky, D. Multispectral Optoacoustic Tomography (MSOT) Scanner for Whole-Body Small Animal Imaging. Opt. Express 2009, 17, 21414. [Google Scholar] [CrossRef] [PubMed]
- Thomas, R.J.; Rockwell, B.A.; Marshall, W.J.; Aldrich, R.C.; Zimmerman, S.A.; Rockwell, R.J. A Procedure for Multiple-Pulse Maximum Permissible Exposure Determination under the Z136.1-2000 American National Standard for Safe Use of Lasers. J. Laser Appl. 2001, 13, 134–140. [Google Scholar] [CrossRef]
- Hajireza, P.; Shi, W.; Bell, K.; Paproski, R.J.; Zemp, R.J. Non-Interferometric Photoacoustic Remote Sensing Microscopy. Light Sci. Appl. 2017, 6, e16278. [Google Scholar] [CrossRef]
- Cao, Y.; Hui, J.; Kole, A.; Wang, P.; Yu, Q.; Chen, W.; Sturek, M.; Cheng, J.X. High-Sensitivity Intravascular Photoacoustic Imaging of Lipid-Laden Plaque with a Collinear Catheter Design. Sci. Rep. 2016, 6, 1–8. [Google Scholar] [CrossRef]
- Murray, T.W.; Balogun, O. High-Sensitivity Laser-Based Acoustic Microscopy Using a Modulated Excitation Source. Appl. Phys. Lett. 2004, 85, 2974–2976. [Google Scholar] [CrossRef]
- Huang, J.; Krishnaswamy, S.; Achenbach, J.D. Laser Generation of Narrow-band Surface Waves. J. Acoust. Soc. Am. 1992, 92, 2527–2531. [Google Scholar] [CrossRef]
- Clark, M.; Sharples, S.D.; Somekh, M.G. Diffractive Acoustic Elements for Laser Ultrasonics. J. Acoust. Soc. Am. 2000, 107, 3179–3185. [Google Scholar] [CrossRef]
- Sharples, S.D.; Clark, M.; Somekh, M.G. All-Optical Adaptive Scanning Acoustic Microscope. Ultrasonics 2003, 41, 295–299. [Google Scholar] [CrossRef][Green Version]
- Stratoudaki, T.; Clark, M.; Somekh, M.; Arca, A. CHeap Optical Transducers (CHOTs) for Generation and Detection of Longitudinal Waves. In Proceedings of the IEEE International Ultrasonics Symposium, IUS, Dresden, Germany, 7–10 October 2012; pp. 961–964. [Google Scholar]
- Stratoudaki, T.; Clark, M.; Wilcox, P.D. Laser induced ultrasonic phased array using full matrix capture data acquisition and total focusing method. Opt Express. 2016, 24, 21921–21938. [Google Scholar] [CrossRef]
- Pieris, D.; Stratoudaki, T.; Javadi, Y.; Lukacs, P.; Catchpole-Smith, S.; Wilcox, P.D.; Clare, A.; Clark, M. Laser Induced Phased Arrays (LIPA) to Detect Nested Features in Additively Manufactured Components. Mater. Des. 2020, 187, 108412. [Google Scholar] [CrossRef]
- Jarzynski, J.; Berthelot, Y.H. The Use of Optical Fibers to Enhance the Laser Generation of Ultrasonic Waves. J. Acoust. Soc. Am. 1989, 85, 158–162. [Google Scholar] [CrossRef]
- Noroy, M.H.; Royer, D.; Fink, M.A. Shear-Wave Focusing with a Laser-Ultrasound Phased-Array. IEEE Trans. Ultrason. Ferroelectr. Freq. Control 1995, 42, 981–988. [Google Scholar] [CrossRef]
- Scott Steckenrider, J.; Murray, T.W.; Wagner, J.W.; Deaton, J.B. Sensitivity Enhancement in Laser Ultrasonics Using a Versatile Laser Array System. J. Acoust. Soc. Am. 1995, 97, 273–279. [Google Scholar] [CrossRef]
- Murray, T.W.; Deaton, J.B.; Wagner, J.W. Experimental Evaluation of Enhanced Generation of Ultrasonic Waves Using an Array of Laser Sources. Ultrasonics 1996, 34, 69–77. [Google Scholar] [CrossRef]
- Hopko, S.N.; Ume, I.C.; Erdahl, D.S. Development of a Flexible Laser Ultrasonic Probe. J. Manuf. Sci. Eng. Trans. ASME 2002, 124, 351–357. [Google Scholar] [CrossRef]
- Mi, B.; Ume, C. Real-Time Weld Penetration Depth Monitoring with Laser Ultrasonic Sensing System. J. Manuf. Sci. Eng. Trans. ASME 2006, 128, 280–286. [Google Scholar] [CrossRef]
- Pei, C.; Demachi, K.; Fukuchi, T.; Koyama, K.; Uesaka, M. Cracks Measurement Using Fiber-Phased Array Laser Ultrasound Generation. J. Appl. Phys. 2013, 113, 163101. [Google Scholar] [CrossRef]
- Besson, A.; Carrillo, R.E.; Bernard, O.; Wiaux, Y.; Thiran, J.P. Compressed delay-and-sum beamforming for ultrafast ultrasound imaging. In Proceedings of the 2016 IEEE International Conference on Image Processing (ICIP), Phoenix, AZ, USA, 25–28 September 2016; pp. 2509–2513. [Google Scholar] [CrossRef][Green Version]
- Holfort, I.K.; Gran, F.; Jøensen, J.A. Broadband minimum variance beamforming for ultrasound imaging. IEEE Trans Ultrason Ferroelectr Freq. Control 2009, 56, 314–325. [Google Scholar] [CrossRef] [PubMed]
- Capon, J. High-Resolution Frequency-Wavenumber Spectrum Analysis. Proc. IEEE 1969, 57, 1408–1418. [Google Scholar] [CrossRef]
- Von Ramm, O.T.; Smith, S.W. Beam Steering with Linear Arrays. IEEE Trans. Biomed. Eng. 1983, BME-30, 438–452. [Google Scholar] [CrossRef] [PubMed]
- Wooh, S.C.; Shi, Y. Simulation study of the beam steering characteristics for linear phased arrays. J. Nondestruct. Eval. 1999, 18, 39–57. [Google Scholar] [CrossRef]
- Guan, J.; Shen, Z.; Ni, X.; Wang, J.; Lu, J.; Xu, B. Numerical Simulation of the Reflected Acoustic Wave Components in the near Field of Surface Defects. J. Phys. D Appl. Phys. 2006, 39, 1237–1243. [Google Scholar] [CrossRef]
- Kalenskii, A.V.; Zvekov, A.A.; Aduev, B.P. The Influence of Temperature on the Spectral Dependences of Aluminum’s Optical Properties. Opt. Spectrosc. (English Transl. Opt. I Spektrosk.) 2018, 124, 501–508. [Google Scholar] [CrossRef]
- Crecraft, D.I. The Measurement of Applied and Residual Stresses in Metals Using Ultrasonic Waves. J. Sound Vib. 1967, 5, 173–192. [Google Scholar] [CrossRef]
- Al Wardany, R.; Rhazi1, J.; Ballivy, G.; Gallias, J.L.; Saleh, K. Use of Rayleigh Wave Methods to Detect Near Surface Concrete Damage R. In Proceedings of the 16th World Conference on NDT, WCNDT, Montreal, QC, Canada, 30 August–3 September 2004; Available online: https://www.ndt.net/article/wcndt2004/pdf/civil_structures/729_wardany.pdf (accessed on 17 February 2021).
- Liu, G.; Xiong, J.; Cao, Y.; Hou, R.; Zhi, L.; Xia, Z.; Liu, W.; Liu, X.; Glorieux, C.; Marsh, J.H.; et al. Visualization of Ultrasonic Wave Field by Stroboscopic Polarization Selective Imaging. Opt. Express 2020, 28, 27096. [Google Scholar] [CrossRef]
- Treeby, B.E.; Jaros, J.; Rohrbach, D.; Cox, B.T. Modelling Elastic Wave Propagation Using the K-Wave MATLAB Toolbox. In Proceedings of the IEEE International Ultrasonics Symposium, IUS, Chicago, IL, USA, 3–6 September 2014; pp. 146–149. [Google Scholar]
- Ylitalo, J. On the Signal-to-Noise Ratio of a Synthetic Aperture Ultrasound Imaging Method. Eur. J. Ultrasound 1996, 3, 277–281. [Google Scholar] [CrossRef]
Publisher’s Note: MDPI stays neutral with regard to jurisdictional claims in published maps and institutional affiliations. |
© 2021 by the authors. Licensee MDPI, Basel, Switzerland. This article is an open access article distributed under the terms and conditions of the Creative Commons Attribution (CC BY) license (https://creativecommons.org/licenses/by/4.0/).