1. Introduction
In recent years, the Imaging and Medical Beamline (IMBL) at the Australian Synchrotron [
1] has seen a large increase in use for the irradiation of healthy and tumour-bearing live animals. This has been facilitated by great improvements in the beamline’s technical capabilities surrounding small animal radiotherapy. Small animal radiotherapy on IMBL has been tightly focused around Microbeam Radiation Therapy (MRT), a preclinical radiotherapy technique that is unique to synchrotron facilities [
2,
3,
4]. The unique healthy tissue sparing properties of MRT have potential in the treatment of radio-resistant, inoperable and otherwise untreatable tumours [
2,
5,
6].
A hallmark of MRT is the use of a spatially fractionated field [
7], which displays a surprisingly high normal tissue dose tolerance and a therapeutic ratio far greater than that of conventional radiotherapy modalities [
8,
9,
10,
11]. This dose tolerance is, in part, due to the high dose rate that comes with synchrotron MRT [
12,
13]. The instantaneous dose rate within each microbeam can exceed 5000
/s
−1, posing additional challenges in dosimetric characterisation and real-time imaging [
14,
15,
16,
17]. Together with knowing the radiation dose delivered, it is equally important to know where the dose is being deposited. Thus, it is necessary to validate the position of a patient’s internal anatomy in relation to the radiation beam. A robust patient positioning process must be accurate, repeatable and deliver minimal additional dose [
18]. In a clinical context, external beam radiotherapy employs an image-guided patient positioning technique that relies on high-resolution pre-treatment imaging (for accurate identification of tumours) and imaging at the time of treatment to ascertain the position of those tumours relative to the treatment beam.
Previous small animal MRT studies (involving patients without tumours) have aligned patients manually [
19], using optical cameras based on external anatomy [
20], or using the modified synchrotron beam to find anatomical structures [
21,
22]. Other MRT studies involving tumour-bearing rats have used visual targeting relative to the midsagittal plane [
8] and using X-ray fluorescent radiography relating anatomical markers to the known location of tumour inoculation [
5].
MRI imaging provides clearly distinguishable tumour volumes, although its use in image guidance tasks for synchrotron generated MRT is yet to be demonstrated. MRI imaging has been utilized in MRT studies where radiosensitizing nanoparticles are employed, particularly to optimise the timing between the injection of radiosensitizing agents and the treatment delivery to maximise patient survival [
23]. MRI imaging has also been used after MRT irradiation to monitor tumour growth [
21,
24]. However, to date, no small animal study has employed MRI imaging for image guidance in synchrotron delivered radiotherapy. Much progress has been made on the ID17 biomedical beamline of the European Synchrotron Radiation Facility. Studies here have provided great insight into tumour vessel response using MRI before and after MRT. However, this study did not use the MRI for patient alignment, instead aligning patients using optical cameras with all patients targeted equidistant from their mediolateral line as identified by external anatomy [
3,
25]. The ID17 beamline also presented the first protocol for precise patient alignment for use with larger animals, using fiducial markers to align CT images with X-ray projection images acquired on the treatment stage, demonstrating target alignment error of <±2 mm [
26] and has been used for alignment in more recent studies [
27]. Further work on this beamline introduced a new method for contrast-enhanced tumour tomography using a modified wiggler field as described by Serduc, 2010 [
21] was used in developing a protocol for the alignment of small animals [
28]. Reconstructed tomographic images produced a 10 mm vertical volume clearly showing the location of the tumour, allowing for tumour identification and alignment on the treatment stage.
More recently,
SyncMRT, an image guidance program, developed for synchrotron radiotherapy, was demonstrated on IMBL [
29]. The
SyncMRT software and accompanying image guided protocols are similar to those used in radiotherapy clinics and filled many of the gaps left by previous image guided approaches.
In this study, we assess and evaluate the imaging, tumour identification, and patient alignment for small animal irradiation on IMBL. We present an end-to-end demonstration of the image-guided microbeam radiation therapy protocol used for Australia’s first long term pre-clinical MRT treatment of rats bearing 9L gliosarcoma tumours [
30]. The protocol, as proposed in this work, utilises a clinical CT scanner for the identification of the tumour volume and skeletal landmarks used for patient specific alignment. Once animals are sedated and immobilised on the treatment stage, a conventional radiograph is acquired using an orthovoltage X-ray tube. The X-ray tube operates independently of the synchrotron beam, enabling immediate switching between low dose imaging and high dose treating without compromising time or accuracy. The two image datasets (CT and radiograph) are used to position the target using SyncMRT. The protocols outlined in Barnes, 2018 [
29] describe the use of a clinical treatment plan for alignment; however, in this work we demonstrate that adequate positioning of tumours can be achieved in the absence of a formal clinical treatment plan. The protocols in this work are in intended for use alongside those outlined in Davis, 2021 [
17] for beam alignment, quality verification, and dosimetry purposes.
2. Materials and Methods
2.1. Synchrotron X-ray Beam
The beamline uses a variable strength Super-Conducting Multipole Wiggler (SCMPW) to produce a polychromatic X-ray beam from 3 GeV electrons with a beam current of 200 mA operated in continuous top-up mode. The resulting X-ray beam has an energy spectrum predominately in the range 40 keV to 250 keV [
1,
31]. Depending upon the treatment requirements, the mean and peak energies of the spectrum can be tuned through the use of interchangeable filter paddles to selectively filter out the lower end of the spectrum and harden the beam. The intensity of this beam can then be tuned by changing the magnetic field strength of the SCMPW. The SCMPW can be tuned to operate between 1.4 and
, allowing for instantaneous surface dose rates, from 10 s to 1000 s of
/s
−1.
2.2. Positioning Stage
The image guided MRT treatment protocol was developed for and tested on Hutch 2B of IMBL at the Australian Synchrotron located 32
from the SCMPW source. On entering Hutch 2B, the beam is confined to a usable field size of approximately 2
(vertical) × 30
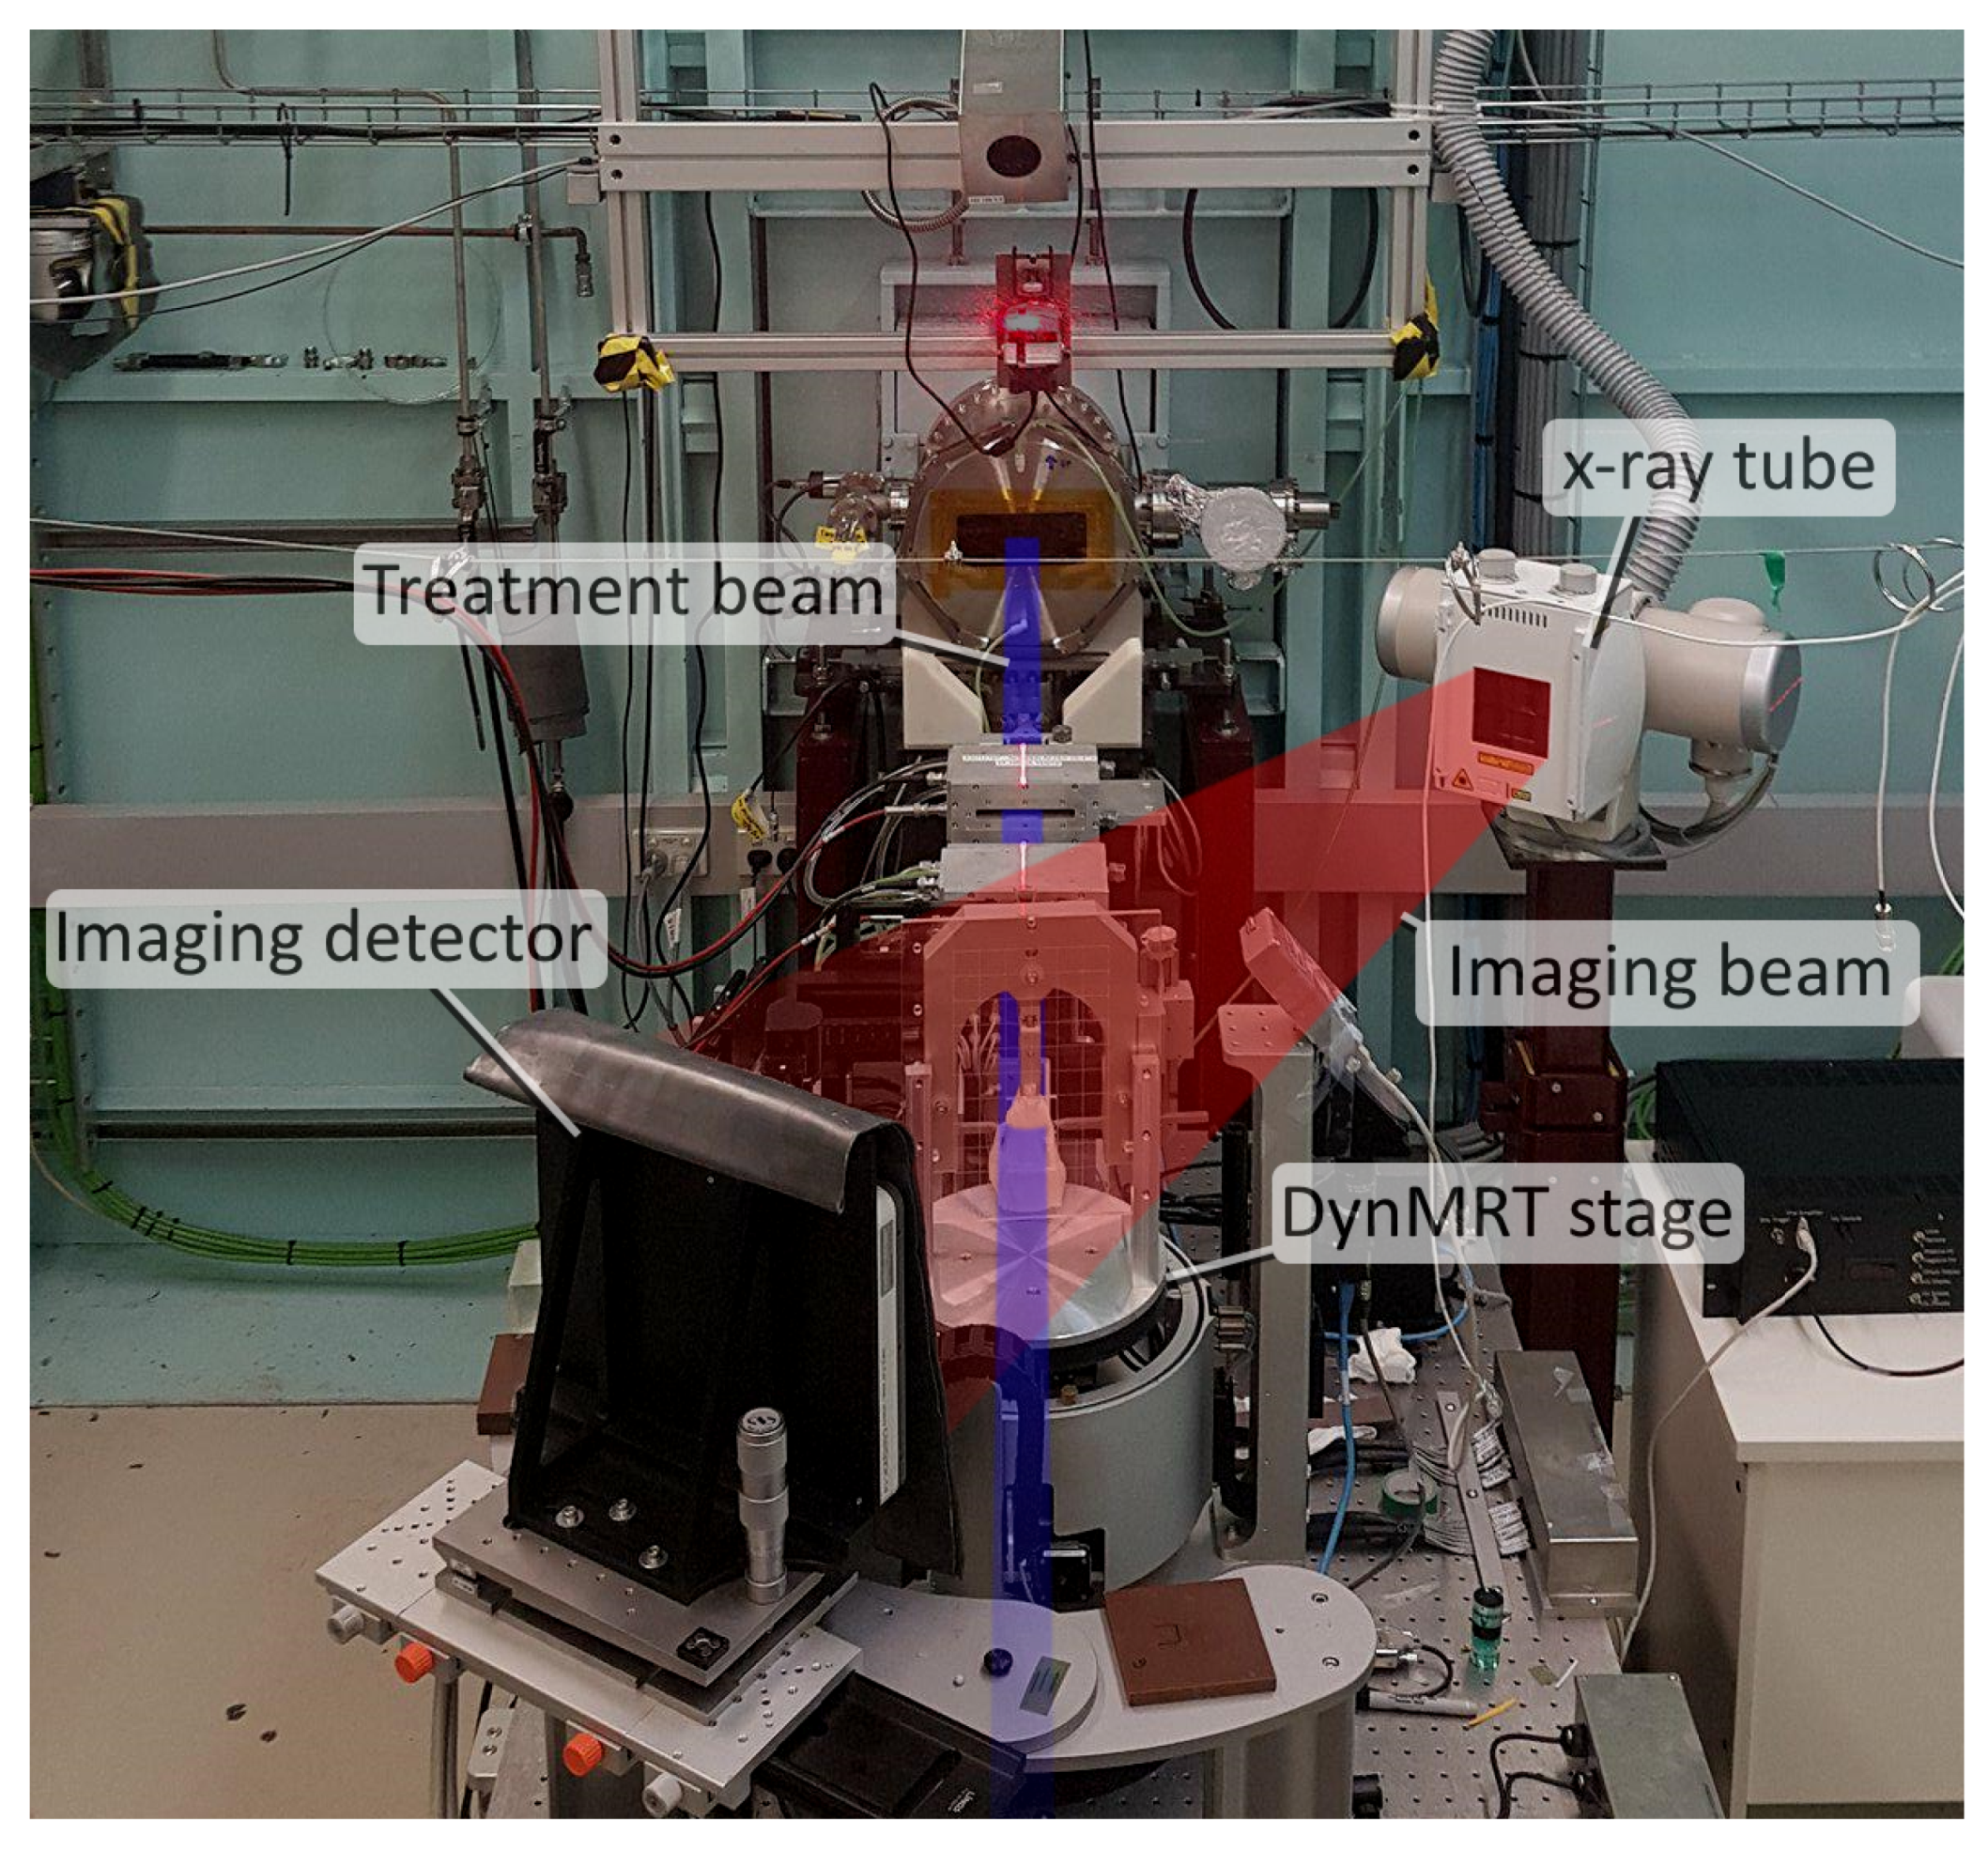
(horizontal). The Dynamic MRT (DynMRT) stage is housed in Hutch 2B and was used for sample and patient positioning, as pictured in
Figure 1. The stage allows for patient positioning and translation through the treatment beam to treat areas larger than the narrow confines of the fixed field. The stage permits translation in all three dimensions, but only rotation around one axis (yaw), allowing only for simple treatment plans with 4 degrees of freedom. More complex treatment plans involving rotation around all three axes are currently not able to be implemented.
2.3. Imaging the Treatment Stage
High accuracy alignment on the DynMRT stage requires an X-ray source and imaging detector. The alignment of small animals in this work requires low dose imaging with a minimum field size of 45 mm × 30 mm (vertical × horizontal) and, ideally, a pixel size no larger than that of the CT dataset ( ).
There are several imaging options available on IMBL. Typically, the primary beam is diffracted to produce a monochromatic beam. This allows for high-resolution images with greatly reduced intensity; however, given the DynMRT setup, the field of view is limited to 2 mm × 30 mm.
Pelliccia et al. developed a dynamic scanning method to overcome the field of view limitation [
32], although this still requires horizontal tiling of dynamically scanned images to achieve a horizontal field of view greater than 30
. Additionally, this method requires swapping between pink and monochromatic beams as well as the manual insertion and removal of an imaging detector, which are time-consuming processes that extend the length of time patients must be sedated.
Barnes [
29] and Livingstone et al. [
33] describe the use of a Toshiba X-ray tube and Hamamatsu C10900D flat panel detector which offers a field of view encompassing the entire DynMRT stage with a single exposure at an effective pixel size of 0.16 mm × 0.16 mm. Operating at 40 kVp and 10
, this configuration also provides the lowest doses with good contrast for image guidance on the treatment stage [
29,
33].
This imaging option is chosen for use in our work as it best satisfied the dose, field of view and resolution requirements.
2.4. Planning CT
The imaging protocol, as proposed in this work utilises the adjoining Monash Biomedical Imaging (MBI) facilities. MBI is a designated medical imaging facility housing many clinical and research scanners with a focus on human and pre-clinical research projects. A direct passageway connects MBI and IMBL for the convenience of transporting patients between imaging and treating rooms without the need for auxiliary patient transport services. MBI offers two CT scanners suitable for pre-clinical image-guided radiotherapy purposes; An Inveon Multimodality System small animal scanner and a Siemens SOMATOM go.Up clinical CT scanner. Scans were performed and optimised for small animal imaging using each of these CT scanners and assessed for suitability in image-guided MRT with a particular interest in image quality, tumour contrast, patient dose, patient throughput and ability to facilitate future work involving larger animals or humans.
The Inveon Multimodality System integrates many imaging modalities onto a single versatile platform. For this study, the scanner was operated in CT only configuration. In this mode, the CT system has an adjustable field of view from 4.4 cm × 4.4 cm to 10 cm × 10 cm and a maximum voxel resolution of 20 μm × 20 μm × 20 μm. This scanner is considered for use in image-guided MRT largely for the ability to resolve tumour locations and fine anatomical details within small animals.
As the Somatom go.Up is a clinical CT scanner indented for use with human sized targets, the choice of reconstruction kernel is not intuitively clear when scanning small animals. A rat sized phantom was constructed to determine the best scan parameters including X-ray kVp energy and reconstruction kernel. The phantom consisted of a 25 mm × 25 mm × 55 mm RMI 457 Solid Water® cuboid with 1 mm of bone equivalent material on two side faces of the Solid Water®. An 8 mm diameter hole was drilled to 30 mm depth into the phantom and partially filled with 2 mL of a 2 mg/mL iodine in water solution. The iodine concentration chosen represents what is expected to accumulate in the tumour of a rat injected with iodine contrast. Scans were performed at 80 and 100 kVp as they produced maximum intensity close to the K-edge of iodine (33 keV). Scans were reconstructed with all available reconstruction kernels.
2.5. Imaging Dosimetry
Dosimetry was performed on both aforementioned CT scanners available at MBI and on the orthovoltage X-ray tube within Hutch 2B using a PTW PinPoint
TM ion chamber (model 31015) and a MOSkin
TM detector [
34,
35]. Each detector was placed inside a 25 mm × 25 mm × 55 mm RMI 457 Solid Water
® phantom approximately the size of a rats head. Results of the MOSkin detector were calibrated to that of the PTW PinPoint
TM IC under reference conditions. The scanning process was repeated with the MOSkin on the surface of the phantom, measuring at a water equivalent depth of 0.07 mm as per the ICRU definition for skin dose [
36].
The dose delivered to the PTW PinPointTM IC was read out using the PTW Unidos Webline electrometer. Biasing conditions were set in accordance with the calibration certification supplied by PTW: a bias of +400 V was applied to the IC using the internal biasing function of the electrometer. Correction factors were applied for temperature and pressure, polarisation, electrometer calibration factor, and recombination. The chamber was calibrated for energy corrections to a TH100 radiation source with a similar energy spectrum to that of the CT scans.
2.6. Positioning and Image Calibration
As part of the pre-treatment preparation, it is necessary to identify the centre of the treatment beam and establish the treatment isocenter. The beam position is fixed within the hutch, and so the patient must be aligned to the beam. For our configuration, the DynMRT calibration protocol outlined in Barnes 2018 [
29] was followed. In brief, a
diameter ball bearing was used to identify and align the mechanical isocentre of the DynMRT stage to the treatment beam. Limited by the pixel size of the imaging detector, alignment was accurate to within
.
With the mechanical isocentre of the DynMRT system calibrated, the ball bearing now identifies the treatment system isocentre. The orthovoltage X-ray imaging setup was used to image the position of the ball bearing and calibrate the imaging system to the treatment system; the alignment, again limited by the pixel size of the imaging detector, was accurate to within .
2.7. Image Registration for Alignment
To align the target volume present within the CT data set to the now defined centre of the treatment beam, images acquired within each frame of reference must be co-registered. To achieve this, the image guided radiotherapy system, SyncMRT developed specifically for the DynMRT stage in IMBL Hutch 2B is implemented. SyncMRT provides a user-friendly interface to import CT DICOM and planar image sets allowing a user to manually select points common to both data sets. SyncMRT calculates the optimum 6D rigid body transformation to co-register the two sets of manually selected points, the solution is then reduced to a 4D solution accounting for the lack of rotational freedom about the transverse and longitudinal axis. SyncMRT allows for 3 or more pairs of markers to be identified to align the two data-sets and determine the tumour position. In our work, we found that 6 well-described anatomical landmarks provided more consistent results than using the minimum 3 markers. SyncMRT allows a clinical treatment plan to be used to identify tumour and beam positions; however, this is not required in this work as the exact tumour locations can be determined directly from the CT datasets, and skeletal landmarks visible in both the CT dataset and planar X-ray images provides adequate detail for alignment.
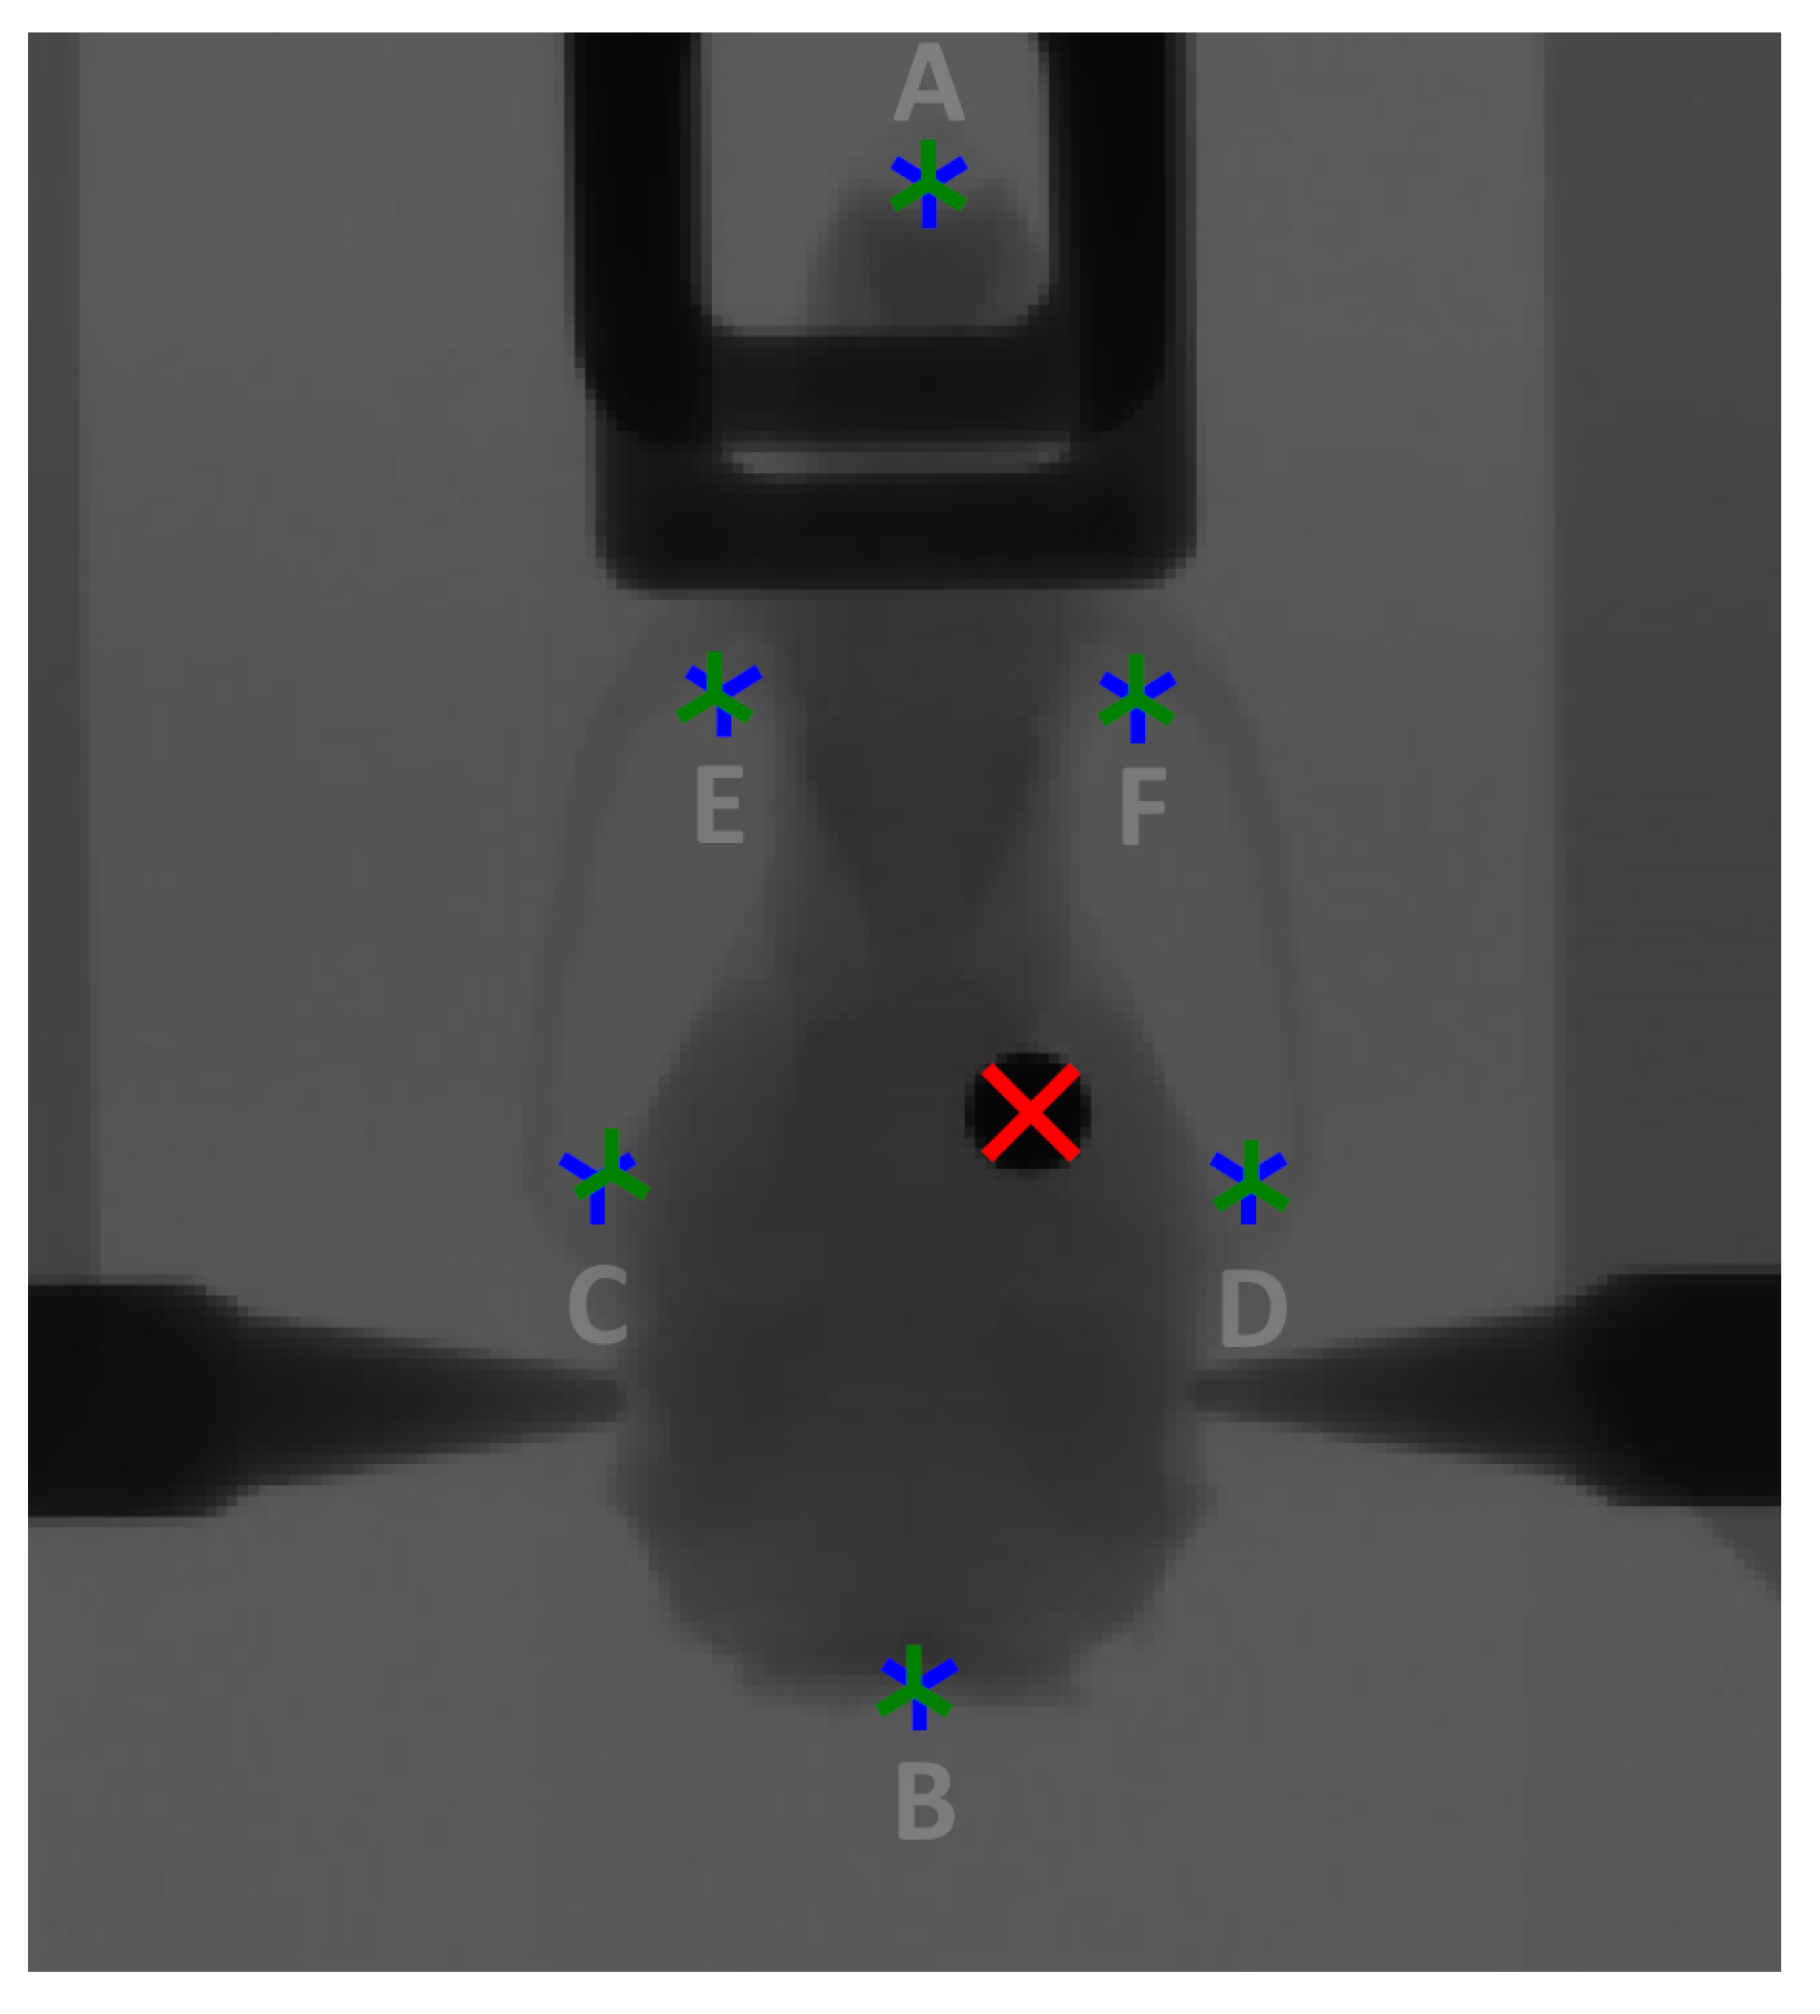
Figure 2 below shows a radiograph of the treatment phantom mounted on the DynMRT stage with overlays of the output of the rigid body co-registration process. The location of the red cross indicates the calculated location of the ball bearing as recorded on the CT scan showing good agreement to the visible location of the ball bearing from the conventional radiograph image. Further details of the image co-registration and translation calculations can be found in Barnes, 2018 [
29]. The tumour of a patient would not be visible on this radiograph and so was ignored for alignment purposes, serving only as a validation.
Figure 2 also identifies the six prominent skeletal landmarks used for registration between the DRR and conventional radiograph. They are (A) the distal tip of the median line, (B) posterior tip of the occipital bone, (C, D) left and right zygomatic process of the squamosal bone and (E, F) the left and right anterolateral corner of the frontal bone.
The DynMRT stage was translated to place the inferred position of the ball bearing (red cross) at the centre of the treatment field. The stage was then rotated to face the synchrotron treatment beam at normal incidence and treated using an 8 mm × 8 mm square microbeam field.
2.8. Image Guided MRT Workflow
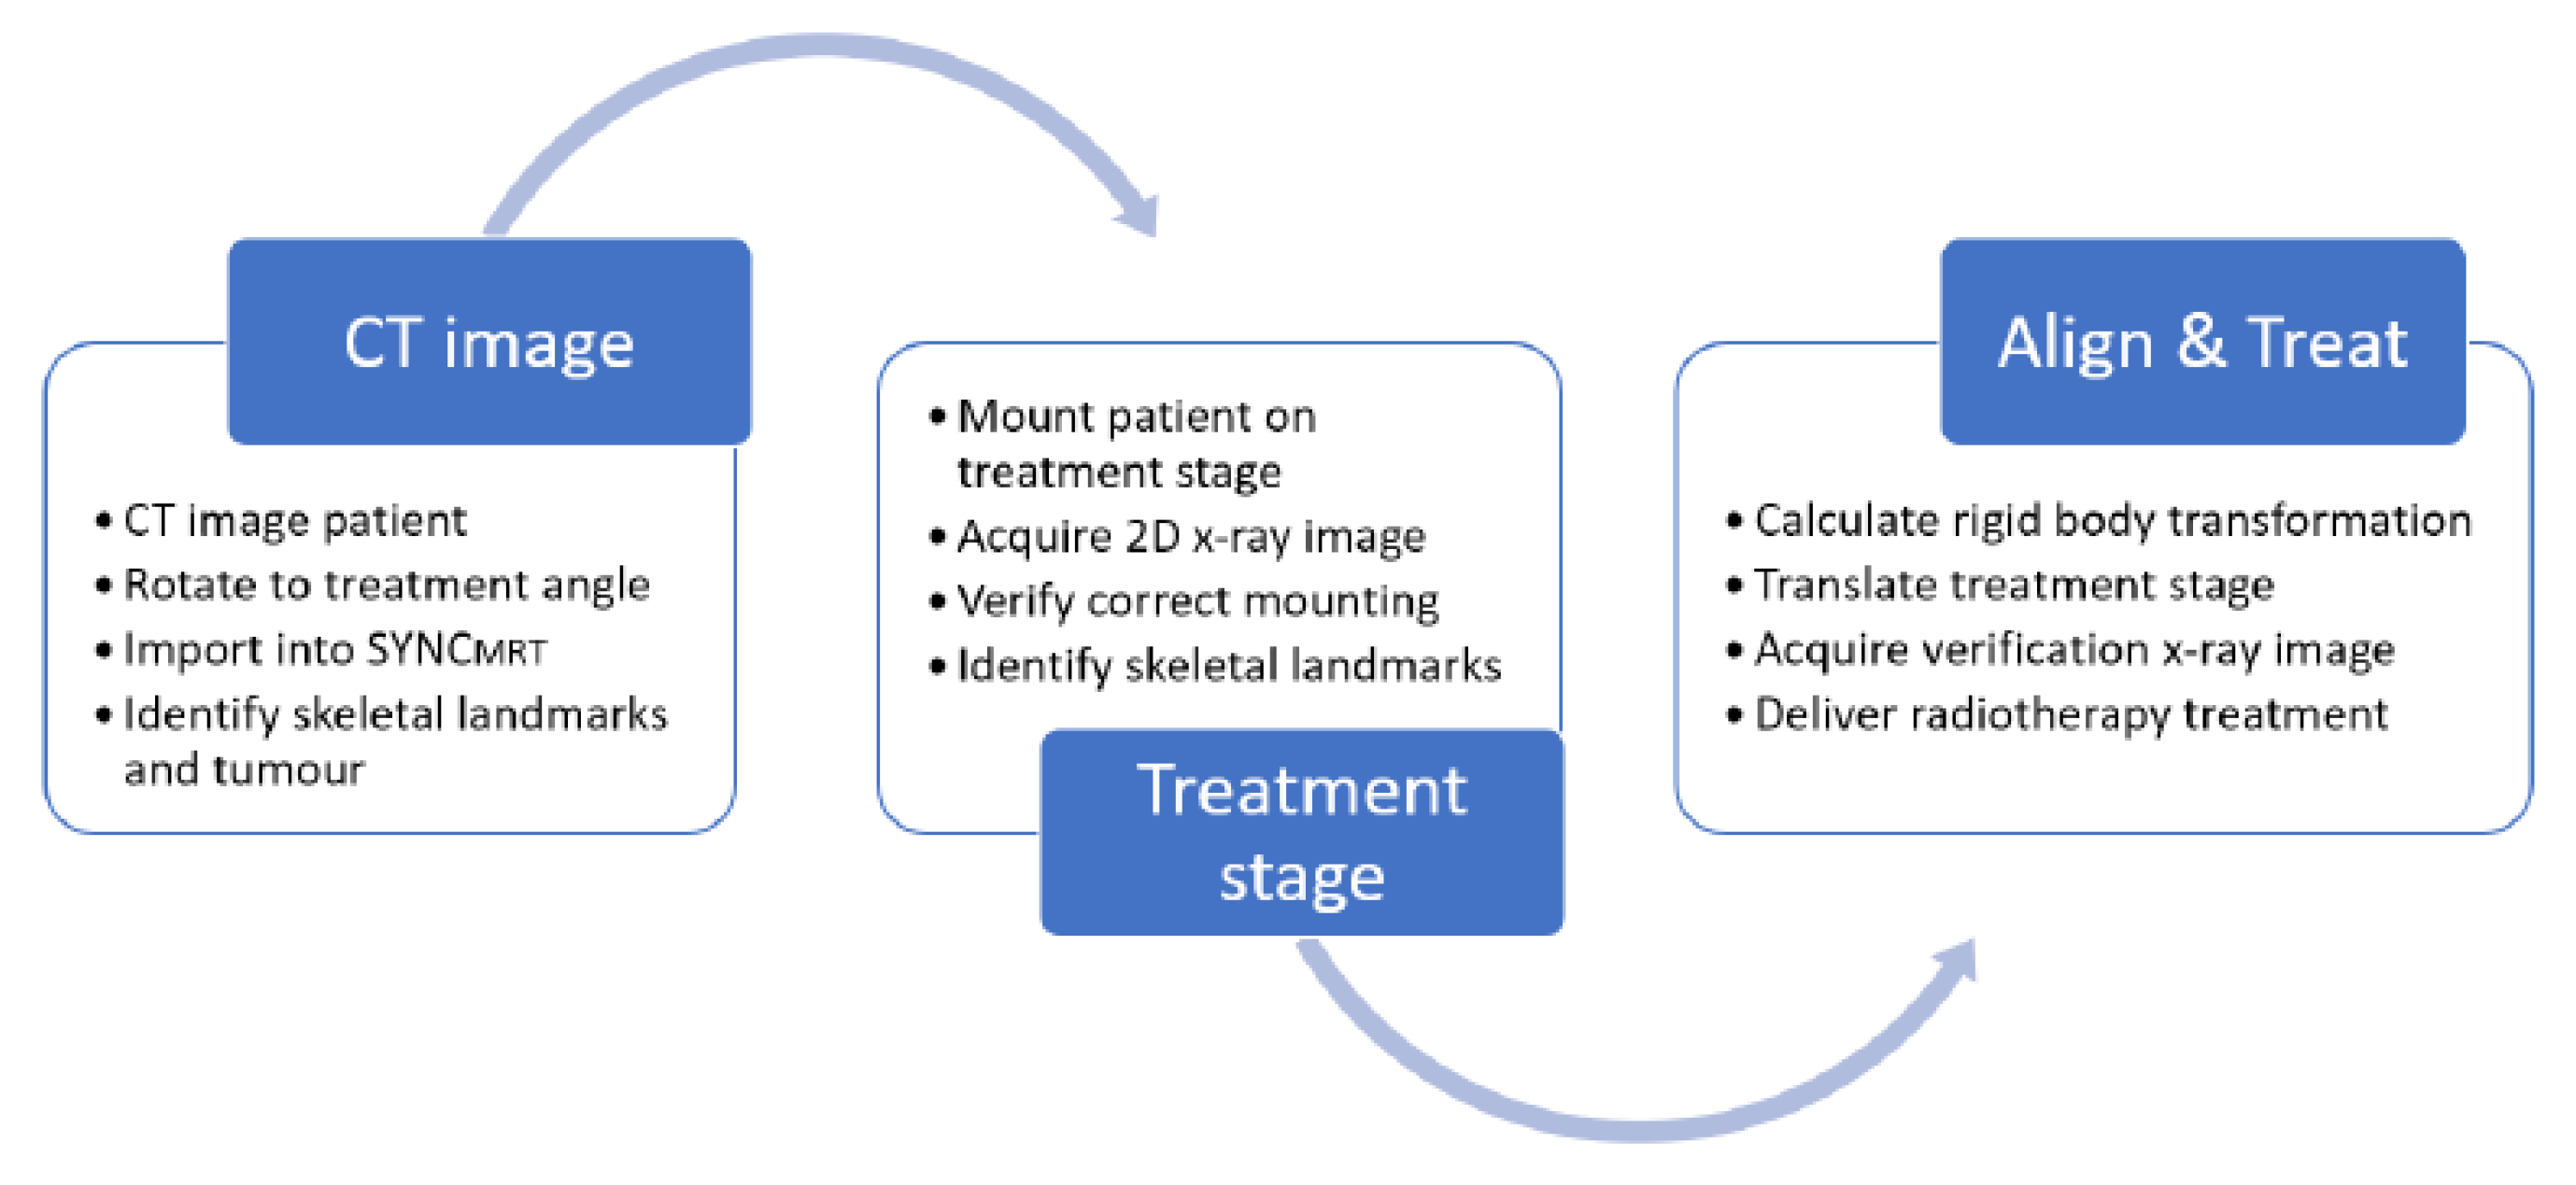
Given the tools available to a user at IMBL, the following workflow is proposed:
Expanding in greater detail on
Figure 3, the workflow is as follows.
Patients are imaged at the adjoining Monash Biomedical Imaging facility on a Siemens SOMATOM go.Up clinical CT scanner, mounted horizontally in a stereotactic frame. Intravenous iodine contrast is injected to provide tumour contrast.
The CT dataset is then digitally orientated to reflect the desired beam’s eye view of the synchrotron beam for treatment; the orientated CT dataset is then exported.
The exported CT dataset is then imported into SyncMRT and summed down the beam’s eye view, producing a DRR for comparison to the later acquired planar radiograph.
The tumour volume is then visually identified in the CT dataset and selected by the user.
The patient is then mounted vertically on the DynMRT stage in a stereotactic frame and a 2D planar image is acquired with the off-axis imaging system. The location of six prominent skeletal landmarks are then selected in both the DRR and newly acquired planar radiograph.
The tumour location with respect to the identified skeletal landmarks was identified in the DRR. Given that the skeletal landmarks are readily visible in the planar radiograph, assuming a rigid body transformation between the DRR and planar radiograph, the location of the tumour in the planar radiograph can be calculated.
SyncMRT is used to calculate and apply the necessary transformation to the treatment stage, aligning the centre of the tumour volume with the centre of the treatment field.
A second radiograph is taken for alignment verification immediately before treatment. SyncMRT overlays the centre and extremities of the treatment field over the radiograph. If any issues in the patients’ position are observed then steps 7 and 8 are repeated until the alignment is satisfactory. Once the alignment is satisfactory, treatment may commence.
With stage calibration, CT scans reconstructed and loaded into SyncMRT in advance, steps 4 through 8 may be completed in as little as three minutes per patient, minimising the time the patient is sedated and enabling fast patient turnover. This efficient process also serves to reduce the potential pain and distress an animal may experience during treatment, consistent with the refinement step of the three Rs principle in animal experimentation. The DynMRT treatment stage is the only component used that would limit the use of this protocol to image and treat larger animals.
3. Results and Discussion
3.1. CT Scans and Associated Dosimetry
Balancing scan time, iodine clearance and image resolution, scans on the Inveon Multimodality System were found to be optimal with 142 projections, each 200 ms at 80 kVp. Total imaging time is 10 min. The resulting image provides 97 μm × 97 μm × 97 μm voxel resolution of a 9 cm × 9 cm × 9 cm volume. The 10 cm bore of the scanner limits suitability for imaging larger animals.
The Siemens SOMATOM go.Up scanner was found to be optimal operating at 42 mA at 80 to 110 kVp, using the minimum available slice thickness. Imaging time is drastically shorter with a volume of 51 cm × 51 cm × 20 cm imaged in 15 s. The reconstructed image provides a 300 μm × 300 μm × 300 μm voxel resolution. The large 70 cm bore makes this scanner suitable for imaging larger animals or humans.
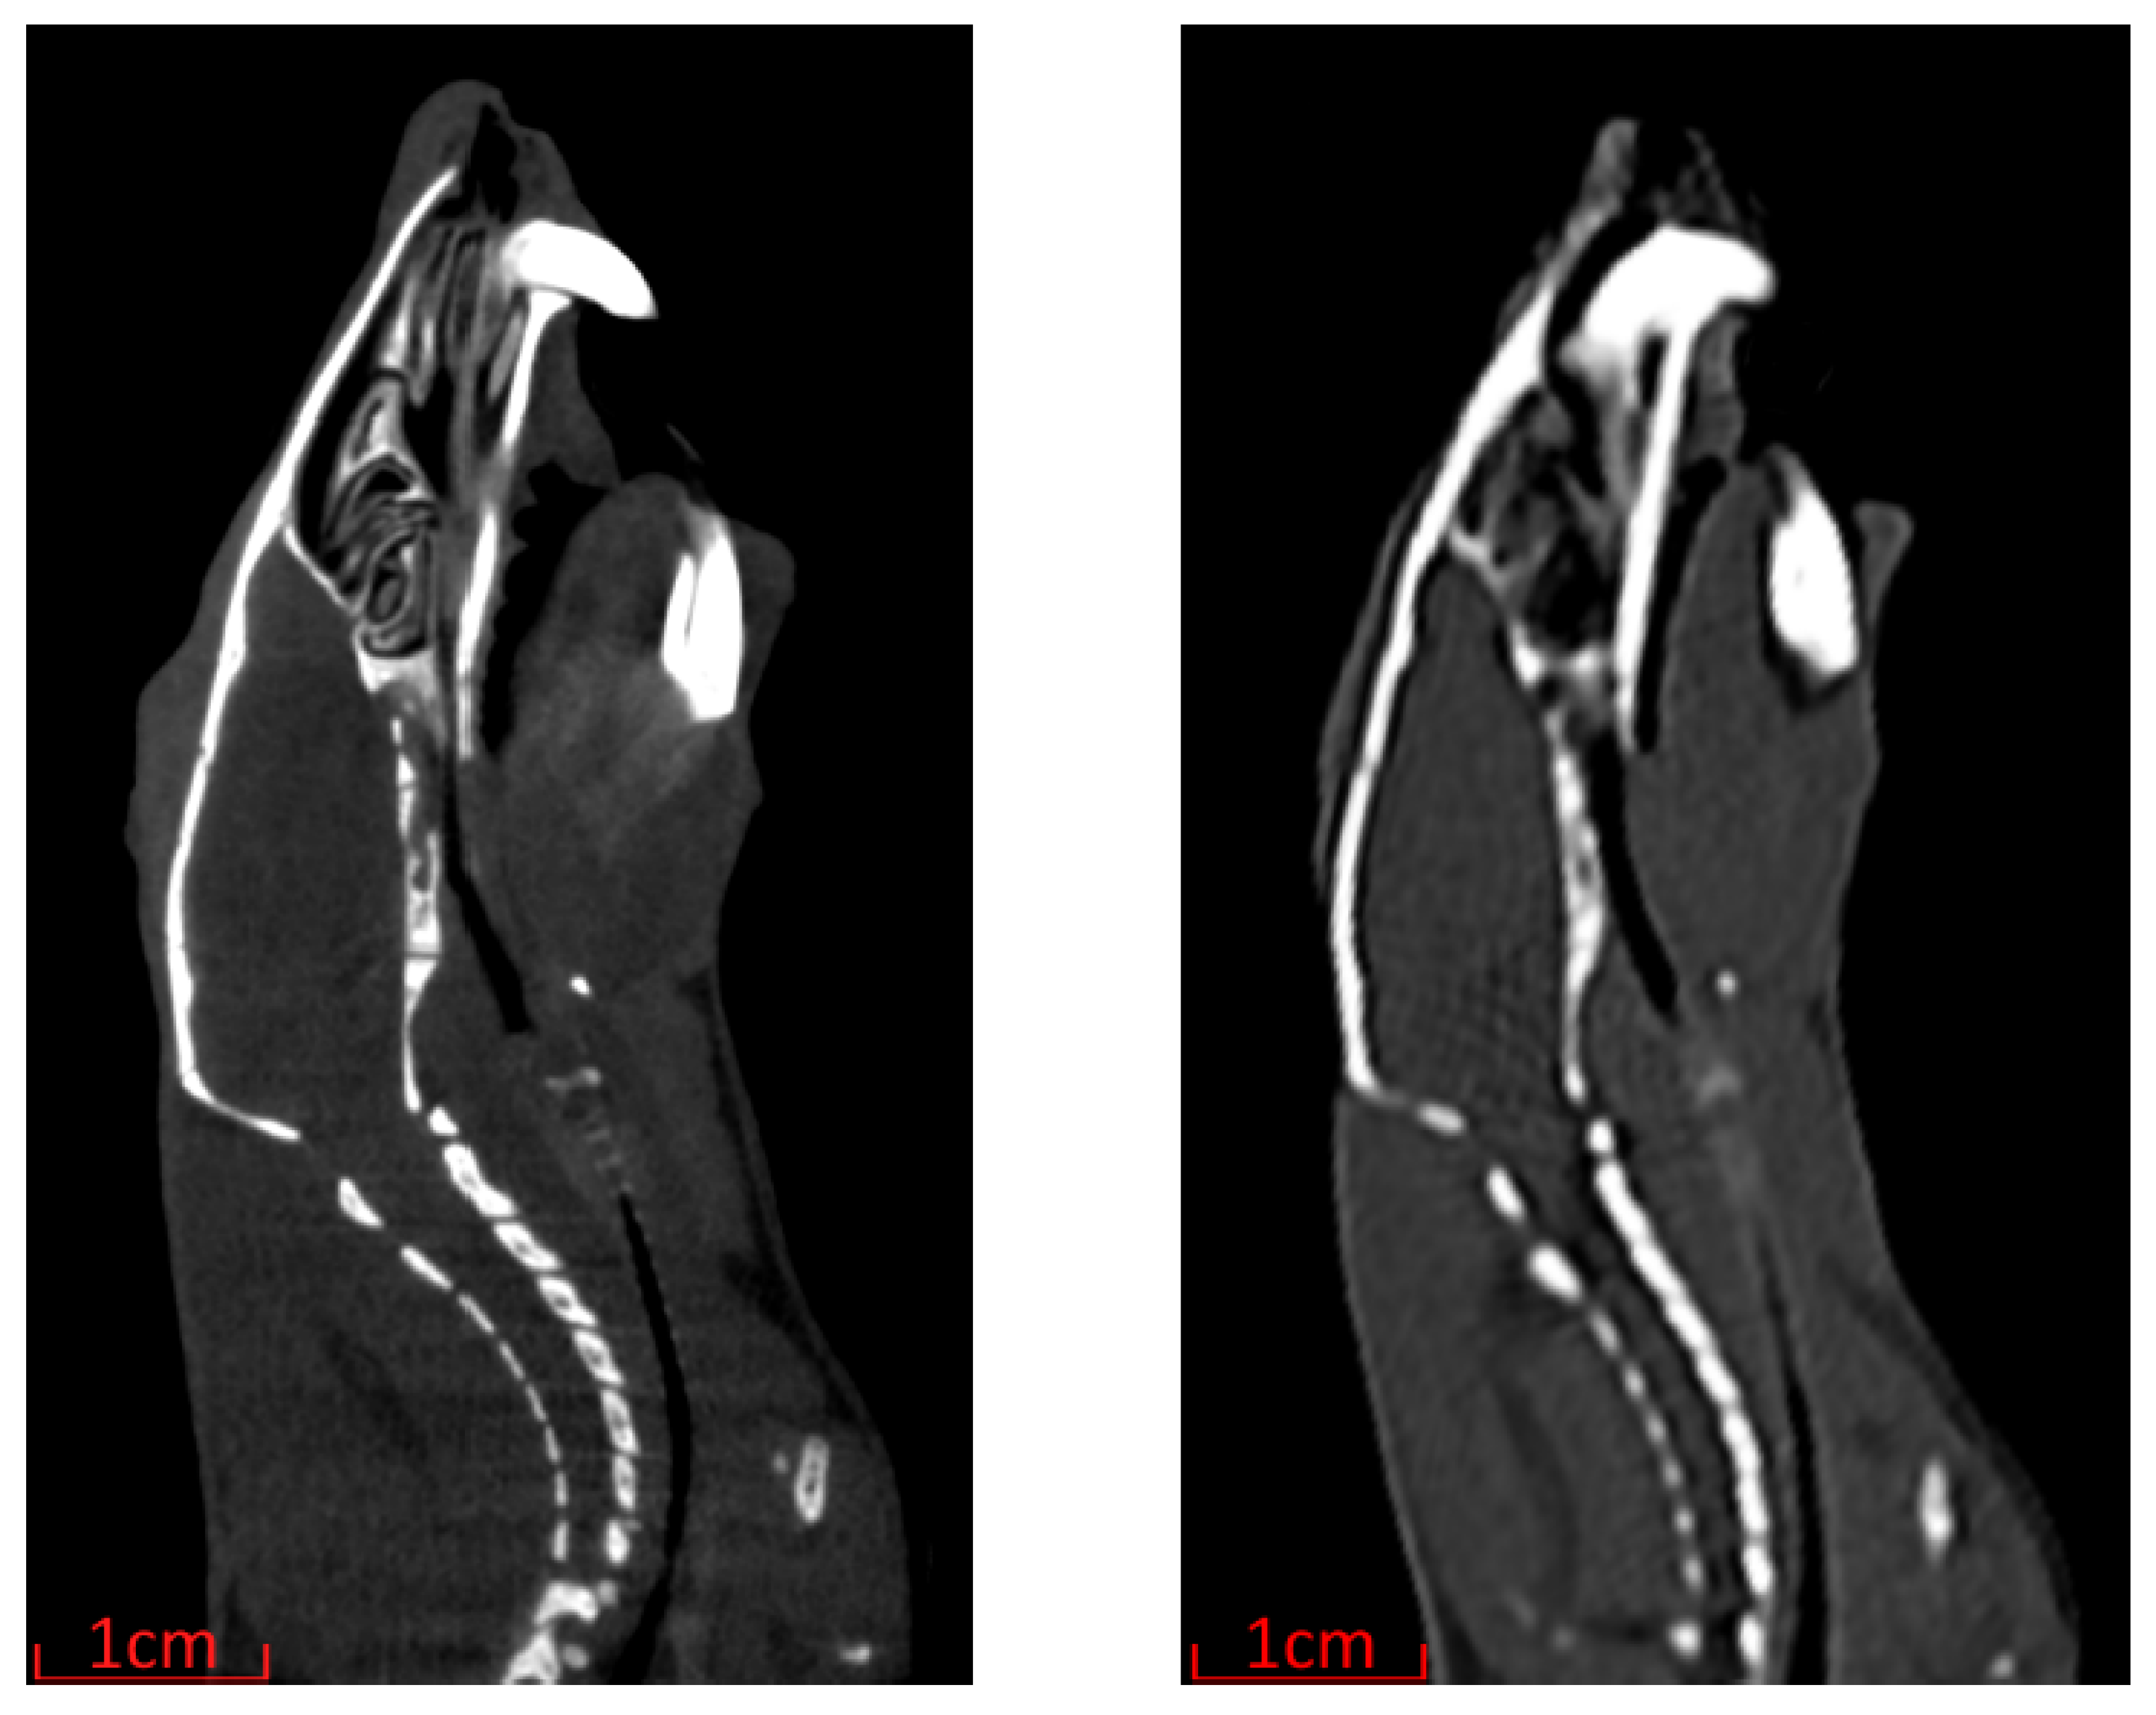
The greatly reduced time per scan and maximum patient size of the Siemens SOMATOM go.Up come at the cost of decreased spatial resolution compared with the Inveon Multimodality System as highlighted in
Figure 4. Despite the decreased resolution, as the tumour volume and skeletal landmarks are easily identifiable, the Siemens SOMATOM go.Up was the scanner chosen for image-guided MRT in this work.
After imaging the simple bone and water small animal phantom, partially filled with 1ml of 2mg/mL iodine in water solution. Scans were reconstructed using all available reconstruction kernels. Peak X-ray energy was not a major contributor to image quality, with average standard deviation of pixel values in a uniform 20 mm × 20 mm × 20 mm region (noise) of Solid Water® at the centre of the phantom showing little difference from 9.6% for the lower energy 80kVP scans and a standard deviation of 11.7% for the higher energy 110 kVp scans.
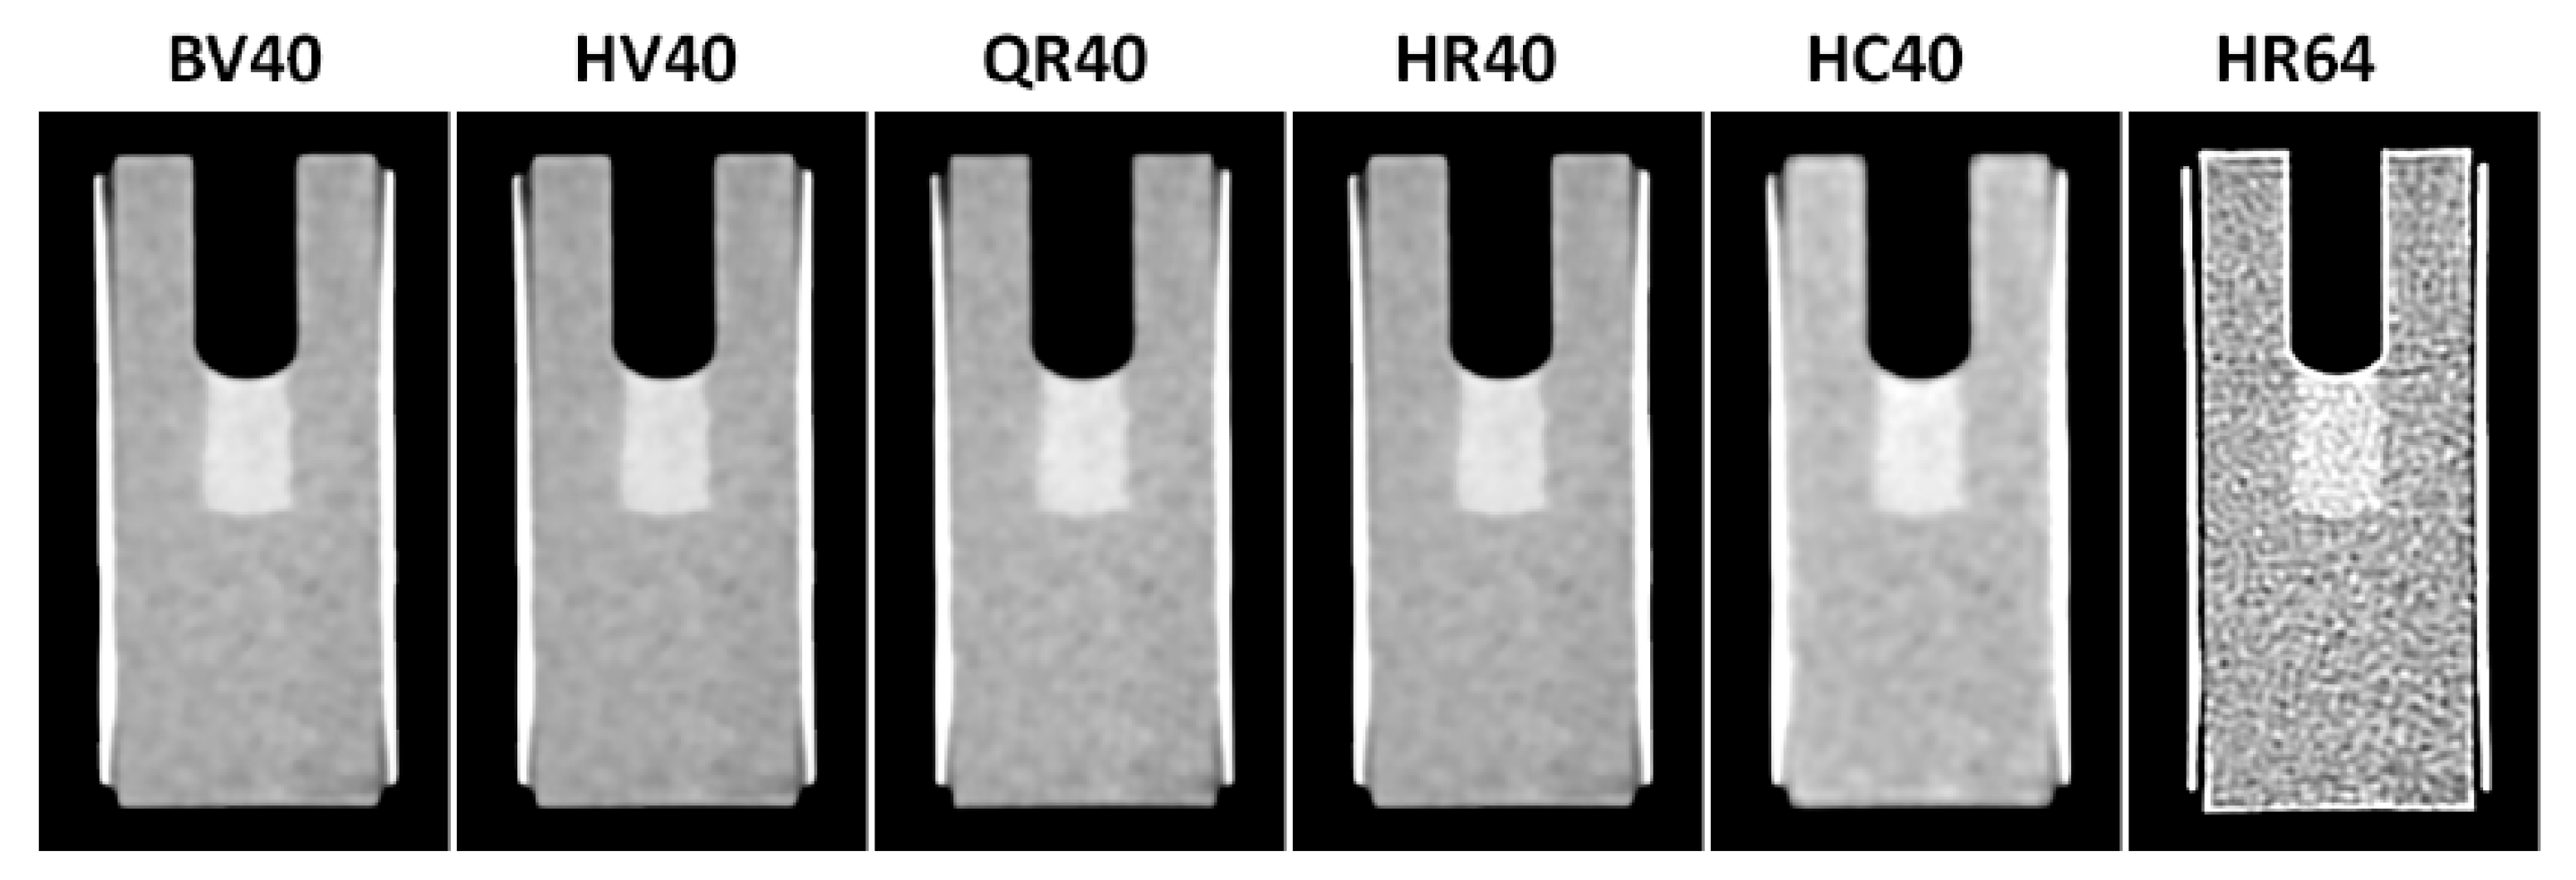
Selecting the reconstruction kernel is one of the few ways a user may influence the image reconstruction process of a clinical CT scanner. The selection of reconstruction kernel is a trade-off, with smoother filters lowering noise at the cost of reduced resolution. In our scans, we found the choice of reconstruction kernel greatly affected image noise, resolution and material contrast. The available reconstructions are ranked in
Figure 5, with equal importance on minimising noise and maximising the contrast between regions of Solid Water
® and iodine solution. With the assumption that high contrast and low noise image would make manual tumour identification easiest.
From this, the optimal reconstruction kernels are deemed to be BV40 and HV40, with both kernels producing almost identical reconstructions.
Radiographic imaging increases the radiation dose to the patient, in ways other than the intended treatment. To minimise the potential for negative effects due to imaging, this dose must be reduced as much as possible.
The CT scanning process as outlined for the Inveon Multimodality System resulted in a skin dose of (8.63 ± 0.43) as measured with the MOSkinTM detector and a dose of (7.24 ± 0.29) at depth within a 25 mm × 25 mm × 55 mm phantom as measured with the PTW PinPointTM ion chamber.
The CT scanning process as outlined for the SOMATOM go.Up resulted in a skin dose of (1.39 ± 0.08) as measured with the MOSkinTM detector and a dose of (1.30 ± 0.05) at depth within a 25 mm × 25 mm × 55 mm phantom as measured with the PTW PinPointTM ion chamber.
The skin dose associated with the 2D X-ray imaging using the orthovoltage X-ray tube in Hutch 2B was found to be (0.028 ± 0.004) per image.
During the imaging and alignment stages, a rat is expected to receive only one CT scan and two planar radiograph X-ray images, for a total imaging skin dose of (1.44 ± 0.21) . Representing less than 0.21% of the minimum prescribed therapeutic target dose of Gy, this additional dose is negligible.
3.2. End to End Phantom Test
An upper limit to the image-guided alignment accuracy can be established by evaluating the constitute errors as outlined in
Table 1 below. The accuracy of the DynMRT stage calibration is limited to within a pixel deviation on the imaging detector. Ruby’s pixel size of
will be taken as the limit of accuracy here. The Siemens SOMATOM go.Up produced reconstructed images with 0.3 mm × 0.3 mm × 0.3 mm resolution. This is the limiting accuracy for identifying the tumour location as well as the location of skeletal landmarks. The accuracy of the planar radiograph used to image patients on the DynMRT stage is limited by the effective spatial resolution of the Hamamatsu flat panel detector with 0.16 mm × 0.16 mm per pixel. The stage motors display some mechanical slack when changing translation direction, precise to within 0.001
.
The combined uncertainty of targeting accuracy, may be considered as a treatment planning margin. A suitable treatment field should encompass the intended target including this treatment margin.
From the CT images obtained, an alignment phantom was created and 3D printed in polylactic acid (a thermoplastic polyester) on a fused deposition modeling printer. The phantom was an anatomically simplified model of a rat skull containing a hole centred on the previously identified tumour location. A
diameter steel ball bearing was inserted into the hole, as shown in
Figure 6. This phantom provided a rigid body with relevant anatomical landmarks and a well-defined target (in the location of the tumour) easily identifiable in CT and radiographic film images. As such, this phantom served as a tool for end-to-end verification, testing if accuracy was sufficient to proceed with in vivo studies.
The phantom was placed in the same stereotactic surgical frame to be used for in vivo studies, then scanned in the horizontal position using the Siemens SOMATOM go.Up CT scanner with
slice thickness and reconstructed 300 μm × 300 μm × 300 μm voxel resolution. The scan was reconstructed to produce a stack of coronal images then imported into Fiji [
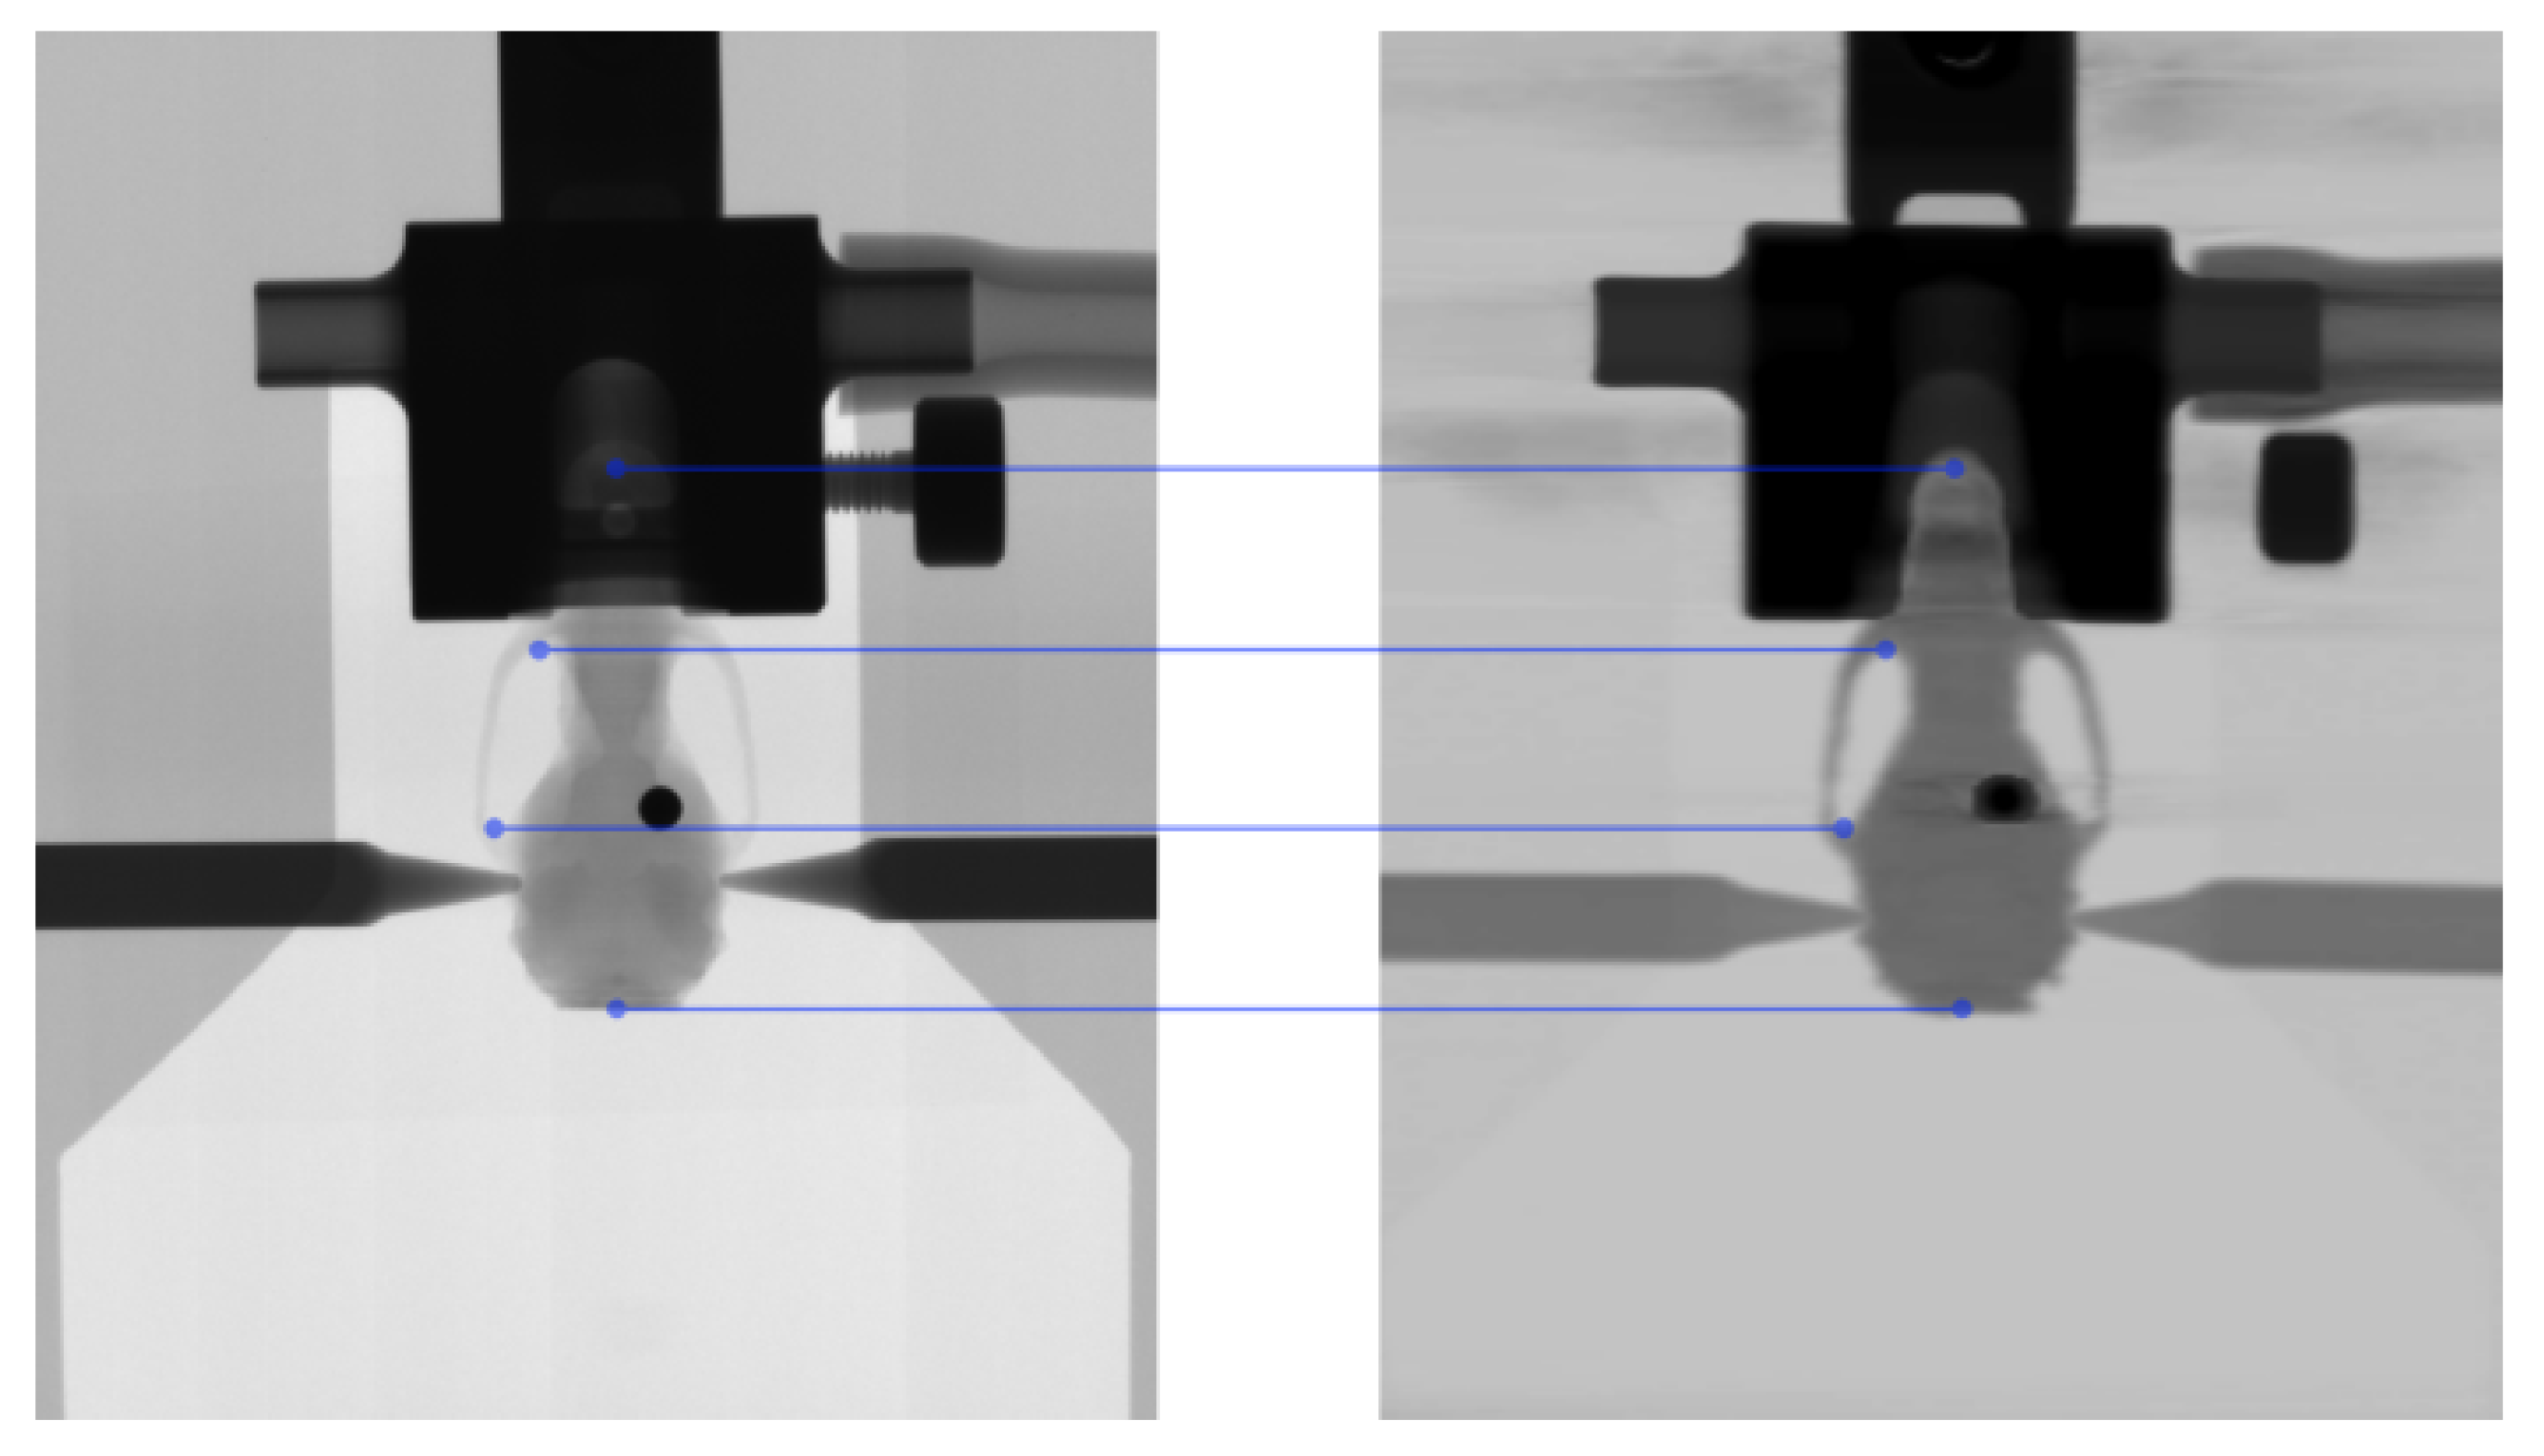
37] and rotated about all three axes to align the scan with the intended treatment frame. To replicate the handling process that may be applied to animal studies, the rat phantom was removed from the stereotactic frame and transported to Hutch 2B where it was again mounted with the stereotactic frame that was, in turn, mounted vertically to the DynMRT Stage. The stage was rotated to face the orthovoltage X-ray tube and imaged as outlined above. The two images displayed in
Figure 7 were then co-registered using
SyncMRT as described above, using only the six pre-defined skeletal landmarks. The location of the ball bearing was then inferred within the DynMRT stage co-ordinate system, aligned to the treatment field and treated in the AP position.
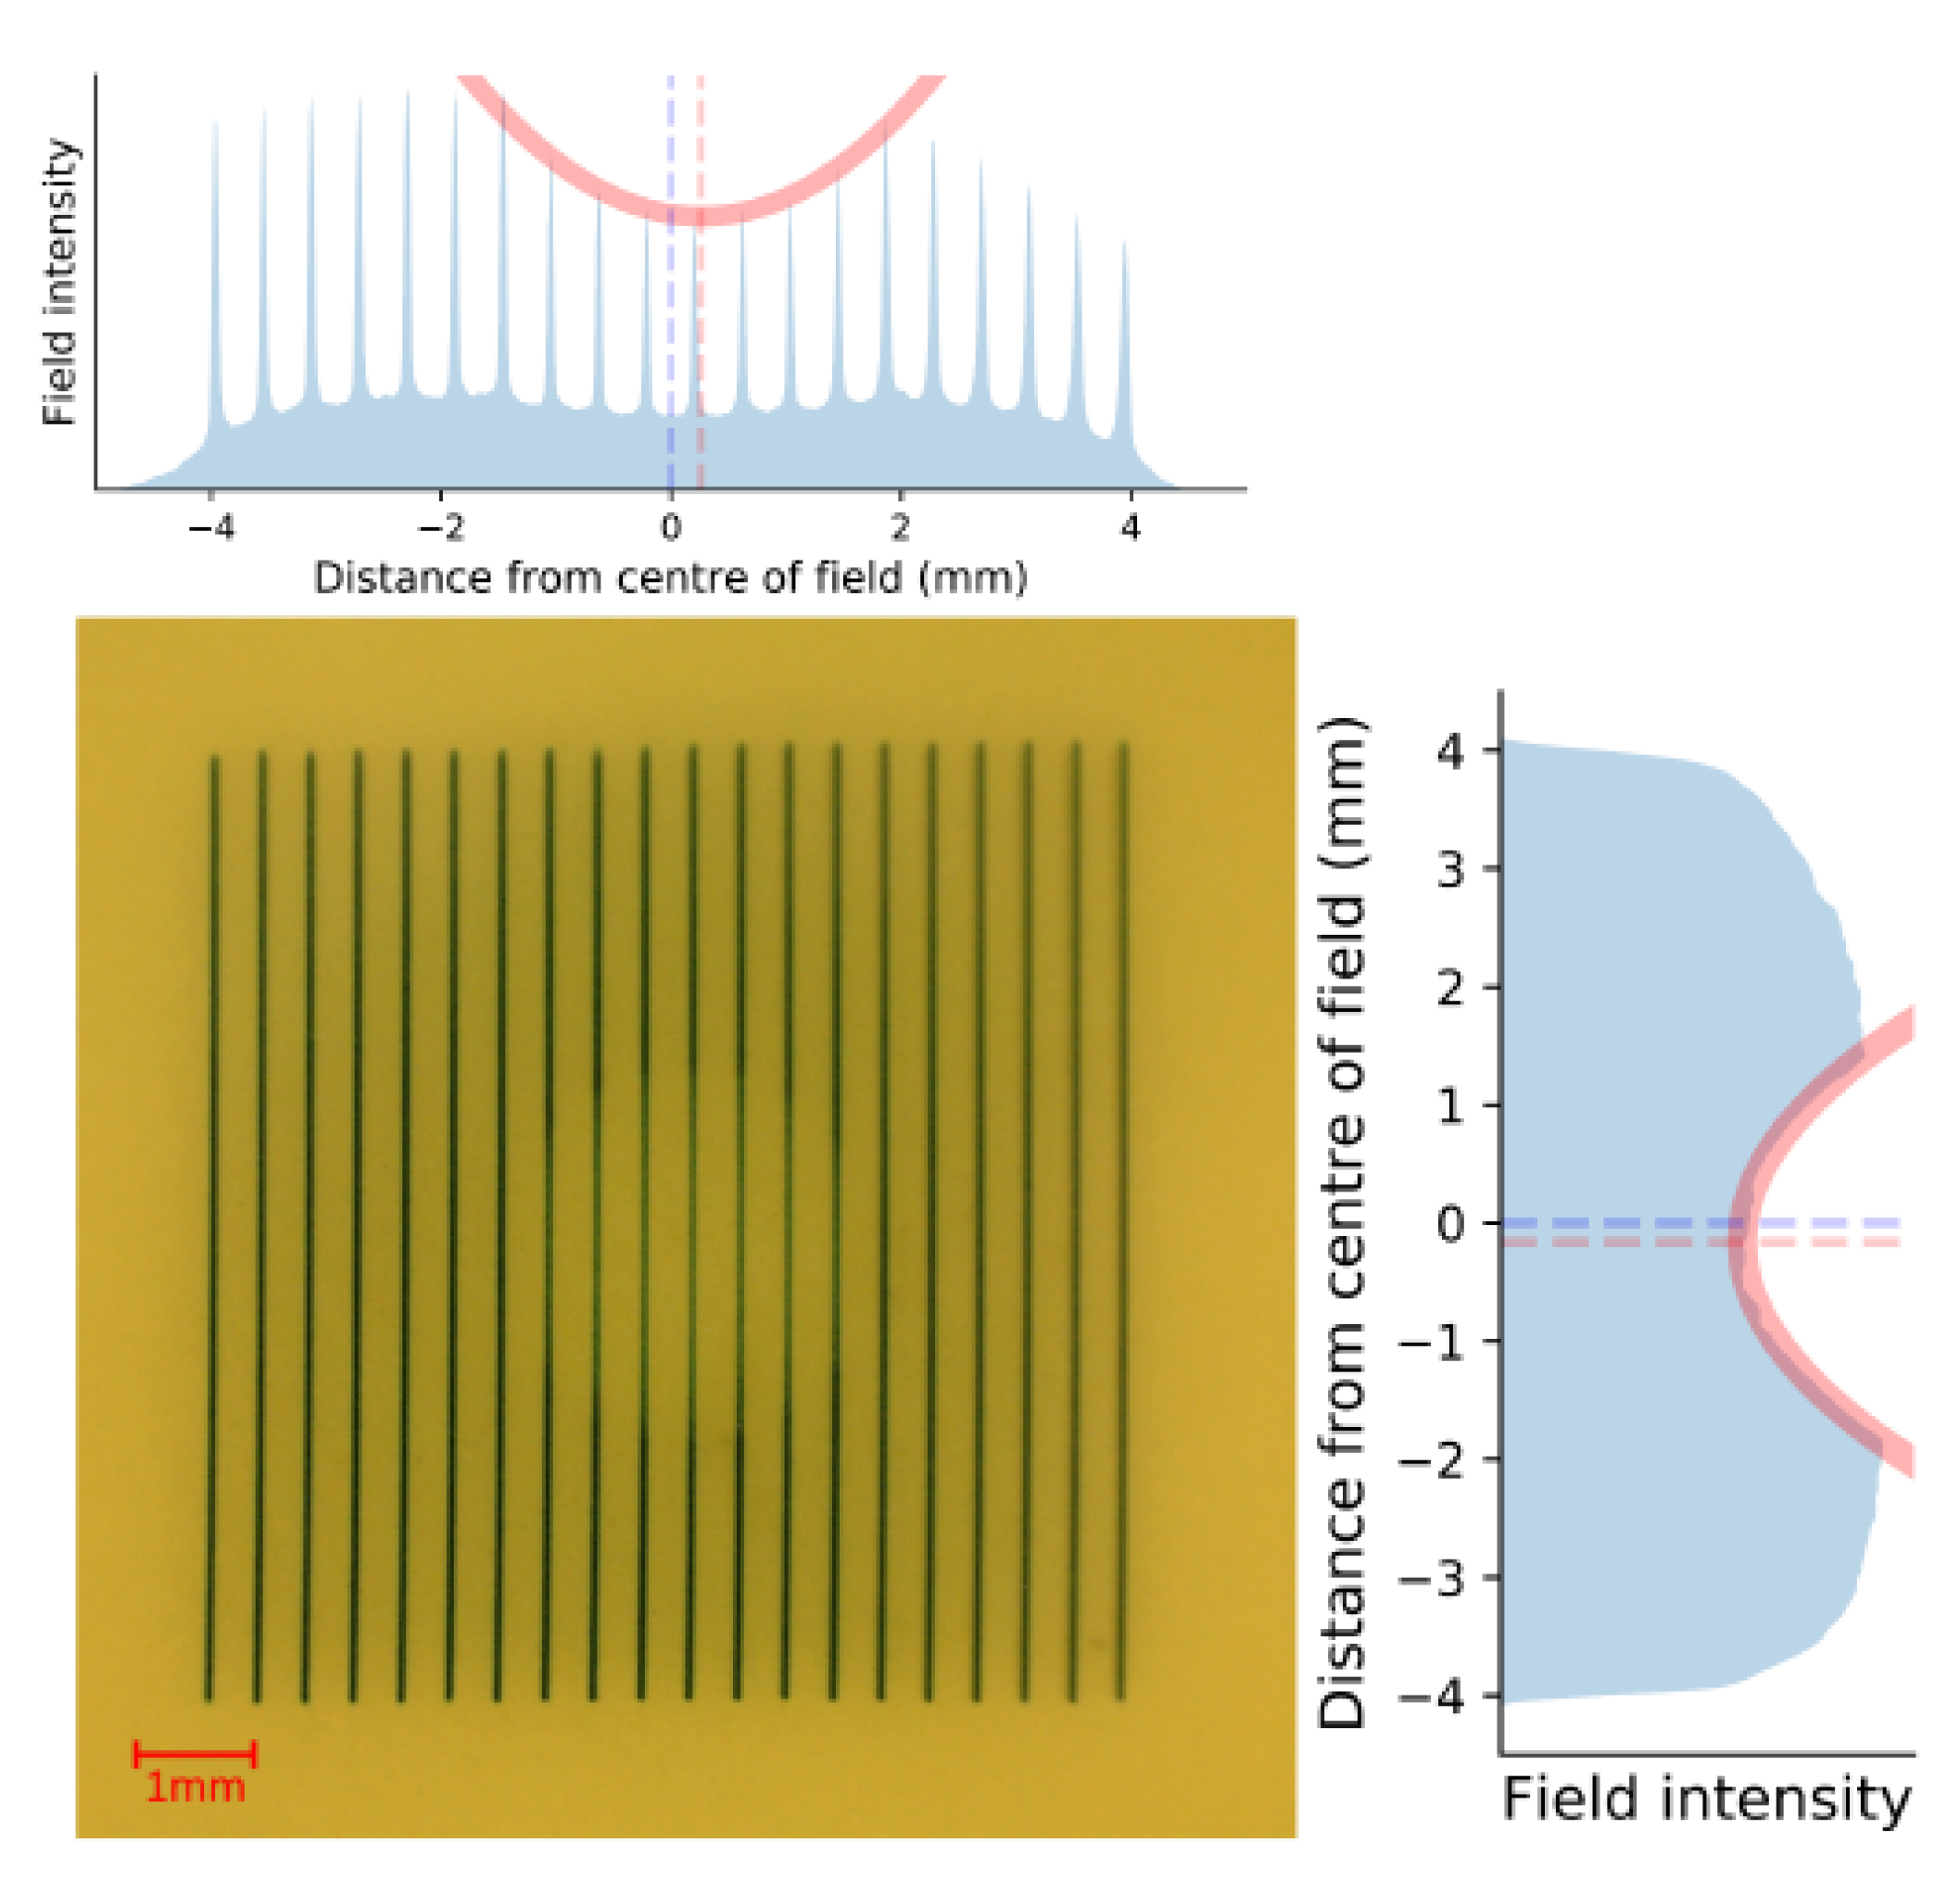
GafChromic
TM HDV2 film placed on the exit side of the rat phantom, seen in
Figure 8, was used to assess the alignment accuracy. Microbeams attenuated by the metal ball bearing target reduce the beams intensity, appearing lighter on the film. To find the centre of the ball bearing, a Gaussian fit was applied to the 1D vertical and horizontal intensity profile of the film. Dashed lines in the figure show the centre of the field (blue) and the location of the ball bearing (red) as determined from the centre of the Gaussian fit. This film verified that the ball bearing had been centered to the treatment field, horizontally within
and vertically to within
for a total positioning accuracy of
, within the previously estimated positional uncertainty of
. This work presents the alignment of only a single anatomical phantom. Future studies should be conducted with larger sample size to gain statistical information of the alignment reproducibility.
3.3. Image-Guidance in vivo Verification
The validation of the image guidance system was applied to an in vivo experiment described in Engels et al. 2020 [
30]. As a means of validation of the targeting system, the position of the microbeam array relative to the centre of the tumour was measured using the brain histology of a rat in this study, 14 days after MRT. The complete use of animals is described in [
30]. In brief, all animal procedures were performed within the guidelines of the National Health and Medical Research Council (2013) Australian code for the care and use of animals for scientific purposes and under the approval of the University of Wollongong and Australian Synchrotron animal ethics committees (AE17/05 and AS-2017-001). In total, 35, male, 8-week old rats were injected on day 0 with 10,000 9L gliosarcoma cells to the right caudate nucleus of the brain (3.5 mm to the right of the bregma crossing, and 6
depth). On day 11 these rats were imaged according to the method outlined in
Section 2.8 using either the Inveon Multimodality System or SOMATOM go.Up, while under general anesthesia (2.5% isoflurane for maintenance and 5% for induction). To visualize the tumour within the CT scan, 1 mL of iodine contrast (Iomeron
® 350, Bracco Ltd., Tokyo, Japan) was injected intravenously into the lateral tail vein using a Teflon 24G 3/4′′ catheter. On day 12, the identified centre of each tumour in 25 rats (the remaining 10 rats were controls) was aligned to the MRT treatment field and treated with an 8 mm × 8 mm field as described above.
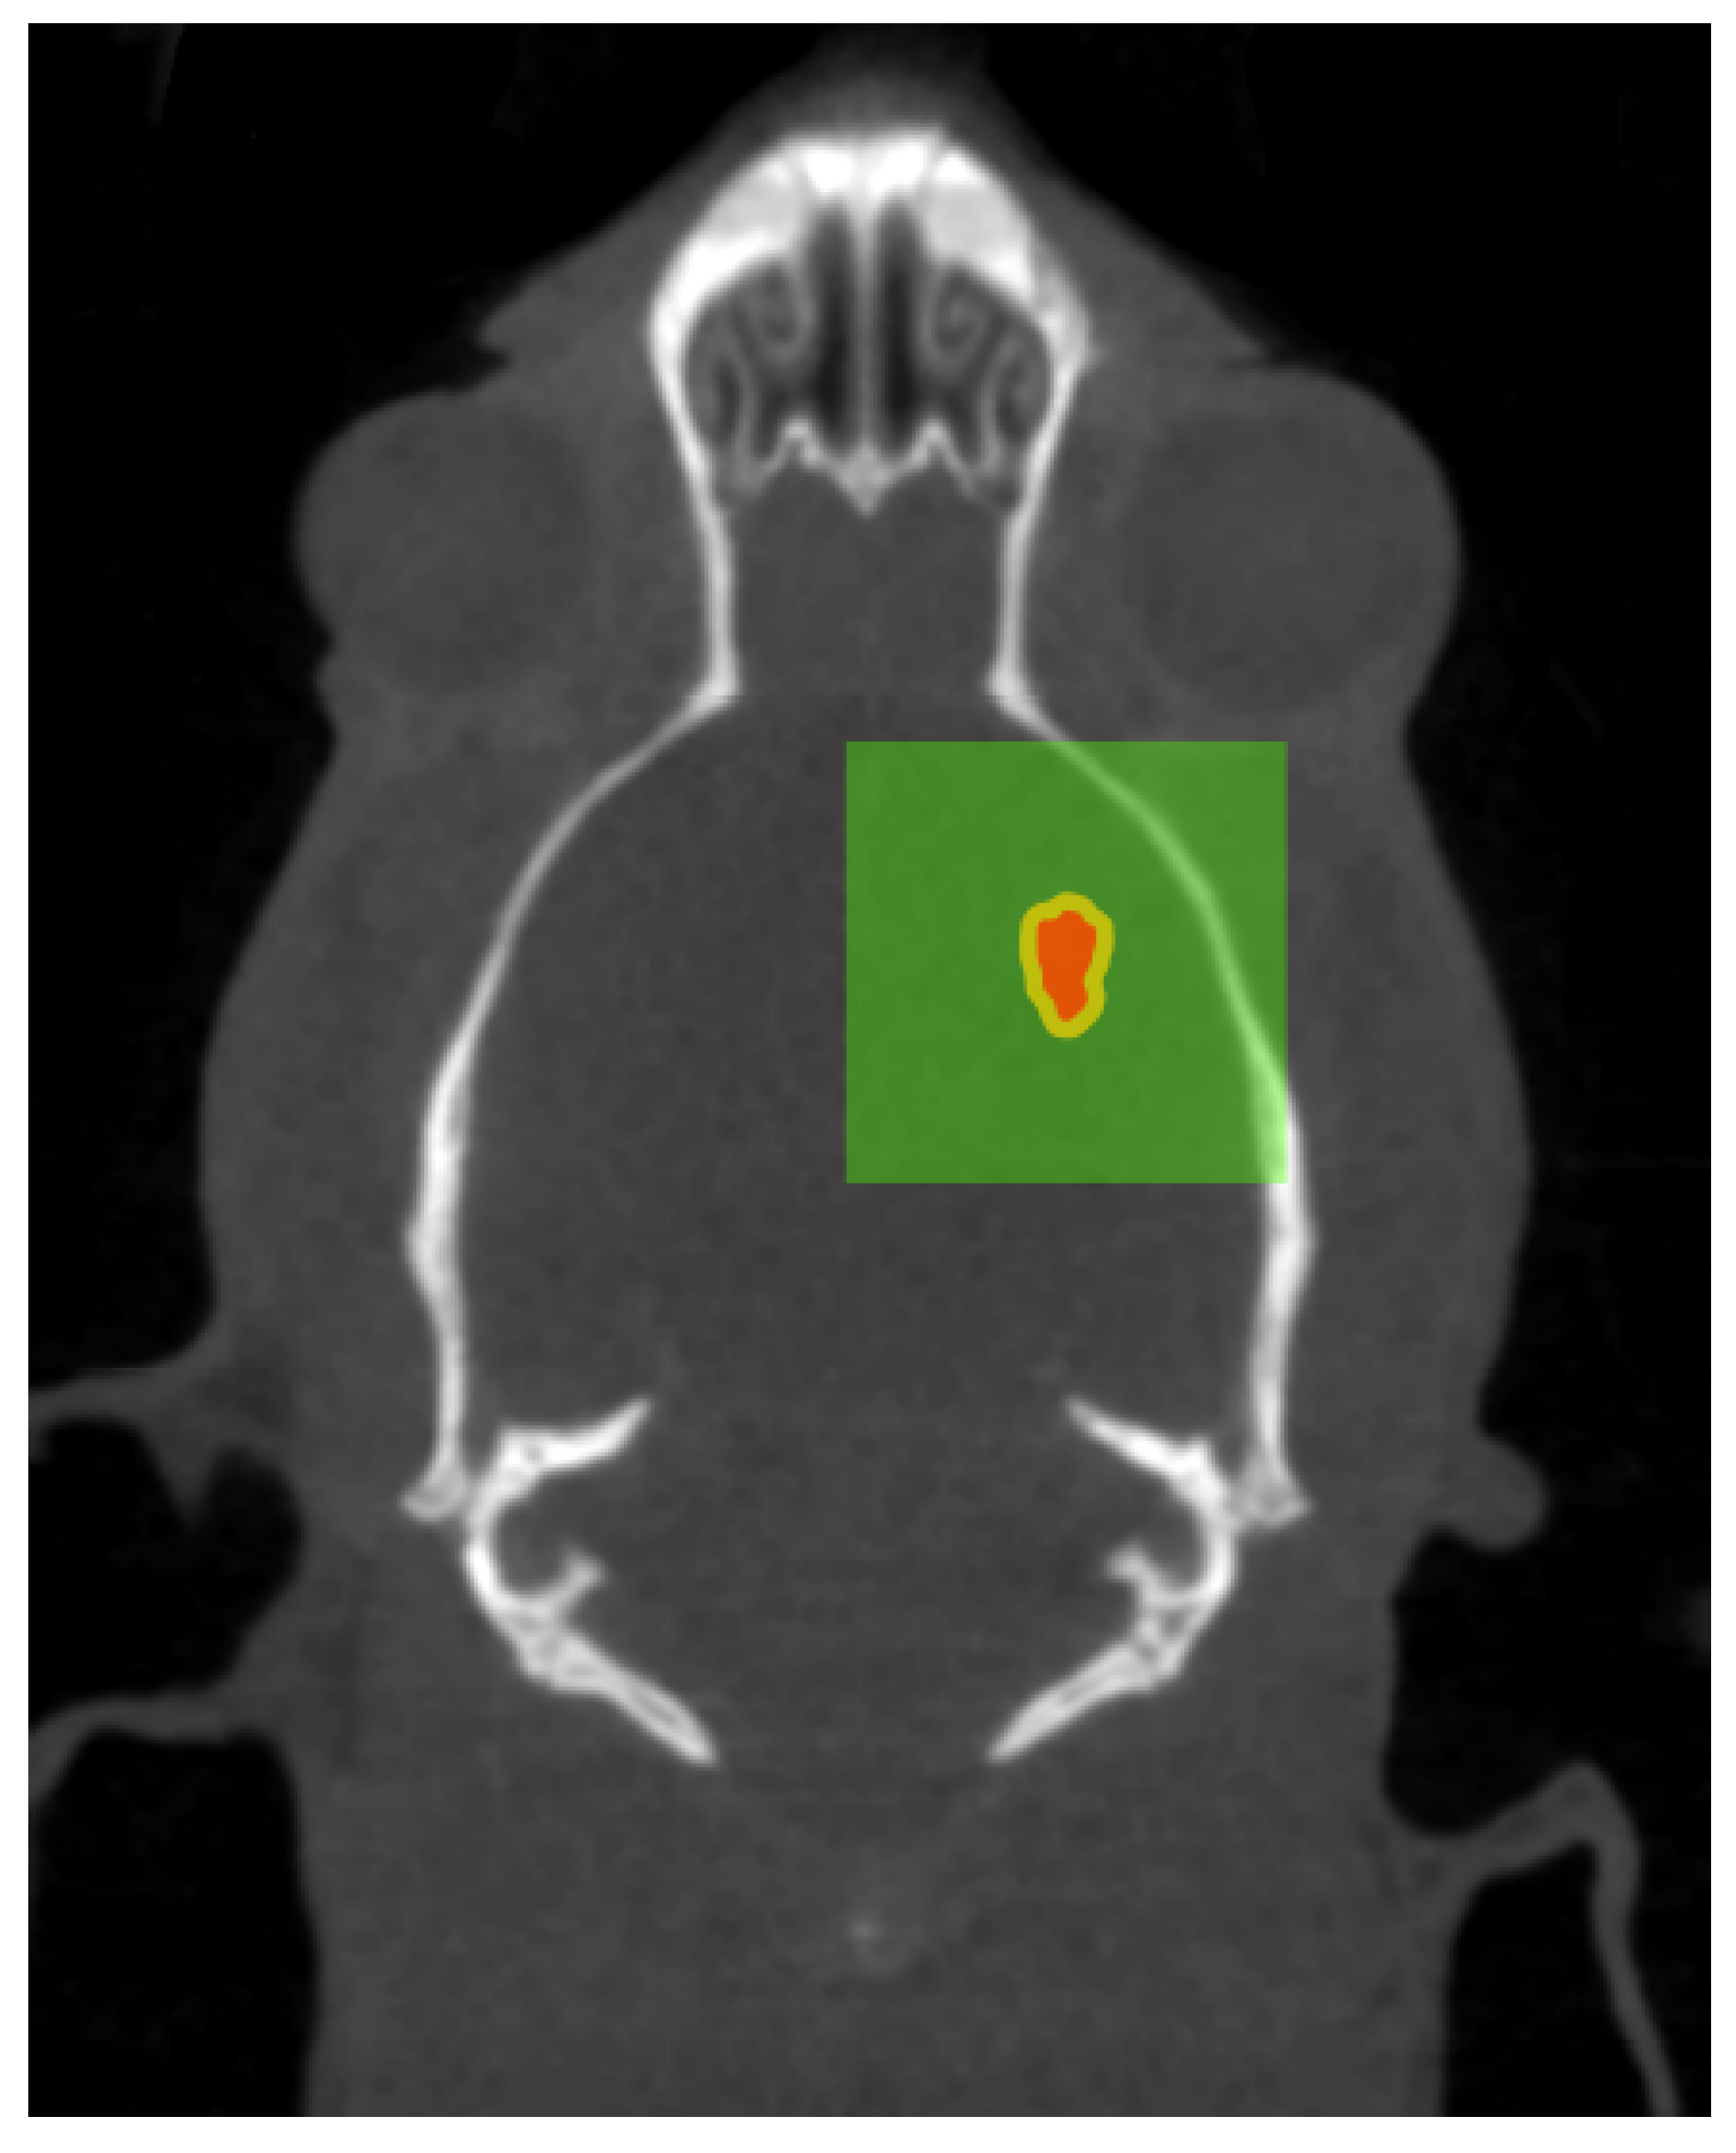
Figure 9 illustrates the intended treatment parameters as a result of the planning applied.
For histological analysis, a rat was euthanized with an intraperitoneal injection of lethabarb 14 days after MRT, using a 325 mg/mL solution to a dose of 800 mg/kg, according to Engels et al. [
30]. The brain was collected by removing the skull and placed immediately in 10% neutral buffered formalin for fixation. Fixed brains were sliced transversely, processed through graded alcohols and xylene, embedded in paraffin, to obtain 4
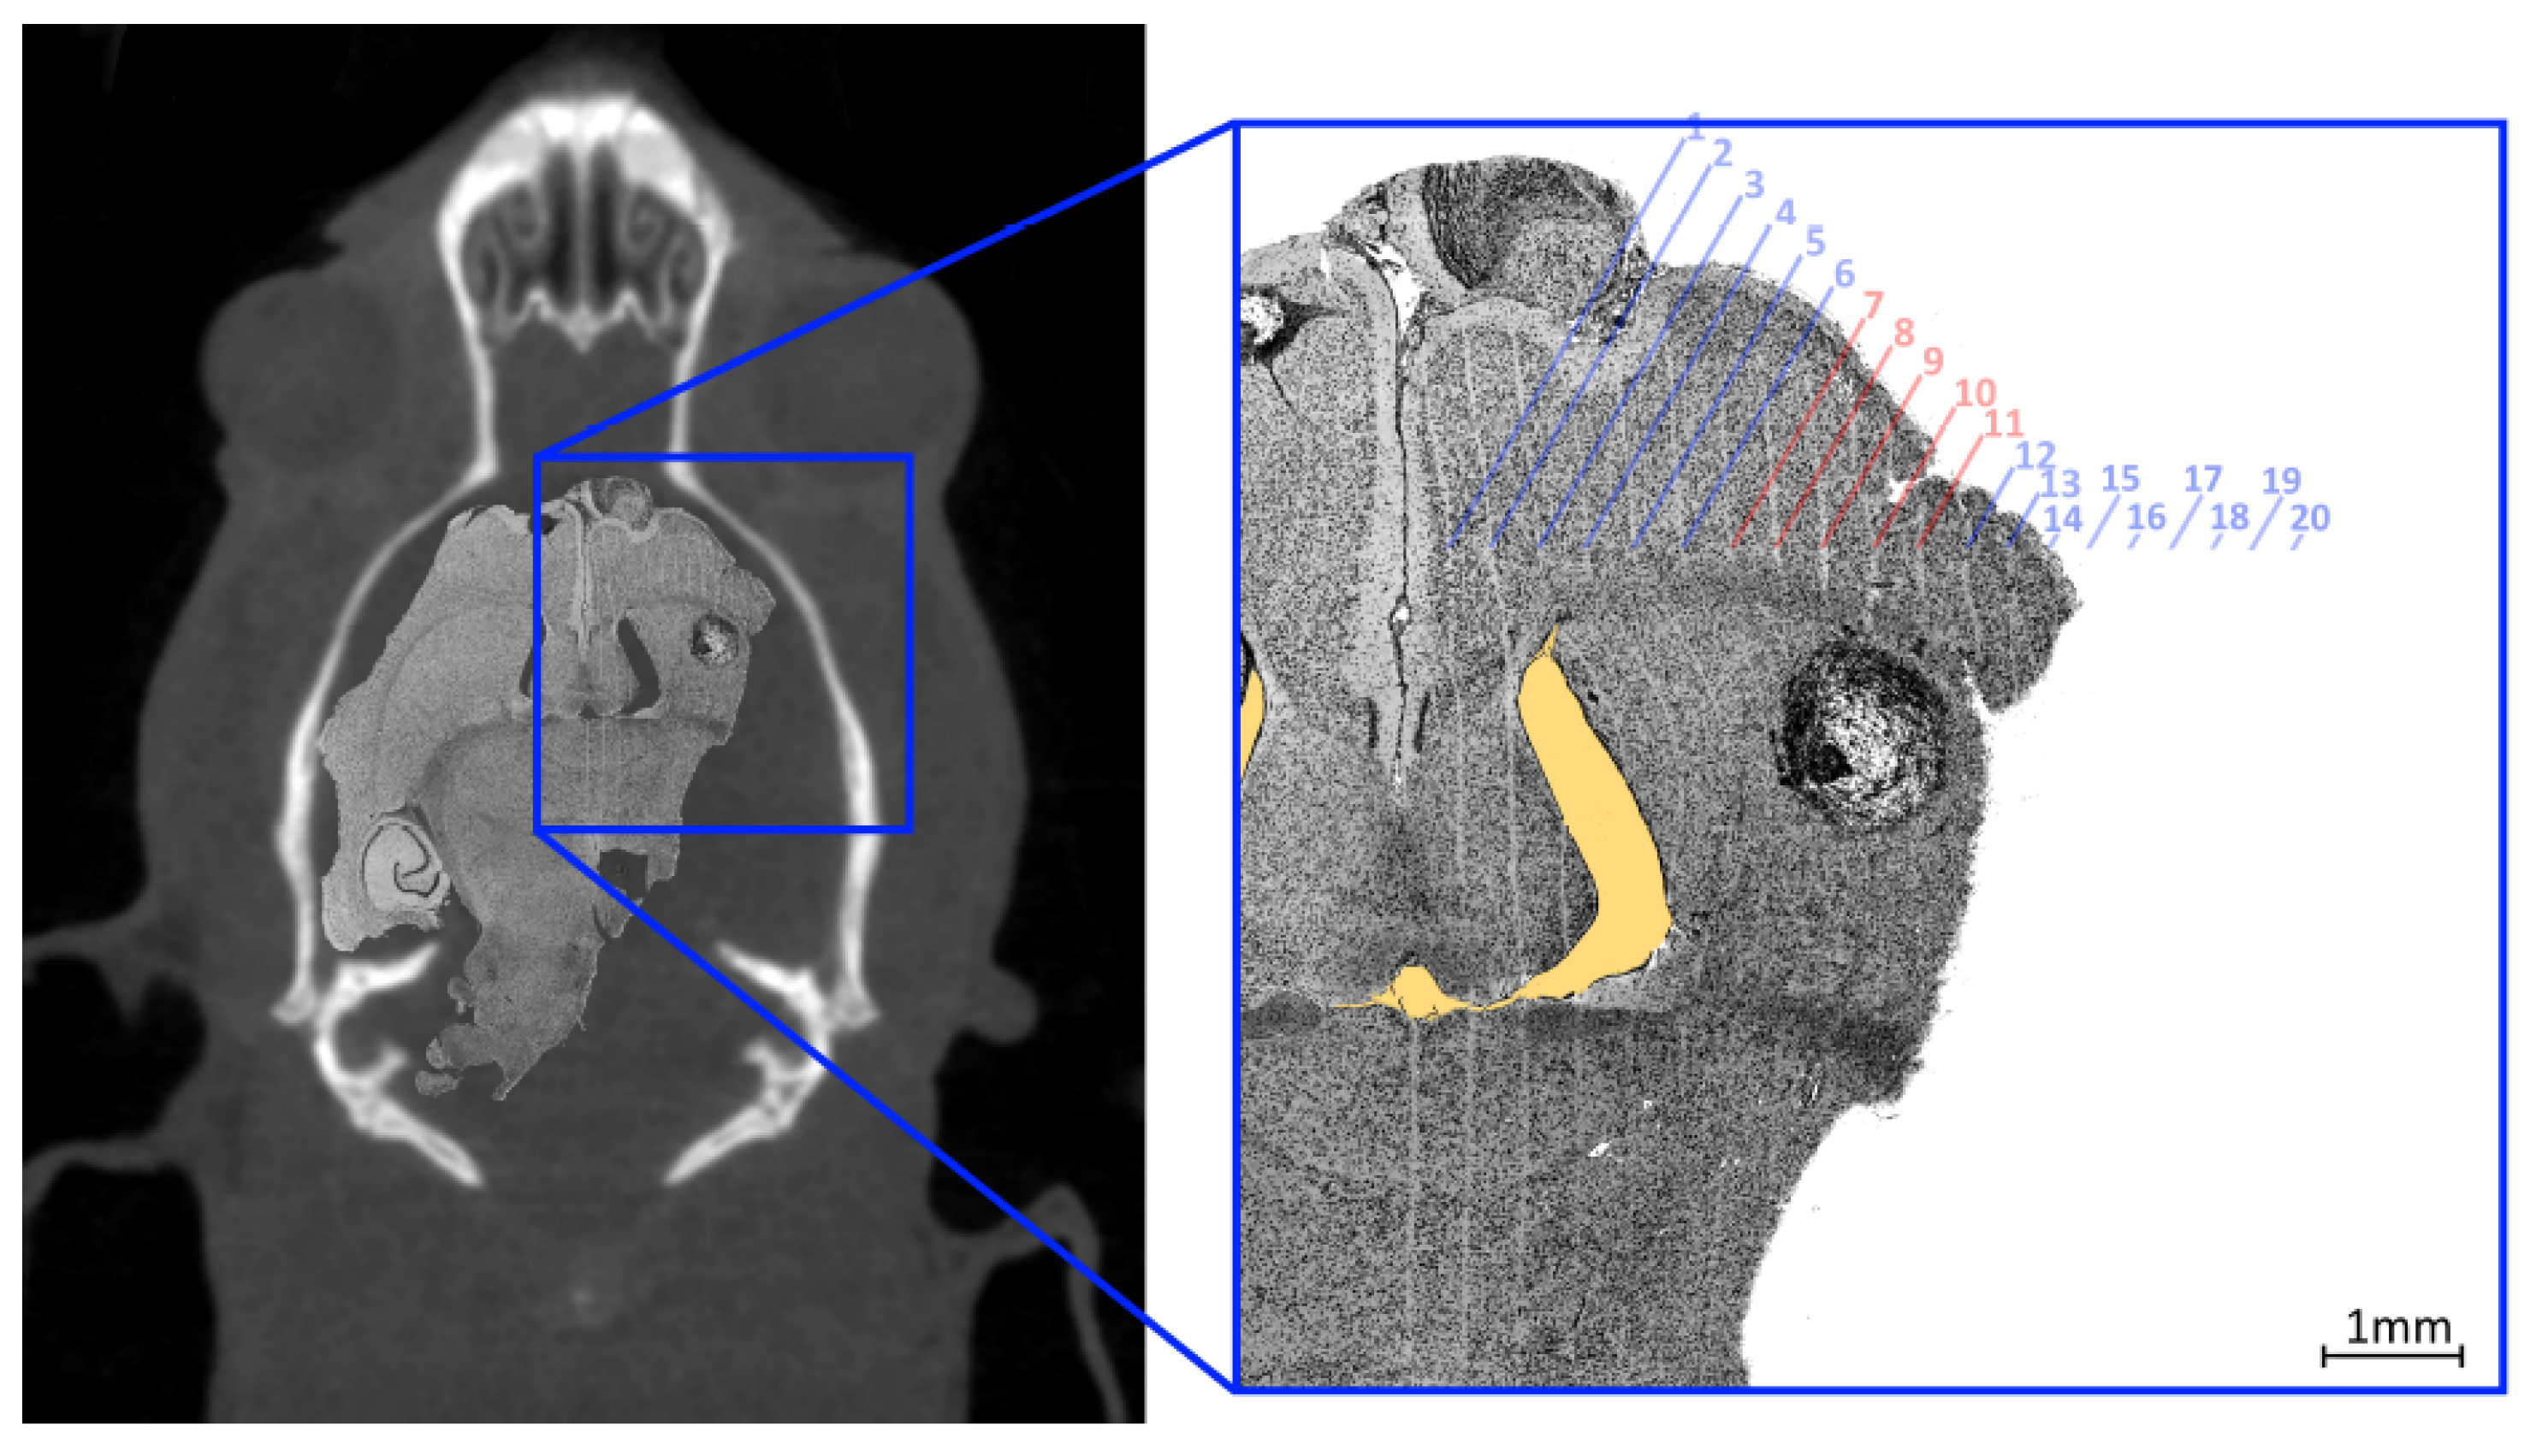
sections. These sections were stained with haematoxylin and eosin. Histology images were acquired using a Leica DMI4000 B Inverted Microscope using multi-step (tiled) image acquisition with light field corrections applied presented in
Figure 10.
The curved appearance of some of the microbeams tracks, particularly due to towards the middle third of the treatment field is a results of physical deformation such as manual handling of the histology slice during slide preparation and dehydration of the sliced sample. The yellow shaded region highlights a void in the brain material caused by manual handling of the fragile tissue. These deformations remove the ability to accurately spatially calibrate the image however, the known field properties may be used to investigate alignment accuracy. The 8 mm × 8 mm MRT treatment field used to treat the imaged animal (bearing a tumour) consisted of 20 microbeams ( 50 FWHM, 400 pitch) the centre of such field lying between microbeams 10 and 11. The histology image shows the tumour at 7 depth enveloped by microbeams 7 to 11 of the treatment field; with the tumour at this depth not representative of the centre of mass targeted during treatment. Confirmation of accuracy here supports the potential reduction of the treatment field size for future work.


 ,
, 


