Article

Miscibility Regimes in a 23Na–39K Quantum Mixture

by
Emmanuel Mercado Gutierrez
,
Gustavo Alves de Oliveira
,
Kilvia Mayre Farias
,
Vanderlei Salvador Bagnato
and
Patricia Christina Marques Castilho
*
Instituto de Física de São Carlos, Universidade de São Paulo, C.P. 369, São Carlos 13560-970, Brazil
*
Author to whom correspondence should be addressed.
Appl. Sci. 2021, 11(19), 9099; https://doi.org/10.3390/app11199099
Submission received: 14 August 2021 / Revised: 2 September 2021 / Accepted: 22 September 2021 / Published: 29 September 2021
(This article belongs to the Special Issue Quantum Degenerate Atomic Mixtures)

Abstract

:
The effects of miscibility in interacting two-component classical fluids are relevant in a broad range of daily applications. When considering quantum systems, two-component Bose–Einstein condensates provide a well-controlled platform where the miscible–immiscible phase transition can be completely characterized. In homogeneous systems, this phase transition is governed only by the competition between intra- and inter-species interactions. However, in more conventional experiments dealing with trapped gases, the pressure of the confinement increases the role of the kinetic energy and makes the system more miscible. In the most general case, the miscibility phase diagram of unbalanced mixtures of different atomic species is strongly modified by the atom number ratio and the different gravitational sags. Here, we numerically investigate the ground-state of a 23 Na– 39 K quantum mixture for different interaction strengths and atom number ratios considering realistic experimental parameters. Defining the spatial overlap between the resulting atomic clouds, we construct the phase diagram of the miscibility transition which could be directly measured in real experiments.

1. Introduction

Mixtures of quantum fluids such as superfluid 3 He- 4 He [1,2,3,4] and atomic Bose–Einstein condensates (BECs) [5,6,7,8,9,10,11,12,13,14] exhibit different miscibility regimes as a result of the competition between intra- and interspecies interactions between its components. The high level of control of the latter (mass and atom number ratio between the atomic components, temperature, interaction strengths, confinement and system dimensionality) had allowed the observation of a large variety of physical phenomena not accessible with single component systems. In optical lattices, new phase transitions give rise to a much more complex phase diagram than the simple extension of the superfluid to Mott insulator transition [15,16]; polaron physics can be explored with large imbalanced mixtures [17,18]; and the recently observed self-stabilized quantum droplets with liquid-like behaviour can be produced when beyond mean-field effects became dominant [19,20,21,22]. The miscibility regime of the system plays a fundamental role on the superfluid properties of the mixture directly affecting the observation of the mentioned new phenomena.
As for its classical counterpart, a mixture of two fluids is miscible if the fluids totally overlap forming a homogeneous solution or immiscible if the fluids remain phase-separated [23,24]. In the case of homogeneous quantum fluids, the miscible-immiscible phase transition is well defined and it is mediated by the miscibility parameter [25,26]
δ = u 12 2 u 11 u 22 1 ,
where u 11 and u 22 are the intraspecies interaction coupling constants of species 1 and 2, respectively, and u 12 gives the interspecies interaction. This is an intuitive parameter based on the competition between intra- and interspecies interactions: if u 12 overcomes the intraspecies interaction terms ( δ > 0 ), the fluids strongly repel each other making the system immiscible. On the contrary, if u 12 is smaller than the intraspecies interactions ( δ < 0 ), the fluids overlap and the system is miscible. In such a picture, the miscibility regime of a two-component quantum gas can be controlled by varying the interaction coupling terms, which can be experimentally realized with the use of Feshbach resonances [27].
However, until very recently [28], homogeneous atomic BECs were not experimentally produced. Instead, trapped atomic BECs exhibit an inhomogeneous density distribution as a result of the confinement. The increased role of the kinetic energy in such systems contributes to a more miscible mixture where phase-separation occurs for larger u 12 than the condition set by Equation (1). The shift at the miscible–immiscible critical point has been obtained in the case of mixtures composed of distinct hyperfine states of the same atomic species [29,30,31]. In the broader scenario of unbalanced mixtures of different atomic species, the atom number ratio [32], the mass imbalance and the difference in trapping configurations between the components were also shown to affect the boundary of the miscibility phase transition [33,34,35,36]. The contribution of gravity, relevant for all real experiments due to the induced gravitational sag [37,38], is rarely taken into account in numerical simulations.
In this work, we perform numerical simulations of the ground-state of a two-component quantum mixture of 23 Na and 39 K atoms for different interaction strengths, according to the relevant Feshbach resonances for magnetic fields in the range of 95–117 G [14,39], in order to show the realistic miscibility regimes accessible in the experimental setup being developed in our laboratory [40] in the presence of gravity. We explore the effect of changing the number of atoms of the minority species ( 39 K), thereby changing the atom number ratio η , and calculating the spatial overlap between the atomic clouds as a quantity able to characterize the change in the miscibility regime of the system. The numerical simulations are performed at zero temperature, which satisfactorily reproduces the experimental results for the case of strongly degenerate atomic mixtures [41], although theoretical works at finite temperature have shown a change of the miscibility condition of the system favoring phase separation [42,43,44].
The article is organized as follows. In Section 2, we describe the two-component quantum gas at zero temperature in terms of a pair of coupled Gross–Pitaevskii equations (GPEs) (Section 2.1) and the numerical simulation method used to obtain the ground-state of the system (Section 2.2). In Section 3, we first present our experimental system producing the 23 Na– 39 K atomic mixtures (Section 3.1), followed by the results of the numerical simulation performed with realistic experimental parameters (Section 3.2) and the construction of the phase diagram of the miscible–immiscible transition for such a mixture (Section 3.3). Finally, in Section 4, we highlight our main findings and discuss some future perspectives for identifying the miscibility regime of a quantum mixture comparing with the results presented in this article.

2. Methods

2.1. Description of an Atomic Quantum Mixture

Consider a mixture of two different bosonic atoms, labeled 1 and 2, at T = 0 in the weakly interacting regime where interactions are treated as contact interactions. Let N 1 and N 2 be the number of particles and ϕ 1 ( r ) and ϕ 2 ( r ) be the corresponding normalized single-particle wave functions. In such a picture, and neglecting terms of the order of 1 / N 1 and 1 / N 2 , the energy functional of the system [25,26,45] can be written as
E = d r 2 2 m 1 | ψ 1 | 2 + ϑ 1 ( r ) | ψ 1 | 2 + 2 2 m 2 | ψ 2 | 2 + ϑ 2 ( r ) | ψ 2 | 2 + 1 2 u 11 | ψ 1 | 4 + 1 2 u 22 | ψ 2 | 4 + u 12 | ψ 1 | 2 | ψ 2 | 2 ,
where m i (with i = 1 , 2 ) is the mass of atomic species i, ϑ i ( r ) is the corresponding external potential, u i i = 4 π 2 a i i / m i are the intra-species interaction terms and u 12 = 2 π 2 a 12 / m 12 is the inter-species interaction term with m 12 = m 1 m 2 / ( m 1 + m 2 ) , the reduced mass of the system. For all relations, a i j is the associated two-body s-wave scattering length. The wave-functions ψ 1 ( r ) and ψ 2 ( r ) are the condensate wave-function of each atomic species, defined as
ψ 1 ( r ) = N 1 ϕ 1 ( r ) and ψ 2 ( r ) = N 2 ϕ 2 ( r ) .
Minimizing the energy functional of Equation (2) under the constraint of fixed number of particles, N 1 and N 2 , one obtains the time-independent coupled Gross–Pitaevskii equations
2 2 m 1 2 + ϑ 1 ( r ) + u 11 | ψ 1 | 2 + u 12 | ψ 2 | 2 ψ 1 = μ 1 ψ 1
2 2 m 2 2 + ϑ 2 ( r ) + u 22 | ψ 2 | 2 + u 12 | ψ 1 | 2 ψ 2 = μ 2 ψ 2 ,
where μ 1 and μ 2 are the chemical potential of atomic species 1 and 2, respectively. If the interspecies interaction vanishes ( u 12 = 0 ), Equations (4) and (5) are no longer coupled and each species behave as a single species atomic cloud. In this case, approximations such as the Thomas–Fermi approximation [25,26,45], for which the kinetic term of the GPE is neglected, can be used to find a solution for the ground-state of the system. On the other hand, when u 12 0 , the competition between inter- and intraspecies interactions gives rise to a phase transition from a miscible to an immiscible (phase-separated) phase when increasing the positive inter-species interaction strength. The existence of overlapping and non-overlapping regions between the atomic clouds dramatically changes the ground-state configuration of the system and it is not always possible to find analytical solutions for it, even relying on approximations [46]. A more powerful technique to obtain the ground-state of a trapped two-component BEC makes use of a numerical simulation with imaginary time evolution of the coupled GPEs.

2.2. Numerical Simulation of the Ground-State

The numerical simulation used to obtain the ground-state of the two-species BEC consists of projecting onto the minimum of the GPEs each initial trial state by propagating them in imaginary time [47]. To describe the method, let us first consider a system described by a Hamiltonian H for which the time evolution of one of its eigenstates, ψ n ( r , t ) with H ψ n ( r , 0 ) = E n ψ n ( r , 0 ) , is easily obtained as:
ψ n ( r , t ) = ψ n ( r , 0 ) e i E n t ,
where E n is the energy associated with the n-eigenstate. The time evolution of an arbitrary trial function Ψ ( r , 0 ) , written as a linear combination of the system’s eigenstates, is simply given by
Ψ ( r , t ) = n ψ ( r , t ) = n ψ ( r , 0 ) e i E n t .
If one calculates Ψ ( r , t ) for t = i τ , the complex exponentials in Equation (7) are replaced by exponential decays with decay constants given by E n / . By evaluating Ψ ( r , t ) at different time steps Δ τ with τ = ξ Δ τ , Ψ ( r , τ ) ψ 0 ( r , τ ) , the ground-state of the system. The exact convergence is only obtained when τ ; however, convergence methods based on the variation of the total energy of the system are used to set an upper limit for τ .
In the numerical simulations performed in this work, we define a trial function Ψ i ( r , 0 ) for each species i with time evolution given by
Ψ i ( r , t ) = e i H ^ i t Ψ i ( r , 0 ) ,
where H ^ i ψ i ( r ) = μ i ψ i ( r ) from Equations (4) and (5). Considering t = i Δ τ with Δ τ infinitesimal, the resulting exponential can be expanded in a Taylor series and the time evolution of Ψ i ( r , t + Δ τ ) is given by
Ψ i ( r , t + Δ τ ) Ψ i ( r , t ) H ^ i Ψ i ( r , t ) Δ τ .
In order to achieve sufficient long times in the simulations let it be t final = ξ Δ τ , with ξ being an integer, Equation (9) is calculated ξ times. The resulting wave-function obtained after each time step is normalized in order to preserve the atom number.

3. Results

The numerical simulations performed in this work are performed following the parameters of the experimental setup being developed in our laboratory. For this reason, we first start the Results Section, Section 3.1, with a description of the experimental setup and its current status in the preparation of a two-species BEC of 23 Na and 39 K. Later, the results from the numerical simulations are presented and discussed in the following two subsections.

3.1. Experimental Setup

A complete description of the experimental setup and experimental sequence for producing a Bose–Einstein condensate of 23 Na atoms is described in [40]. Here, we present a short description of the system giving the experimental parameters relevant for the simulations performed later in this Section.
Briefly, sodium and potassium atoms coming from independent two-dimensional magneto-optical traps (2D-MOTs) [48,49] are combined in a common vacuum chamber where they will be trapped and further cooled in a three-dimensional MOT (3D-MOT). Due to the strong interspecies losses present in the Na–K mixture [40,50], the operation of an intial two-color MOT is not the best alternative in our experiment. Instead, we chose to favor the minority species (potassium) during the MOT phase, starting the MOT sequence with the loading of a single species MOT of 39 K until it reaches the saturation value (∼20 s). Next, we operate the two-color MOT by switching on the lights responsible for trapping and cooling sodium atoms. We control the initial atom number ratio N Na 0 / N K 0 by changing the time duration of the loading of the sodium atoms in the two-color MOT operation.
Once the two species are loaded, we perform subsequent cooling procedures followed by a fine pumping stage which transfer both species to the F = 1 ground-state before turning on an optically plugged Quadrupole trap [51]. At the beginning of the magnetic trap the atomic clouds have N Na 1 × 10 9 atoms and N K 1 × 10 6 atoms both at T = 220 μ K trapped in the | F = 1 , m F = 1 > hyperfine ground-state.
Evaporative cooling [52] of sodium is performed with microwave radiation at ∼1.7 GHz while potassium atoms are sympathetic cooled [53,54] decreasing its temperature without significant atom loss. At T∼6–7 μ K, the atomic clouds are transferred to a pure optical dipole trap (ODT) [55] where the interspecies interaction can be tuned with the use of Feshbach resonances [27] by applying a uniform magnetic field. We have atomic clouds with N Na = 5 × 10 6 and N K = 8 × 10 5 at the beginning of the ODT for maximum atoms number of 39 K. In single-species operation for sodium under the same conditions, we obtain an almost pure BEC (with BEC fraction > 80 % ) with N = 1 × 10 6 atoms at T∼80 μ K after applying an optical evaporation which reduces the initial ODT potential height by a factor of five in 4.2 s. The final ODT configuration exhibits a planar geometry with equal frequencies in the x y -plane perpendicular to the gravity direction. The final frequencies are ω x , y = 2 π × 107 ( 137 ) Hz and ω z = 2 π × 148 ( 193 ) Hz for Na(K), respectively. This is the actual situation of our experimental system and, following the initial atom number difference in the ODT, we estimate to be able to obtain a two-species BEC once implemented the Feshbach field. Following these experimental numbers we performed the simulations described in Section 2.2 which results are presented in the following.

3.2. Ground-State of  23 Na– 39 K Mixtures

The ground-state of 23 Na– 39 K mixtures was obtained with the numerical simulation method described in Section 2.2. In the simulations, we discretize the space with a three-dimensional grid of 69 × 69 × 69 . The grid step size was chosen to be equal to 0.6 μ m resulting in a total volume of 41 × 41 × 41 μ m 3 . The time interval for the simulations were Δ t = 50 × 10 6 in units of 1 / ω ¯ 1 , where ω ¯ 1 = ( ω x ω y 1 ω z 1 ) 1 / 3 is the geometric mean of the trapping frequencies for species 1. We considered species 1 (2) as the potassium (sodium) atoms. We apply convergence methods based on the difference between the wave-functions of subsequent time intervals and monitor the total energy evolution in order to ensure the achievement of the ground-state configuration for both species. With these methods, typical integration times gave t final ∼3000.
The number of sodium atoms was chosen N Na = 5 × 10 5 atoms in agreement with the numbers obtained in the experiment. The number of potassium atoms was varied with N K = 1 × 10 4 5 × 10 5 atoms setting η = N Na / N K = 50 1 . The trapping frequencies were also set from the experimental values with ω x , y = 2 π × 107 ( 137 ) Hz and f z = 2 π × 148 ( 193 ) Hz for Na(K), respectively. The sodium scattering length was fixed to a Na = 52 a 0 , with a 0 being the Born radius, while the scattering length of 39 K, a K , and the interspecies scattering length, a NaK , was varied according to the Feshbach resonances occuring at magnetic fields smaller than 300 G [14,39]. In Figure 1, we show the values of the scattering lengths ( a Na , a K and a NaK ) as a function of the magnetic field in the region with B = 95–117.2 G. In this region, both a K and a NaK are positive and the system changes its behaviour from immiscible to miscible with increasing the magnetic field. The predicted phase transition point for a homogeneous system (with δ = 0 ) occurs at B 0 = 109.1 G [14]. The potassium scattering length was obtained with the simple relation:
a ( B ) = a bg 1 Δ 1 ( B B 01 ) Δ 2 ( B B 02 ) ,
where a bg = 19 a 0 is the background scattering length, B 01 = 32.6 G and B 02 = 162.8 G are the position of the first and second resonances for 39 K at the F = 1 , m F = 1 hyperfine state and Δ 1 = 55 G and Δ 2 = 37 G are the corresponding resonance widths [39]. The a NaK curve displayed in Figure 1 was obtained from [14] via a private communication.
Due to the presence of the gravitational force, each species suffers a different gravitation sag and the phase-separation at the immiscible phase occurs along the vertical direction (z-axis). In Figure 2, we show the simulated density profiles along the z-axis of 23 Na (in blue) and 39 K (in red) for Feshbach fields B = 100 G in (a) with δ = 4.32 , B = 108 G in (b) with δ = 0.22 and B = 111 G in (c) with δ = 0.50 and different atom number ratio η = 50 , 10 , 5 in solid, dashed and dotted lines, respectively.
For a fixed miscibility parameter, we observe different behaviours of the system when changing η . In Figure 2a), the system is always immiscible, i.e., the sodium and potassium atoms do not share the same position in the trap for any value of η . In Figure 2b, the system is expected to be immiscible according to the miscibility parameter ( δ = 0.22 > 0 ); however, for η = 50 , the phase-separated region disappears and the potassium atoms always share its position in the trap with sodium atoms, which is characteristic of a miscible system. Finally, in Figure 2c, the system is expected to be miscible with δ = 0.30 < 0 but in the case of η = 5 , there is still a region of the potassium cloud that do not share the trap with sodium atoms remaining immiscible. We see that, for inhomogeneous systems, the atom number ratio has a strong influence in the miscibility regime of a two-species Bose–Einstein condensate. While in the homogeneous case, the miscibility parameter is enough to set the regime of the system, in most real experiments where the condensates are confined by a harmonic trap, additional information is necessary to establish the critical point for the miscible–immiscible phase transition.

3.3. The Miscibility Phase Diagram

The ground-state configurations obtained in the previous section show the flexibility of the 23 Na– 39 K mixture in achieving different miscibility regimes with the change of the Feshbach magnetic field B and the atom number ratio η .
The construction of a phase diagram miscible–immiscible needs a more quantitative way of defining the miscibility region of a given set of parameters for the two-species system. Proposals to characterize the regime of such system include the calculation of the binder cumulant of the system’s magnetization [56], the difference between the centers of mass of each atomic cloud [32], the study of the entropy of the mixture as defined in [44,57] and the monitor of dipole oscillations of the atomic clouds in a harmonic trap [35]. Here, similar to the works presented in [29,58], we follow the definition of the miscible and immiscible phases and propose the calculation of the spatial overlap between the atomic clouds to be an indicator of the phase transition.
We define the spatial overlap of the atomic clouds as:
O = | ψ 1 ( r ) | 2 | ψ 2 ( r ) | 2 d r = n 1 ( r ) n 2 ( r ) d r ,
where n 1 ( r ) and n 2 ( r ) are the atomic densities of species 1 and 2, respectively.
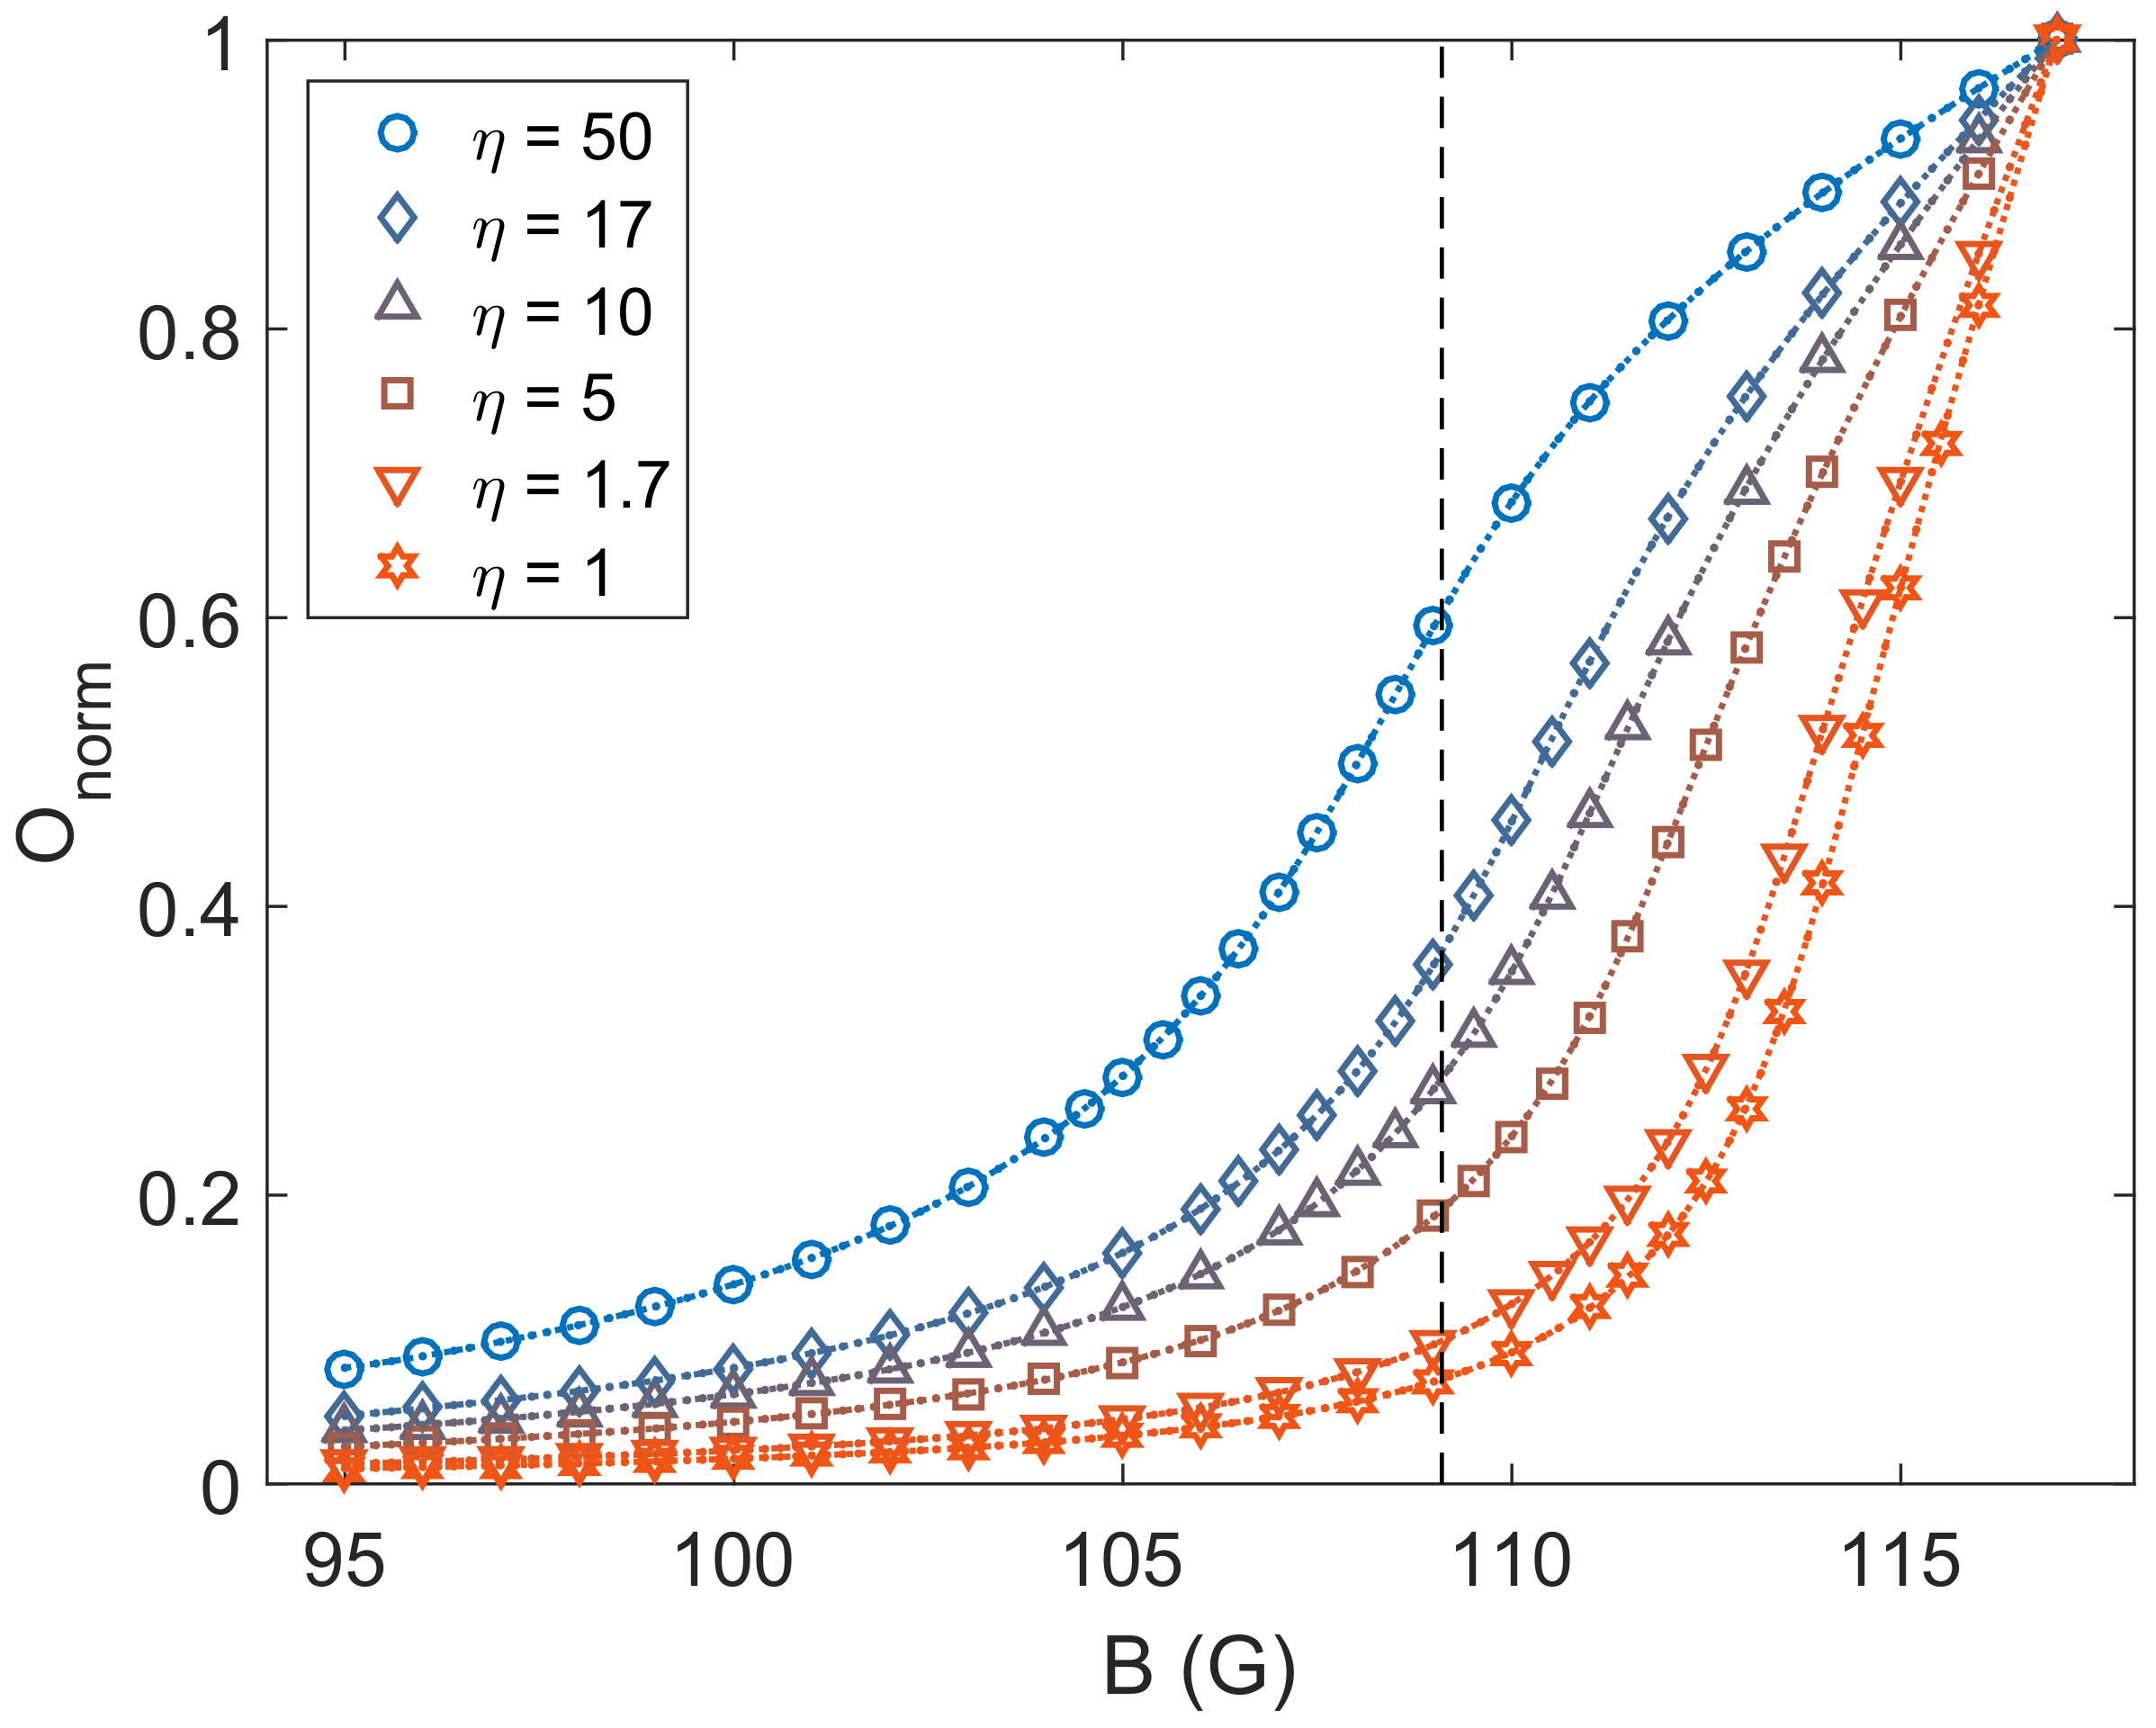
In Figure 3, we show the spatial overlap normalized by the overlap, O 0 = O ( a 12 = 0 ) , at each case as a function of the Feshbach field for different atom number ratio, η . The normalization was performed considering that the case of vanishing inter-species interaction exhibits the maximum spatial overlap between the atomic clouds possible in each configuration. In the immiscible region ( B < B 0 = 109.1 G), O norm exhibit small values with O norm 0 when reducing the magnetic field for all η . Approaching B 0 , the spatial overlap increases differently for each η with larger η showing an earlier increase on the spatial overlap. The limit case of η = 50 shows a significant increase in O norm for B > 104 G, increasing over a broad range of magnetic fields. This increase occurs before the critical point estimated with the miscibility parameter, in accordance with was already observed in the density profiles of Figure 2. Reducing η increases the magnetic field for which the spatial overlap significantly increases. For the other limit with η = 1 , the spatial overlap starts to increase for B > 111 G, a magnetic field larger than B 0 . The dashed vertical line in Figure 3 represents the critical point for the transition at B 0 with δ = 0 .
To define the transition from immiscible to miscible from the normalized overlap, we associate a threshold-like behaviour and identify the Feshbach field ( B peak ) for which O norm varies the most. This is performed performing the numerical second derivative of the normalized overlap and identifying its maximum value. The second derivatives as a function of the Feshbach field for all η are displayed in Figure 4. The maximum value of the curves drifts to larger magnetic fields as η decreases. In Figure 4b, we show B peak as a function of η . The almost linear behaviour of the points in the semilog scale suggests a dependence of B peak ( η ) = B peak 0 α ln η . We find B peak 0 = 113.5 G and α = 1.70 .
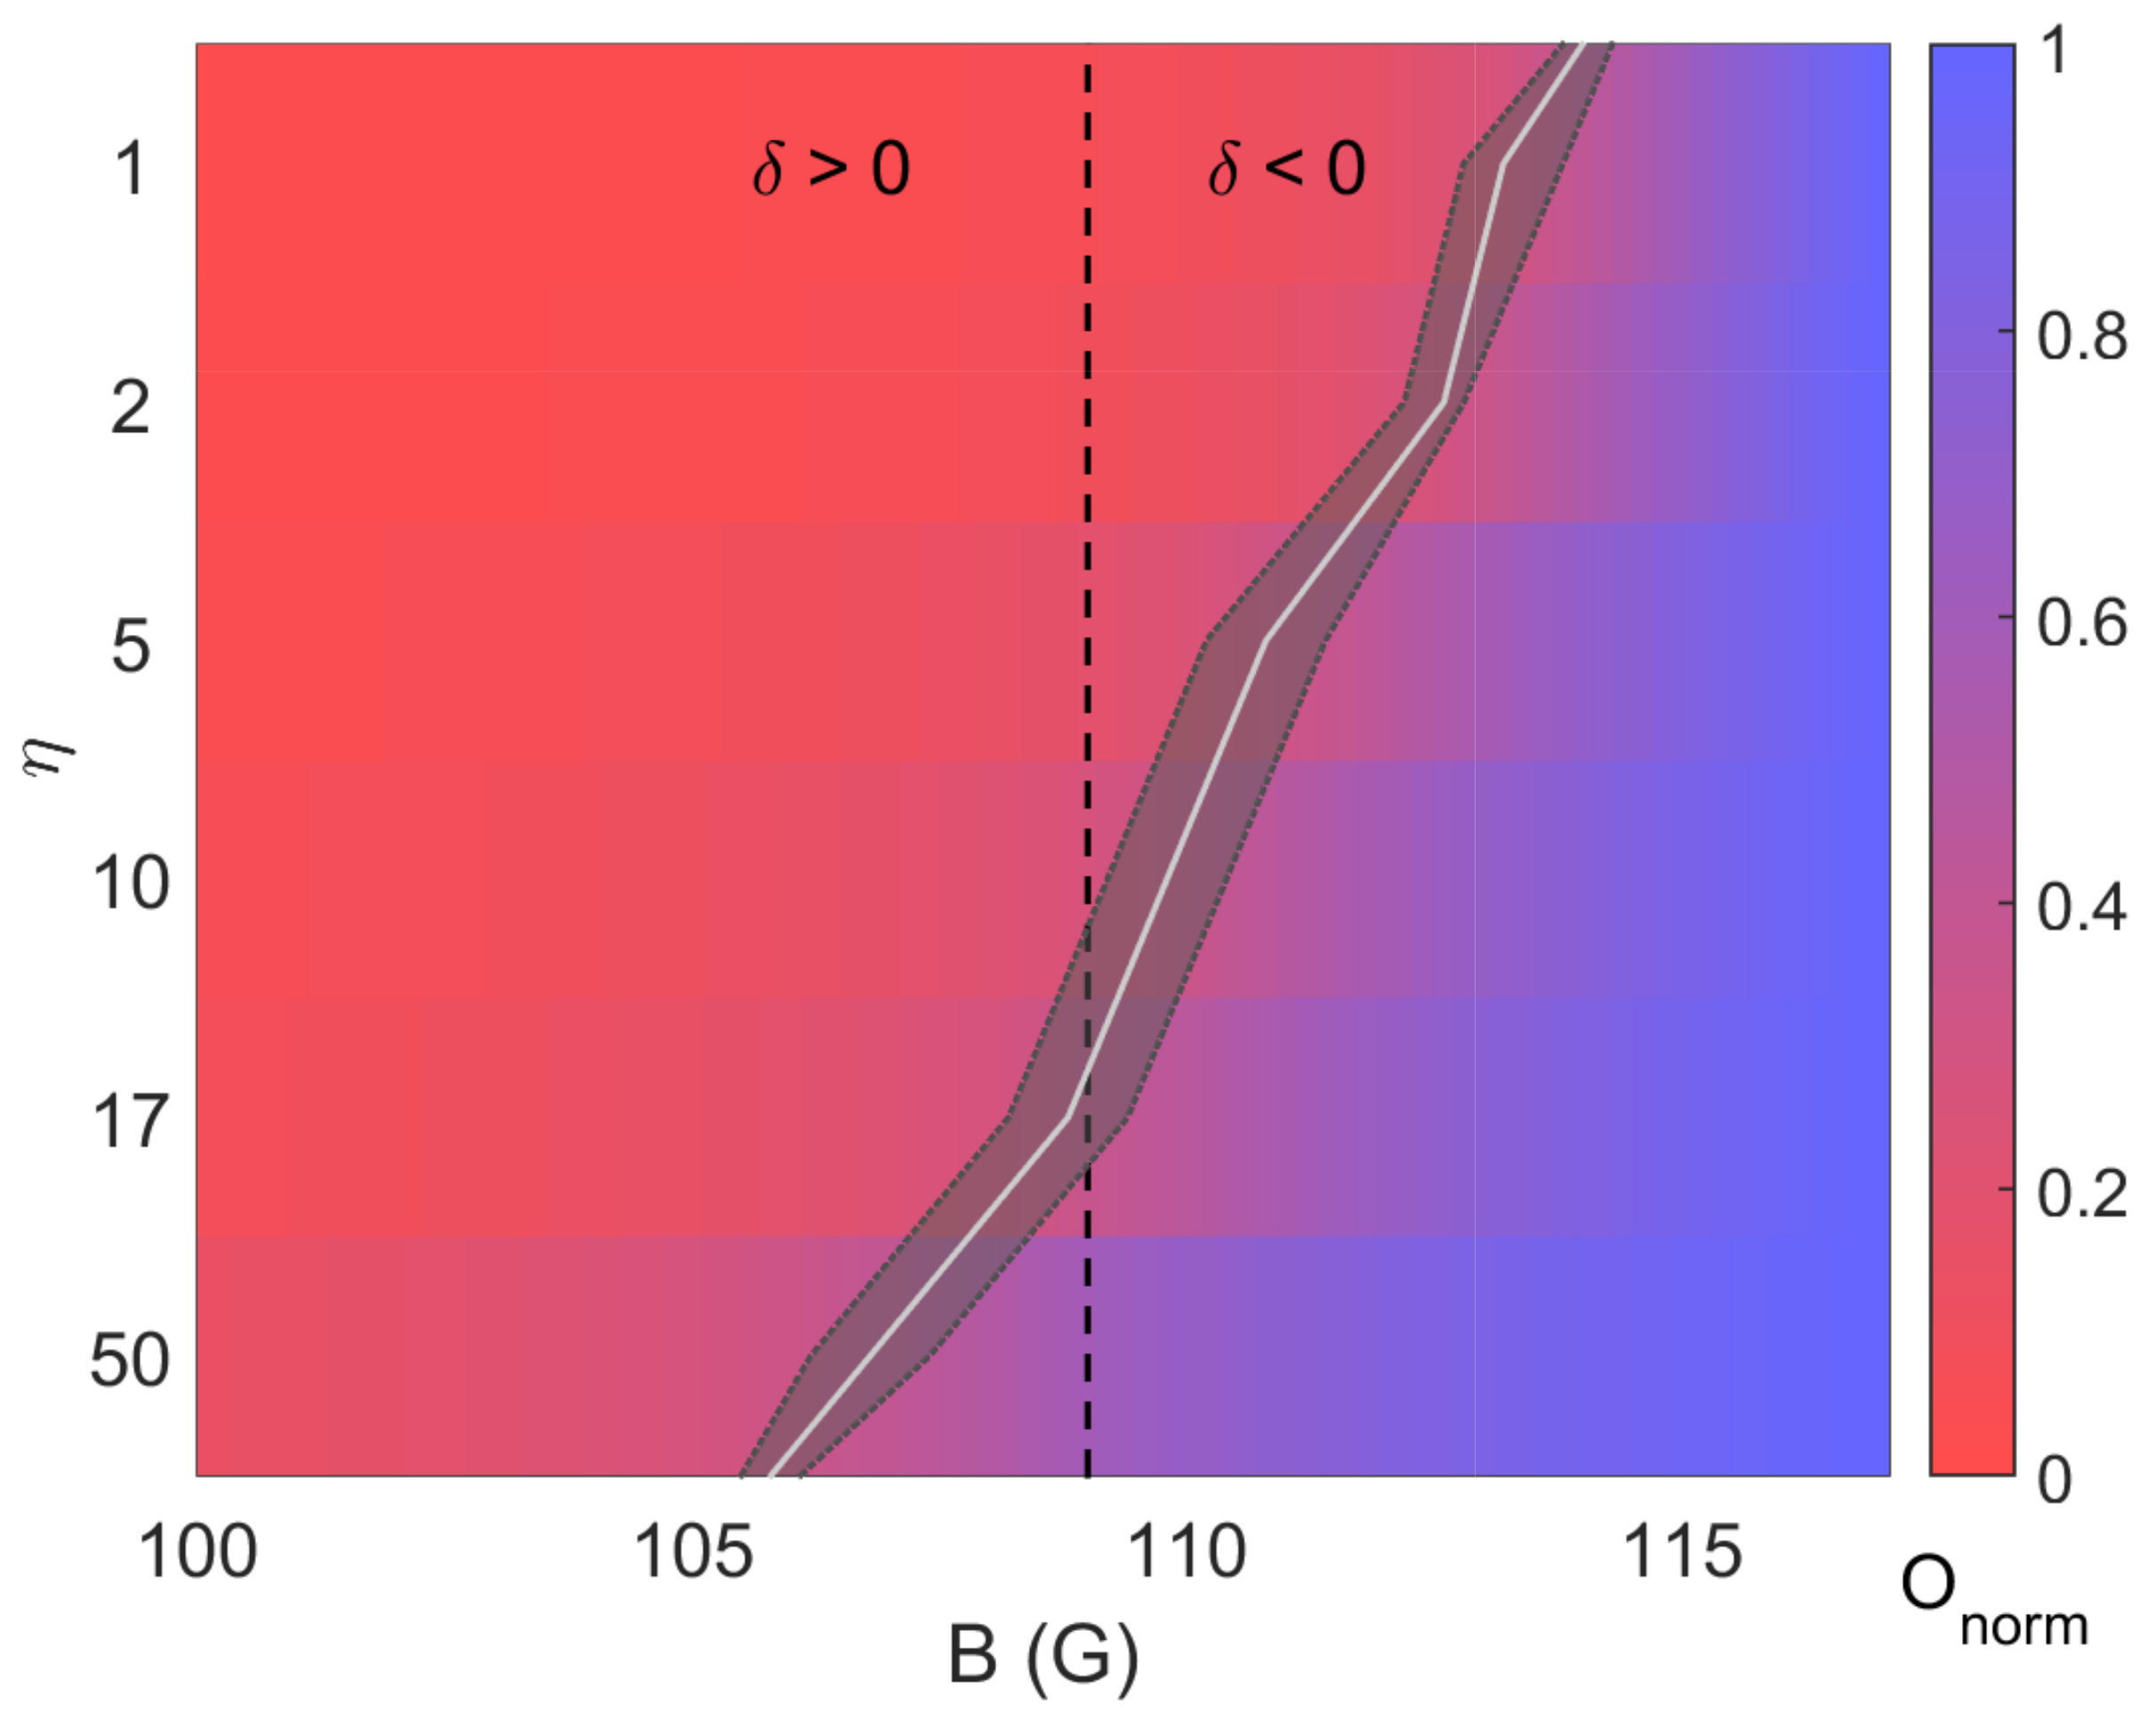
The miscible–immiscible phase diagram for the 23 Na– 39 K mixture under our experimental conditions is shown in Figure 5. The colormap represents the value of the normalized overlap for each combination of η and B ranging from zero to unit. The transition point for each η obtained from Figure 4b is displayed by the solid light gray curve with the shaded area covering its uncertainty. The black dashed line represents the transition point for the homogeneous case setting δ > 0 to the left side of the curve and δ < 0 to the right.
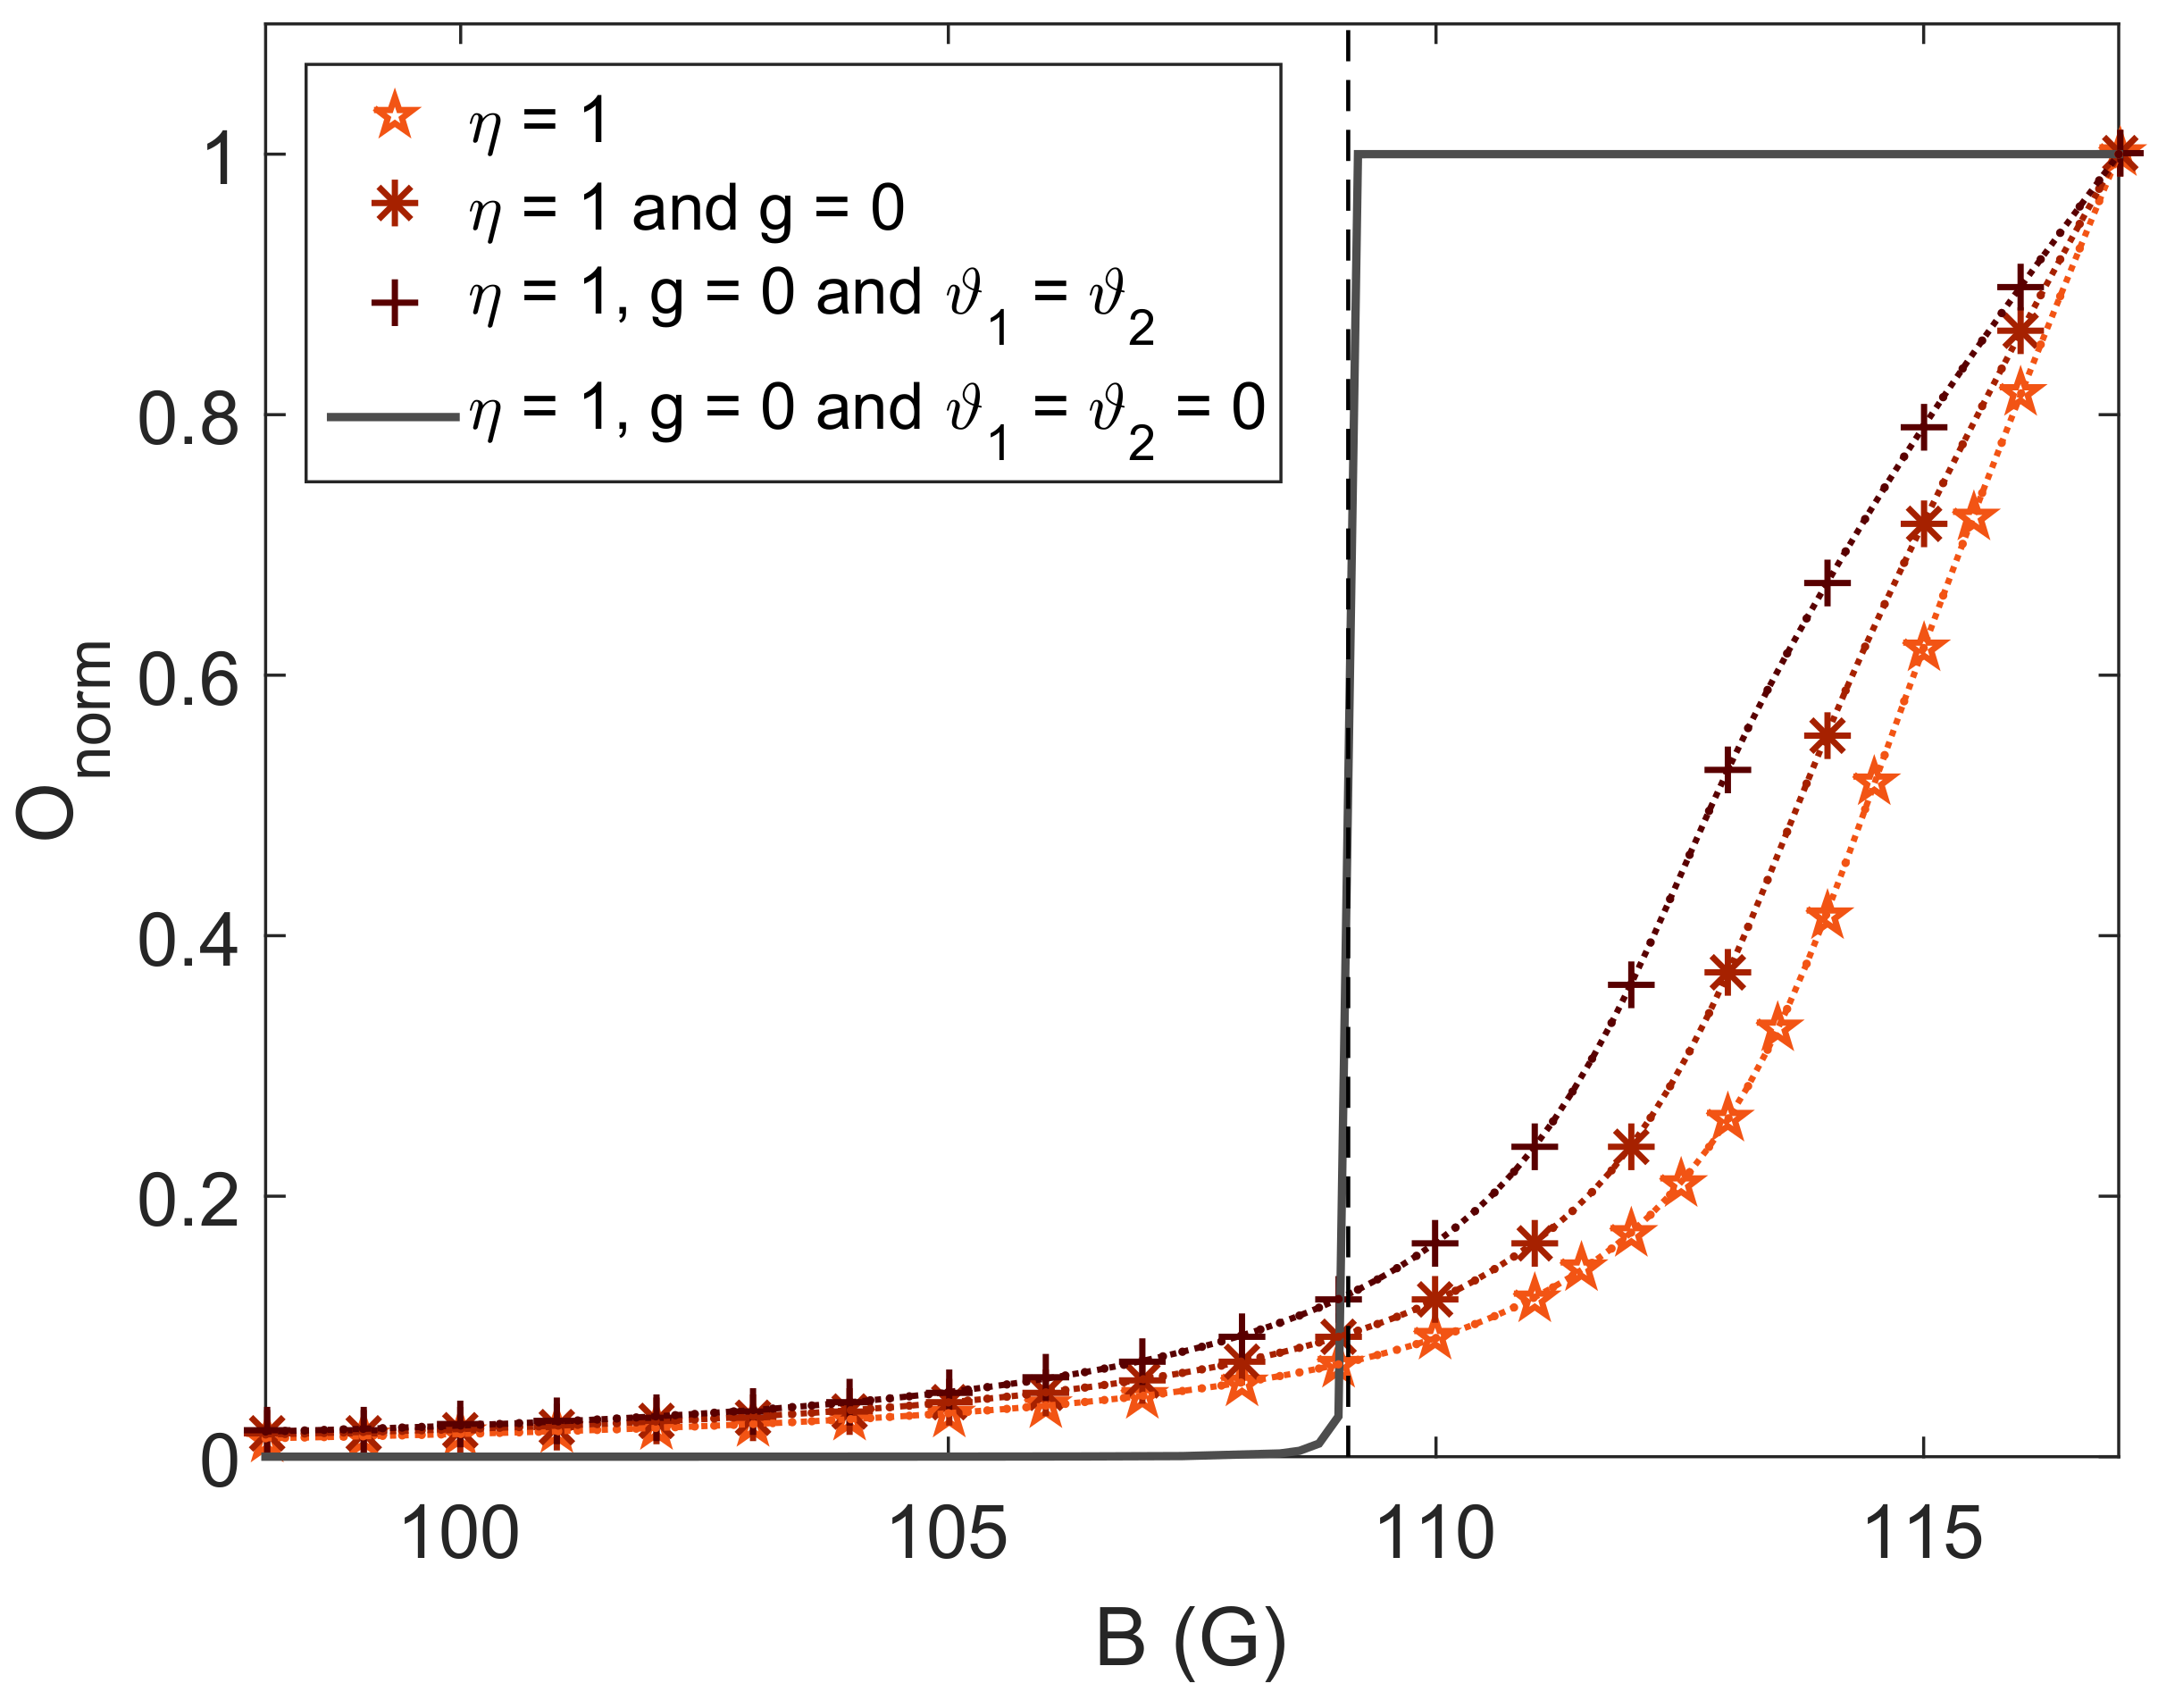
Differently from earlier works performed with a balanced mixture of two distinct hyperfine states of a single species [29,30,31], in our case for η = 1 , the system is more immiscible and the miscible phase only occurs for δ 0.5 . A deeper analysis of the η = 1 case is presented in Figure 6, where we show the normalized overlap for η = 1 under different trapping conditions: real experimental conditions (star), without gravity (asterisk), considering equal trapping potentials with ϑ 1 = ϑ 2 (plus sign) and for the homogeneous case (gray solid curve) obtained setting the external potentials ϑ 1 ( r ) = ϑ 2 ( r ) = 0 . The dashed vertical line in black represents the point for δ = 0 which indeed matches the abrupt transition of O norm from 0 to unity observed in the homogeneous case. The role of gravity and different trapping configurations for each species is clear in the data of Figure 6: setting g = 0 and ϑ 1 = ϑ 2 drifts the transition point to smaller magnetic fields approaching B 0 . However, due to the large difference between the intraspecies scattering lengths for sodium and potassium ( a Na = 52 a 0 and a K 7.59 8.73 a 0 ), the system still behaves more immiscible than the homogeneous case.
The identification of the miscibility regime of the Na–K mixture under realistic experimental conditions is important when defining the best parameters for studying different physical phenomena. In studies which the spatial overlap between the components of the mixture is important (i.e., coupled vortex dynamics [59,60,61], binary quantum turbulence [62], coupled superfluidity and excitations [63,64], etc.), it is not always sufficient to have δ < 0 . The contrary is also true, when the immiscible nature of the system is relevant (i.e., in studies of dynamical instabilities [65,66,67,68]), δ > 0 is not always sufficient, especially in the case of large atom number imbalances between the atomic species.

4. Discussion

We have shown that the miscible–immiscible phase transition in a trapped two-component Bose–Einstein condensation of different atomic species under realistic experimental parameters (considering the effect of gravity and different trapping potentials) suffers strong influence of the atom number ratio η . In the case of large η , the system behaves more miscible than the homogeneous case with the transition occurring at δ > 0 , while for η = 1 , the system is more immiscible with the transition occurring at δ < 0 . We have defined the miscibility regime of the system by identifying the magnetic field B peak for which the normalized spatial overlap between the atomic clouds changes the most. This value was obtained from the magnetic field for which the numerical second derivative of the normalized overlap exhibits a maximum. The behaviour of B peak with η could be easily associated with a logarithm dependence from the graph of Figure 4b making it possible to draw the critical curve in the phase diagram of the miscible–immiscible phase transition for the simulated 23 Na– 39 K quantum mixture (see Figure 5). The use of the spatial overlap to identify the miscibility regime of the system could be directly implemented in real experiments by performing high resolution in situ images of each atomic species. Further characterizations both on the experimental and theoretical sides could be performed using dynamical properties of the atomic mixture, such as the dipole oscillations proposed in [35], and considering finite temperature effects as realized in recent works [42,43,44].

Author Contributions

E.M.G., G.A.d.O., P.C.M.C. and K.M.F. developed the experimental setup. P.C.M.C. and E.M.G. performed the numerical simulations and carried out the data analysis. E.M.G. and G.A.d.O. worked on the data presentation. P.C.M.C., K.M.F. and V.S.B. conceived the studies presented in the manuscript. All authors contributed to reviewing the results and writing the article. All authors have read and agreed to the published version of the manuscript.

Funding

This research was funded by São Paulo Research Foundation (FAPESP) under the grants 2013/07276-1 and 2014/50857-8, and by the National Council for Scientific and Technological Development (CNPq) under the grants 465360/2014-9.

Institutional Review Board Statement

Not applicable.

Informed Consent Statement

Not applicable.

Data Availability Statement

The data that support the findings of this study are available from the corresponding author, P.C.M.C.

Acknowledgments

The authors thank R. C. Teixeira for sharing a simplified version of the numerical simulations discussed in this manuscript and P. Mazo for providing experimental support in previous stages of the experiment.

Conflicts of Interest

The authors declare no conflict of interest. The funders had no role in the design of the study; in the collection, analyses, or interpretation of data; in the writing of the manuscript, or in the decision to publish the results.

References

  1. Graf, E.H.; Lee, D.M.; Reppy, J.D. Phase Separation and the Superfluid Transition in Liquid He3-He4 Mixtures. Phys. Rev. Lett. 1967, 19, 417–419. [Google Scholar] [CrossRef]
  2. Pricaupenko, L.; Treiner, J. Phase Separation of Liquid 3He-4He Mixtures: Effect of Confinement. Phys. Rev. Lett. 1995, 74, 430–433. [Google Scholar] [CrossRef] [PubMed]
  3. Maciołek, A.; Krech, M.; Dietrich, S. Phase diagram of a model for 3He-4He mixtures in three dimensions. Phys. Rev. E 2004, 69, 036117. [Google Scholar] [CrossRef] [PubMed] [Green Version]
  4. Bennemann, K.H.; Ketterson, J.B. Physics of Liquid and Solid Helium. Part I; John Wiley and Sons, Inc.: New York, NY, USA, 1978. [Google Scholar]
  5. Stenger, J.; Inouye, S.; Stamper-Kurn, D.; Miesner, H.J.; Chikkatur, A.; Ketterle, W. Spin domains in ground-state Bose–Einstein condensates. Nature 1998, 396, 345–348. [Google Scholar] [CrossRef] [Green Version]
  6. Myatt, C.J.; Burt, E.A.; Ghrist, R.W.; Cornell, E.A.; Wieman, C.E. Production of Two Overlapping Bose–Einstein Condensates by Sympathetic Cooling. Phys. Rev. Lett. 1997, 78, 586–589. [Google Scholar] [CrossRef]
  7. Hall, D.S.; Matthews, M.R.; Ensher, J.R.; Wieman, C.E.; Cornell, E.A. Dynamics of Component Separation in a Binary Mixture of Bose–Einstein Condensates. Phys. Rev. Lett. 1998, 81, 1539–1542. [Google Scholar] [CrossRef] [Green Version]
  8. Ospelkaus, S.; Ospelkaus, C.; Humbert, L.; Sengstock, K.; Bongs, K. Tuning of Heteronuclear Interactions in a Degenerate Fermi–Bose Mixture. Phys. Rev. Lett. 2006, 97, 120403. [Google Scholar] [CrossRef] [Green Version]
  9. Papp, S.B.; Pino, J.M.; Wieman, C.E. Tunable Miscibility in a Dual-Species Bose–Einstein Condensate. Phys. Rev. Lett. 2008, 101, 040402. [Google Scholar] [CrossRef] [Green Version]
  10. McCarron, D.J.; Cho, H.W.; Jenkin, D.L.; Köppinger, M.P.; Cornish, S.L. Dual-species Bose–Einstein condensate of 87Rb and 133Cs. Phys. Rev. A 2011, 84, 011603. [Google Scholar] [CrossRef] [Green Version]
  11. Pasquiou, B.; Bayerle, A.; Tzanova, S.M.; Stellmer, S.; Szczepkowski, J.; Parigger, M.; Grimm, R.; Schreck, F. Quantum degenerate mixtures of strontium and rubidium atoms. Phys. Rev. A 2013, 88, 023601. [Google Scholar] [CrossRef] [Green Version]
  12. Wang, F.; Li, X.; Xiong, D.; Wang, D. A double species 23Na and 87Rb Bose–Einstein condensate with tunable miscibility via an interspecies Feshbach resonance. J. Phys. B At. Mol. Opt. Phys. 2015, 49, 015302. [Google Scholar] [CrossRef] [Green Version]
  13. Wacker, L.; Jørgensen, N.B.; Birkmose, D.; Horchani, R.; Ertmer, W.; Klempt, C.; Winter, N.; Sherson, J.; Arlt, J.J. Tunable dual-species Bose–Einstein condensates of 39K and 87Rb. Phys. Rev. A 2015, 92, 053602. [Google Scholar] [CrossRef] [Green Version]
  14. Schulze, T.A.; Hartmann, T.; Voges, K.K.; Gempel, M.W.; Tiemann, E.; Zenesini, A.; Ospelkaus, S. Feshbach spectroscopy and dual-species Bose–Einstein condensation of 23Na-39K mixtures. Phys. Rev. A 2018, 97, 023623. [Google Scholar] [CrossRef] [Green Version]
  15. Altman, E.; Hofstetter, W.; Demler, E.; Lukin, M.D. Phase diagram of two-component bosons on an optical lattice. New J. Phys. 2003, 5, 113. [Google Scholar] [CrossRef]
  16. Isacsson, A.; Cha, M.C.; Sengupta, K.; Girvin, S. Superfluid-insulator transitions of two-species bosons in an optical lattice. Phys. Rev. B 2005, 72, 184507. [Google Scholar] [CrossRef] [Green Version]
  17. Bruderer, M.; Bao, W.; Jaksch, D. Self-trapping of impurities in Bose–Einstein condensates: Strong attractive and repulsive coupling. EPL (Europhys. Lett.) 2008, 82, 30004. [Google Scholar] [CrossRef] [Green Version]
  18. Spethmann, N.; Kindermann, F.; John, S.; Weber, C.; Meschede, D.; Widera, A. Dynamics of single neutral impurity atoms immersed in an ultracold gas. Phys. Rev. Lett. 2012, 109, 235301. [Google Scholar] [CrossRef] [Green Version]
  19. Cabrera, C.; Tanzi, L.; Sanz, J.; Naylor, B.; Thomas, P.; Cheiney, P.; Tarruell, L. Quantum liquid droplets in a mixture of Bose–Einstein condensates. Science 2018, 359, 301–304. [Google Scholar] [CrossRef] [Green Version]
  20. Semeghini, G.; Ferioli, G.; Masi, L.; Mazzinghi, C.; Wolswijk, L.; Minardi, F.; Modugno, M.; Modugno, G.; Inguscio, M.; Fattori, M. Self-bound quantum droplets of atomic mixtures in free space. Phys. Rev. Lett. 2018, 120, 235301. [Google Scholar] [CrossRef] [Green Version]
  21. D’Errico, C.; Burchianti, A.; Prevedelli, M.; Salasnich, L.; Ancilotto, F.; Modugno, M.; Minardi, F.; Fort, C. Observation of quantum droplets in a heteronuclear bosonic mixture. Phys. Rev. Res. 2019, 1, 033155. [Google Scholar] [CrossRef] [Green Version]
  22. Guo, Z.; Jia, F.; Li, L.; Ma, Y.; Hutson, J.M.; Cui, X.; Wang, D. Lee-Huang-Yang effects in the ultracold mixture of 23Na and 87Rb with attractive interspecies interactions. arXiv 2021, arXiv:2105.01277. [Google Scholar]
  23. Khabibullaev, P.K.; Saidov, A. Phase Separation in Soft Matter Physics: Micellar Solutions, Microemulsions, Critical Phenomena; Springer Science & Business Media: Berlin/Heidelberg, Germany, 2003; Volume 138. [Google Scholar]
  24. Dagotto, E. Nanoscale Phase Separation and Colossal Magnetoresistance: The Physics of Manganites and Related Compounds; Springer Science & Business Media: Berlin/Heidelberg, Germany, 2013; Volume 136. [Google Scholar]
  25. Pethick, C.J.; Smith, H. Bose—Einstein Condensation in Dilute Gases; Cambridge University Press: Cambridge, UK, 2008. [Google Scholar]
  26. Pitaevskii, L.; Stringari, S. Bose—Einstein Condensation; Oxford University Press: Oxford, UK, 2003. [Google Scholar]
  27. Chin, C.; Grimm, R.; Julienne, P.; Tiesinga, E. Feshbach resonances in ultracold gases. Rev. Mod. Phys. 2010, 82, 1225–1286. [Google Scholar] [CrossRef]
  28. Gaunt, A.L.; Schmidutz, T.F.; Gotlibovych, I.; Smith, R.P.; Hadzibabic, Z. Bose–Einstein Condensation of Atoms in a Uniform Potential. Phys. Rev. Lett. 2013, 110, 200406. [Google Scholar] [CrossRef]
  29. Wen, L.; Liu, W.M.; Cai, Y.; Zhang, J.M.; Hu, J. Controlling phase separation of a two-component Bose–Einstein condensate by confinement. Phys. Rev. A 2012, 85, 043602. [Google Scholar] [CrossRef] [Green Version]
  30. Navarro, R.; Carretero-González, R.; Kevrekidis, P.G. Phase separation and dynamics of two-component Bose–Einstein condensates. Phys. Rev. A 2009, 80, 023613. [Google Scholar] [CrossRef] [Green Version]
  31. Bisset, R.N.; Kevrekidis, P.G.; Ticknor, C. Enhanced quantum spin fluctuations in a binary Bose–Einstein condensate. Phys. Rev. A 2018, 97, 023602. [Google Scholar] [CrossRef] [Green Version]
  32. Wen, L.; Guo, H.; Wang, Y.J.; Hu, A.Y.; Saito, H.; Dai, C.Q.; Zhang, X.F. Effects of atom numbers on the miscibility-immiscibility transition of a binary Bose–Einstein condensate. Phys. Rev. A 2020, 101, 033610. [Google Scholar] [CrossRef]
  33. Tanatar, B.; Erkan, K. Strongly interacting one-dimensional Bose–Einstein condensates in harmonic traps. Phys. Rev. A 2000, 62, 053601. [Google Scholar] [CrossRef]
  34. Ma, H.; Pang, T. Condensate-profile asymmetry of a boson mixture in a disk-shaped harmonic trap. Phys. Rev. A 2004, 70, 063606. [Google Scholar] [CrossRef] [Green Version]
  35. Lee, K.L.; Jørgensen, N.B.; Liu, I.K.; Wacker, L.; Arlt, J.J.; Proukakis, N.P. Phase separation and dynamics of two-component Bose–Einstein condensates. Phys. Rev. A 2016, 94, 013602. [Google Scholar] [CrossRef] [Green Version]
  36. Cikojević, V.; Markić, L.V.; Boronat, J. Harmonically trapped Bose–Bose mixtures: A quantum Monte Carlo study. New J. Phys. 2018, 20, 085002. [Google Scholar] [CrossRef]
  37. Pires, R.; Ulmanis, J.; Häfner, S.; Repp, M.; Arias, A.; Kuhnle, E.D.; Weidemüller, M. Observation of Efimov Resonances in a Mixture with Extreme Mass Imbalance. Phys. Rev. Lett. 2014, 112, 250404. [Google Scholar] [CrossRef] [Green Version]
  38. Yao, X.C.; Chen, H.Z.; Wu, Y.P.; Liu, X.P.; Wang, X.Q.; Jiang, X.; Deng, Y.; Chen, Y.A.; Pan, J.W. Observation of Coupled Vortex Lattices in a Mass-Imbalance Bose and Fermi Superfluid Mixture. Phys. Rev. Lett. 2016, 117, 145301. [Google Scholar] [CrossRef] [Green Version]
  39. d’Errico, C.; Zaccanti, M.; Fattori, M.; Roati, G.; Inguscio, M.; Modugno, G.; Simoni, A. Feshbach resonances in ultracold 39K. New J. Phys. 2007, 9, 223. [Google Scholar] [CrossRef] [Green Version]
  40. Castilho, P.; Pedrozo-Peñafiel, E.; Gutierrez, E.; Mazo, P.; Roati, G.; Farias, K.; Bagnato, V. A compact experimental machine for studying tunable Bose–Bose superfluid mixtures. Laser Phys. Lett. 2019, 16, 035501. [Google Scholar] [CrossRef] [Green Version]
  41. Burchianti, A.; D’Errico, C.; Rosi, S.; Simoni, A.; Modugno, M.; Fort, C.; Minardi, F. Dual-species Bose–Einstein condensate of 41K and 87Rb in a hybrid trap. Phys. Rev. A 2018, 98, 063616. [Google Scholar] [CrossRef]
  42. Ota, M.; Giorgini, S.; Stringari, S. Magnetic Phase Transition in a Mixture of Two Interacting Superfluid Bose Gases at Finite Temperature. Phys. Rev. Lett. 2019, 123, 075301. [Google Scholar] [CrossRef] [PubMed] [Green Version]
  43. Ota, M.; Giorgini, S. Thermodynamics of dilute Bose gases: Beyond mean-field theory for binary mixtures of Bose–Einstein condensates. Phys. Rev. A 2020, 102, 063303. [Google Scholar] [CrossRef]
  44. Roy, A.; Ota, M.; Recati, A.; Dalfovo, F. Finite-temperature spin dynamics of a two-dimensional Bose-Bose atomic mixture. Phys. Rev. Res. 2021, 3, 013161. [Google Scholar] [CrossRef]
  45. Griffin, A.; Snoke, D.W.; Stringari, S. Bose—Einstein Condensation; Cambridge University Press: Cambridge, UK, 1996. [Google Scholar]
  46. Riboli, F.; Modugno, M. Topology of the ground state of two interacting Bose–Einstein condensates. Phys. Rev. A 2002, 65, 063614. [Google Scholar] [CrossRef] [Green Version]
  47. Dalfovo, F.; Stringari, S. Bosons in anisotropic traps: Ground state and vortices. Phys. Rev. A 1996, 53, 2477. [Google Scholar] [CrossRef] [PubMed] [Green Version]
  48. Catani, J.; Maioli, P.; De Sarlo, L.; Minardi, F.; Inguscio, M. Intense slow beams of bosonic potassium isotopes. Phys. Rev. A 2006, 73, 033415. [Google Scholar] [CrossRef] [Green Version]
  49. Lamporesi, G.; Donadello, S.; Serafini, S.; Ferrari, G. Compact high-flux source of cold sodium atoms. Rev. Sci. Instrum. 2013, 84, 063102. [Google Scholar] [CrossRef] [PubMed] [Green Version]
  50. Wu, C.H. Strongly Interacting Quantum Mixtures of Ultracold Atoms. Ph.D. Thesis, Massachusetts Institute of Technology, Cambridge, MA, USA, 2013. [Google Scholar]
  51. Davis, K.B.; Mewes, M.O.; Andrews, M.R.; van Druten, N.J.; Durfee, D.S.; Kurn, D.M.; Ketterle, W. Bose–Einstein Condensation in a Gas of Sodium Atoms. Phys. Rev. Lett. 1995, 75, 3969–3973. [Google Scholar] [CrossRef] [PubMed] [Green Version]
  52. Masuhara, N.; Doyle, J.M.; Sandberg, J.C.; Kleppner, D.; Greytak, T.J.; Hess, H.F.; Kochanski, G.P. Evaporative Cooling of Spin-Polarized Atomic Hydrogen. Phys. Rev. Lett. 1988, 61, 935–938. [Google Scholar] [CrossRef]
  53. Schreck, F.; Ferrari, G.; Corwin, K.L.; Cubizolles, J.; Khaykovich, L.; Mewes, M.O.; Salomon, C. Sympathetic cooling of bosonic and fermionic lithium gases towards quantum degeneracy. Phys. Rev. A 2001, 64, 011402. [Google Scholar] [CrossRef] [Green Version]
  54. Modugno, G.; Ferrari, G.; Roati, G.; Brecha, R.J.; Simoni, A.; Inguscio, M. Bose–Einstein condensation of potassium atoms by sympathetic cooling. Science 2001, 294, 1320–1322. [Google Scholar] [CrossRef]
  55. Grimm, R.; Weidemüller, M.; Ovchinnikov, Y.B. Optical dipole traps for neutral atoms. Adv. At. Mol. Opt. Phys. 2000, 42, 95–170. [Google Scholar]
  56. Zhan, F.; Sabbatini, J.; Davis, M.J.; McCulloch, I.P. Miscible-immiscible quantum phase transition in coupled two-component Bose–Einstein condensates in one-dimensional optical lattices. Phys. Rev. A 2014, 90, 023630. [Google Scholar] [CrossRef] [Green Version]
  57. Richaud, A.; Zenesini, A.; Penna, V. The mixing-demixing phase diagram of ultracold heteronuclear mixtures in a ring trimer. Sci. Rep. 2019, 9, 6908. [Google Scholar] [CrossRef] [Green Version]
  58. Kumar, R.K.; Muruganandam, P.; Tomio, L.; Gammal, A. Miscibility in coupled dipolar and non-dipolar Bose–Einstein condensates. J. Phys. Commun. 2017, 1, 035012. [Google Scholar] [CrossRef]
  59. Kasamatsu, K.; Tsubota, M.; Ueda, M. Vortex Phase Diagram in Rotating Two-Component Bose–Einstein Condensates. Phys. Rev. Lett. 2003, 91, 150406. [Google Scholar] [CrossRef] [Green Version]
  60. Mason, P.; Aftalion, A. Classification of the ground states and topological defects in a rotating two-component Bose–Einstein condensate. Phys. Rev. A 2011, 84, 033611. [Google Scholar] [CrossRef] [Green Version]
  61. Kuopanportti, P.; Huhtamäki, J.A.M.; Möttönen, M. Exotic vortex lattices in two-species Bose–Einstein condensates. Phys. Rev. A 2012, 85, 043613. [Google Scholar] [CrossRef] [Green Version]
  62. Takeuchi, H.; Ishino, S.; Tsubota, M. Binary Quantum Turbulence Arising from Countersuperflow Instability in Two-Component Bose–Einstein Condensates. Phys. Rev. Lett. 2010, 105, 205301. [Google Scholar] [CrossRef] [PubMed]
  63. Fava, E.; Bienaimé, T.; Mordini, C.; Colzi, G.; Qu, C.; Stringari, S.; Lamporesi, G.; Ferrari, G. Observation of Spin Superfluidity in a Bose Gas Mixture. Phys. Rev. Lett. 2018, 120, 170401. [Google Scholar] [CrossRef] [PubMed] [Green Version]
  64. Kim, J.H.; Hong, D.; Shin, Y. Observation of two sound modes in a binary superfluid gas. Phys. Rev. A 2020, 101, 061601. [Google Scholar] [CrossRef]
  65. Kasamatsu, K.; Tsubota, M. Modulation instability and solitary-wave formation in two-component Bose–Einstein condensates. Phys. Rev. A 2006, 74, 013617. [Google Scholar] [CrossRef] [Green Version]
  66. Kadokura, T.; Aioi, T.; Sasaki, K.; Kishimoto, T.; Saito, H. Rayleigh-Taylor instability in a two-component Bose–Einstein condensate with rotational symmetry. Phys. Rev. A 2012, 85, 013602. [Google Scholar] [CrossRef] [Green Version]
  67. Baggaley, A.W.; Parker, N.G. Kelvin-Helmholtz instability in a single-component atomic superfluid. Phys. Rev. A 2018, 97, 053608. [Google Scholar] [CrossRef] [Green Version]
  68. Maity, D.K.; Mukherjee, K.; Mistakidis, S.I.; Das, S.; Kevrekidis, P.G.; Majumder, S.; Schmelcher, P. Parametrically excited star-shaped patterns at the interface of binary Bose–Einstein condensates. Phys. Rev. A 2020, 102, 033320. [Google Scholar] [CrossRef]
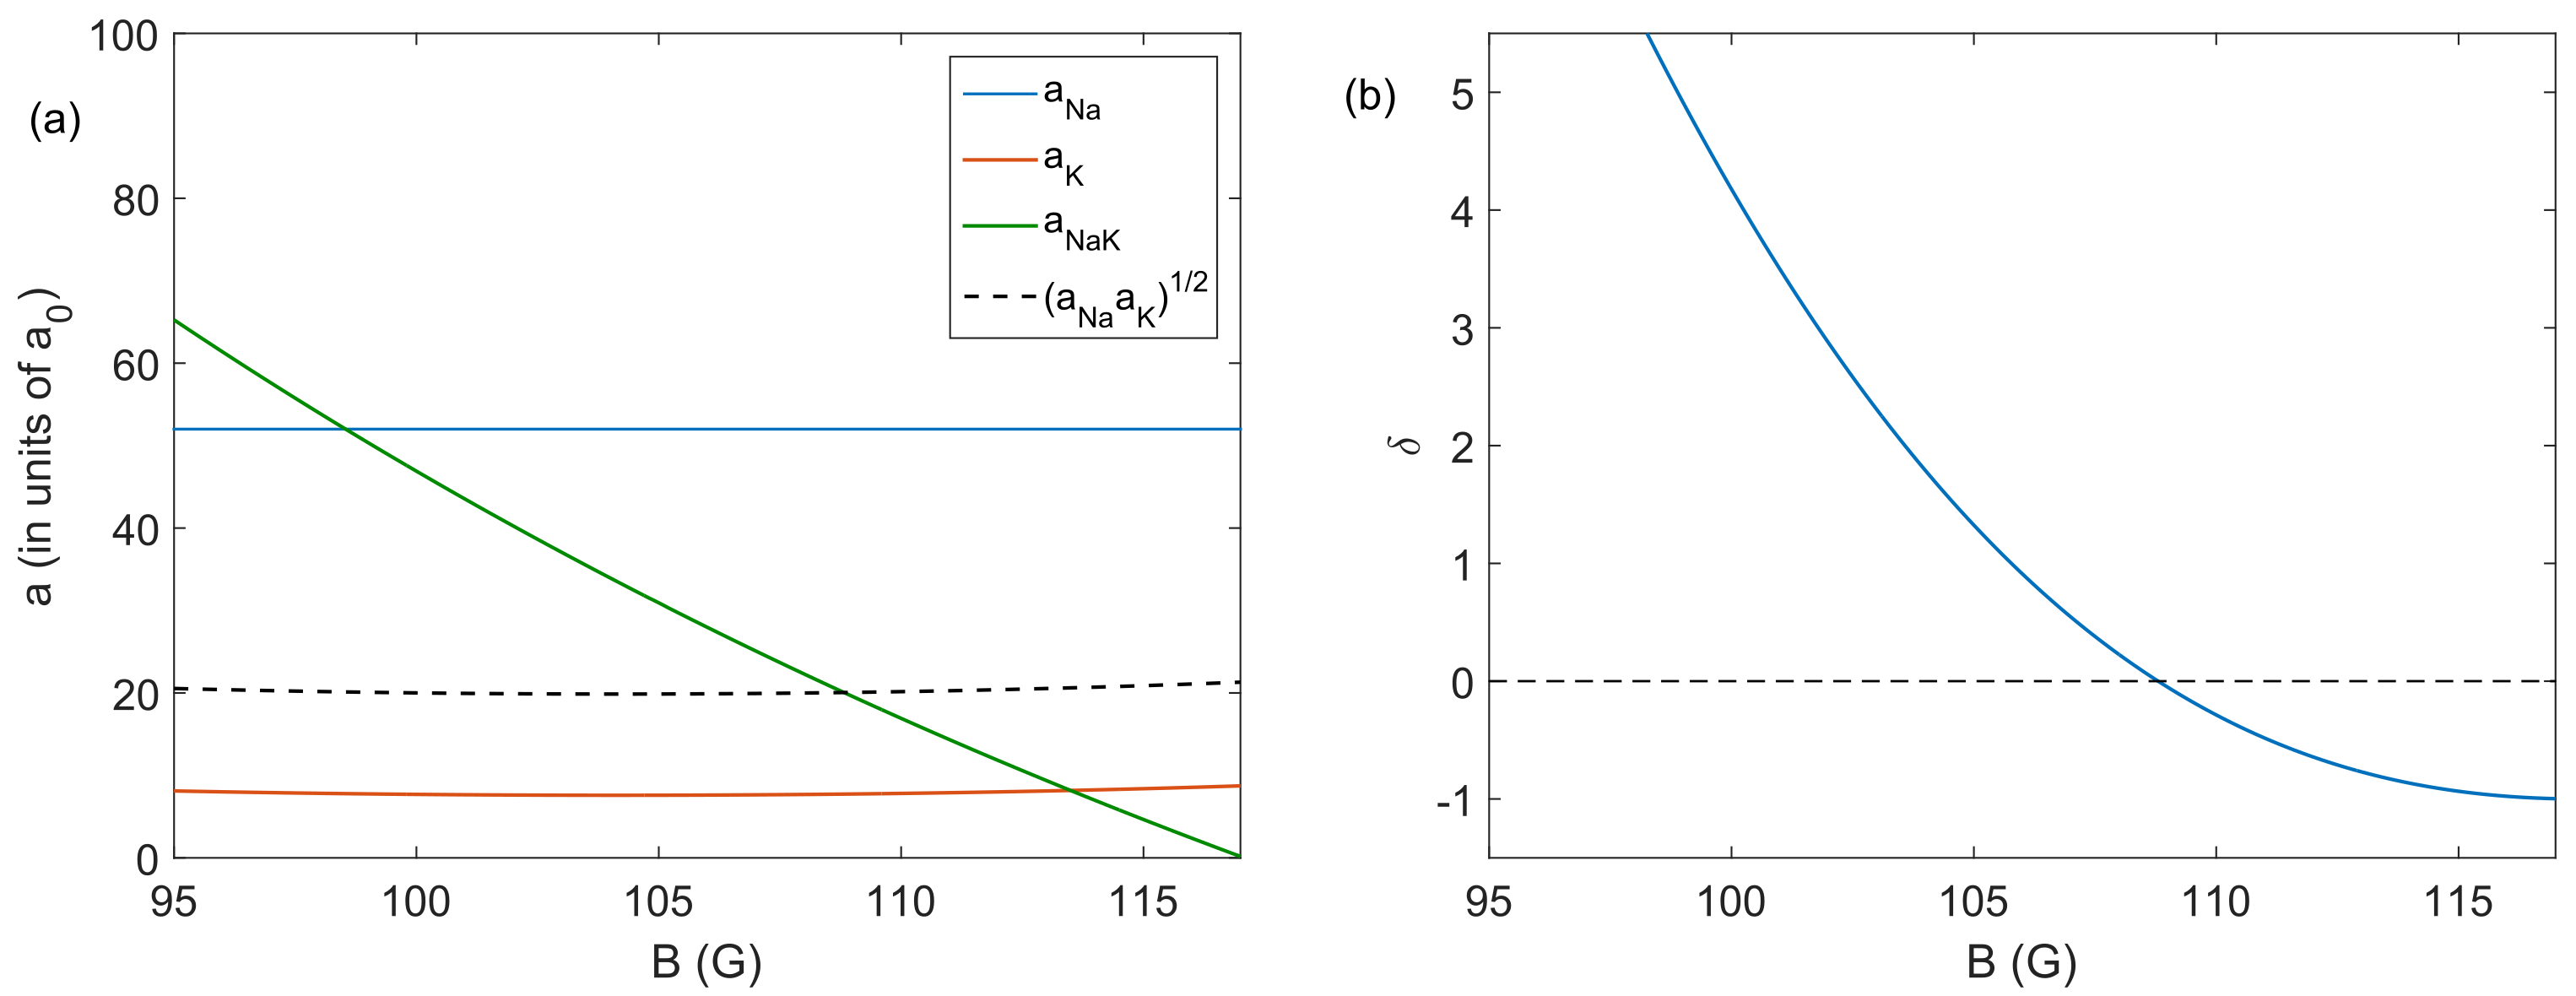
Figure 1. (a) Scattering lengths as a function of the magnetic field for the intra-species interactions of 23 Na, a Na (in blue), and 39 K, a K (in red), and for the inter-species interaction a NaK (in green) considering both atoms in the F = 1 , m F = 1 hyperfine state. The black dashed line given by ( a Na a K ) 1 / 2 represents the value of a NaK for which the system changes from immiscible to miscible with δ = 0 . (b) Miscibility parameter as a function of the magnetic field. At B = 109.1 G with δ = 0 the system changes from immiscible to miscible when increasing B.
Applsci 11 09099 g001
Figure 2. Density profiles along the z-axis of the simulated ground-state of 23 Na (in blue) and 39 K (in red): (a) B = 100 G with δ = 4.32 , (b) B = 108 G with δ = 0.22 and (c) B = 111 G with δ = 0.50 . In each case, we display the results of three atom number ratio η = N Na / N K equal to 50 (solid lines), 10 (dashed lines) and 5 (dotted lines).
Applsci 11 09099 g002
Figure 3. Normalized overlap as a function of the Feshbach field for different values of η . For large η , N K < < N Na (blue circles), the spatial overlap increases at earlier magnetic fields showing the transition to the miscible phase for u 12 2 > u 11 u 22 (with δ > 0 ). In the opposite scenario, for η = 1 , N K = N Na (red stars), the normalized spatial overlap significantly increases only for B > 111 G remaining immiscible even if u 12 2 < u 11 u 22 (with δ < 0 ).
Applsci 11 09099 g003
Figure 4. (a) Numerical second derivative of the normalized overlap, O norm . We identify the peak position of each curve as the magnetic field value, B peak , for which the normalized overlap changes the most indicating the transition from immiscible to miscible. The dotted lines serve only as guide to the eyes. In (b), we show B peak as a function of η in a semilog scale which gives a logarithm dependence of B peak with the atom number ration. The red solid curve is a fit to the data points (see main text) and the black dashed line represents B 0 with δ = 0 .
Applsci 11 09099 g004
Figure 5. Phase diagram of the miscible–immiscible phase transition for the 23 Na– 39 K mixture under our experimental conditions. The colormap represents the value of the normalized overlap for each combination of η and B. The light gray line sets the phase transition point obtained from the second derivative of the normalized overlap. The condition for an homogeneous system is shown by the black dashed line at B 0 = 109.1 G.
Applsci 11 09099 g005
Figure 6. Normalized overlap, O norm , as a function of the Feshbach field, B, for η = 1 under different trapping conditions (see main text).
Applsci 11 09099 g006
Publisher’s Note: MDPI stays neutral with regard to jurisdictional claims in published maps and institutional affiliations.