Article

Optimized Fermentation and Freezing Conditions for Ready-to-Proof and Ready-to-Bake Frozen Dough of Sweet Bread

1
Department of Food Science and Nutrition, Pusan National University, Busan 46241, Korea
2
Kimchi Research Institute, Pusan National University, Busan 46241, Korea
*
Author to whom correspondence should be addressed.
Appl. Sci. 2021, 11(17), 7904; https://doi.org/10.3390/app11177904
Submission received: 10 August 2021 / Revised: 24 August 2021 / Accepted: 25 August 2021 / Published: 27 August 2021
(This article belongs to the Special Issue Cereal-Based Foods)

Abstract

:
The processing conditions for ready-to-proof (RTP) and ready-to-bake (RTB) frozen sweet bread doughs were optimized using response surface methodology. A central composite design determined four factors and the tested range for each factor: a first fermentation time of 15~45 min, a second fermentation time of 30~90 min, a freezing temperature of −45~−25 °C, and a freezing time of 30~90 min. Sweet bread produced with these doughs was evaluated by bread weight, moisture content, crust color, height, volume, and firmness. Both the RTP and RTB doughs resulted in equal bread volume and height to the fresh dough, indicating excellent frozen stability. The first and second fermentation times were the significant processing factors for the RTP and RTB doughs influencing representative bread quality attributes based on quadratic models and ANOVA. Fermentation steps appeared to more significantly contribute to the quality of sweet bread made of frozen dough than freezing steps. The optimized RTP and RTB sweet bread dough processing conditions were the long first and second fermentation times for the dough based on a multiple response method and desirability. The optimum processing conditions for the RTP and RTB doughs were 44.7 min for the first fermentation time, 86.3 min for the second fermentation time, a −32.8 °C freezing temperature, and an 85.5 min freezing time.

1. Introduction

With increasing consumer interest in health and food safety, the demand for fresh foods is also increasing. In the past, mass production factory bread was consumed dominantly, but recently, freshly baked bread in bakeries using frozen dough has been consumed more. Since the 1950s, the bread baking industry has increasingly used frozen dough to the increase in demand for such products. Depending on the manufacturing process, frozen dough can be divided into ready-to-proof (RTP) and ready-to-bake (RTB) dough [1,2].
RTP dough is produced by immediately freezing dough after mixing or after mixing and shortly after fermenting and is used more often than RTB dough because of its high availability in the frozen dough market. However, another fermentation step is required for the thawed dough before baking. In comparison, RTB dough is produced by immediately freezing dough after mixing and complete fermentation and is sometimes preferred/used by some pastry producers in Europe. When using RTB dough, preparing fresh bread does not require experienced operators and fermentation steps, thus saving labor costs [3,4].
Although frozen dough can improve work efficiency, the major problem is the loss of gluten strength and yeast viability during freezing and frozen storage, which affects bread quality attributes, such as bread volume, color, and texture [5,6,7,8]. Decreasing the number of yeast cells by freezing causes a decrease in the yeast’s gas-producing ability [6]. Reducing substances such as the glutathione released from dead yeast cells because of the frozen storage of the dough could reduce the cross-linking of gluten and dough strength [9].
To improve the stability of frozen dough, numerous efforts have been made using supplementing ingredients, such as gums [10,11,12], emulsifiers [13], starch [14], vital wheat gluten [15], and vitamin C, and enzymes [16,17]. Additionally, numerous studies on the effect of processing conditions of frozen dough on bread quality have been reported [18]. As processing factors related to frozen dough production, mixing time, fermentation temperature and time, freezing speed, freezing and thawing temperature, and thawing speed of dough have been considered [11,19]. The freezing rate and temperature affect the quality of frozen croissant dough by influencing ice crystal formation and yeast viability in a frozen dough matrix [20]. The fermentation process also affects the quality of frozen dough through various complex biochemical reactions, which provide a distinctive bread flavor. Dough frozen after fermentation produces inferior quality bread than that produced by dough frozen before fermentation [21]. Studies on the processing conditions of frozen dough have mainly focused on bread or croissants, but those focusing on the brioche type of sweet bread popularly consumed in Korea are scarce and are worth exploring. In addition, our previous study explored the formula optimization of RTP and RTB frozen sweet bread dough with major ingredients and identified sugar and water as the significant factors for all types of dough, leading to the enhanced frozen stability of RTP dough and the deteriorated stability of RTB dough [22].
In the present study, a similar experimental approach as that in our formula optimization study was used to explore the effect of the primary processing conditions on the quality of sweet bread made from RTP and RTB dough, and the optimization of the processing conditions of each dough was evaluated using response surface methodology (RSM). The quality parameters that were analyzed for bread made from RTP and RTB dough were weight, moisture, top crust color, volume, height, and firmness, which were compared to those for bread made from fresh dough.

2. Materials and Methods

2.1. Materials

Commercial bread flour (Milmax, Samyang Corp., Asan, Korea) was used. The moisture and ash contents of the flour were 14.5% and 0.35%, respectively. Sugar and shortening (Samyang Corp.), salt (CJ, Seoul, Korea), non-fat dry milk (Seoul Milk, Seoul, Korea), yeast (Saf-instant, Lesaffre, Marcq-en-Baroeul, France), and eggs were purchased from a local supermarket.

2.2. Setting Up Processing Conditions Based on an Experimental Design

Using the Design Expert 10 (Stat-Easy Co., Minneapolis, MN, USA) program, a central composite design was set up for a RSM experimental design. The first and second fermentation times, freezing temperature, and freezing time were selected, and each factor was set up as two levels, including a center point; using a similar approach to that in a previously conducted formula optimization study for RTP and RTB frozen sweet bread dough using RSM [22], the tested minimum and maximum levels for each factor were 15 and 30 min for the first fermentation time, 30 and 90 min for the second fermentation time, −45 and −25 °C for the freezing temperature, and 30 and 90 min for the freezing time, respectively. The experimental processing conditions with random run order are listed in Table 1. The basic ingredients and formula of sweet bread in the study were: 100 g flour, 30 g sugar, 45 g water, 25 g shortening, and 3.5 g yeast. The frozen sweet bread dough formula was selected from our preliminary study, which had a relatively high level of sugar and a low level of water, resulting in good frozen stability.

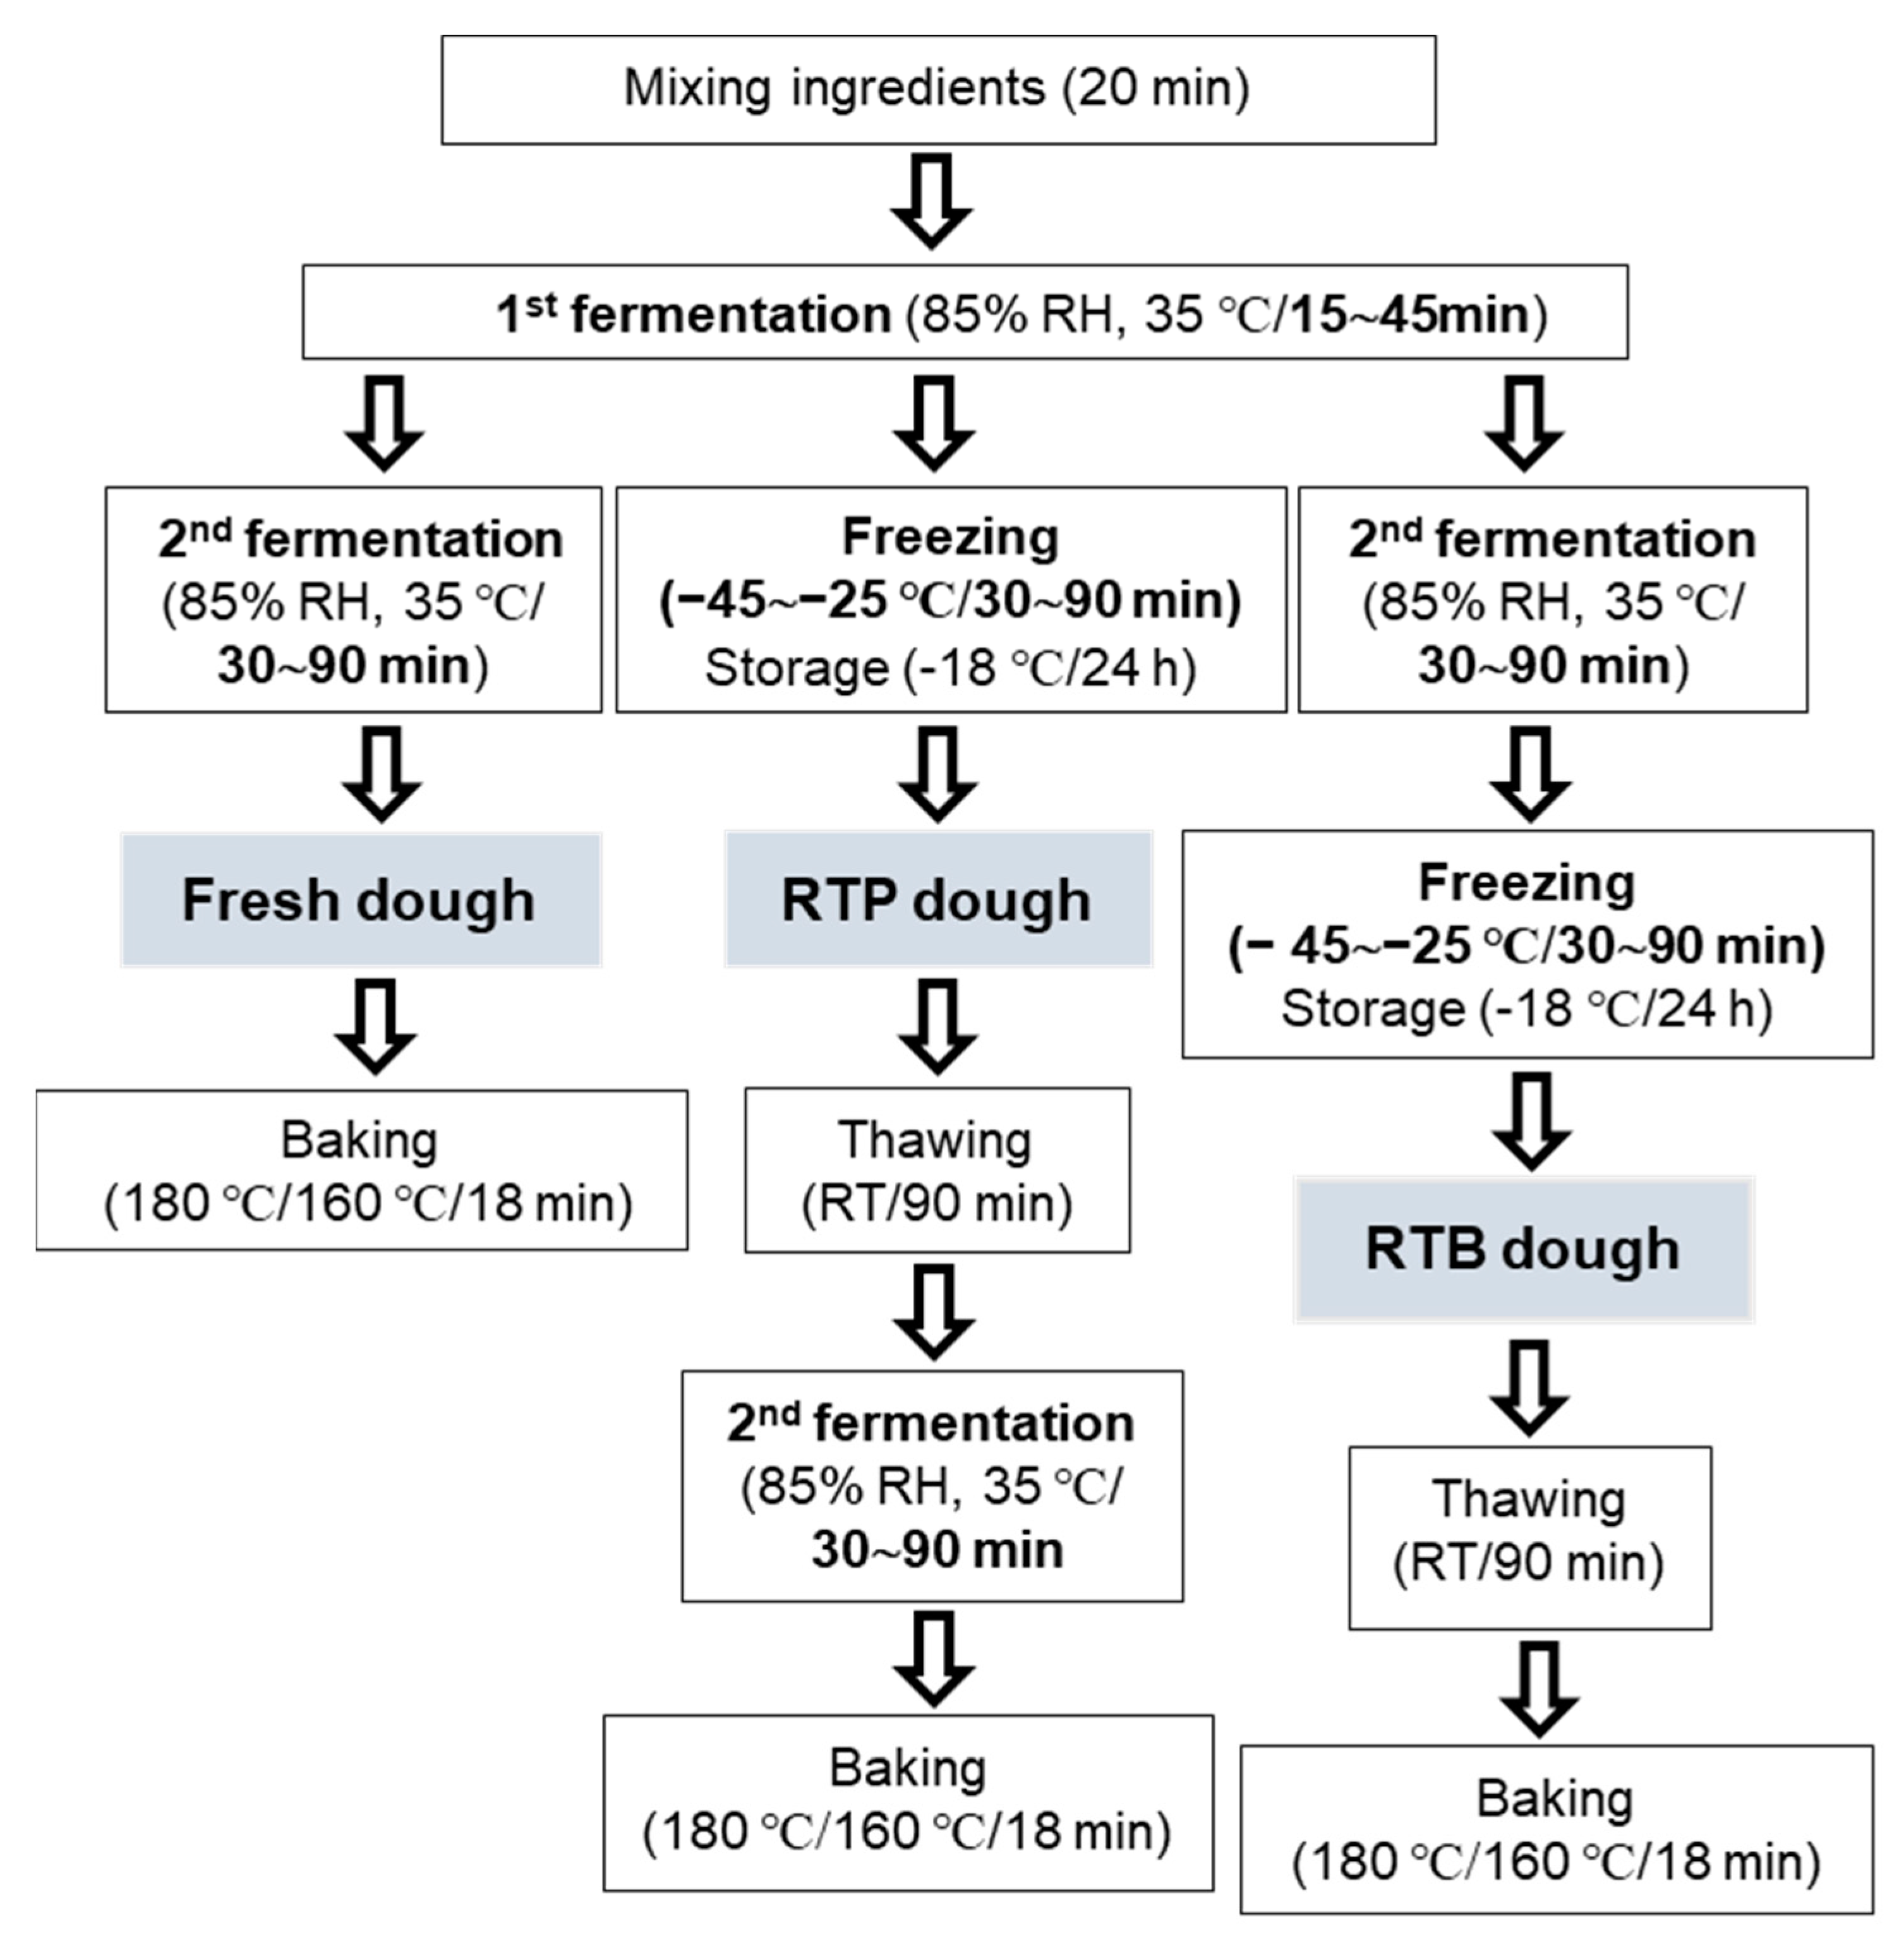
2.3. Preparation of Fresh and RTP and RTB Frozen Dough

According to the dough making process reported by Zhao and Kweon [22], fresh and RTP and RTB frozen dough were prepared (Figure 1). Pre-weighed dry ingredients (flour, sugar, salt, non-fat dry milk, and yeast) were placed in a mixer mixing bowl (N50, Hobart Corp., Troy, OH, USA). Furthermore, pre-weighed liquid ingredients (distilled water, egg, and shortening) were added to the bowl and were mixed at speed 1 for 2 min and then at speed 2 for 14 min to allow dough development. Approximately 75 g of the mixed dough was rounded, placed in a baking pan, and rested in a fermenter (Phantom M301 Combi, Samjung, Hanam, Korea) at 35 °C and 85% relative humidity for 15–45 min (first fermentation). The fresh control dough was fermented for 30–90 min more in the same fermenter (second fermentation) and was baked. The RTP dough was prepared by immediately freezing the dough in a freezer (Lab-Freezer FCG-150, Jeio Tech, Daejeon, Korea) at −45–−25 °C (freezing temperature) for 30–90 min (freezing time), and it was then stored at −18 °C for 24 h before baking. The RTB dough was prepared by fermenting in the same fermenter for 30–90 min more under the same conditions (second fermentation) and was then placed in a freezer at −45–−25 °C for 30–90 min. The RTB dough was then stored at −18 °C for 24 h before baking. The experiment was performed by selecting 1 day as the freezing storage period because the quality of the bread was seen to decline rapidly on day 1, and the change slowed with further storage, as observed through a preliminary experiment. Before baking, both the RTB and RTP doughs were removed from the freezer and were thawed to 25 °C for 90 min. The RTP dough was further fermented at 35 °C and 85% relative humidity for 30–90 min before baking. In comparison, the RTB dough was baked under the baking conditions without a further fermentation step. All three dough types were baked in a pre-heated oven (Phantom M301 Combi, Samjung, Hanam, Korea) at 160 °C upper heat and 180 °C lower heat. The bread samples were used to analyze quality parameters, such as weight, moisture, top crust color, volume, height, and firmness.

2.4. Measurement of Bread Weight and Moisture Content

After cooling the bread for 2 h, the bread weight was measured. The moisture content of the bread was measured according to the AACC approved method 44-15.02 [23]. Approximately 3 g of breadcrumbs were taken from the bread center, placed in an aluminum weighing pan, dried in a drying oven at 130 °C for 1 h, cooled for 30 min in a desiccator, and weighed. The moisture content of the bread was calculated from the reduced weight during drying. Each measurement was performed in duplicate.

2.5. Measurement of Bread Crust Color

The color of the top surface of the bread crust was measured using a colorimeter (CR-20, Minolta, Co., Tokyo, Japan) for L* (lightness), a* (redness), and b* (yellowness) values. Each measurement was performed in duplicate.

2.6. Assessment of Bread Height and Volume

The bread height and volume were measured according to the AACC approved method 10-05.01 [23] and the method reported by Jang et al. [24]. The bread volume was measured using the seed displacement method with millet seeds. The millet density was calculated by filling the seeds in a 1.5-L plastic container and converting the weight into volume. A bread loaf was placed in a millet-filled container, and the weight of the millet pushed out of the container was measured. The bread volume was calculated based on the density, and each measurement was performed in triplicate.

2.7. Determination of Bread Crumb Firmness

The bread was cut into 2-cm-thick pieces from the center. The width of the bread was 6 cm, but the length of the bread varied depending on bread height (5–10 cm). The firmness of breadcrumbs was measured using a texture analyzer (Brookfield CT3, Middleboro, MA, USA) according to the AACC approved method 74-09.01 [23]. The measurement conditions were mode, measure force in compression; pre-test speed, 2.0 mm/s; test speed, 2.0 mm/s; post-test speed, 5.0 mm/s; probe, TA-36; and penetration distance, 15 mm. Each measurement was performed in triplicate.

2.8. Statistical Analysis

A total of two or more repeated experiments were performed to collect all of the data. ANOVA was performed to evaluate the average values using the Design Expert program (Stat-Easy Co., Minneapolis, MN, USA). The most accurate models for each response variable were identified using model summaries and lack-of-fit tests. For each quality parameter, three-dimensional response surface plots were generated. A multiple response method and desirability were used to identify the optimized processing conditions for the fresh and the RTP and RTB frozen sweet bread doughs. Desires and priorities for bread volume, height, and firmness were incorporated into the optimization methods as the most representative attributes of bread quality. Bread volume and height were specified as the maximum desirable, and firmness was specified as the minimum desirable. Optimization was conducted for each dough and all of the doughs combined.

3. Results and Discussion

3.1. Weight, Moisture Content, and Crust Color of Bread

Quality characteristics of sweet bread prepared from the fresh and the RTP and RTB doughs are presented as the minimum (Min), maximum (Max), and mean values in Table 2. Significant factors for each response identified by ANOVA are shown in Table 3.
The weights of bread made of the fresh and the RTP and RTB doughs were 63.8–64.7 g, 63.6–64.0 g, and 63.2–65.5 g per loaf, respectively. There was no relationship between the bread weight and processing factors: the first and second fermentation time, freezing temperature, and freezing time. Zhao and Kweon [22] previously showed that water and sugar in the formula positively affect bread weight. As expected, using the same formula, including water and sugar in this study showed no significant difference in bread weight between the bread made from the fresh and the RTP and RTB doughs prepared under different processing conditions.
The moisture contents of the bread made from the fresh and the RTP and RTB frozen doughs were 30.6–33.5%, 31.0–35.3%, and 31.1–35.9%, respectively. No significant effects of any processing factor on the moisture content of bread made from the fresh and the RTP and RTB doughs were observed. As expected from the results of the bread weight analysis, the same formula used for all of the doughs did not affect bread moisture.
The color of the bread crust, L* values (brightness) of the bread made of fresh, RTP, and RTB doughs were 36.9–44.1, 38.1–44.2, and 37.6–49.2, respectively. The variation in the L* values was relatively greater for the bread made of RTB dough than for the bread made of fresh and RTP dough. ANOVA showed a significant effect on the L * value of the bread crust for the RTB dough only by second fermentation time and no significant effect on those for the fresh and RTP dough. The bread crust color, a* values (redness), of the bread made of the fresh, RTP, and RTB doughs were 15.9–18.5, 14.4–17.6, and 15.5–18.3, respectively. The variation in the a* values was not different between the bread made from any of the doughs. However, ANOVA revealed that the a* value was significantly affected by three processing factors, except for the first fermentation time for the bread made with the RTP dough and two processing factors (first and second fermentation times) for the bread made with the RTB dough. The color of the bread crust, b* values (yellowness), of the bread made of the fresh, RTP, and RTB doughs were 19.6–24.6, 17.2–25.0, and 19.1–29.6, respectively. The variation in the b* values showed a similar trend to that of the L* values, which had a much wider range for the bread made from the RTB dough than that for the bread made from the fresh and RTP doughs. However, the b* value was significantly affected by the second fermentation time and the freezing temperature for the bread made with the RTP dough and by the first and second fermentation times for the bread made with the RTB dough. Overall, the crust color (L*, a*, and b*) of the bread made with the RTB dough was more affected by the processing conditions than the bread made with the RTP dough was. The bread made with fresh dough was not affected, even by the fermentation steps, indicating a significant contribution by freezing steps to the development of crust color. The color of the bread crust was mainly developed because of the Maillard reaction, which occurred more favorably at the conditions by the evaporation of water and the drying of the dough surface during baking [9]. The freezing rate affected the size of the ice crystals in the frozen doughs [8,18,20]: the faster the freezing rate, the smaller the ice crystals that were formed. The difference in the ice crystals formed in the RTP and RTB doughs could be anticipated by different freezing rates from different freezing temperatures of −25 °C and −45 °C. The size and amount of ice crystals could influence the thawing rate of the dough and the evaporation rate of the water from the dough surface during baking, thus showing variation in color development.

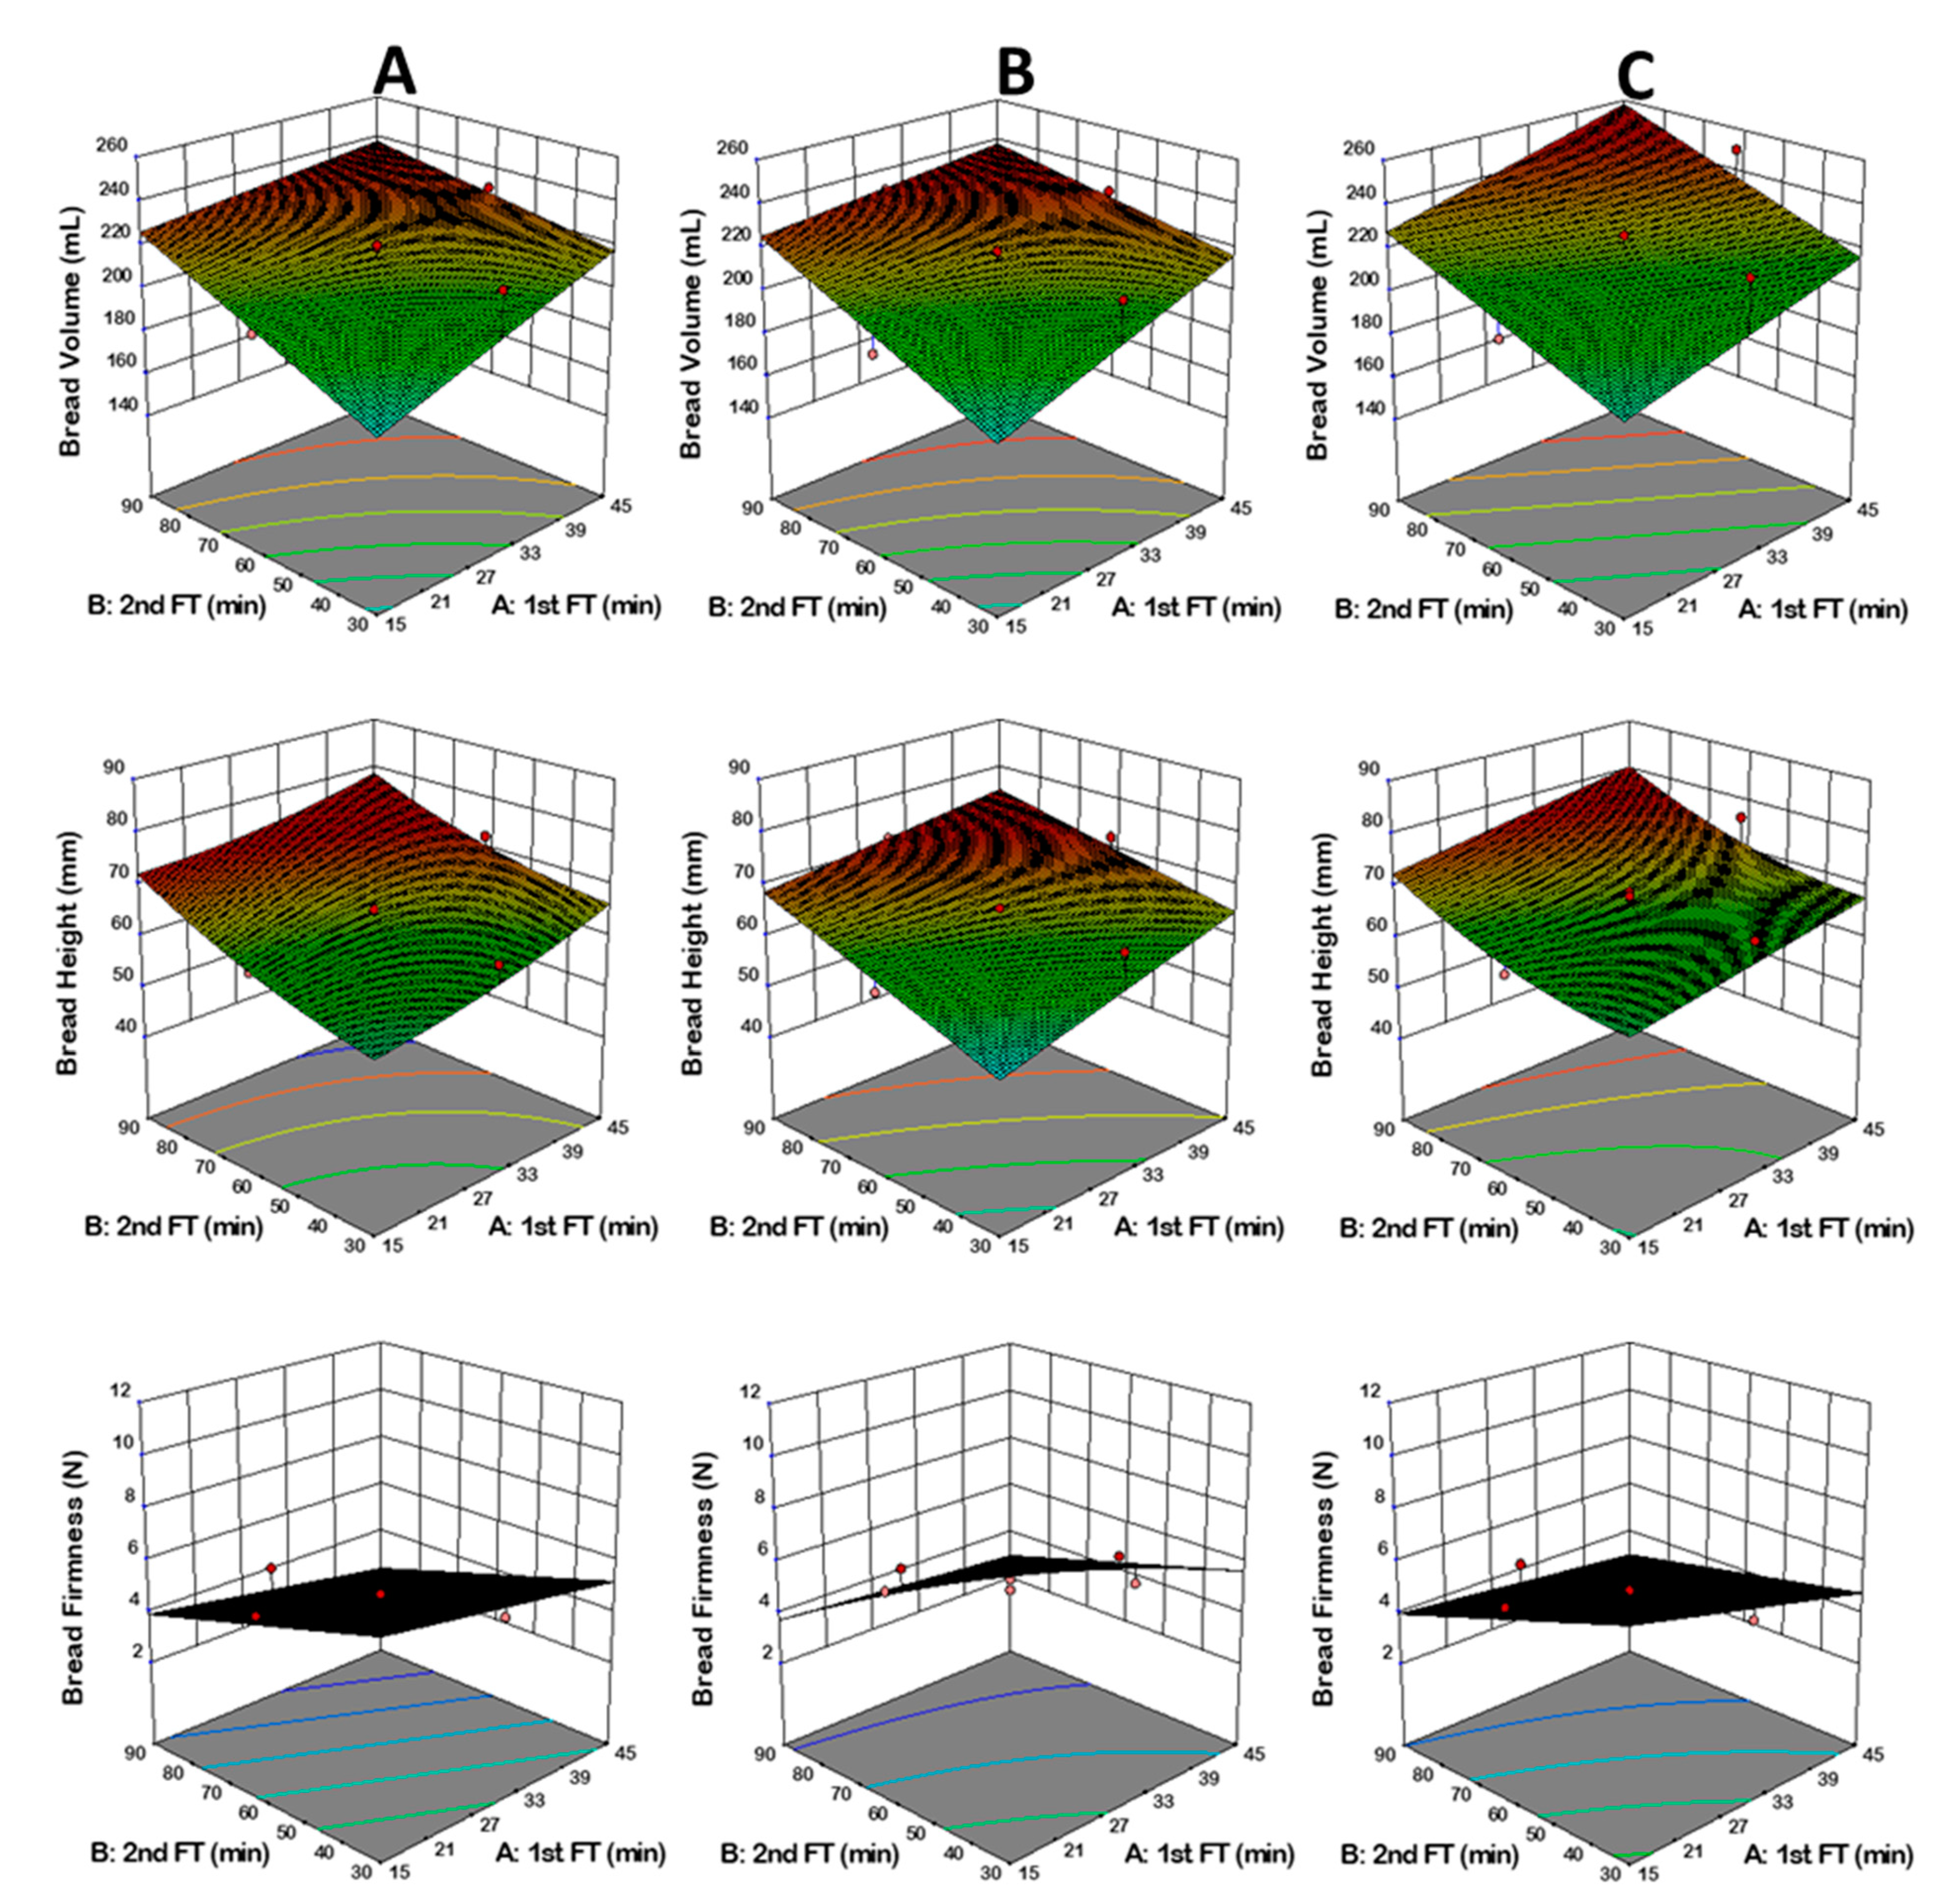
3.2. Volume of Bread

The volume of the bread made from the fresh, RTP, and RTB doughs ranged from 156.2–235.2 mL, 153.9–233.2 mL, and 156.3–249.9 mL, respectively. Although Hsu et al. [25] reported that dough frozen after fermentation produced inferior quality bread than that produced by dough frozen without fermentation, no significant difference in the range of the bread volume among the three doughs in the present study was observed because of different formulations and processing conditions. The largest volume of the bread made from the RTP and RTB doughs was obtained using the processing conditions of 45 min for the first fermentation, 90 min for the second fermentation, a −45 °C freezing temperature, and a 90 min freezing time and the processing conditions of a 45 min first fermentation, a 60 min second fermentation, a −35 °C freezing temperature, and a 60 min freezing time, respectively. In contrast, the smallest volume of the bread from the RTP and RTB doughs was obtained using the processing conditions of a 15 min first fermentation, a 30 min second fermentation, a −45 °C to −25 °C freezing temperature, and a 30 min freezing time. The results indicate that the first and second fermentation times are critical for bread volume. A short fermentation time is insufficient for yeast growth, resulting in less carbon dioxide gas released by the yeast and thus a low bread volume. Räsänen et al. [26] reported a dramatic effect of fermentation time on the freezing and thawing stability of pre-fermented lean wheat dough. A short pre-fermentation time (25 min) favored larger loaf volumes than a long pre-fermentation time (40 min) did. However, the results in the present study showed a different trend. The larger volume of the bread loaves after a longer pre-fermentation period could be due to the greater number of live yeast cells, which, in turn, could be related to the relatively higher sugar level (about 30% based on flour weight) of sweet bread. Öhgren et al. [27] observed that much more living yeast cells remained in sweet dough than in the rye dough and explained that the yeast had more food in the sweet dough and that the sugar could protect the yeast. Le-Bail et al. [3] also showed that a higher expansion ratio before freezing resulted in a more fragile dough with higher porosity, resulting in the lowest bread volume with the lowest freezing rate and the highest pre-fermentation time. Additionally, the pre-fermentation time influenced a much greater extent than the freezer temperature did. When the bread prepared from each dough was compared, the processing conditions of a 45 min first fermentation, a 90 min second fermentation, a −45 °C freezing temperature, and a 90 min freezing time for the RTP and RTB doughs resulted in similar bread volumes (233.2 and 244.1 mL, respectively) to that of the bread made with fresh dough (235.2 mL). The bread volume obtained under these processing conditions was also relatively higher than the other processing conditions, suggesting that a single potential set of processing conditions could be used to produce two types of frozen dough with good frozen stability.
Among the four factors, the first and second fermentation times showed significant effects on the bread volume (Table 2). It was observed that there was a positive correlation between the first and second fermentation times and the bread volume from all three dough types. Sufficient fermentation time could help yeast cells metabolize more fermentable sugars and produce carbon dioxide, which increases the volume of bread [27].

3.3. Height of Bread

The height of bread made from the fresh, RTP, and RTB doughs ranged from 46.5–72.3, 45.5–72.1, and 49.3–76.4 mm, respectively. The largest and smallest heights of the bread made from the RTP and RTB doughs were obtained under the same processing conditions as the bread volume results. When the heights of bread made of RTP and RTB dough were compared, the processing conditions of a 45 min first fermentation, a 90 min second fermentation, a −45 °C freezing temperature, and a 30 min freezing time produced similar height values (70.1 and 70.8 mm, respectively), compared to the height of the bread made from the fresh dough (70.1 mm), indicating the superior storage stability of these frozen doughs.
Among the four factors, the first and second fermentation times and freezing temperature significantly affected bread height. Similar to bread volume, positive correlations between the first fermentation time and height and between the second fermentation time and height were observed in the bread made of fresh and RTP and RTB frozen dough. Additionally, the height of the bread made from the RTB dough was positively affected by the freezing temperature, which indicated a greater loss of gas bubbles by a decreased temperature for freezing the dough. Lucas et al. [28] mentioned that gas bubble collapse in the pre-fermented frozen dough is related to delayed expansion during the second fermentation stage. Although fermentation of the dough before freezing had a negative effect on the frozen dough quality [29], the result in the present study was not significantly affected because of the differences in the formulation of sweet bread and freezing conditions.

3.4. Firmness of Bread Crumb

The firmness of bread made from the fresh, RTP, and RTB doughs ranged from 1.0–10.1, 4.1–10.6, and 4.1–13.8 N, respectively. Bread made from the fresh and RTP doughs produced softer crumb than that made from the RTB dough. Öhgren et al. [27] reported that bread made from dough that had pre-fermented before freezing had a higher tendency for fast staling than that made from the dough that was un-fermented before freezing based on the texture quality measured by Young’s modulus. They explained that pre-fermented dough might contain more large voids than un-fermented dough, resulting in large ice crystal formation in the voids. The results of the present study showed a similar trend. The firmest bread was obtained under the processing conditions of a 30 min first fermentation, a 30 min second fermentation, a −35 °C freezing temperature, and a 60 min freezing time for the bread made from the RTP dough and a 15 min first fermentation, a 30 min second fermentation, a −25 °C freezing temperature, and a 30 min freezing time for the bread made from the RTB dough.
Among the four factors, the first and second fermentation times showed significant effects on the firmness of the bread made from the RTP and RTB doughs; the firmness of bread was negatively correlated with the first and second fermentation times but positively correlated with freezing temperature. Kenny et al. [29] reported that the rest time (similar to the first fermentation time) did not affect the firmness of bread crumb, which was different from the results in the present study owing to the different bread formulations and lower resting temperatures used in the study.
Our previous study [22] showed that the formula for the quality of bread made from fresh, RTP, and RTB doughs exhibited equivalent quality attributes for fresh and RTP dough but different quality attributes for RTB dough. However, in the present study, processing conditions, such as first and second fermentation times, did not affect the frozen stability for the RTP and RTB doughs differently because the same formula with relatively high level of sugar and low level of water was used, although the freezing temperature additionally affected RTB dough quality. The results indicate that the greater variation in the bread quality of the RTP and RTB doughs occurred because of differences in the formula instead of differences in the processing conditions.

3.5. The Models Fitted for Quality Characteristics of Bread

Analysis of variance (ANOVA) showed that the quadratic or reduced quadratic models adequately represented the data obtained for bread volume, height, and firmness, which are the major and representative quality characteristics (Table 4).
For the volume of bread made from the fresh, RTP, and RTB doughs, the F-values were 27.89, 24.64, and 35.91, respectively, which indicated that all models showed significance at p < 0.0001, and the quadratic determination coefficients (R2) describing the goodness of fit of the models were 0.868, 0.916, and 0.867, respectively. For the height of bread made from the fresh, RTP, and RTB doughs, the F-values were 16.81, 45.58, and 37.76, respectively, which indicated that all of the models showed significance at p < 0.0001, and the quadratic determination coefficients (R2) were 0.952, 0.916, and 0.900, respectively. For the firmness of the bread made from the fresh, RTP, and RTB doughs, the F-values were 36.51, 60.00, and 33.91, respectively, which indicate that all of the models showed significance at p < 0.0001, and the quadratic determination coefficients (R2) describing the goodness of fit of the models were 0.869, 0.964, and 0.890, respectively.
The three-dimensional response surface plots for the effects of the first fermentation time (A) and second fermentation time (B) on the volume, height, and firmness of the bread made from the fresh and the RTP and RTB frozen doughs are shown in Figure 2. Regarding bread volume, in Figure 2, the plots for the fresh, RTP, and RTB doughs were similar. In particular, the plots for the fresh and the RTP doughs were almost identical, and the plot for the RTB dough was slightly different. The first and second fermentation times had the most significant effects, and the dough formula with long first and second fermentation times produced the largest bread volume for all three doughs.
The three-dimensional plots for the effects of the first fermentation time (A) and second fermentation time (B) on the height of bread made of fresh, RTP, and RTB dough in Figure 2 were slightly different from each other. However, the dough formula with long first and second fermentation times provided the largest bread height for all three doughs. For the height of the bread made from the RTB dough, the freezing temperature also had a significant influence. Bread firmness exhibited a similar trend to bread height (Figure 2), which was much closer for the fresh and RTB doughs than for the RTP dough. The most significant effect of the first and second fermentation times was observed in bread made from all three doughs, with an increase in the firmness with decreasing first and second fermentation times.
Based on desirability calculated by the multiple response method, the optimized processes for sweet bread were a 44.8 min first fermentation time, an 89.8 min second fermentation time, a −25.9 °C freezing temperature, and an 88.0 min freezing time for the RTP dough (desirability = 1.000) and a 45.0 min first fermentation time, a 90.0 min second fermentation time, a −25.0 °C freezing temperature, and a 90.0 min freezing time for the RTB dough (desirability = 0.971). The optimized processing conditions for the RTP and RTB doughs showed the requirement of a long first and second fermentation time. To determine the optimum combination of the tested factors, Kittisuban et al. [30] and Suwannarong et al. [31] used a graphical multiresponse optimization based on superimposed contour plots, which could also be an effective method. After optimizing a combined single set of processing conditions for the RTP and RTB doughs, a 45.0 min first fermentation time, a 90.0 min second fermentation time, a −25.0 °C freezing temperature, and a 90.0 min freezing time were selected with the desirability of 0.985.

4. Conclusions

Response surface methodology was applied to optimize the processing conditions for RTP and RTB frozen sweet bread dough. First and second fermentation times, freezing temperature, and freezing time were selected as the major processing conditions for frozen sweet bread dough. The quality of bread made from the RTP and RTB frozen dough was analyzed. Except for freezing time, all three factors in the processing conditions of the RTP and RTB doughs significantly affected bread quality. The frozen stability of the RTP dough was similar to that of the RTB dough. Based on the desirability, the optimized processing condition for sweet bread entailed a 42.6 min first fermentation time, an 85.4 min second fermentation time, a −38.4 °C freezing temperature, and a 58.1 min freezing time for the RTP dough (desirability = 1.000) and a 43.7 min first fermentation time, an 81.6 min second fermentation time, a −35.7 °C freezing temperature, and an 85.0 min freezing time for RTB dough (desirability = 1.000). The optimized processing conditions for the RTP and RTB doughs required long first and second fermentation times for the sufficient activation of yeast cells. A single optimized process showing the excellent frozen stability for RTP and RTB dough also exhibited a similar condition. In the future, the sensory evaluation on the eating quality for bread prepared from the RTP and RTB doughs with the optimized processing conditions will be valuable for confirming the excellent frozen stability of the doughs.

Author Contributions

Investigation, methodology, data collection, formal analysis, data interpretation, writing—original draft preparation, Y.Z.; conceptualization, investigation, data interpretation, writing—review and editing, supervision, project administration, funding acquisition, M.K. All authors have read and agreed to the published version of the manuscript.

Funding

This research was supported by the Korea Institute of Planning and Evaluation for Technology in Food, Agriculture, Forestry and Fisheries (IPET) through the Agri-food R&D Performance Follow-up Support Program (Project No. 818025-1) funded by the Ministry of Agriculture, Food and Rural Affairs, Korea.

Institutional Review Board Statement

Not applicable.

Informed Consent Statement

Not applicable.

Data Availability Statement

The data presented in this study are available on request from the corresponding author.

Conflicts of Interest

The authors declare no conflict of interest.

References

  1. Frauenlob, J.; Moriano, M.E.; Innerkofler, U.; D’Amico, S.; Lucisano, M.; Schoenlechner, R. Effect of physicochemical and empirical rheological wheat flour properties on quality parameters of bread made from pre-fermented frozen dough. J. Cereal Sci. 2017, 77, 58–65. [Google Scholar] [CrossRef]
  2. Ayati, S.V.; Hamdami, N.; Le-Bail, A. Frozen sangak dough and bread properties: Impact of pre-fermentation and freezing rate. Int. J. Food Prop. 2016, 20, 782–791. [Google Scholar] [CrossRef] [Green Version]
  3. Le-Bail, A.; Nicolitch, C.; Vuillod, C. Fermented frozen dough: Impact of pre-fermentation time and of freezing rate for a pre-fermented frozen dough on final volume of the bread. Food Bioprocess Technol. 2010, 3, 197–203. [Google Scholar] [CrossRef]
  4. Kenny, S.; Wehrle, K.; Dennehy, T.; Arendt, E.K. Correlations between empirical and fundamental rheology measurements and baking performance of frozen bread dough. Cereal Chem. 1999, 76, 421–425. [Google Scholar] [CrossRef]
  5. Hino, A.; Takano, H.; Tanaka, Y. New freeze-tolerant yeast for frozen dough preparations. Cereal Chem. 1987, 64, 269–275. [Google Scholar]
  6. Ribotta, P.D.; León, A.E.; Añón, M.C. Effects of freezing in frozen dough. Cereal Chem. 2003, 80, 454–458. [Google Scholar] [CrossRef]
  7. Gharaie, Z.; Azizi, M.H.; Barzegar, M.; Aghagholizade, R. Effects of hydrocolloids on the rheological characteristics of dough and the quality of bread made from frozen dough. J. Texture Stud. 2015, 46, 365–373. [Google Scholar] [CrossRef]
  8. Luo, W.; Sun, D.W.; Zhu, Z.; Wang, Q.J. Improving freeze tolerance of yeast and dough properties for enhancing frozen dough quality-A review of effective methods. Trends Food Sci. Technol. 2018, 72, 25–33. [Google Scholar] [CrossRef]
  9. Giannou, V.; Kessoglou, V.; Tzia, C. Quality and safety characteristics of bread made from frozen dough. Trends Food Sci. Technol. 2003, 14, 99–108. [Google Scholar] [CrossRef]
  10. Akbarian, M.; Dehkordi, M.S.M.; Ghasemkhani, N.; Koladoozi, M.; Niknam, O.; Morshedi, A. Hydrocolloids and cryoprotectant used in frozen dough and effect of freezing on yeast survival and dough structure: A Review. Int. J. Life Sci. 2015, 9, 1–7. [Google Scholar] [CrossRef] [Green Version]
  11. Sharadanant, R.; Khan, K. Effect of hydrophilic gums on frozen dough. I. Dough quality. Cereal Chem. 2003, 80, 764–772. [Google Scholar] [CrossRef]
  12. Sharadanant, R.; Khan, K. Effect of hydrophilic gums on frozen dough. II. Bread characteristics. Cereal Chem. 2003, 80, 773–780. [Google Scholar] [CrossRef]
  13. Lee, M.G.; Lee, J.M.; Chang, J.H.; Park, C.J. The effect of addition of potato starch on the frozen dough. Korean J. Food Nutr. 2000, 13, 403–410. [Google Scholar]
  14. Lee, J.H.; Choi, D.R.; Lee, S.K.; Lee, J.K. Effect of emulsifiers on properties of the breads made by dough frozen after first fermentation. J. Korean Soc. Appl. Biol. Chem. 2004, 47, 107–112. [Google Scholar]
  15. Choi, D.R.; Lee, J.H.; Yoon, Y.C.; Lee, S.K. Effect of vital wheat gluten on the quality characteristics of the dough frozen after 1st fermentation. Korean J. Food Sci. Technol. 2005, 37, 55–60. [Google Scholar]
  16. Park, B.J.; Shin, E.H.; Kim, S.H.; Park, C.S. Influence of emulsifiers and α-amylases on the quality of frozen dough. Korean J. Food Sci. Technol. 2006, 38, 59–67. [Google Scholar]
  17. Steffolani, M.E.; Ribotta, P.D.; Perez, G.T.; Puppo, M.C.; León, A.E. Use of enzymes to minimize dough freezing damage. Food Bioprocess Technol. 2012, 5, 2242–2255. [Google Scholar] [CrossRef]
  18. Omedi, J.O.; Huang, W.; Zhang, B.; Li, Z.; Zheng, J. Advances in present-day frozen dough technology and its improver and novel biotech ingredients development trends-A review. Cereal Chem. 2019, 96, 34–56. [Google Scholar] [CrossRef] [Green Version]
  19. Rouille, J.; Le Bail, A.; Courcoux, P. Influence of formulation and mixing conditions on breadmaking qualities of French frozen dough. J. Food Eng. 2000, 43, 197–203. [Google Scholar] [CrossRef]
  20. Ban, C.; Yoon, S.; Han, J.; Kim, S.O.; Han, J.S.; Lim, S.; Choi, Y.J. Effects of freezing rate and terminal freezing temperature on frozen croissant dough quality. LWT-Food Sci. Technol. 2016, 73, 219–225. [Google Scholar] [CrossRef]
  21. Hsu, K.H.; Hoseney, R.C.; Seib, P.A. Frozen dough. II. Effects of freezing and storing conditions on the stability of yeasted doughs. Cereal Chem. 1979, 56, 424–426. [Google Scholar]
  22. Zhao, Y.; Kweon, M. Formula optimization of ready-to-proof and ready-to-bake frozen dough of sweet bread using response surface methodology. LWT-Food Sci. Technol. 2021, 139, 110581. [Google Scholar] [CrossRef]
  23. AACC. Method 08-01.01, 10-05.01, 42-50.01, 44-15.02, 56-11.02, 74-09.01. In Approved Methods of Analysis, 11th ed.; AACC International: St. Paul, MN, USA, 2010. [Google Scholar]
  24. Jang, K.J.; Hong, Y.E.; Moon, Y.J.; Jeon, S.J.; Angalat, S.; Kweon, M. Exploring the applicability of tamarind gum for making gluten-free rice bread. Food Sci. Biotechnol. 2018, 27, 1639–1648. [Google Scholar] [CrossRef]
  25. Hsu, K.H.; Hoseney, R.C.; Seib, P.A. Frozen dough. I. Factors affecting stability of yeasted doughs. Cereal Chem. 1979, 56, 419–424. [Google Scholar]
  26. Räsänen, J.; Härkönen, H.; Autio, K. Freeze-thaw stability of prefermented frozen lean wheat doughs: Effect of flour quality and fermentation time. Cereal Chem. 1995, 72, 637–642. [Google Scholar]
  27. Öhgren, C.; Fabregat, N.; Langton, M. Quality of bread baked from frozen dough–effects of rye, and sugar content, kneading time and proofing profile. LWT-Food Sci. Technol. 2016, 68, 626–633. [Google Scholar] [CrossRef] [Green Version]
  28. Lucas, T.; Grenier, D.; Bornett, M.; Challois, S.; Quellec, S. Bubble growth and collapse in pre-fermented doughs during freezing, thawing and final proving. Food Res. Int. 2010, 43, 1041–1048. [Google Scholar] [CrossRef]
  29. Kenny, S.; Grau, H.; Arendt, E.K. Use of response surface methodology to investigate the effects of processing conditions on frozen dough quality and stability. Eur. Food Res. Technol. 2001, 213, 323–328. [Google Scholar] [CrossRef]
  30. Kittisuban, P.; Ritthiruangdej, P.; Suphantharika, M. Optimization of hydroxypropylmethylcellulose, yeast β-glucan, and whey protein levels based on physical properties of gluten-free rice bread using response surface methodology. LWT-Food Sci. Technol. 2014, 57, 738–748. [Google Scholar] [CrossRef]
  31. Suwannarong, S.; Wongsagonsup, R.; Luangpituksa, P.; Wongkongkatep, J.; Somboonpanyakul, P.; Suphantharika, M. Optimization of yeast β-glucan and additional water levels, and chilled storage time on characteristics of chilled bread using response surface methodology. J. Food Meas. Charact. 2019, 13, 1683–1694. [Google Scholar] [CrossRef]
Figure 1. A diagram for preparing fresh, RTP, and RTB doughs and baked bread.
Applsci 11 07904 g001
Figure 2. Response surface plots for the effects of the first and the second fermentation times on the volume, height, and firmness of bread made from fresh (A), RTP (B), and RTB (C) doughs.
Applsci 11 07904 g002
Table 1. Experimental design for processing conditions with four factors for preparing RTP and RTB frozen sweet bread dough.
Standard OrderRun OrderFirst Fermentation Time
(min)
Second Fermentation Time
(min)
Freezing Temperature
(°C)
Freezing Time
(min)
1111530−4530
2204530−4530
361590−4530
4274590−4530
5181530−2530
6214530−2530
771590−2530
8154590−2530
9101530−4590
10234530−4590
1131590−4590
12244590−4590
13261530−2590
1494530−2590
15131590−2590
16174590−2590
1721560−3560
18124560−3560
19143030−3560
2043090−3560
2153060−4560
22193060−2560
2313060−3530
24223060−3590
25253060−3560
2683060−3560
27163060−3560
Table 2. Minimum (Min), maximum (Max), and mean values measured quality characteristics of bread made with fresh dough and with the RTP and RTB frozen doughs.
ResponseFresh DoughRTP DoughRTB Dough
MinMaxMeanMinMaxMeanMinMaxMean
Weight (g)63.864.764.263.664.964.163.265.564.6
Moisture (%)30.633.531.831.035.332.631.135.933.1
Volume (mL)156.2235.2202.8153.9233.2200.7156.3249.9208.1
Height (mm)46.572.361.545.572.161.849.376.464.3
Firmness (N)1.010.15.24.110.66.54.113.87.9
Color L*36.943.241.038.144.241.137.649.242.9
Color a*15.918.517.814.417.616.315.518.317.1
Color b*19.624.621.817.225.021.519.128.824.5
Table 3. Significant factors and p-values for quality characteristics of bread made with the fresh dough and with the RTP and RTB dough by ANOVA (p < 0.05).
ResponseFresh DoughRtp DoughRtb Dough
Factorp-ValueFactorp-ValueFactorp-Value
Weightns (1)nsns
Moisturensnsns
VolumeA (2)<0.0001A<0.0001A<0.0001
B<0.0001B<0.0001B<0.0001
HeightA<0.0001A<0.0001A<0.0001
B<0.0001B<0.0001B<0.0001
C0.0181
FirmnessA<0.0001A<0.0001A<0.0001
B<0.0001B<0.0001B<0.0001
Color L*nsnsB0.0045
Color a*nsB0.0116A0.0010
C0.0018B0.0002
D0.0181
Color b*nsB0.0463A0.0015
C0.0059B<0.0001
(1) Not significant. (2) A, 1st fermentation time; B, 2nd fermentation time; C, freezing temperature; D, freezing time.
Table 4. Analysis of variance of the response surface quadratic or reduced quadratic models for volume, height, and firmness of bread made with each frozen dough.
ResponseDoughSourceDFSum of SquaresMean SquareF ValueR2AdjR2
Bread volumeFreshModel511,065.602213.1227.89 ***0.8680.838
Residual211666.3079.35
Total2612,731.90
RTPModel811,868.741483.5924.64 ***0.9160.879
Residual1512,858.01857.20
Total2992,832.24
RTBModel414,833.253708.3135.91 ***0.8670.843
Residual222272.04103.27
Total2617,105.29
Bread heightFreshModel141486.24106.1616.81 ***0.9520.895
Residual1275.806.32
Total291562.04
RTPModel51468.86293.7745.58 ***0.9160.896
Residual21135.346.44
Total261604.20
RTBModel51264.40252.8837.76 ***0.9000.876
Residual21793.0152.87
Total262889.05
Bread firmnessFreshModel463.7015.9336.51 ***0.8690.845
Residual229.600.44
Total2673.30
RTPModel8148.0018.5060.00 ***0.9640.948
Residual185.550.31
Total26153.55
RTBModel557.9111.5833.93 ***0.8900.864
Residual217.170.34
Total2665.08
*** indicated significance at p < 0.0001.
Publisher’s Note: MDPI stays neutral with regard to jurisdictional claims in published maps and institutional affiliations.

