Article

Analyses of the Compositions, Antioxidant Capacities, and Tyrosinase-Inhibitory Activities of Extracts from Two New Varieties of Chrysanthemum morifolium Ramat Using Four Solvents

1
College of Biotechnology and Bioresources, Da-Yeh University, Changhua 51591, Taiwan
2
Department of Cosmetics and Fashion Styling, Cheng Shiu University, Kaohsiung 83347, Taiwan
3
Division of Gastroenterology and Hepatology, Department of Internal Medicine, Chang Bing Show Chwan Memorial Hospital, Changhua 50544, Taiwan
4
Department of Food Science and Biotechnology, Da-Yeh University, Changhua 51591, Taiwan
5
Department of Food Science and Biotechnology, National Chung Hsing University, Taichung 40227, Taiwan
6
Department of Biomedical Sciences, Chung Shan Medical University, Taichung 40201, Taiwan
7
Department of Medical Research, Chung Shan Medical University Hospital, Taichung 40201, Taiwan
*
Authors to whom correspondence should be addressed.
Appl. Sci. 2021, 11(16), 7631; https://doi.org/10.3390/app11167631
Submission received: 8 July 2021 / Revised: 11 August 2021 / Accepted: 17 August 2021 / Published: 19 August 2021
(This article belongs to the Topic Compounds with Medicinal Value)

Abstract

:
Chrysanthemum morifolium Ramat is traditionally used as both medicine and food in China. In this study, extracts of C. morifolium Ramat Hang Ju No. 1 (No. 1) and No. 2 (No. 2) were produced using four different solvents: 95% ethanol, ethyl acetate, n-hexane and distilled water. In total, eight types of extracts were analyzed for extraction yields and total flavonoids, polyphenols, glycans, reducing sugars, and chlorogenic acids. The antioxidant capacities and tyrosinase-inhibitory activities of these extracts were also determined. Among them, the ethanolic extract of No. 1 (No. 1A) had the highest levels of total flavonoids (16.71 mg rutin equivalent/g dry weight (DW)), polyphenols (7.07 mg gallic acid equivalent/g DW), and chlorogenic acids (6595.46 μg/g DW) and the water extract of No. 1 (No. 1D) had the highest levels of total glycans (9.24 mg/g DW), and reducing sugars (23.32 μg/g DW). In terms of antioxidant capacity, No. 1A (1.0 mg/mL) demonstrated the best 1,1-diphenyl-2-picrylhydrazyl (DPPH) radical scavenging activity (96.2 ± 0.4%), ferrous ion chelating ability (55.44 ± 0.03%), and reducing power (0.988 ± 0.003). No. 1D (1.0 mg/mL) showed the highest tyrosinase inhibitory activity (39.34 ± 0.03%). From these results, high levels of total flavonoids and polyphenols correlate with antioxidant capacity. Moreover, high levels of total chlorogenic acid in No. 1A and No. 1D correlate with high levels of tyrosinase inhibitory activity. Therefore, No. 1A has the potential to be used in daily health drinks, foods and skin whitening products. These results can be applied to similar flower plant extracts.

1. Introduction

Free radicals are chemical intermediates with single or multiple unpaired electrons and are active either as an atom, molecule, or ion. Oxygen-containing radicals are substances produced by the metabolism of oxygen in the human body and contain reactive oxygen species (ROS), singlet oxygen (1O2), hydrogen peroxide (H2O2), superoxide anion (O2), and hydroxyl radical (OH·) [1]. Free radicals may directly cause DNA damage, mutation, and resulting cancers, as well as phosphate peroxidation of cell membranes, thus altering the fluid properties of cell membranes, damaging cellular integrity, or accelerating cell aging [2,3]. Moreover, they can continuously damage cells and tissues in the body, or lead to decreased energy and organ failure, causing diseases such as vascular sclerosis, heart disease, gout, type 2 diabetes, arthritis, cataracts, and diseases of the immune system [2,4]. Normally, levels of free radicals in the human body are in a balanced state. When the human body is invaded by bacteria, fungi, or viruses, the body’s defense system prompts phagocytes to fight. Consequently, the phagocytes produce superoxide anion and hydrogen peroxide through the catalysis of related enzymes to remove bacteria or infected cells. Therefore, the human body has a certain number of free radicals as a weapon against diseases [3,4]. However, when polyunsaturated fatty acids in the body are attacked by free radicals, oxidation occurs and more free radicals form [1,3]. Studies have found that stress, radiation, trauma, disease, infection, or inflammation can result in accumulation of large amounts of free radicals after activation of the body’s defense system, which may attack healthy cells, trigger apoptosis, or cause cellular aging [2,3,4,5,6].
Phenolic compounds in plants are natural antioxidants. These natural antioxidants found in vegetables, fruits, and daily beverages (e.g., tea and wine) are quite effective in scavenging free radicals [7,8,9,10,11,12,13,14,15,16]. Phenolic acids are a class of compounds formed by the substitution of hydrogen atoms on benzene rings by a carboxylic acid group and at least one hydroxyl [17]. Polyphenols are phenolics with more than one hydroxyl group in their structures, while flavonoids are a phenolic subclass composed of a common diphenylpropane structure and varying degrees of hydroxylation for oxidation and substitution, which are usually present in plants in the form of glycosides [18]. A high intake of vegetables and fruits in the diet, in which plant polyphenols composed of flavonoids act as antioxidants for the body, has been shown to have preventive effects on cancer, diabetes, and cardiovascular diseases [5,7,9,15,18]. Plant polyphenols have multiple functions, not only as antioxidants, but also as reducing agents, and, in some cases, as metal chelators [17,18], which may reduce the risk of death from heart-related diseases in elderly men. They dilate blood vessels and have anti-cancer, anti-inflammatory, antibacterial, immune stimulating, and anti-viral effects [7,15,17,19,20].
Over the years, there has been more interest in the bioactivity and biocompatibility of plant extracts with increasing popularity of cosmetic products that contain natural plant extracts. Many natural plant extracts have attracted attention for their antioxidant or whitening effects. Several studies have shown that antioxidant activities are associated with skin-whitening and skin-energizing effects [21,22,23,24,25].
Chrysanthemum morifolium Ramat is a perennial herb of the family Asteraceae that is native to China. The whole plant can be used as medicine. According to the shape and size of the dried flower heads and the length of the petals, they are classified into four types: Hang Ju, Gong Ju, Chu Ju, and Bai Ju. Traditionally, only the flowers are used in folk medicine for promoting diuresis, relieving fever, and improving vision [26,27,28,29]. Chrysanthemums have been brewed to make tea for thousands of years. In 1961, Chinese Huang Ju was planted in Miaoli County, Taiwan. After three years of research into the characteristics, affinity, and diversity of Hang Ju, as well as its flower quality after dehydration and flower color, the Taiwan Agricultural Improvement Farm analyzed and identified the domesticated “white flower” and “yellow flower” in Taiwan in 2015 and officially named them C. morifolium Ramat var. Taiwan Hang Ju No. 1 (No. 1) and C. morifolium Ramat var. Taiwan Hang Ju No. 2 (No. 2), respectively. No. 1 has white ray florets and yellow disk florets during the development stage. After harvest and dehydration, the flowers are slightly brown. No. 2 has yellow disk and ray florets in the development stage. The flowers become golden yellow after harvesting and drying.
The main purposes of this paper are to compare the extracts from two cultivars of chrysanthemums grown in Taiwan using similar culture conditions and to analyze the compositions of the extracts obtained using different solvents, in addition to their antioxidant capacity and tyrosinase inhibitory activity. The results of this study provide references for developing antioxidant-based healthy foods and skin whitening products using Taiwan Hang Ju and can be applied to similar plant extracts.

2. Materials and Methods

2.1. Materials

The experimental materials were grown in the Tongluo Town by the Tongluo Township Farmers Association (www.tlfa.org.tw (accessed on 15 January 2019)), Miaoli County, Taiwan. They consisted of C. morifolium Ramat var. Taiwan Hang Ju No. 1 (No. 1) and C. morifolium Ramat var. Taiwan Hang Ju No. 2 (No. 2).

2.2. Chemicals

Ethanol (95%), methanol, n-hexane, phenol, sulfuric acid, hydrochloric acid, trichloroacetic acid (TCA), 3,5-dinitrosalicylic acid (DNS), potassium sodium tartrate, Folin-Ciocalteu phenol reagent, 1,1-diphenyl-2-picrylhydrazyl (DPPH), disodium hydrogen phosphate dodecahydrate, sodium dihydrogen phosphate dihydrate, disodium hydrogen phosphate, potassium dihydrogen phosphate, potassium ferricyanide, sodium chloride, potassium chloride, iron trichloride, iron dichloride, aluminum chloride hexahydrate, sodium carbonate solution, ferrozine, quercetin, butylated hydroxyanisole (BHA), ascorbic acid, gallic acid (GA), rutin, arbutin, L-tyrosine, and tyrosinase were purchased from A-Star Chemical Co., Ltd. (Kaohsiung, Taiwan).

2.3. Sample Extraction

The flower heads of No. 1 and No. 2 harvested in November to December were oven-dried at 45 °C for 48 h, crushed with a pulverizer and passed through a 35-mesh sieve, respectively. No. 1 and No. 2 powders were placed in dark glass vials with dry weights (DWs) of 600 g. They were then soaked and extracted in 10 times the volume of ethanol, ethyl acetate, or n-hexane for 12 h. The ethanol extracts of No. 1 and No. 2 were lyophilized by freeze drying and denoted No. 1A and No. 2A. The ethyl acetate extracts were denoted No. 1B and No. 2B and the n-hexane extracts were denoted No. 1C and No. 2C. No. 1 and No. 2 powders (100 g) were soaked in 1000 mL of distilled water and heated to 100 °C for 5 h. After cooling, distilled water extracts were filtered, dried in Safety Vacuum Drying Oven VD23 (Binder GmbH, Tuttlingen, Germany) at 40 °C, and lyophilized. The distilled water extracts were denoted No. 1D and No. 2D. Finally, eight different Hang Ju extracts were obtained.

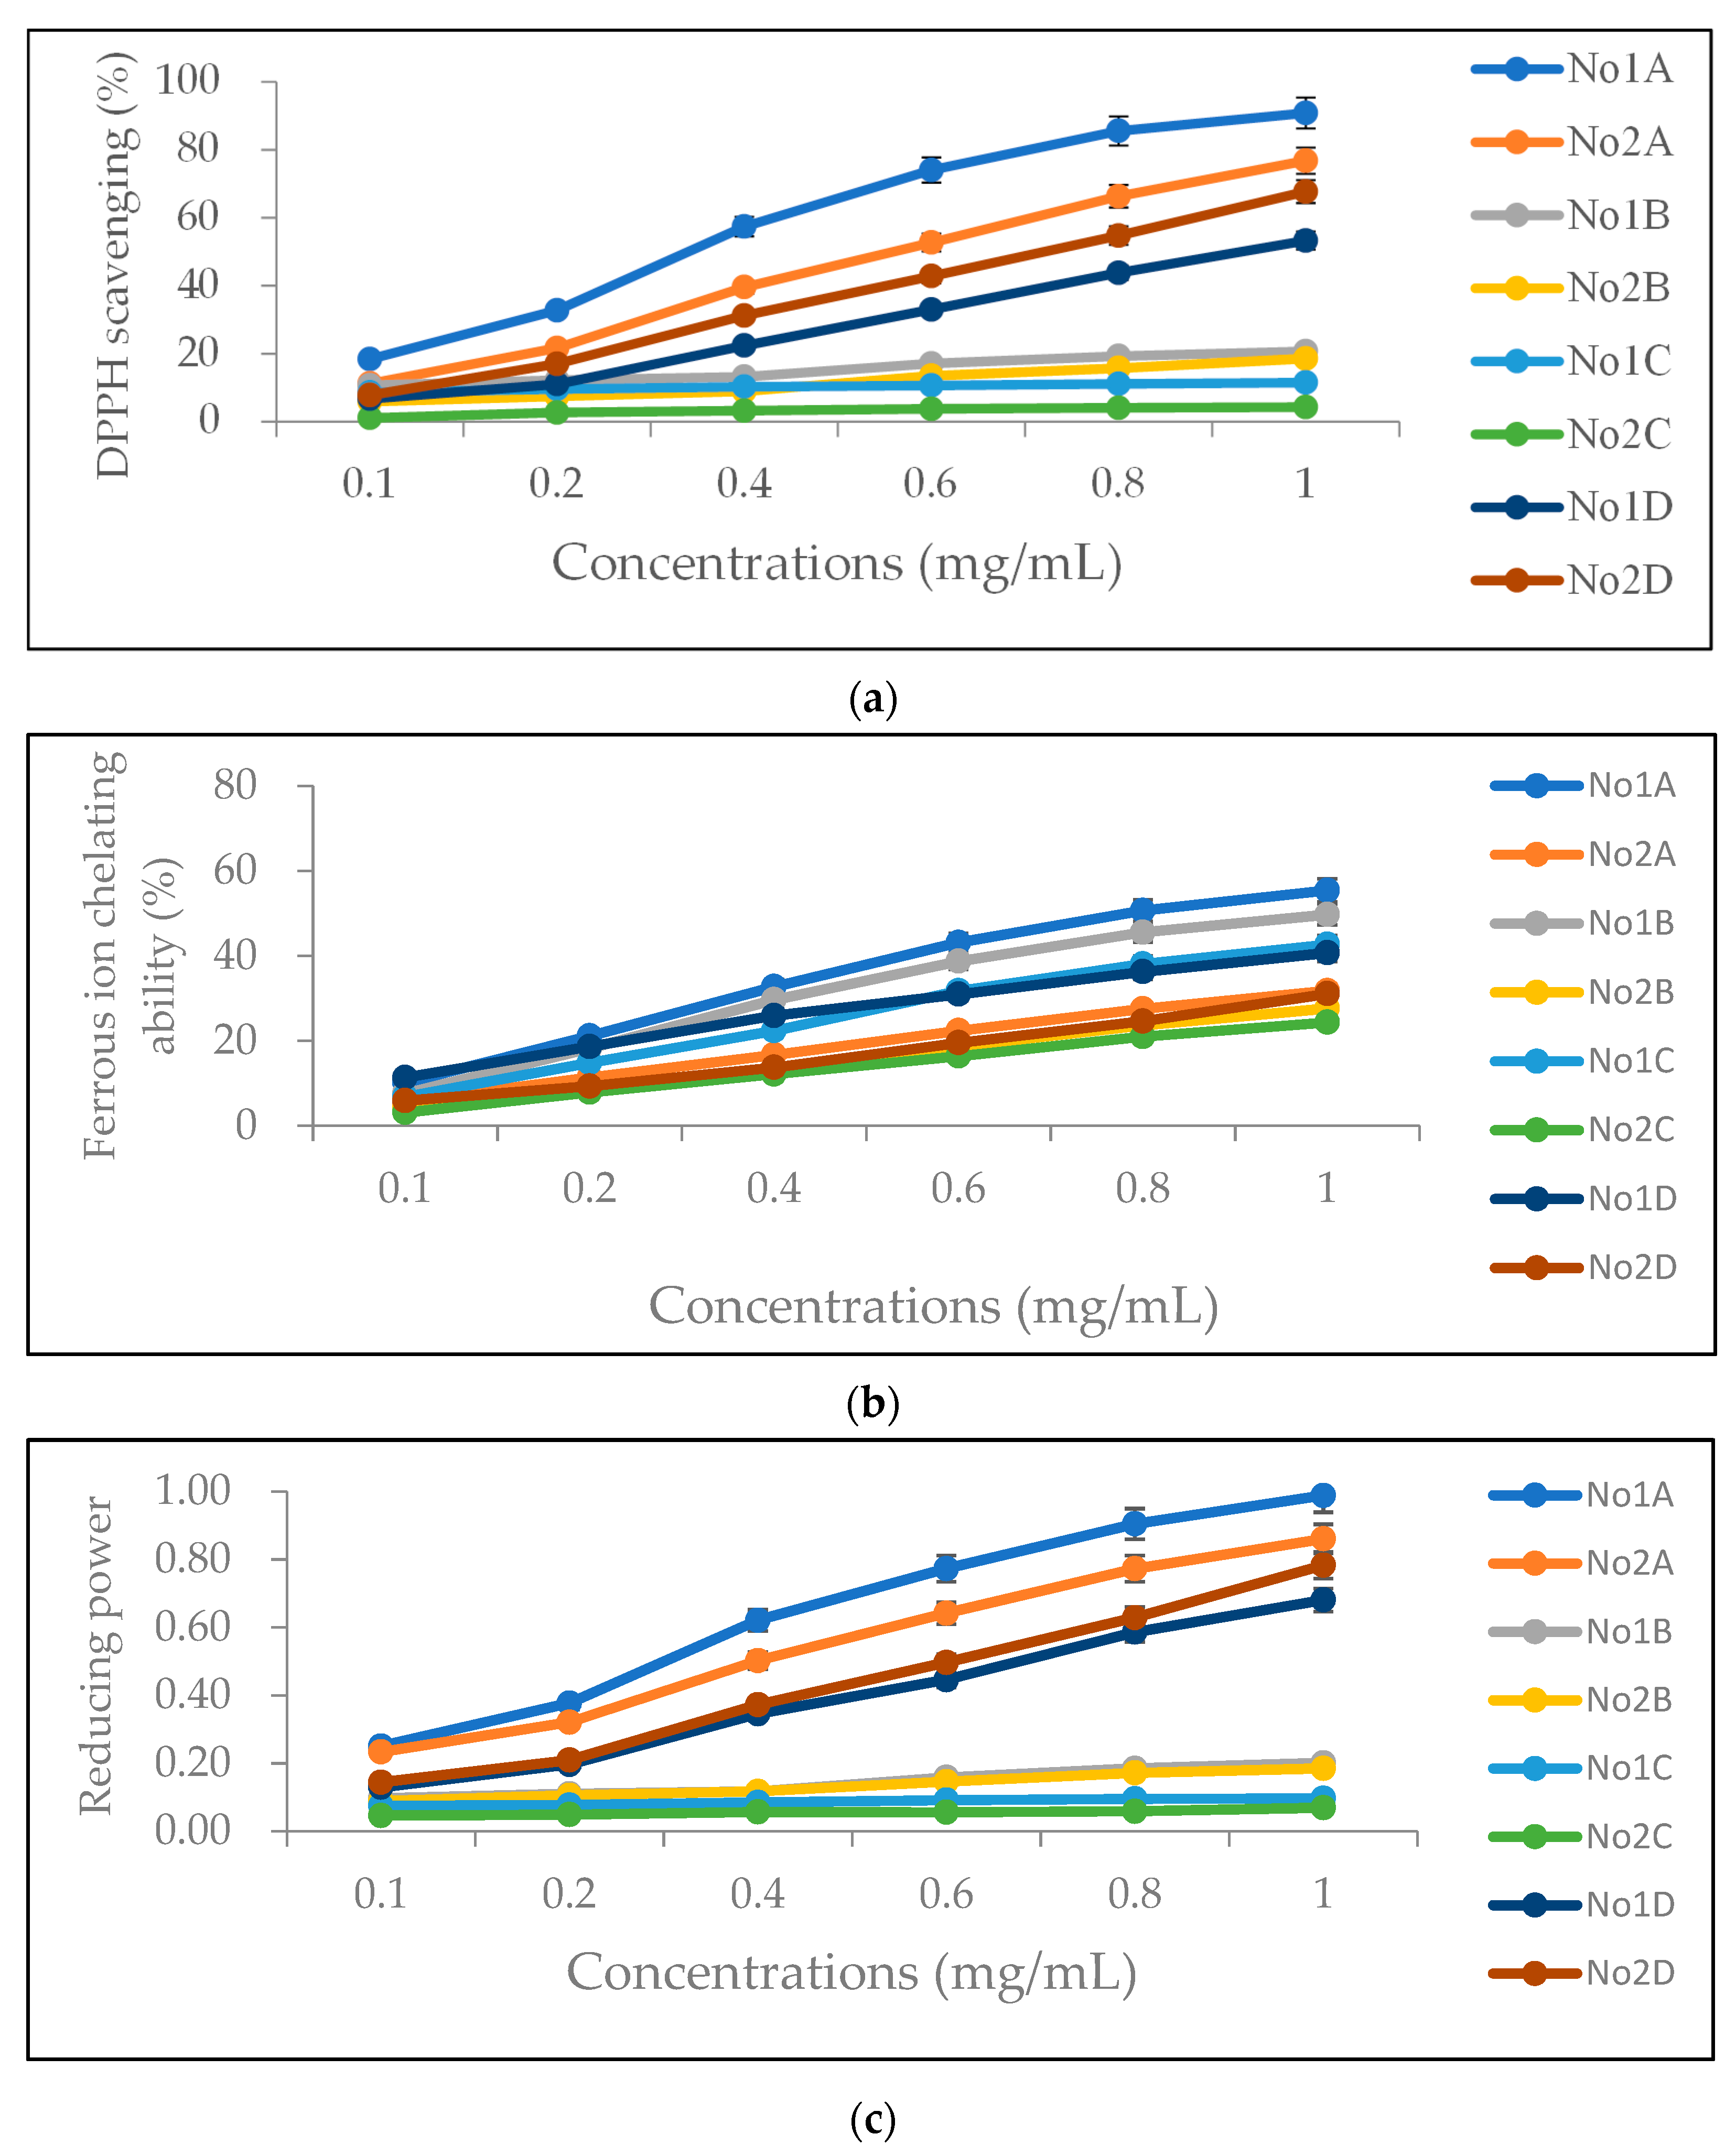
2.4. DPPH Radical Scavenging Activity

The DPPH radical scavenging rate was used to determine the antioxidant capacity of the Hang Ju extracts by referring to the assay of Turkoglu et al. [30]. The eight types of extracts were prepared at concentrations of 0.1, 0.2, 0.4, 0.6, 0.8, and 1.0 mg/mL. Visible spectrophotometer PRO739 (Chuanhua Precision Crop., New Taipei City, Taiwan) and wavelength of 517 nm were used, and the DPPH radical scavenging rates were calculated using quercetin as the standard.

2.5. Ferrous Ion Chelating Capacity Assay

The ferrous ion chelating capacity assay was adapted from Decker and Welch’s assay [31]. The eight types of extracts were prepared at concentrations of 0.1, 0.2, 0.4, 0.6, 0.8, and 1.0 mg/mL. To 1 mL samples of each of these concentrations were added 4 mL of distilled water and 0.1 mL of 2 mM FeC12. After mixing, the solutions were allowed to stand for 30 s. Then, 0.2 mL of 5 mM ferrozine were added and allowed to react at room temperature in a dark environment for 10 min. The absorbance value at 562 nm was measured on a spectrophotometer (PRO739). The results of the control group with EDTA and vitamin C as standards were used to calculate the chelating ability of ferrous ions of different samples.

2.6. Reducing Power Measurement

Reducing power was determined by referring to the experimental method of Canabady-Rochelle et al. [32]. Eight extracts were prepared at concentrations of 0.1, 0.2, 0.4, 0.6, 0.8, and 1.0 mg/mL. The absorbance value at 700 nm was measured on a spectrophotometer (PRO739), and the results of the control group with ascorbic acid and BHA as standards were used to calculate the reducing power of the samples.

2.7. Determination of Total Phenol Content

Total phenol content was determined according to the method of Turkmen et al. [33]. First, GA standard curves were prepared by plotting 0, 0.2, 0.4, 0.6, 0.8, and 1.0 mL of GA standard solution (0.1 mg/mL) against the absorbance value at 730 nm wavelength by a spectrophotometer (PRO739). The eight extracts were reacted according to the standard concentration. Relative GA concentrations were obtained from the absorbance value against the standard curve with conversion to the total phenol content of the extracts. The total phenol content is expressed as mg GA equivalent/g DW (mg GA/g).

2.8. Determination of Total Flavonoid Content

The total flavonoid content was determined by the method of Guo et al. [34]. Rutin standard curves were prepared by plotting 0, 0.1, 0.2, 0.3, 0.4, and 0.5 mL of rutin standard solution (1 mg/mL) against the absorbance value at 430 nm by a spectrophotometer (PRO739). The eight extracts were reacted according to the standard concentration. The absorbance values were plotted against the standard curve to obtain the relative rutin concentrations, followed by conversion to the total flavonoid content of the extracts. The total flavonoid content is expressed as mg rutin equivalent/g DW (mg rutin/g).

2.9. Determination of Total Sugars

Total sugar was determined as described by Chow and Landhäusser [35]. The glucose standard curves were obtained by plotting 0, 0.2, 0.4, 0.6, 0.8, and 1.0 mL of glucose standard solution (0.1 mg/mL) against the absorbance value at 490 nm by a spectrophotometer (PRO739). The absorbance values of the eight extracts were plotted against the glucose standard curve to calculate the total glucose content of the samples.

2.10. Determination of Reducing Sugars

Determination of reducing sugars was based on the method of Lindsay [36]. A glucose standard curve was prepared and 0, 0.2, 0.4, 0.6, 0.8, and 1.0 mL of glucose standard solution (0.1 mg/mL) were added to DNS colorant. The standard curve was obtained by plotting the concentration of glucose against the absorbance value at 540 nm by a spectrophotometer (PRO739). No. 1D and No. 2D extracts were reacted at standard concentration and the absorbance values were plotted against the glucose standard curve to calculate the reducing sugar content of No. 1D and No. 2D.

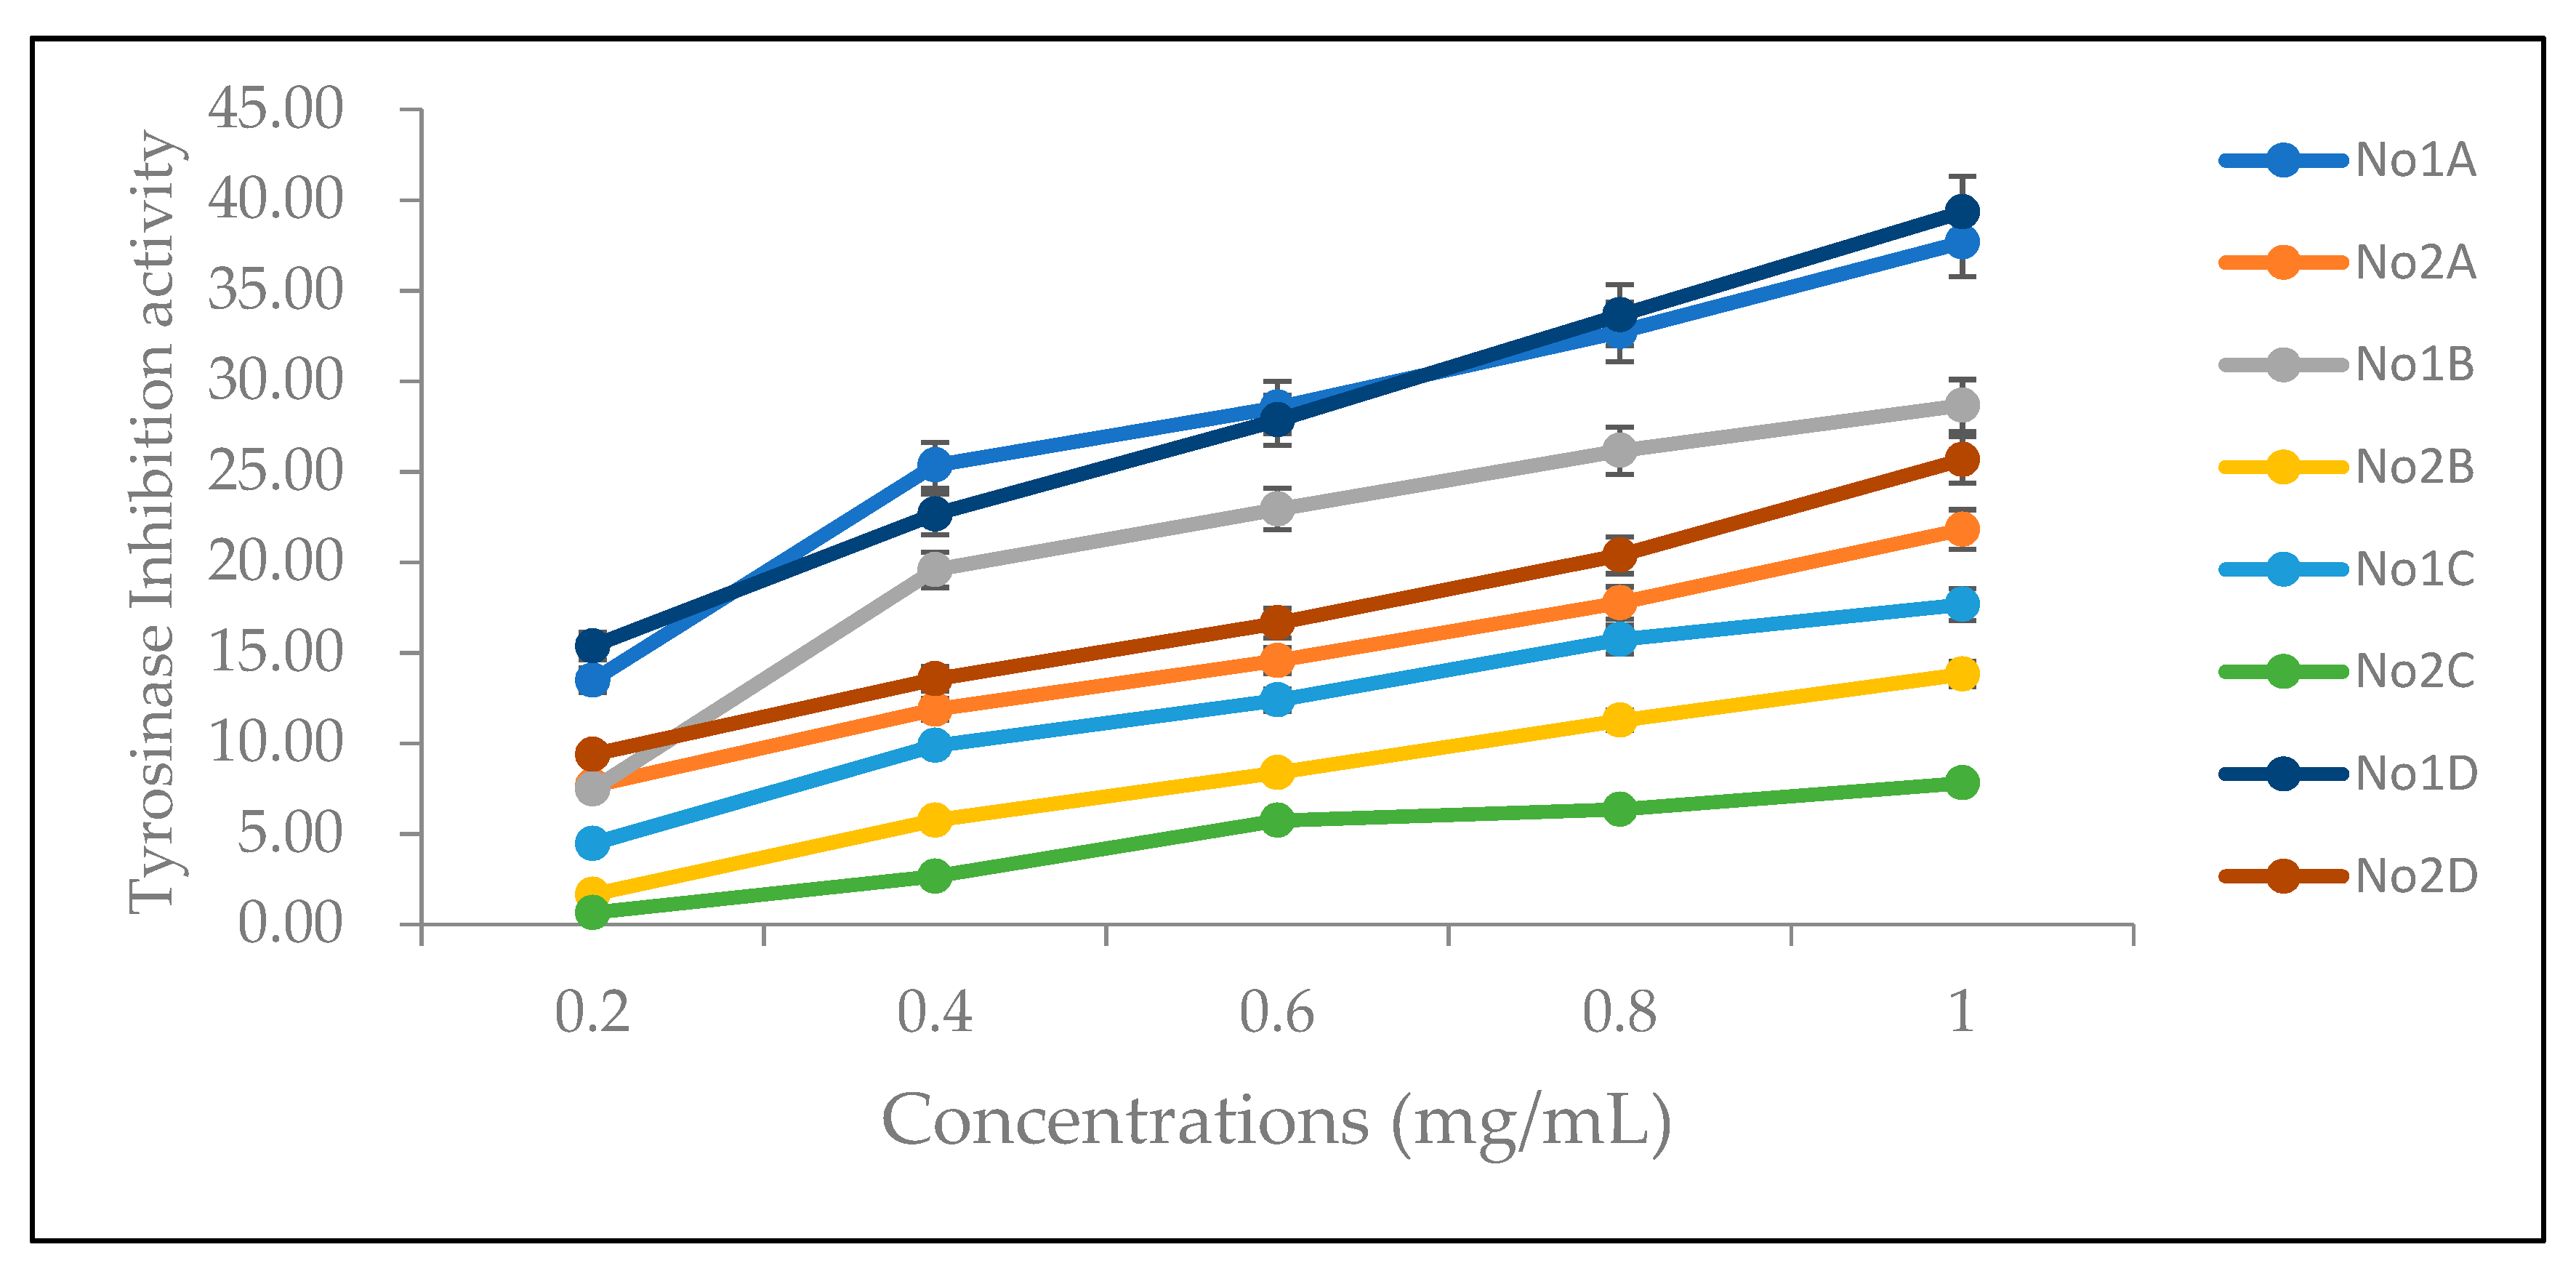
2.11. Tyrosinase Inhibitory Assay

The assay for tyrosinase inhibitory activity was based on the method of Baurin et al. [37]. Arbutin was used as the control and the eight extracts were prepared at 0, 0.1, 0.2, 0.4, 0.6, 0.8, and 1.0 mg/mL concentrations. The absorbance values were measured at 450 nm wavelength by a spectrophotometer (PRO739) and the tyrosinase inhibitory ratio was calculated by subtracting the 450 nm background absorbance values of each product.

2.12. Chlorogenic Acid Content Assay

The chlorogenic acid assay method was based on the method of the Taiwan Food and Drug Administration (TFDAA0047.00). When results were below the limit of quantitation (LOQ), they were denoted as not detected (ND).

2.13. Statistical Analysis

DPPH radical scavenging activity, ferrous ion chelating ability, reducing power, and tyrosinase inhibitory activity assays were performed in triplicate. The results are expressed as mean ± standard deviation (SD). Data analysis was carried out with the Statistical Package for Social Science version 20.0. One-way ANOVA Tukey test was used with p < 0.05 representing a significant difference and Pearson correlation coefficients (r) were calculated.

3. Results

3.1. Extraction Yields and Content Analyses

No. 1 and No. 2 powders were extracted with four different solvents each (ethanol, ethyl acetate, n-hexane, and distilled water) to obtain eight types of extracts. The extraction yields and main components of each type of extract are presented in Table 1. The highest extraction yield was obtained with ethanol, followed by ethyl acetate, n-hexane, and distilled water. Among the extracts of the two varieties of Hang Ju, the extraction yield of No. 2 was higher than that of No. 1 with ethanol. The extraction yields using the other three solvents were similar for the two varieties of Hang Ju. The extraction yields for both No. 1 and No. 2 were the highest with ethanol and the lowest with distilled water.
The highest total phenol content was obtained with ethanol (Table 1). Similar results for total phenol content were obtained with ethyl acetate, followed by distilled water. The lowest total phenol content was obtained with n-hexane. The total phenol content of ethanol and ethyl acetate extracts of No. 1 was higher than that of ethanol and ethyl acetate extracts of No. 2. Moreover, the total phenol content of the pure-water extract of No. 2 was higher than that of the pure-water extract of No. 1. Among all the extracts, the total phenol content was highest in No. 1A and lowest in No. 1C and No. 2C. Furthermore, the total flavonoid content (Table 1) was highest in ethanol extracts, followed by ethyl acetate, distilled water, and n-hexane extracts. Regardless of which solvent was used, the total flavonoid content of the extracts was higher in No. 1 than in No. 2. The ethanol and ethyl acetate extracts of No. 1 had the highest total flavonoid content, while the n-hexane extract of No. 2 had the lowest total flavonoid content.
Total and reducing sugars (Table 1) were higher in the pure-water extract of No. 1 than in the pure-water extract of No. 2. Total chlorogenic acid contents were similar for the ethanol and pure-water extracts (Table 1). Meanwhile, the total chlorogenic acid content of the ethyl acetate extract was relatively low and that of the n-hexane extract was undetectable. The total chlorogenic acid content of the ethanol extract of No. 1 was higher than that of the ethanol extract of No. 2. However, the total chlorogenic acid contents of the pure-water and ethyl acetate extracts of No. 2 were higher than those of the pure-water and ethyl acetate extracts of No. 1. The highest total chlorogenic acid contents were found in the ethanol extract of No. 1 and the pure-water extract of No. 2. The lowest total chlorogenic acid content was found in the n-hexane extracts of both varieties.

3.2. Antioxidant Capacity

The antioxidant capacities of the four solvent extracts of the two types of Hang Ju were evaluated and compared using three methods, namely DPPH free radical scavenging activity (Figure 1a), ferrous ion chelating ability (Figure 1b), and reducing power (Figure 1c), at different concentrations (0.1–1.0 mg/mL). At 1.0 mg/mL, the highest DPPH radical scavenging activity was obtained with ethanol, followed by distilled water, ethyl acetate, and n-hexane (p < 0.05 for all solvents) (Table 2). DPPH radical scavenging activity of No. 1 was significantly higher than that of No. 2 for all solvents except distilled water (p < 0.05 for ethyl acetate; p < 0.001 for both ethanol and n-hexane). DPPH radical scavenging activity of No. 2 extracted with distilled water was significantly higher than that of No. 1 extracted with distilled water (p < 0.001).
At 1.0 mg/mL, for No. 1, the ferrous ion chelating ability was highest when ethanol was used as the solvent, followed by ethyl acetate, n-hexane, and distilled water (p < 0.05 for all solvents) (Table 2). For No. 2, the ferrous ion chelating ability was also highest when ethanol was used as the solvent, followed by distilled water, ethyl acetate, and n-hexane (p < 0.05). Regardless of which of the four solvents was used, the ferrous ion chelating ability of the extracts obtained from No. 1 was significantly higher than that of the extracts obtained from No. 2 (all p < 0.001) (Table 2). Furthermore, at 1.0 mg/mL, the highest reducing power was obtained with ethanol as the solvent, followed by distilled water, ethyl acetate, and n-hexane (p < 0.05 for all solvents) (Table 2). The reducing power of No. 1 was significantly higher than that of No. 2 extracted with the same solvent (p < 0.01 for ethyl acetate; p < 0.001 for both ethanol and n-hexane). However, the reducing power of No. 2 extracted with distilled water was significantly higher than that of No. 1 extracted with distilled water (p < 0.001).
Combining the DPPH radical scavenging activity, ferrous ion chelating ability, and reducing power results, we found that the antioxidant capacity of ethanol extract (No. 1A) is the highest among all extracts, while the antioxidant capacity of n-hexane extract (No. 2C) is the lowest. Antioxidant capacities are positively correlated with both total phenol and total flavonoid contents, as shown in Table 3. The Pearson correlation coefficients for total phenol content are the highest for DPPH scavenging activity (r = 0.8444), followed by reducing power (r = 0.8097) and ferrous ion chelating ability (r = 0.4158). The correlation coefficients for total flavonoid content are the highest for ferrous ion chelating ability (r = 0.8845), followed by DPPH scavenging activity (r = 0.5465) and reducing power (r = 0.5100).

3.3. Whitening Ability

The whitening abilities of the four solvent extracts of the two types of Hang Ju were evaluated and compared based on the tyrosinase inhibitory activities (Figure 2) of 0.1–1.0 mg/mL extracts. The highest tyrosinase inhibitory activity was obtained with distilled water as the solvent, followed by ethanol and ethyl acetate. The lowest tyrosinase inhibitory activity was obtained with n-hexane (p < 0.05 for all solvents) (Table 4). The tyrosinase inhibitory activities of all four extracts of No.1 were significantly higher than those of No. 2 (p < 0.001 for all solvents). Among all extracts, the highest tyrosinase inhibitory activity was observed in No. 1D, followed by No. 1A. The lowest tyrosinase inhibitory activity was observed in No. 2C.
The extracts obtained with ethanol or distilled water demonstrated the highest total chlorogenic acid content (Table 1). Meanwhile, the total chlorogenic acid content of the ethyl acetate extracts was relatively low. The total chlorogenic acid content of the n-hexane extracts was the lowest or undetectable. The extracts obtained with distilled water as the solvent had the highest tyrosinase inhibitory activity, followed by ethanol, ethyl acetate, and n-hexane (Table 4). These results reveal a positive correlation (Table 5) (r = 0.6502), i.e., higher total chlorogenic acid content is associated with higher tyrosinase inhibitory activity. In order to investigate the reasons for the differences in tyrosinase inhibitory activities, we analyzed the contents of four common types of chlorogenic acids (Table 6).
No. 1A had the highest total chlorogenic acid content, most of which was chlorogenic acid, with a small proportion of neochlorogenic acid and no detectable cryptochlorogenic acid or isochlorogenic acid. No. 2D had the second highest total chlorogenic acid content, most of which was chlorogenic acid and neochlorogenic acid, with less cryptochlorogenic acid and isochlorogenic acid. No. 1D had the third highest total chlorogenic acid content, most of which was chlorogenic acid and neochlorogenic acid. Cryptochlorogenic acid accounted for a small amount of the total chlorogenic content and isochlorogenic acid was undetectable. No. 2A had the fourth highest total chlorogenic acid content, most of which was chlorogenic acid, with less cryptochlorogenic acid, neochlorogenic acid, and isochlorogenic acid. No. 2B had the fifth highest total chlorogenic acid content, most of which was chlorogenic acid, with less neochlorogenic acid and cryptochlorogenic acid. Isochlorogenic acid was undetectable. No. 1B had the sixth highest total chlorogenic acid content and only chlorogenic acid was detectable.
Tyrosinase inhibitory activity was investigated in relation to total and individual chlorogenic acid contents. No. 1A and No. 1D showed the highest tyrosinase inhibitory activities at different concentrations (Figure 2). No. 1A had the highest total chlorogenic acid and chlorogenic acid contents and the third highest neochlorogenic acid content. No. 1D had the third highest total chlorogenic acid and chlorogenic acid contents, as well as the second highest neochlorogenic acid content and the third highest cryptochlorogenic acid content. At low concentration (0.2 mg/mL), the tyrosinase inhibitory activity of No. 1B was lower than that of No. 2D and similar to that of No. 2A (Figure 2). However, at higher concentrations (0.4–1.0 mg/mL), tyrosinase inhibitory activities were significantly higher than those of both No. 2D and No. 2A. The results of total and individual chlorogenic acid contents showed that the total chlorogenic acid content of No. 1B (53.38 μg/g, sixth highest) is much lower than that of No. 2D (6445.59 μg/g, second highest) and No. 2A (3059.37 μg/g, fourth highest). The total chlorogenic acid content of No. 1B (53.38 μg/g, sixth highest) was much lower than that of No. 2D (6445.59 μg/g, second highest) and No. 2A (3059.37 μg/g, fourth highest). For No. 1B, only chlorogenic acid was detected, while for both No. 2D and No. 2A four different chlorogenic acids were detected. No. 1C, No. 2B, and No. 2C were ranked among the bottom three on the basis of tyrosinase inhibitory activities. Their total chlorogenic acid contents were undetectable, 106.69 μg/g (fifth highest), and undetectable, respectively. From the above results, there are strong positive correlations for the tyrosinase inhibitory activity of each extract and total chlorogenic acids (r = 0.6502), the chlorogenic acid (r = 0.6623), and the neochlorogenic acid (r = 0.6427) but weak positive correlation for the cryptochlorogenic acid (r = 0.1492) and negative correlation for the isochlorogenic acid (r = −0.0086) (Table 5). The tyrosinase inhibitory activity did not depend entirely on the total chlorogenic acid content, chlorogenic acid content, or neochlorogenic acid content. For example, No. 1B had the third highest tyrosinase-inhibitory activity, but its total chlorogenic acid content was much lower than that of No. 2D and No. 2A, which had lower levels of tyrosinase-inhibitory activity. It was also lower than that of No. 2B, which had less than half of the tyrosinase-inhibitory activity at the same concentration. This indicated that No. 1B contains strong tyrosinase-inhibitory substance(s) that are not chlorogenic acids. Other components like adenosines, triterpenoids, or proteins should be analyzed in the future.

4. Discussion

The most important components of Hang Ju are phenolic compounds, which have been found to have strong antioxidant capacity [26,27,28,29]. This means that they can act as reducing agents and metal chelators, which have been found to have preventive effects on chronic diseases such as hypertension, hyperlipidemia, heart disease, and type 2 diabetes [2,4]. The chemical composition of chrysanthemums varies depending on the growing environment, the variety and the extracted solvent. Previous studies have shown that the antioxidant capacity of chrysanthemums comes from phenols, flavonoids, and carbohydrates [27,28,29]. Cai et al. [15] demonstrated that the flavonoid content of Hang Ju is higher than that of 112 Chinese herbal medicines that have antioxidant and anti-cancer effects. Their results showed that the total flavonoid content of methanol extract is 4.76 g/100 g DW. In this study, we used ethanol to extract two varieties of Hang Ju and the total flavonoid contents were 1.671 g/100 g DW for No. 1A and 0.980 g/100 g DW for No. 2A. The total flavonoids in the pure-water extracts studied by Cai et al. [15] were 3.16 g/100 g DW, while the total flavonoids in this study were 1.084 g/100 g DW for No. 1D and 0.840 g/100 g DW for No. 2D. The flavonoid content of Hang Ju extracted by methanol is higher than that of Hang Ju extracted by distilled water. This is consistent with our result that the content of flavonoids in Hang Ju extracted by ethanol is higher than that extracted by distilled water. Gong et al. [27] analyzed the total flavonoid content of 15 species of chrysanthemum in China using methanol extracts. Their results showed that the total flavonoid content ranged from 0.51 to 0.63 g/100 g DW, which was lower than that of both the pure-water extracts (1.084 g/100 g DW for No. 1D and 0.840 g/100 g DW for No. 2D) and the ethanol extracts (1.671 g/100 g DW for No. 1A and 0.980 g/100 g DW for No. 2A) in this study. Furthermore, comparing the phenolic contents of 63 chrysanthemums reported by Lin and Harnly [28], the total phenolic contents of No. 1A (7.07 mg GA/g DW) and No. 2A (6.34 mg GA/g DW) in this study were greater. This implies that even if chrysanthemums are cultivated in Asia, the chemical components of their extracts may differ.
Since ethanol extracts both water-soluble and water-insoluble ingredients, the extraction yields of both C. morifolium Ramat var. Taiwan Hang Ju No. 1 and No. 2 obtained using ethanol were the highest, followed by ethyl acetate, n-hexane, and distilled water (Table 7). The total flavonoid contents of No. 1 obtained with each of the four solvents were higher than those of No. 2 obtained with the same solvents. The total phenolic contents of No. 1A and No. 1B were also higher than those of No. 2A and No. 2B. The total flavonoid and phenolic contents of the extracts of No. 1 were higher than those of the extracts of No. 2. Although the extraction yield of No. 2 with ethanol (17.70%) was much higher than that of No. 1 extracted with the same solvent (7.30%), the contents of total phenols, total flavonoids, and total chlorogenic acid of No. 1A were all higher than those of No. 2A and No. 1A had higher antioxidant capacity and tyrosinase inhibitory activity than No. 2A. This indicates positive correlation for antioxidant capacity and total phenol and total flavonoid contents, as well as for total chlorogenic acid content and tyrosinase inhibitory activity. No. 2A (17.70%) showed the highest extraction yield among all extracts. The extraction yields of No. 1D and No. 2D were similar, but the contents of total phenols, total flavonoids, and total chlorogenic acid differed. Moreover, total glycans and reducing sugars were higher in No. 1D than in No. 2D. Although the antioxidant capacity and total phenolic and total flavonoid contents of No. 1D and No. 2D were lower than those of No. 1A and No. 2A, respectively, they had good antioxidant effects as daily health drinks (Table 2 and Table 7). Liu et al. [10] extracted eight chrysanthemum samples with distilled water at different temperatures (90 and 40 °C) and found that the antioxidant capacity is higher at higher temperature, similar to the extraction process using distilled water in this study. No. 1D had higher tyrosinase-inhibitory activity than No. 2D but the total chlorogenic acid content of No. 2D was higher than that of No. 1D, showing a negative correlation between these distilled water extracts. The tyrosinase inhibitory activities of Hang Ju extracts obtained using distilled water were higher than those of Hang Ju extracts obtained using ethanol, ethyl acetate, or n-hexane, indicating that the pure-water extracts of Hang Ju, especially those of No. 1, are suitable for development as whitening ingredients (Table 7).
Chlorogenic acid has excellent antioxidant capacity [38,39]. Although chlorogenic acid does not have a significant direct inhibitory effect, its metabolites can inhibit melanogenesis in B16 melanoma cells by inhibiting tyrosinase activity. Oh et al. [38] showed that ethanol extract has the best tyrosinase inhibitory activity, similar to the results of this study. The extracts with the best tyrosinase inhibitory activity in this study were No. 1D and No. 1A (Table 7). These are consistent with the results of Choi et al. [40], who found that methanol extract and pure-water extract are most effective in terms of tyrosinase inhibiting activity. In terms of chlorogenic acid content, the two Hang Ju samples differed, indicating that the chlorogenic acid content of Hang Ju extracts may be only partially responsible for the effective inhibition of tyrosinase. Regardless of the solvent, the tyrosinase inhibitory activity of No. 1 was significantly higher than that of No. 2. As such, Taiwan Hang Ju No. 1 has the potential for use in skin whitening products in the future. The methods of extraction, composition analysis, antioxidant assay, tyrosinase inhibitory assay, and correlation assay of composition and bioactivities can be applied to similar plants with flowers.

5. Conclusions

From a comparison of two different varieties of Hang Ju grown in Miaoli, Taiwan, the extraction yield using four different solvents was the highest with ethanol, and the antioxidant capacity of Taiwan Hang Ju No. 1 was higher than that of Taiwan Hang Ju No. 2, probably due to the higher total phenol and flavonoid contents. In terms of antioxidant capacity, ethanol extraction was best, followed by pure-water extraction. Taiwan Hang Ju No. 1 also had higher tyrosinase-inhibitory activity when compared with Taiwan Hang Ju No. 2, and chlorogenic acid content may only be partly responsible for this. In terms of tyrosinase-inhibitory activity, pure-water extraction is best, followed by ethanol extraction. Therefore, the ethanol (10 g/40 mL 95% ethanol) or pure-water (10 g/200 mL hot water) extracts of Taiwan Hang Ju No. 1 show potential as functional ingredients in daily health drinks or food and skin whitening products but results of in vivo studies are needed to confirm this potential. In the future, we may conduct more in-depth studies on the correlation between Hang Ju extracts, the phenolics present in the extracts, and their effects on whitening-related genes, as well as the anti-fatigue, vision improving, and neuroprotective effects of Hang Ju in Chinese medicine.

Author Contributions

Conceptualization, Y.H.C. and M.S.T.; data curation, S.L.Y. and Y.H.C.; formal analysis, Y.H.C.; investigation, Y.H.C. and S.H.W.; methodology, J.Y.W. and C.W.H.; resources, Y.H.C. and S.H.W.; supervision, C.W.H. and M.S.T.; validation, J.Y.W. and M.S.T.; visualization, S.H.W.; writing—original draft, S.L.Y. and Y.H.C.; writing—review and editing, S.H.W. and M.S.T. All authors have read and agreed to the published version of the manuscript.

Funding

This work was supported by the Ministry of Science and Technology of Taiwan (MOST 109-2320-B-040-005 and MOST 110-2221-E-212-002) and through a research project of Show Chwan Health Care System (BRD-109008). The funders had no role in the study design, data collection and analysis, decision to publish, or the preparation of the manuscript.

Institutional Review Board Statement

Not applicable.

Informed Consent Statement

Not applicable.

Data Availability Statement

The data presented in this study is available on request from the first and corresponding authors.

Acknowledgments

The authors would like to thank Uni-edit (www.uni-edit.net (accessed on 3 May 2021, C2518002DYU)) and Cheryl Robbins for translation, editing and proofreading this manuscript.

Conflicts of Interest

The authors declare no conflict of interest.

References

  1. Bayr, H. Reactive oxygen species. Crit. Care Med. 2005, 33, S498–S501. [Google Scholar] [CrossRef] [PubMed]
  2. Ames, B.N.; Shigenaga, M.K.; Hagen, T.M. Oxidants, antioxidants, and the degenerative diseases of aging. Proc. Natl. Acad. Sci. USA 1993, 90, 7915–7922. [Google Scholar] [CrossRef] [Green Version]
  3. Liou, G.Y.; Storz, P. Reactive oxygen species in cancer. Free Radic. Res. 2010, 44, 479–496. [Google Scholar] [CrossRef] [PubMed] [Green Version]
  4. Halliwell, B. Free radicals, antioxidants, and human disease: Curiosity, cause, or consequence? Lancet 1994, 344, 721–724. [Google Scholar] [CrossRef]
  5. Ohigashi, H.; Osawa, T.; Terao, J.; Watanabe, S.; Yoshikawa, T. Food Factors for Cancer Prevention, 1st ed.; Springer: Tokyo, Japan, 1997; pp. 3–668. [Google Scholar]
  6. Poulsen, H.E.; Prieme, H.; Loft, S. Role of oxidative DNA damage in cancer initiation and promotion. Eur. J. Cancer Prev. 1998, 7, 9–16. [Google Scholar]
  7. Hertog, M.G.; Feskens, E.J.; Hollman, P.C.; Katan, M.B.; Kromhout, D. Dietary antioxidant flavonoids and risk of coronary heart disease: The Zutphen Elderly Study. Lancet 1993, 342, 1007–1011. [Google Scholar] [CrossRef]
  8. Hinneburg, I.; Dorman, H.J.D.; Hiltunen, R. Antioxidant activities of extracts from selected culinary herbs and spices. Food Chem. 2006, 97, 122–129. [Google Scholar] [CrossRef]
  9. Lin, H.H.; Charles, A.L.; Hsieh, C.W.; Lee, Y.C.; Ciou, J.Y. Antioxidant effects of 14 Chinese traditional medicinal herbs against human low-density lipoprotein oxidation. J. Tradit. Complement. Med. 2015, 5, 51–55. [Google Scholar] [CrossRef] [PubMed] [Green Version]
  10. Liu, Q.; Liu, H.; Yuan, Z.L.; Wei, D.W.; Ye, Y.Z. Evaluation of antioxidant activity of chrysanthemum extracts and tea beverages by gold nanoparticles-based assay. Colloids Surf. B 2012, 92, 348–352. [Google Scholar] [CrossRef]
  11. Ozen, T.; Cöllü, Z.; Korkmaz, H. Antioxidant properties of Urtica pilulifera root, seed, flower, and leaf extract. J. Med. Food 2010, 13, 1224–1231. [Google Scholar] [CrossRef]
  12. Ravipati, A.S.; Zhang, L.; Koyyalamudi, S.R.; Jeong, S.C.; Reddy, N.; Bartlett, J.; Smith, P.T.; Shanmugam, K.; Münch, G.; Wu, M.J.; et al. Antioxidant and anti-inflammatory activities of selected Chinese medicinal plants and their relation with antioxidant content. BMC Complement. Altern. Med. 2012, 12, 173. [Google Scholar] [CrossRef] [Green Version]
  13. Wang, F.; Miao, M.; Xia, H.; Yang, L.G.; Wang, S.K.; Sun, G.J. Antioxidant activities of aqueous extracts from 12 Chinese edible flowers in vitro and in vivo. Food Nutr. Res. 2016, 61, 1265324. [Google Scholar] [CrossRef] [Green Version]
  14. Wong, S.P.; Leong, L.P.; Koh, J.H.W. Antioxidant activities of aqueous extracts of selected plants. Food Chem. 2006, 99, 775–783. [Google Scholar] [CrossRef]
  15. Cai, Y.; Luo, Q.; Sun, M.; Corke, H. Antioxidant activity and phenolic compounds of 112 traditional Chinese medicinal plants associated with anticancer. Life Sci. 2004, 74, 2157–2184. [Google Scholar] [CrossRef] [PubMed]
  16. Chen, G.L.; Chen, S.G.; Xiao, Y.; Fu, N.L. Antioxidant capacities and total phenolic contents of 30 flowers. Ind. Crops Prod. 2018, 111, 430–445. [Google Scholar] [CrossRef]
  17. Rice-Evans, C.A.; Miller, N.J.; Paganga, G. Structure-antioxidant activity relationships of flavonoids and phenolic acids. Free Radic. Biol. Med. 1996, 20, 933–956. [Google Scholar] [CrossRef]
  18. Pietta, P.G. Flavonoids as antioxidants. J. Nat. Prod. 2000, 63, 1035–1042. [Google Scholar] [CrossRef] [PubMed]
  19. Akihisa, T.; Yasukawa, K.; Oinuma, H.; Kasahara, Y.; Yamanouchi, S.; Takido, M.; Kumaki, K.; Tamura, T. Triterpene alcohols from the flowers of compositae and their anti-inflammatory effects. Phytochemistry 1996, 43, 1255–1260. [Google Scholar] [CrossRef]
  20. Shahidi, F.; Ambigaipalan, P. Phenolics and polyphenolics in foods, beverages and spices: Antioxidant activity and health effects—A review. J. Funct. Foods 2015, 18, 820–897. [Google Scholar]
  21. Shanura Fernando, I.P.; Asanka Sanjeewa, K.K.; Samarakoon, K.W.; Kim, H.S.; Gunasekara, U.K.D.S.S.; Park, Y.J.; Abeytunga, D.T.U.; Lee, W.W.; Jeon, Y.J.; Lim, P.E.; et al. The potential of fucoidans from Chnoospora minima and Sargassum polycystum in cosmetics: Antioxidant, anti-inflammatory, skin-whitening, and antiwrinkle activities. J. Appl. Phycol. 2018, 30, 3223–3232. [Google Scholar] [CrossRef]
  22. Sarikurkcu, C.; Sahinler, S.S.; Ceylan, O.; Tepe, B. Onosma pulchra: Phytochemical composition, antioxidant, skin-whitening and anti-diabetic activity. Ind. Crops Prod. 2020, 154, 112632. [Google Scholar] [CrossRef]
  23. Seo, E.J.; Hong, E.S.; Choi, M.H.; Kim, K.S.; Lee, S.J. Antioxidant and skin whitening effects of Rhamnus yoshinoi extracts. Korean J. Food Sci. Technol. 2010, 42, 750–754. [Google Scholar]
  24. Jdey, A.; Falleh, H.; Ben Jannet, S.; Mkadmini Hammi, K.; Dauvergne, X.; Ksouri, R.; Magné, C. Phytochemical investigation and antioxidant, antibacterial and anti-tyrosinase performances of six medicinal halophytes. S. Afr. J. Bot. 2017, 112, 508–514. [Google Scholar] [CrossRef]
  25. Jdey, A.; Falleh, H.; Ben Jannet, S.; Mkadmini Hammi, K.; Dauvergne, X.; Magné, C.; Ksouri, R. Anti-aging activities of extracts from Tunisian medicinal halophytes and their aromatic constituents. EXCLI J. 2017, 16, 755–769. [Google Scholar]
  26. Duh, P.D.; Tu, Y.Y.; Yen, G.C. Antioxidant activity of water extract of Harng Jyur (Chrysanthemum morifolium Ramat). LWT-Food Sci. Technol. 1999, 32, 269–277. [Google Scholar] [CrossRef]
  27. Gong, J.; Chu, B.; Gong, L.; Fang, Z.; Zhang, X.; Qiu, S.; Wang, J.; Xiang, Y.; Xiao, G.; Yuan, H.; et al. Comparison of phenolic compounds and the antioxidant activities of fifteen Chrysanthemum morifolium Ramat cv. ‘Hangbaiju’ in China. Antioxidants 2019, 8, 325. [Google Scholar] [CrossRef] [Green Version]
  28. Lin, L.Z.; Harnly, J.M. Identification of the phenolic components of chrysanthemum flower (Chrysanthemum morifolium Ramat). Food Chem. 2010, 120, 319–326. [Google Scholar] [CrossRef]
  29. Ma, D.; Wako, Y. Evaluation of phenolic compounds and neurotrophic/neuroprotective activity of cultivar extracts derived from Chrysanthemum morifolium flowers. Food Sci. Technol. Res. 2017, 23, 457–467. [Google Scholar] [CrossRef]
  30. Turkoglu, A.; Duru, M.E.; Mercan, N.; Kivrak, I.; Gezer, K. Antioxidant and antimicrobial activities of Laetiporus sulphureus (Bull.) Murrill. Food Chem. 2007, 101, 267–273. [Google Scholar] [CrossRef]
  31. Decker, E.A.; Welch, B. Role of ferritin as a lipid oxidation catalyst in muscle food. J. Agric. Food Chem. 1990, 38, 674–677. [Google Scholar] [CrossRef]
  32. Canabady-Rochelle, L.L.; Harscoat-Schiavo, C.; Kessler, V.; Aymes, A.; Fournier, F.; Girardet, J.M. Determination of reducing power and metal chelating ability of antioxidant peptides: Revisited methods. Food Chem. 2015, 183, 129–135. [Google Scholar] [CrossRef]
  33. Turkmen, N.; Sari, F.; Velioglu, Y.S. The effect of cooking methods on total phenolics and antioxidant activity of selected green vegetables. Food Chem. 2005, 93, 713–718. [Google Scholar] [CrossRef]
  34. Guo, Y.J.; Fan, L.; Wang, X.Q.; Zhang, L.Z. Discussion about NaNO2-Al(NO3)3-NaOH colorimetry for determination of total flavonoids. J. Pharm. Anal. 2002, 22, 97–98. [Google Scholar]
  35. Chow, P.S.; Landhäusser, S.M. A method for routine measurements of total sugar and starch content in woody plant tissues. Tree Physiol. 2004, 24, 1129–1136. [Google Scholar] [CrossRef] [PubMed]
  36. Lindsay, H. A colorimetric estimation of reducing sugars in potatoes with 3, 5-dinitrosalicylic acid. Potato Res. 1973, 16, 176–179. [Google Scholar] [CrossRef]
  37. Baurin, N.; Arnoult, E.; Scior, T.; Do, Q.T.; Bernard, P. Preliminary screening of some tropical plants for anti-tyrosinase activity. J. Ethnopharmacol. 2002, 82, 155–158. [Google Scholar] [CrossRef]
  38. Oh, H.N.; Park, D.H.; Park, J.Y.; Song, S.Y.; Lee, S.H.; Yoon, G.; Moon, H.S.; Oh, D.S.; Rhee, S.H.; Im, E.O.; et al. Tyrosinase inhibition antioxidant effect and cytotoxicity studies of the extracts of Cudrania tricuspidata fruit standardized in chlorogenic acid. Molecules 2019, 24, 3266. [Google Scholar] [CrossRef] [PubMed] [Green Version]
  39. Li, H.R.; Habasi, M.; Xie, L.Z.; Aisa, H.A. Effect of chlorogenic acid on melanogenesis of B16 melanoma cells. Molecules 2014, 19, 12940–12948. [Google Scholar] [CrossRef] [PubMed] [Green Version]
  40. Choi, K.T.; Kim, J.H.; Cho, H.T.; Lim, S.S.; Kwak, S.S.; Kim, Y.J. Dermatologic evaluation of cosmetic formulations containing Chrysanthemum indicum extract. J. Cosmet. Dermatol. 2016, 15, 162–168. [Google Scholar] [CrossRef]
Figure 1. DPPH radical scavenging activity (a), ferrous ion chelating ability (b), and reducing power (c) of the extracts obtained with different solvents from No. 1 and No. 2. No. 1A and No. 2A are ethanol extracts, No. 1B and No. 2B are ethyl acetate extracts, No. 1C and No. 2C are n-hexane extracts, and No. 1D and No. 2D are pure-water extracts.
Applsci 11 07631 g001
Figure 2. Tyrosinase inhibitory activities of No. 1 and No. 2 extracted with different solvents. No. 1A and No. 2A are ethanol extracts, No. 1B and No. 2B are ethyl acetate extracts, No. 1C and No. 2C are n-hexane extracts, and No. 1D and No. 2D are pure-water extracts.
Applsci 11 07631 g002
Table 1. Extraction yields (%) and main components of the four solvent extracts of the two varieties of Hang Ju.
Extract NumberExtraction Yield (%)Total Phenolic Content 1Total Flavonoid Content 2Total Sugar 3Reducing Sugar 4Total Chlorogenic Acid 4
No. 1A7.307.0716.71556595.46
No. 2A17.706.349.80553059.37
No. 1B5.004.2816.225553.38
No. 2B4.303.535.9655105.69
No. 1C3.100.266.9455ND 6
No. 2C3.100.263.0355ND 6
No. 1D2.203.2810.849.2423.325348.69
No. 2D2.003.928.406.5418.216445.59
1 Total phenolic content is expressed as mg GA equivalent/g dry weight, mg GA/g DW. 2 Total flavonoid content is expressed as mg rutin equivalent/g dry weight, mg rutin/g DW. 3 Total carbohydrate content is expressed as mg/g DW. 4 The unit of reducing sugars and total chlorogenic acid is μg/g DW. 5 “–” means no test was performed. 6 ND means the detection result is below LOQ, i.e., not detected. No. 1: C. morifolium Ramat var. Taiwan Hang Ju No. 1; No. 2: C. morifolium Ramat var. Taiwan Hang Ju No. 2; A: ethanol extracts; B: ethyl acetate extracts; C: hexane extracts; D: pure-water extracts.
Table 2. Comparisons of the antioxidant capacities of the four solvent extracts of the two varieties of Hang Ju.
Sample NumberEthanol (A)Ethyl Acetate (B)N-Hexane (C)Distilled Water (D)
DPPH scavenging activity (%)No. 190.84 ± 0.85 a20.68 ± 0.73 c11.49 ± 0.61 d53.28 ± 0.73 b
No. 276.80 ± 0.61 a***18.57 ± 0.61 c*4.29 ± 0.35 d***67.72 ± 0.85 b***
Ferrous ion chelating ability (%)No. 155.44 ± 0.03 a49.75 ± 0.04 b42.69 ± 0.02 c40.74 ± 0.03 d
No. 231.81 ± 0.03 a***27.66 ± 0.03 c***24.36 ± 0.04 d***31.09 ± 0.02 b***
Reducing powerNo. 10.988 ± 0.003 a0.201 ± 0.002 c0.097 ± 0.002 d0.681 ± 0.015 b
No. 20.861 ± 0.003 a***0.185 ± 0.003 c**0.069 ± 0.002 d***0.783 ± 0.002 b***
a–d Values (mean ± SD, n = 3 for all test groups) in the same row not sharing the same alphabetic letter are significantly different (p < 0.05). No. 2 in comparison with No. 1, p < 0.05 (*), p < 0.01 (**), and p < 0.001 (***).
Table 3. The Pearson correlation coefficients (r) between total phenols, total flavonoids and antioxidant abilities.
Total PhenolsTotal Flavonoids
DPPH scavenging activity0.84440.5465
Ferrous ion chelating ability0.41580.8845
Reducing power0.80970.5100
Table 4. Comparisons of the tyrosinase-inhibitory activities of the four solvent extracts of the two varieties of Hang Ju.
Extract NumberNo. 1ANo. 1BNo. 1CNo. 1D
Tyrosinase inhibitory activity (%)37.67 ± 0.03 a28.66 ± 0.03 b17.67 ± 0.03 c39.34 ± 0.03 d
Extract NumberNo. 2ANo. 2BNo. 2CNo. 2D
Tyrosinase inhibitory activity (%)21.81 ± 0.02 a***13.82 ± 0.03 b***7.81 ± 0.02 c***25.67 ± 0.03 d***
a–d Values (mean ± SD, n = 3 for all test groups) in the same row not sharing the same alphabetic letter are significantly different (p < 0.05). No. 2 in comparison with No. 1 sample, p < 0.001 (***).
Table 5. The Pearson correlation coefficients (r) between the total and individual chlorogenic acid contents and the tyrosinase inhibition activities.
Tyrosinase Inhibition Activities
Neochlorogenic acid0.6427
Chlorogenic acid0.6623
Cryptochlorogenic acid0.1492
Isochlorogenic acid−0.0086
Total chlorogenic acid0.6502
Table 6. The total and individual chlorogenic acid contents of the four solvent extracts of two varieties of Hang Ju.
No. 1ANo. 2ANo. 1BNo. 2BNo. 1CNo. 2CNo. 1DNo. 2D
Neochlorogenic acid 2538.89277.96ND 13.12ND 1ND 11090.311378.25
Chlorogenic acid 26056.572244.9053.38102.19ND 1ND 14205.764892.28
Cryptochlorogenic acid 2ND 1397.62ND 10.38ND 1ND 152.62171.13
Isochlorogenic acid 2ND 1138.89ND 1ND1ND 1ND 1ND 13.93
Total chlorogenic acid 26595.463059.3753.38106.69ND 1ND 15348.696445.59
1 ND indicates that the results are lower than the LOQ, i.e., not detectable. 2 Chlorogenic acid units are expressed as μg/g dry weight.
Table 7. Summary of the extraction yields, antioxidant capacities, and tyrosinase-inhibitory activities of the four solvent extracts of Hang Ju.
Ethanol (A)Ethyl Acetate (B)N-Hexane (C)Distilled Water (D)
Extraction yields1234
Antioxidant capacities1342
Tyrosinase-inhibitory activities2341
One (1) indicates first (best); 2 indicates second; 3 indicates third; 4 indicates fourth (worst).
Publisher’s Note: MDPI stays neutral with regard to jurisdictional claims in published maps and institutional affiliations.

