Article

Motion Classification and Features Recognition of a Traditional Chinese Sport (Baduanjin) Using Sampled-Based Methods

1
Centre for Sport and Exercise Sciences, Universiti Malaya, Kuala Lumpur 50603, Malaysia
2
College of Sport, Neijiang Normal University, Neijiang 641112, China
3
Department of Mechanical Engineering, Faculty of Engineering, Universiti Malaya, Kuala Lumpur 50603, Malaysia
*
Author to whom correspondence should be addressed.
Appl. Sci. 2021, 11(16), 7630; https://doi.org/10.3390/app11167630
Submission received: 27 July 2021 / Revised: 15 August 2021 / Accepted: 17 August 2021 / Published: 19 August 2021
(This article belongs to the Special Issue Performance Analysis in Sport and Exercise)

Abstract

:
This study recognized the motions and assessed the motion accuracy of a traditional Chinese sport (Baduanjin), using the data from the inertial sensor measurement system (IMU) and sampled-based methods. Fifty-three participants were recruited in two batches to participate in the study. Motion data of participants practicing Baduanjin were captured by IMU. By extracting features from motion data and benchmarking with the teacher’s assessment of motion accuracy, this study verifies the effectiveness of assessment on different classifiers for motion accuracy of Baduanjin. Moreover, based on the extracted features, the effectiveness of Baduanjin motion recognition on different classifiers was verified. The k-Nearest Neighbor (k-NN), as a classifier, has advantages in accuracy (more than 85%) and a short average processing time (0.008 s) during assessment. In terms of recognizing motions, the classifier One-dimensional Convolutional Neural Network (1D-CNN) has the highest accuracy among all verified classifiers (99.74%). The results show, using the extracted features of the motion data captained by IMU, that selecting an appropriate classifier can effectively recognize the motions and, hence, assess the motion accuracy of Baduanjin.

1. Introduction

Baduanjin is a popular traditional sport in China that consists of eight motions [1]. It is a compulsory sports item of physical education (PE) in Chinese universities and a traditional sports item supported by the government [2]. However, the teaching and learning resources are relatively inadequate. For example, although 76.7% of Chinese universities taught martial arts in their PE curriculum, the high student–teacher ratio has adversely affected the teaching and learning of Baduanjin [3]. Because there are many students in the Baduanjin course, the teacher cannot observe the motions of each student and correct the errors immediately. As a result, the students are unaware of their inaccurate motions. Students repeat the same errors continuously, which finally have achieved dynamic setting of errors in motions [4,5].
In recent years, motion capture (MoCap) has been applied in sports to monitor the motions of learners in real time. Researchers developed the system for specific sports items, using the motion data obtained by MoCap [6,7]. The system is able to check the motions and give the information of the errors in the motions in real time to the exercisers to assist them in detecting and correcting their inaccurate motions. For example, Chen et al. [8] developed a system for assessing the motion quality of Tai Chi based on Kinect. The system uses Kinect to obtain the 3D data of motions of exercisers. The difference between the data from the exerciser and experts is calculated through dynamic time-warping (DTW) to assess the motion quality of the exerciser. Researchers applied this system to teach Tai Chi in universities and found that the system accelerates learning in Tai Chi novices.
The application of MoCapin in PE can be divided into four categories based on its technical characteristics: optoelectric system (OMS) [9], electromagnetic system (EMS), image processing system (IMS) and IMU [10]. The disadvantages of OMS are its high cost and the issue with markers being obscured, which limits its practical application in PE [11,12]. EMS does not have an issue in obscuring markers, but it is prone to interference from the electromagnetic environment [13]. The advantage of IMS is that it is more accurate than EMS, and the measurement range is more comprehensive than that of OMS [10]. However, IMS has the problem of occlusion [10]. For example, in teaching, teachers may hide the optical sensor and cause the inability to effectively capture the motions of students, which has limited high-performance IMS application in PE. IMU does not have the disadvantage of occlusion compared to IMS technology [14]. Commercial IMUs (MVN Awinda system, Xsens, Enschede, Netherlands) have already been validated with motion accuracy. Moreover, IMU is the most mobile of the four categories of MoCap, making it a preferred application in PE [10,15]. It is undeniable that IMU has the problem of magnetic distortion, because it includes magnetometers [10]. For example, a MoCap glove for fingers (Smartglove developed by Rokoko) applied the sensors, which exclude magnetometers to avoid magnetic distortion [16]. However, the motions of Baduanjin are the overall human body motions, which do not require capturing the motions of fingers. The magnetic distortion of IMU can be ignored.
Therefore, we propose developing a system using IMU to capture the motions of Baduanjin to assess the motion accuracy of students and assist teachers and students in identifying errors in the motions of Baduanjin. The system needs to recognize and assess the motions of Baduanjin effectively. The purpose for developing recognizing motions of Baduanjin is that Baduanjin has a complete set of motions. The reason is that the sequence of motions in Baduanjin is fixed (from Motion-1 to Motion-8), which means the sequence of motions cannot be adjusted at will. The sequence of motions must be followed. However, in the actual teaching and learning environment, the students are unable to perform. Baduanjin with the correct sequence of motions. Therefore, the assessment system should be able to identify the motions to ascertain whether the student has followed the correct motion sequence. Recognizing motion and assessing motion accuracy can be solved as a classification issue. Commonly used classification methods can be divided into sample-based methods and sequence-based methods [17]. The sample-based methods mainly use classifiers, including k-NN, SVM, Naive Bayes (NB), Logistic Regression, Decision Tree (DT), Artificial Neural Network (ANN) and CNN. The sequence-based methods mainly include DTW, Hidden Markov Model (HMM) and Recurrent Neural Network (RNN). In this study, the effectiveness of the sample-based methods, namely (even mainly classifiers) k-NN, SVM, NB, Logistic Regression, DT, ANN (including two commonly ANN classifiers) and 1D-CNN, was tested.

2. Materials and Methods
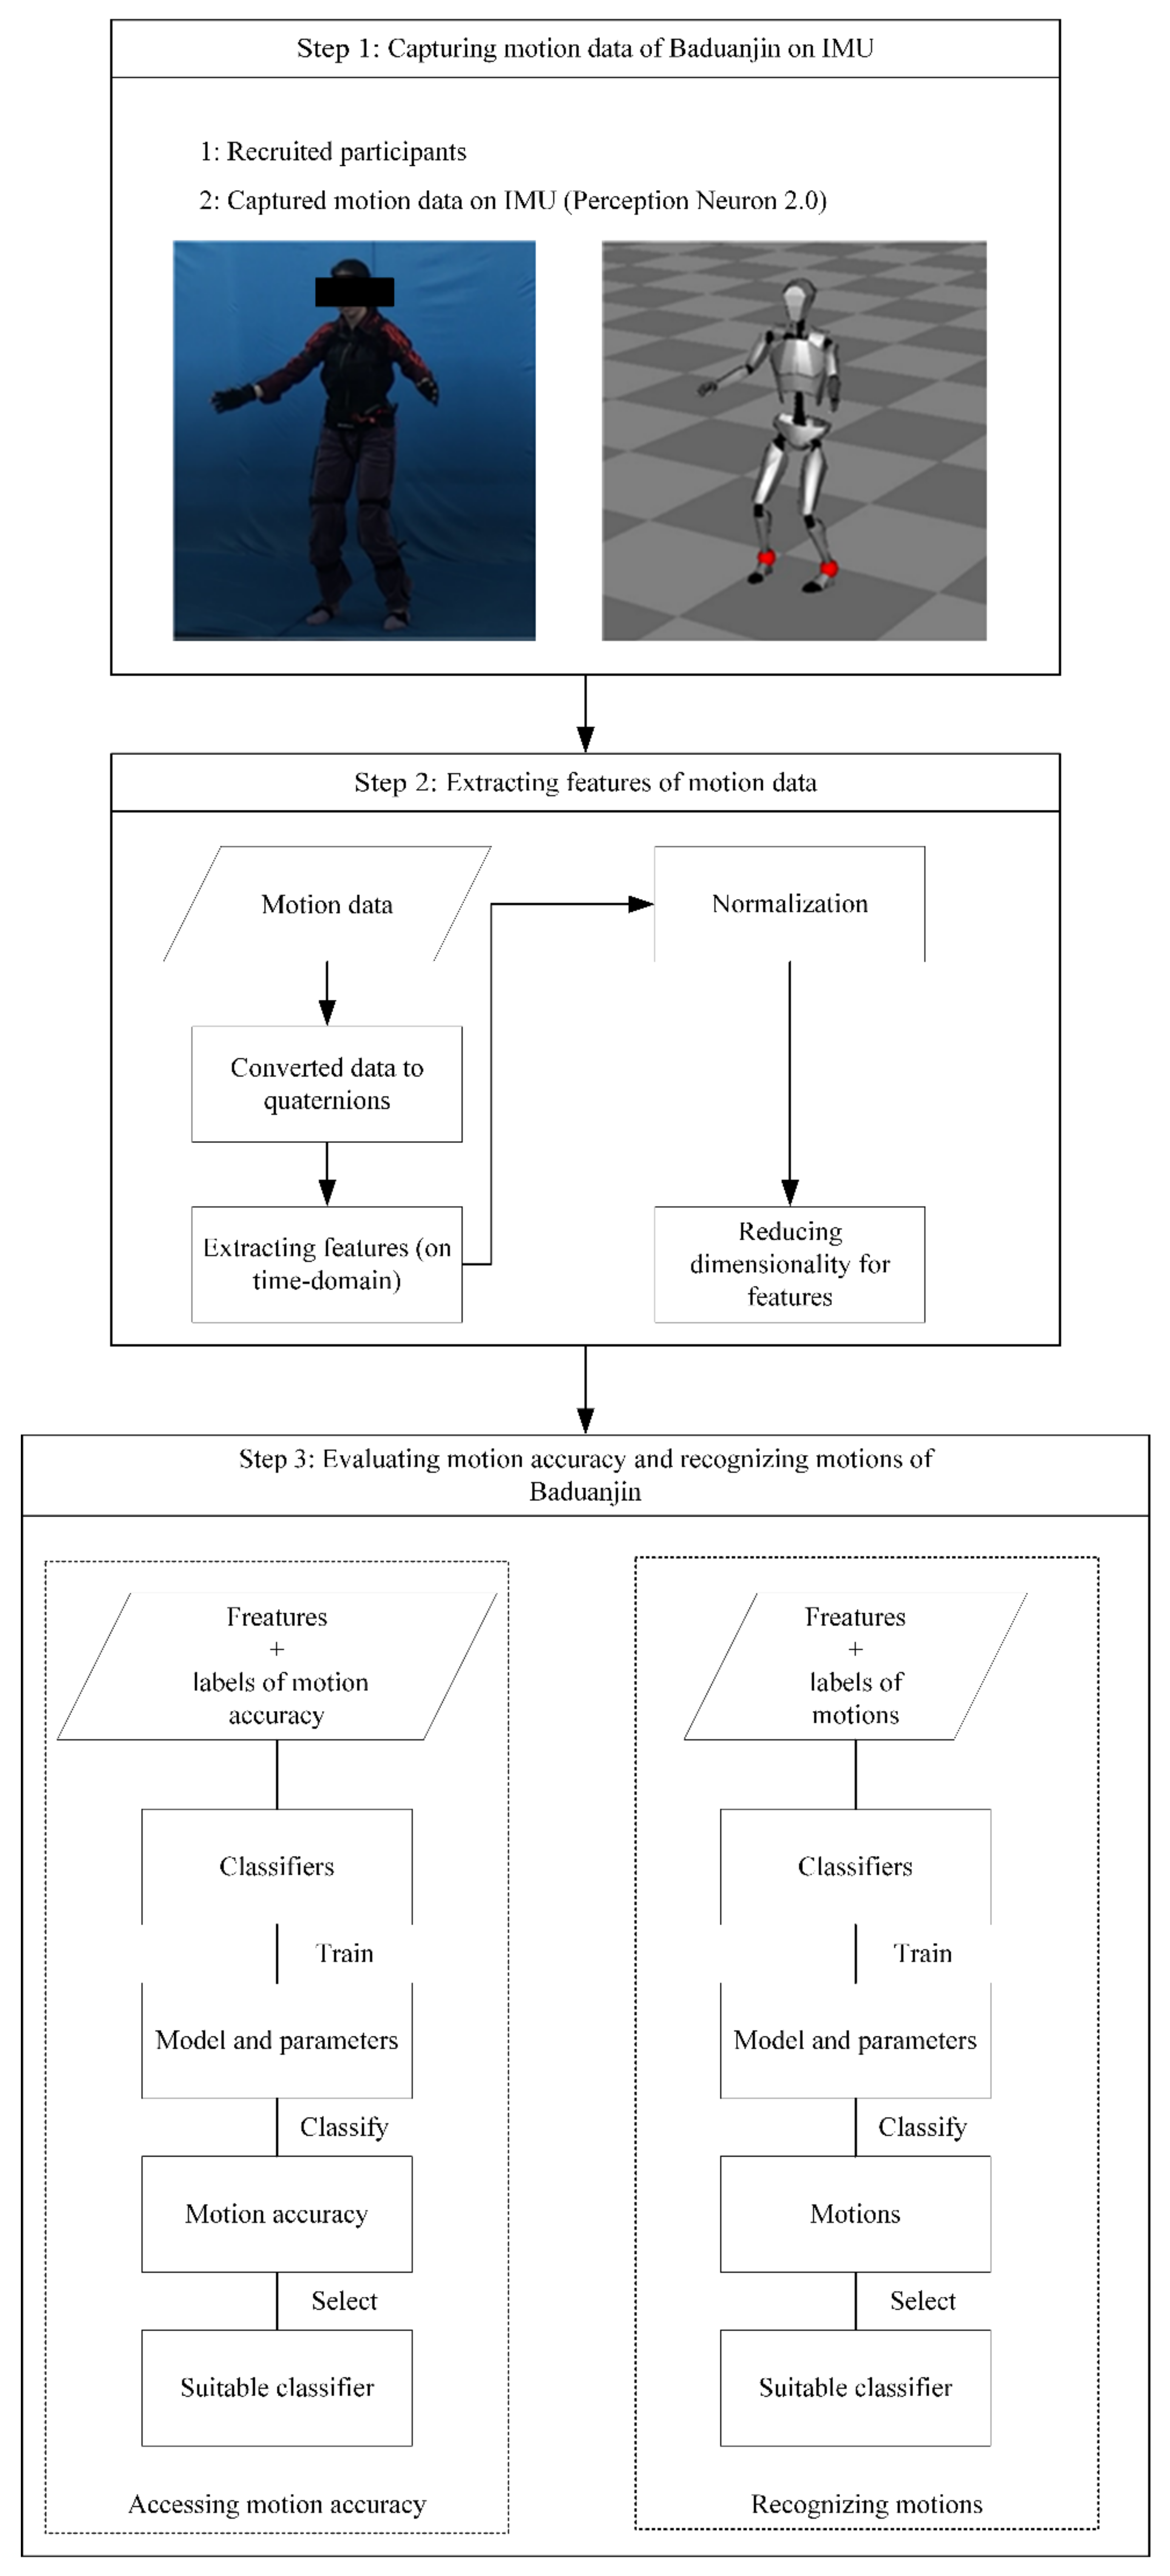
2.1. Overview

This study consists of three steps, namely capturing motion data of Baduanjin on IMU, extracting features and reducing feature dimensionality, and assessing and recognizing the motions of Baduanjin. Students from a university in Southwest China were invited to participate in the study. The study was conducted in accordance with the Declaration of Helsinki, and the protocol was approved by the University of Malaya Research Ethics Committee (UM.TNC2/UMREC–558).
First, the motion data of all participants were captured when they practiced Baduanjin, using IMU. Second, the features were extracted from the motion data. The raw data needed to be converted into quaternion format for data analysis. Usually, the extracted features of motion data in practical applications have high dimensionality. Thus, dimensionality reduction is required to prevent data redundancy. The last step is to verify the effectiveness of the motion assessing and recognition of Baduanjin on sample-based methods. In sample-based methods, motions are assigned labels, regardless of the previous motion classification. These classification methods use the extracted relevant features from the motion data for training the classifier based on labels. After the model parameters of the classifier are trained, unlabeled motions can be classified. Therefore, accessing motion accuracy of Baduanjin has been converted into a classification problem. Experts of Baduanjin were invited to grade the accuracy of the captured motions and then use the assessment result as a label to train the eight classifiers (see Figure 1).

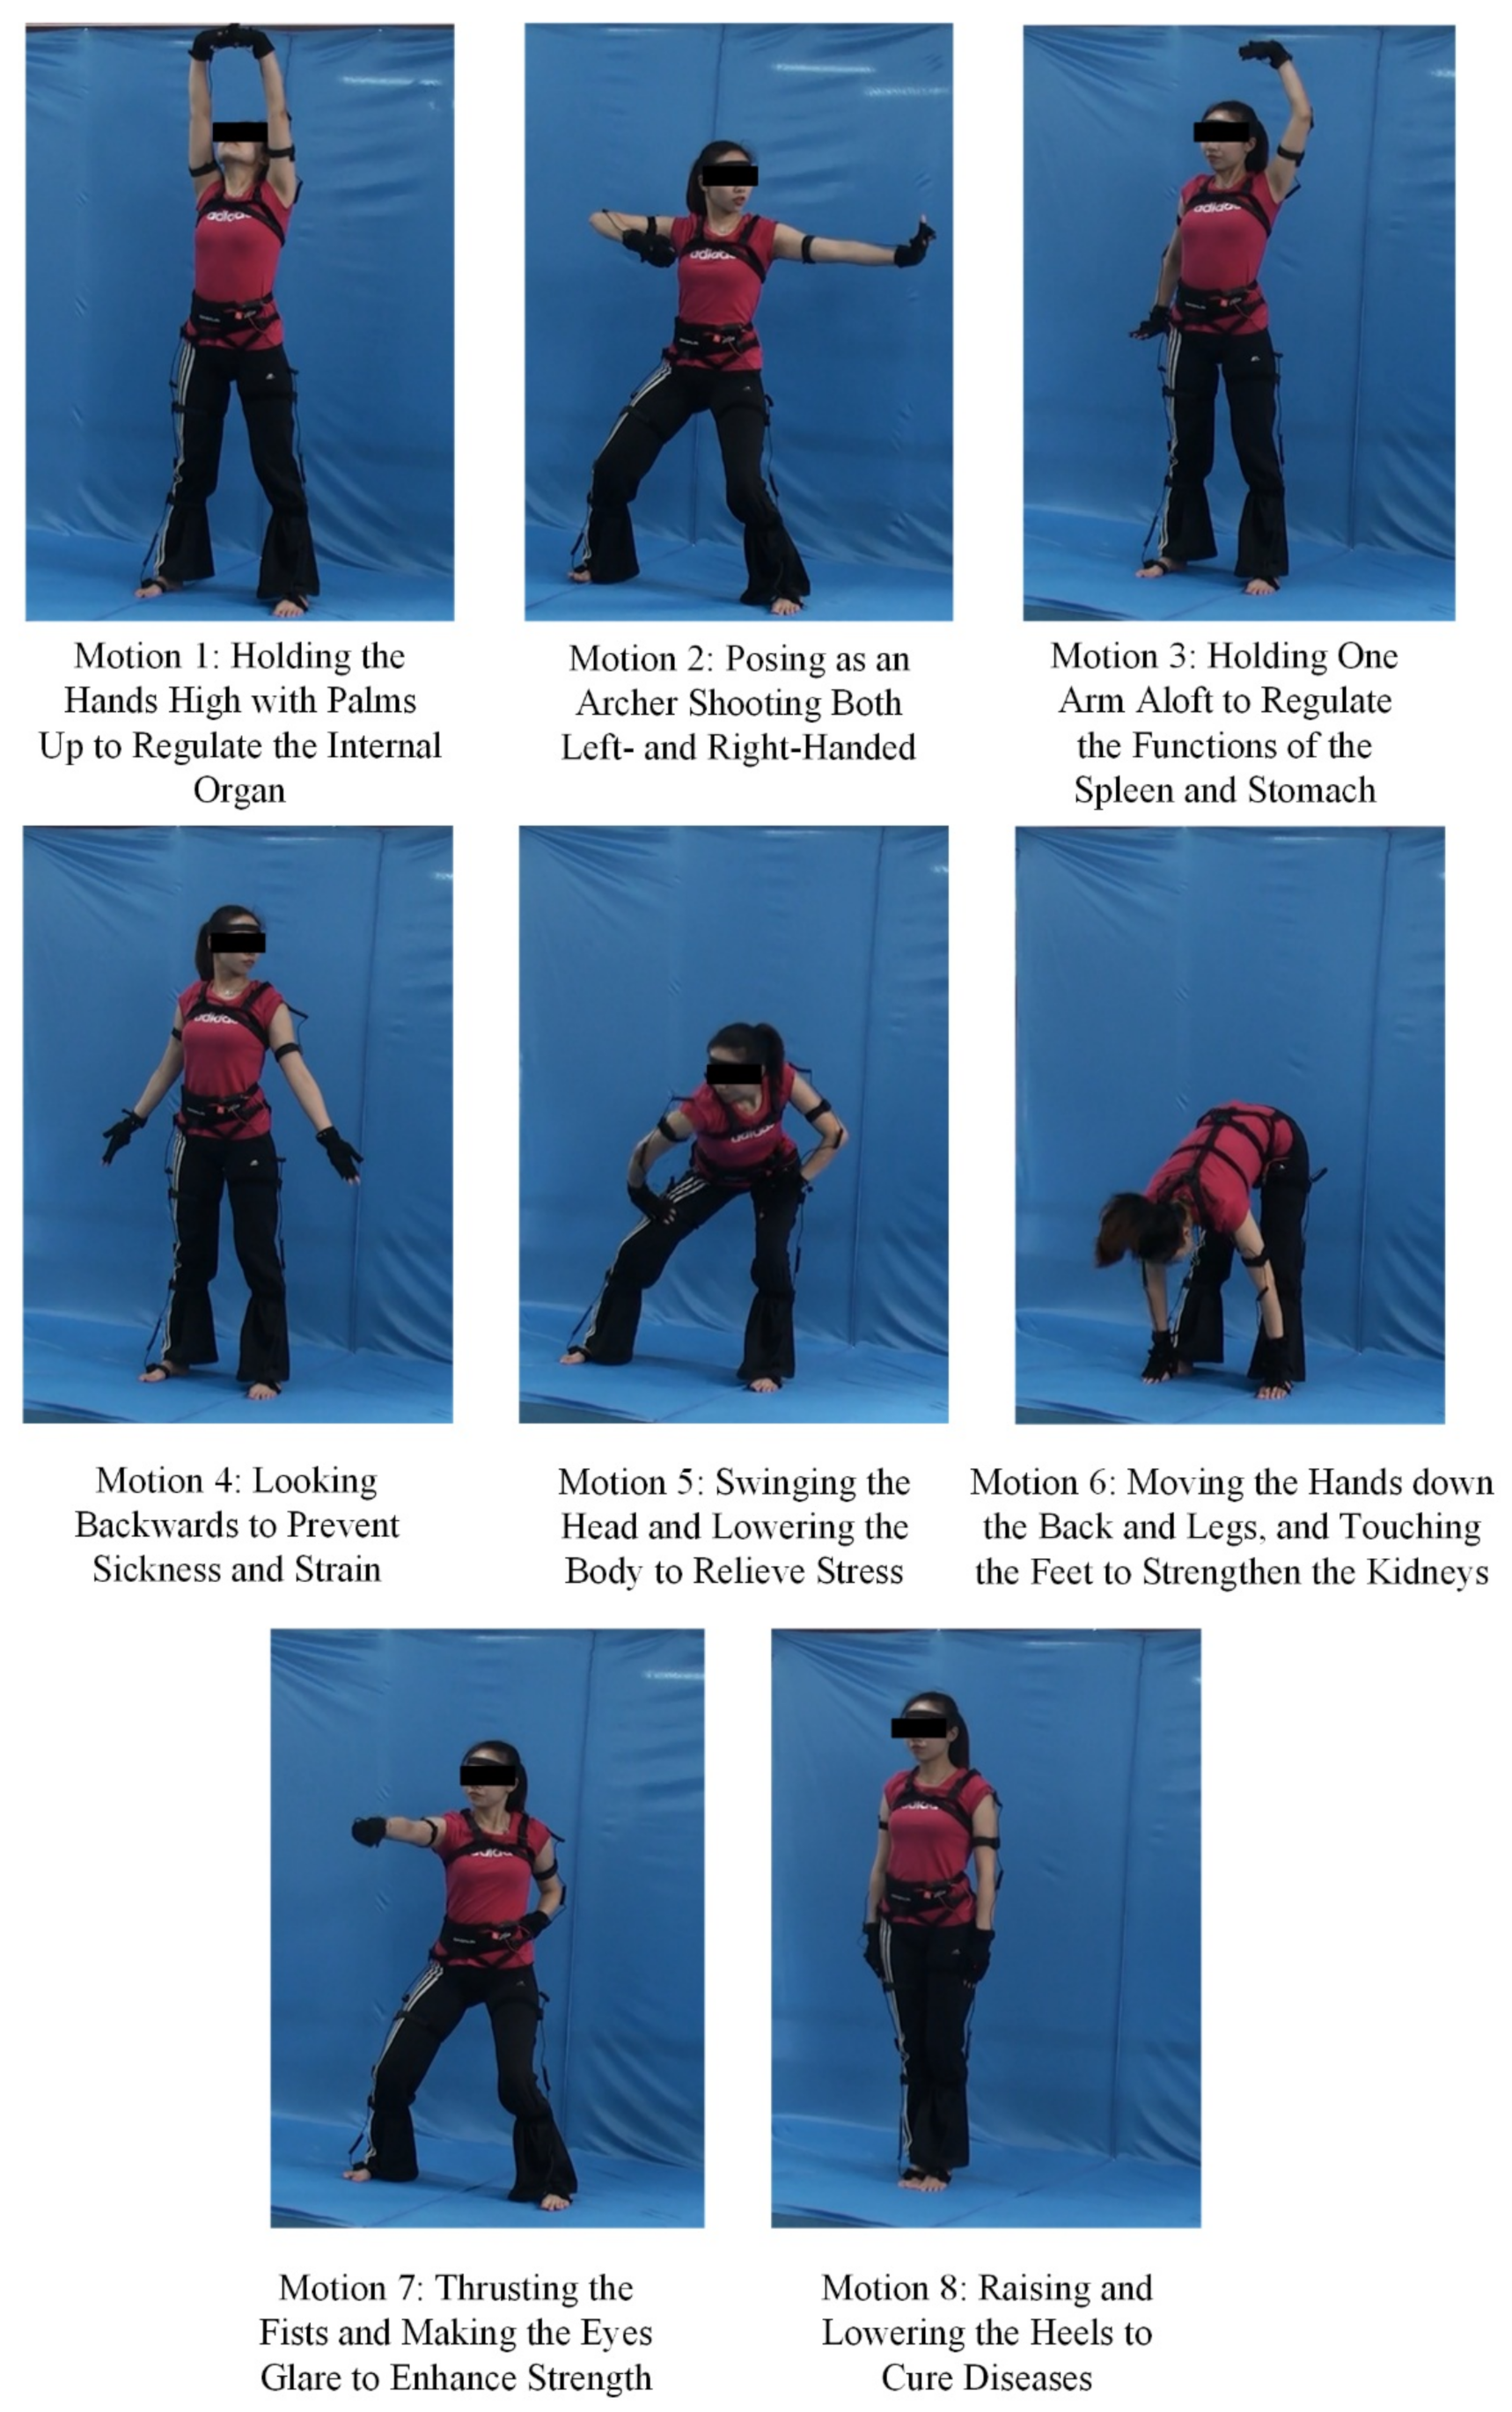
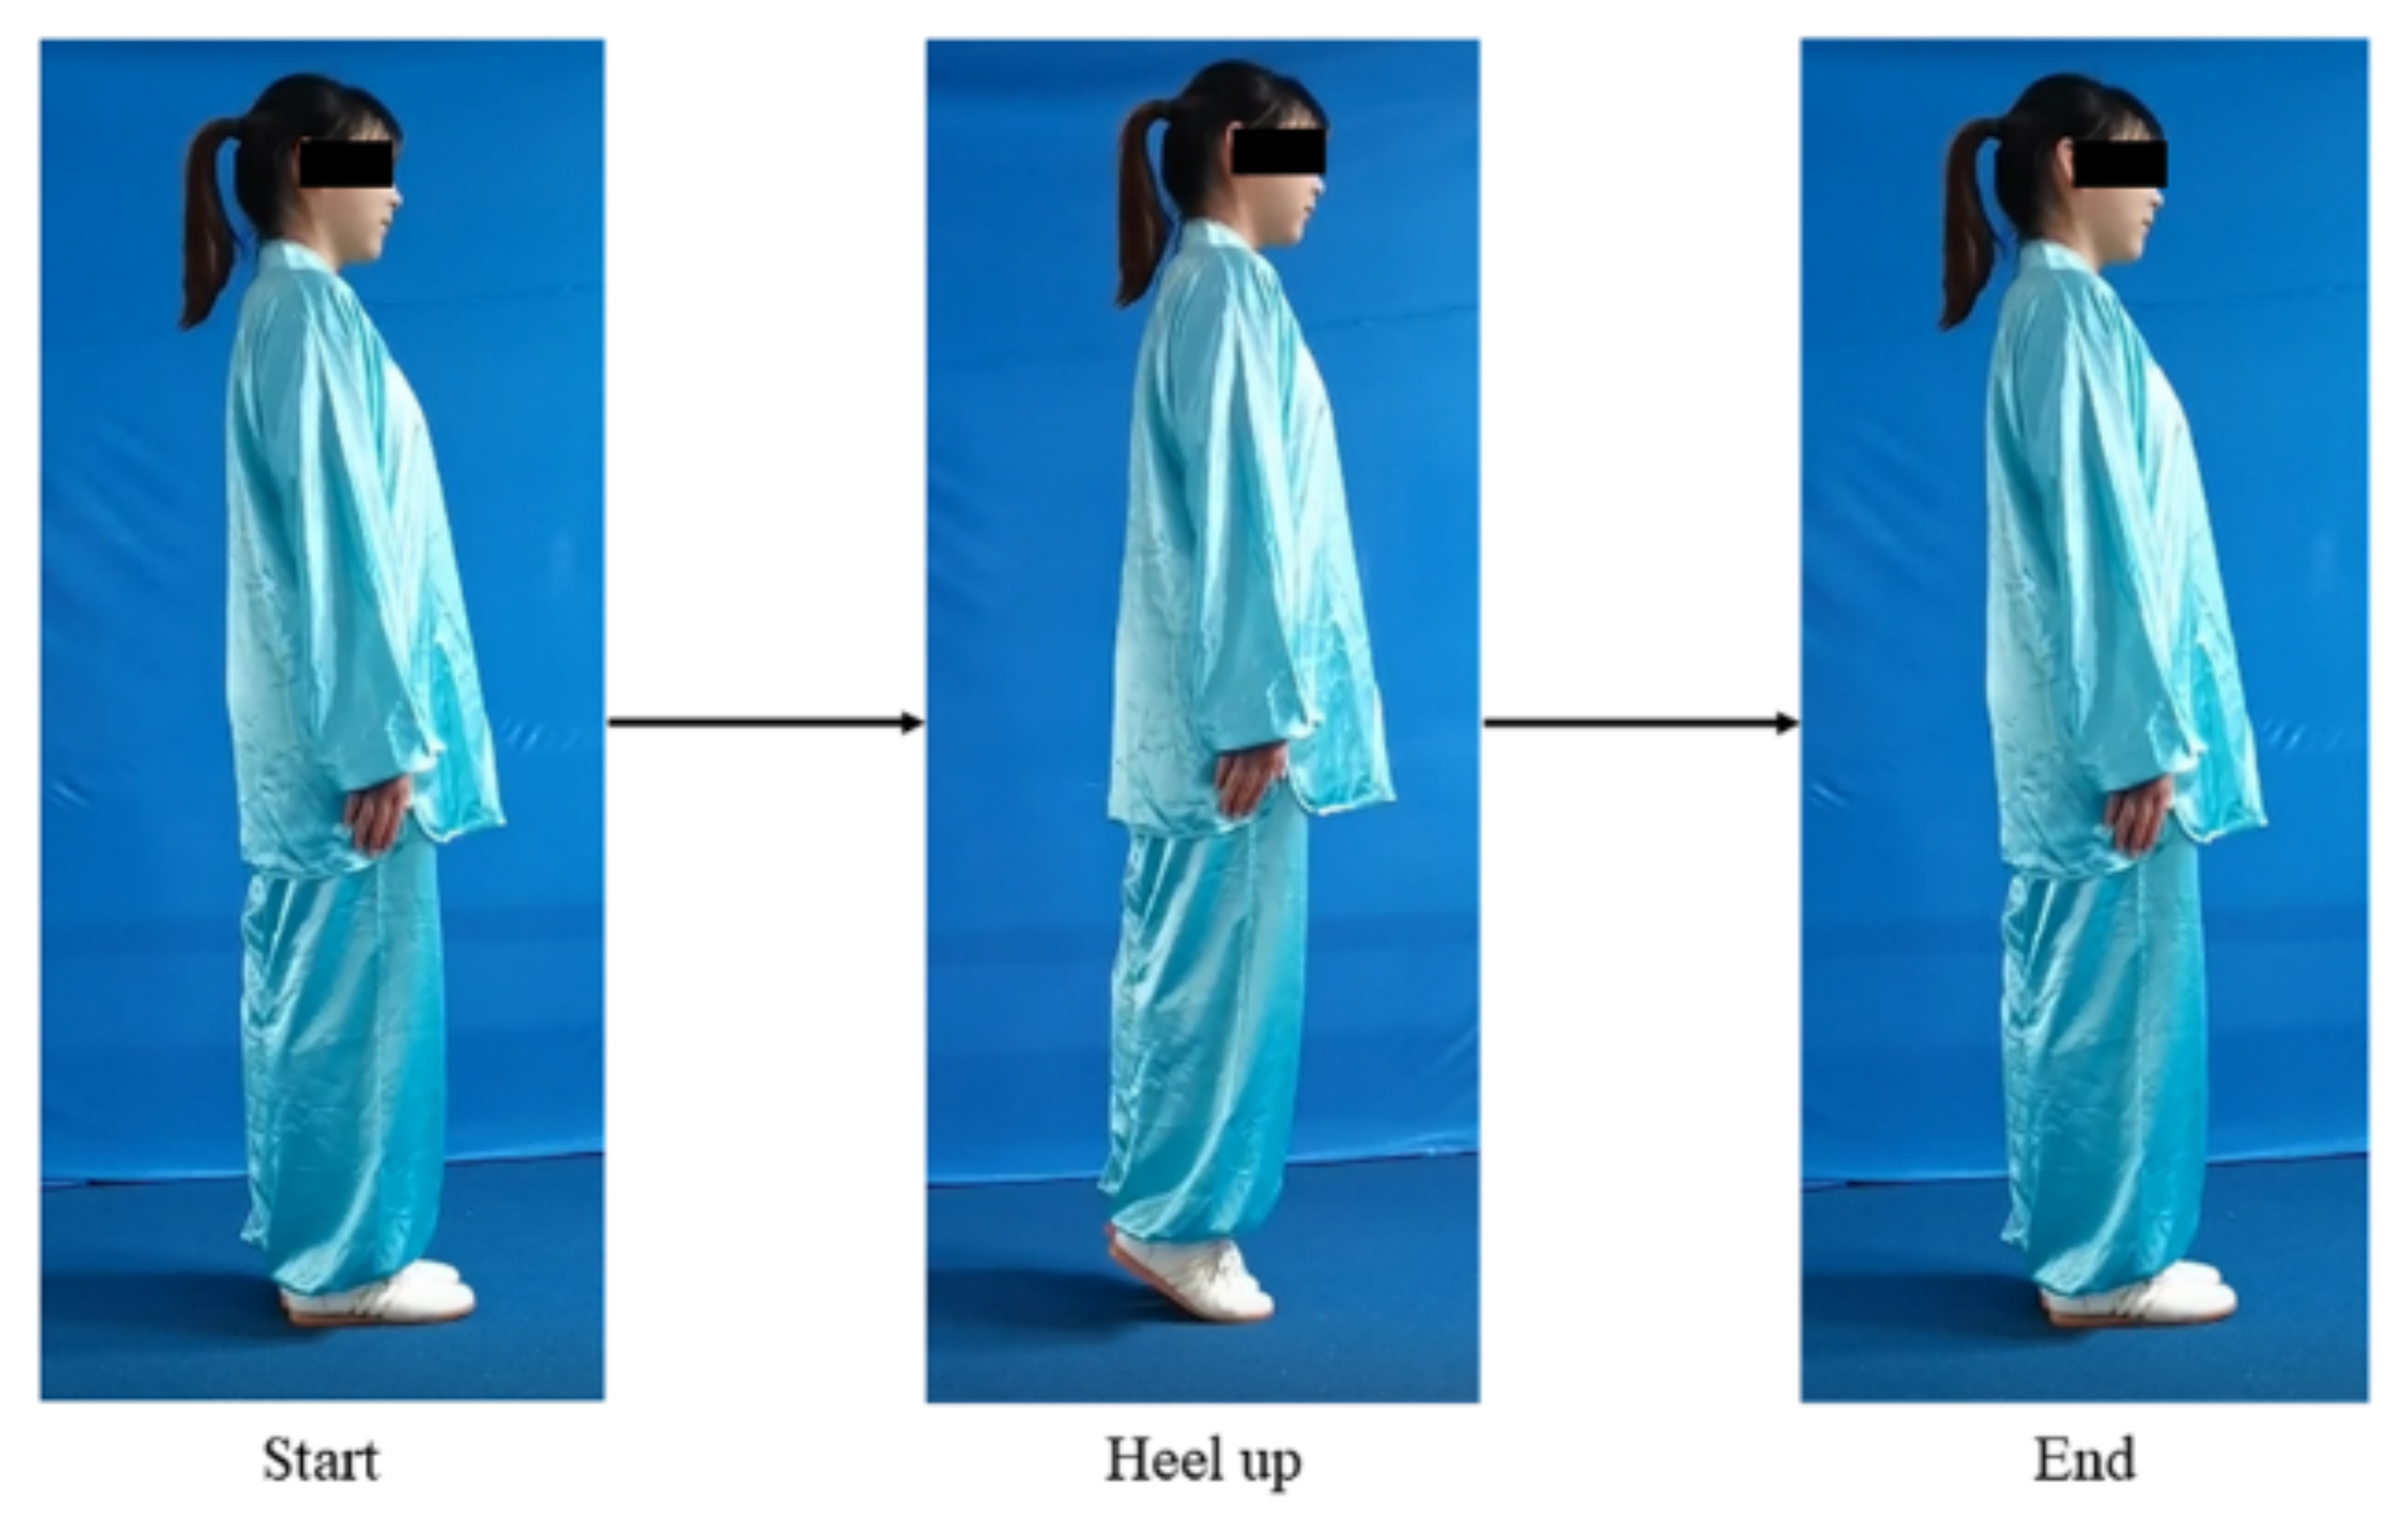
2.2. Capturing Motion Data of Baduanjin, Using IMU

Undergraduate students with no clinical/mental illness or physical disability from a university in Southwest China were invited to participate in this study. Participants read the information sheet that outlined the purpose and procedure of the study. Those who agreed to participate in the study were given the consent form to sign.
The IMU used to capture the motion data of Baduanjin was Perception Neuron 2.0, which was developed by Noitom [14]. Perception Neuron 2.0 is a commercial IMU with 17 inertial sense units, and each unit comprises a 3-axis gyroscope, 3-axis accelerometer and 3-axis magnetometer. The output of the captured motion data is in a Biovision Hierarchy (BVH) motion file through the Axis Neuron software developed by Noitom. The effectiveness of Perception Neuron 2.0 in measuring motion accuracy has been experimentally confirmed by Sers et al. [18].
Before measuring the motion data, participants were required to practice Baduanjin for 30 min to familiarize themselves with the motions and warm up their body. After the practice, the motion data of participants immediately were captured by IMU when they practiced Baduanjin. No feedback was given to participants during practice and the capturing of the motions. The eight standard motions of Baduanjin are shown in Figure 2.

2.3. Extracting Features of Motion Data

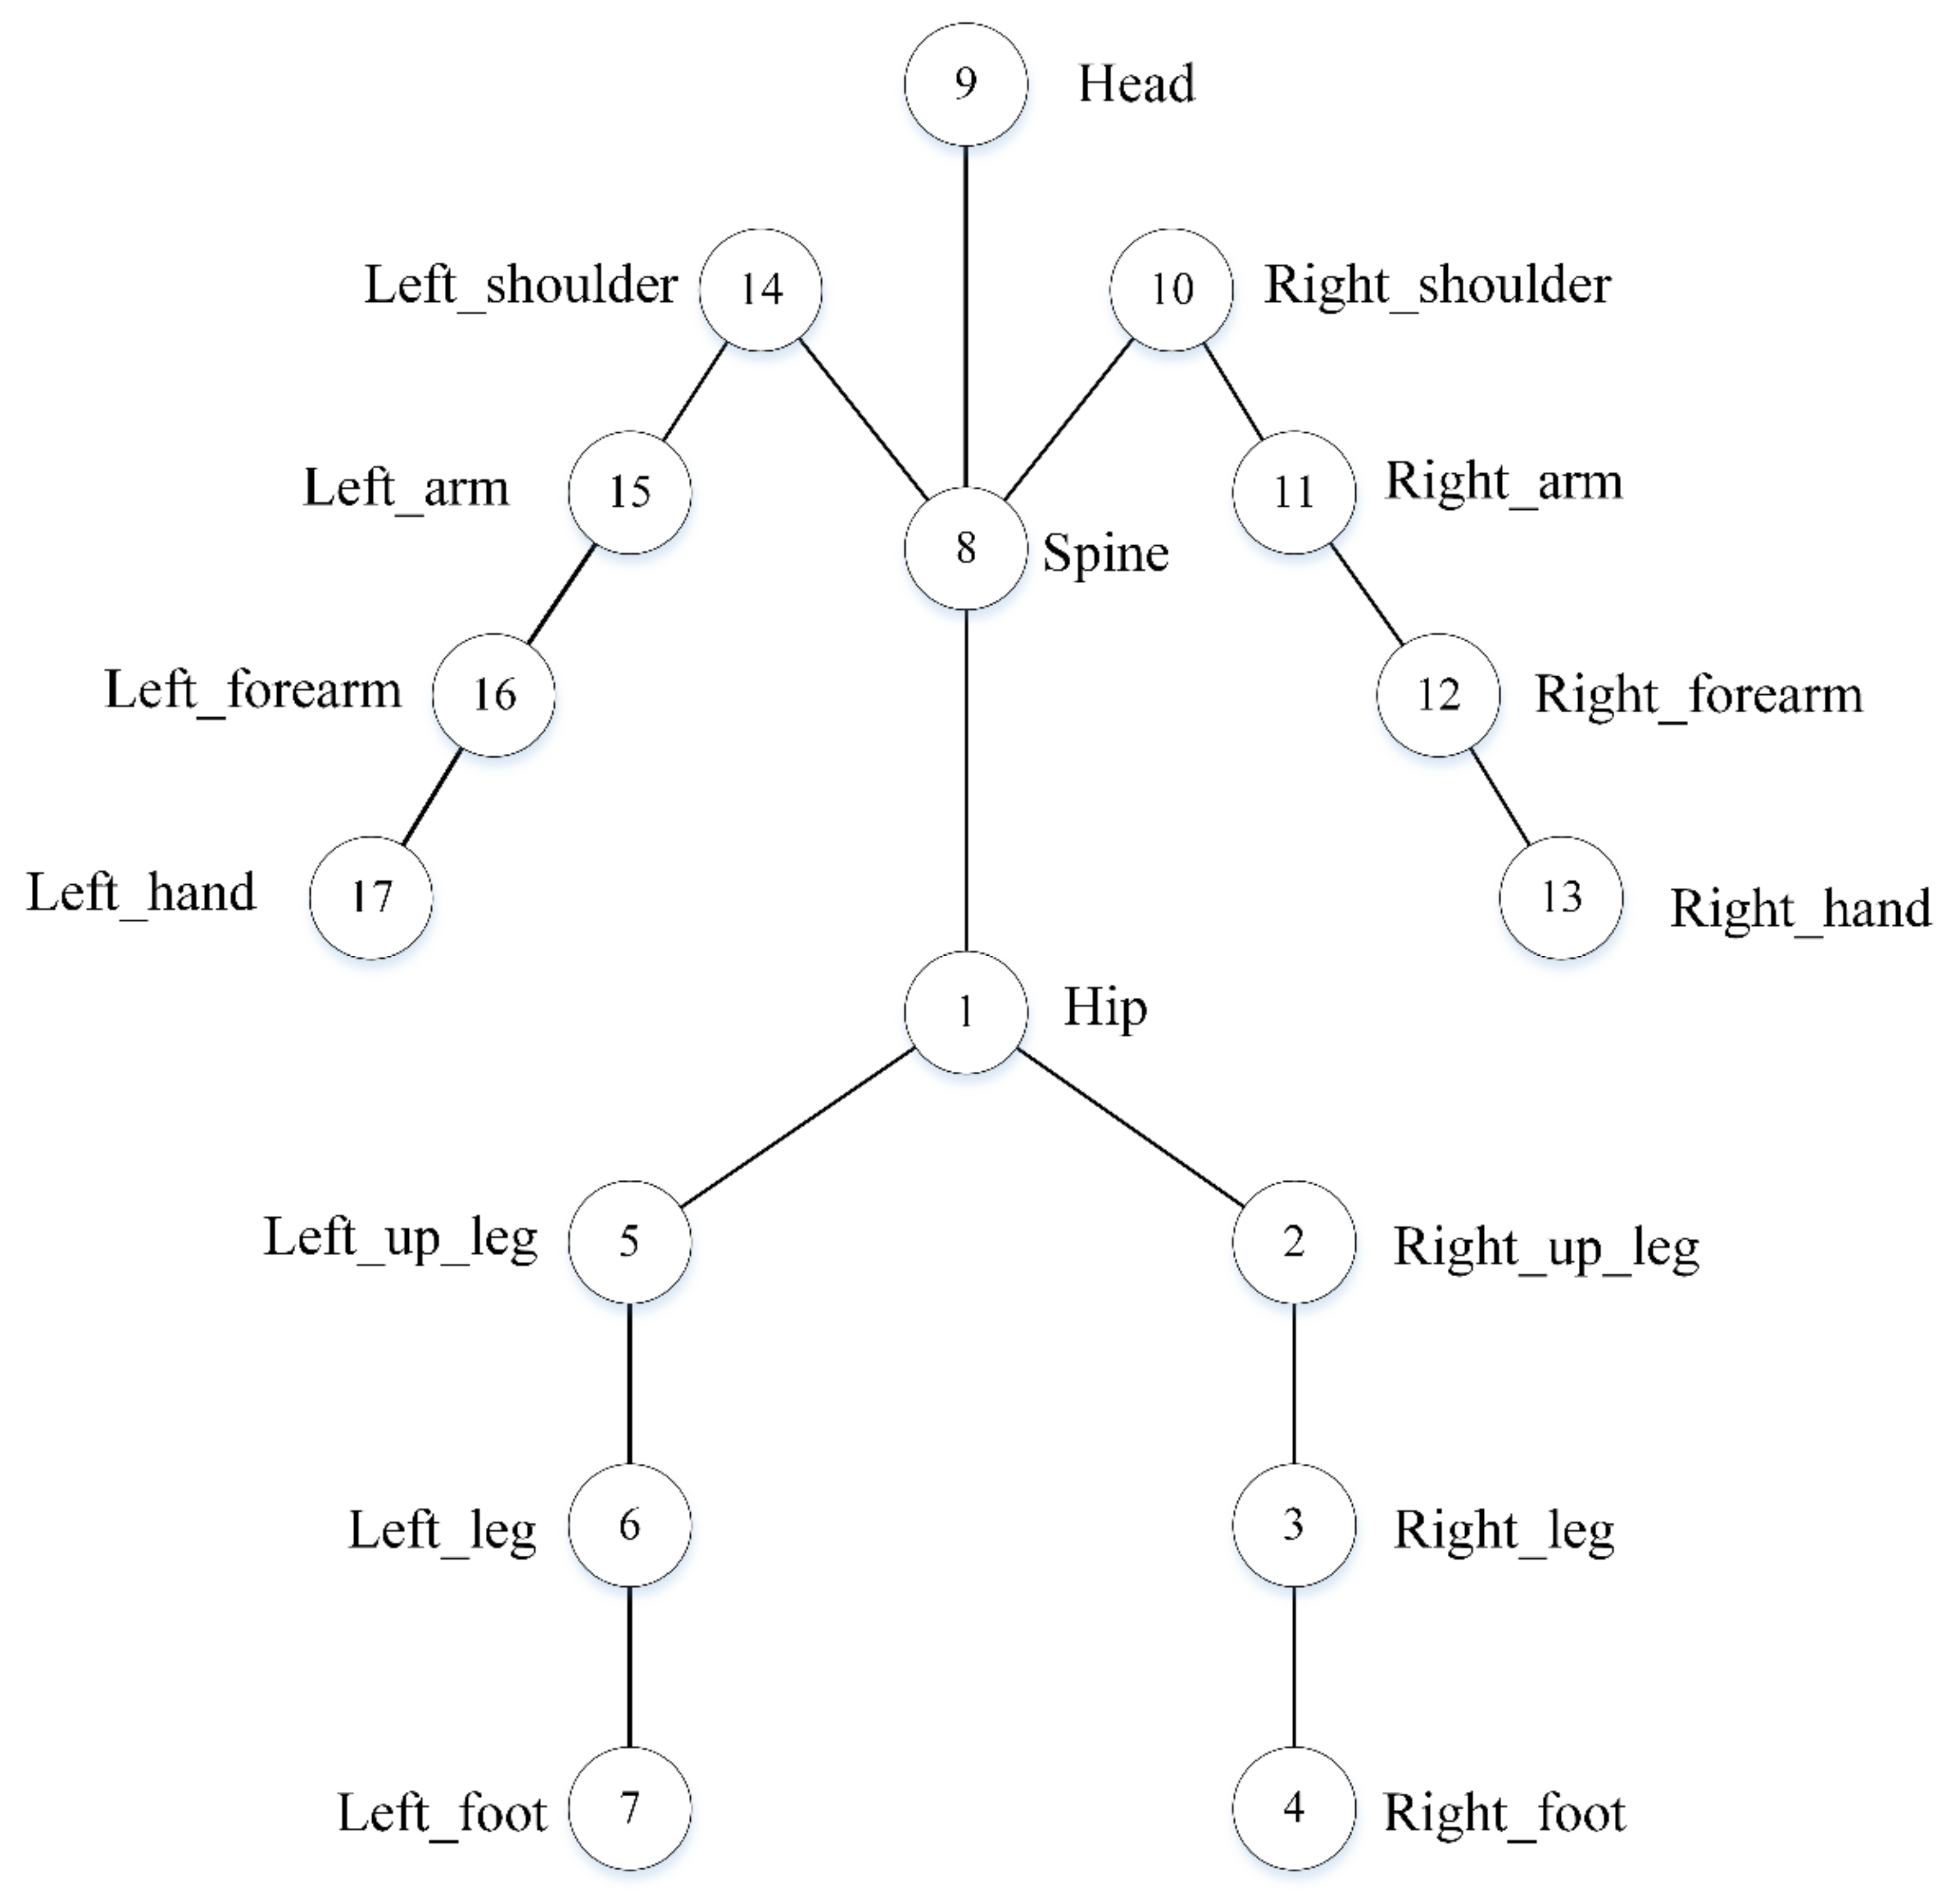
2.3.1. Extracting and Converting Raw Data

The output format of the motion data is the BVH file, which is a format used to tore skeleton hierarchy information and three-dimensional motion data [19]. Perception Neuron 2.0 uses 17 sensors to measure the motion data of 17 points of the body. The BVH skeleton hierarchy information and skeleton model are shown in Figure 3.
The format of the skeleton motion data is recorded in the BVH file with the rotation data represented by Euler angles. Rotation data expressed by Euler angles have gimbal locking and singularity problems. Therefore, the Euler angle data were converted into quaternions to avoid such problems in this study [20]. Four-tuple notation was used to represent quaternion as follows:
q = [ w , x , y , z ]
In Equation (1), w is the scalar component, and x, y and z are the vectors.
If the order of rotation in Euler angle is z, y, and x, and set we α, β, and γ to represent the rotation angles of the object around x, y, and z axes, the corresponding quaternion can be converted as follows:
q = w x y z = cos ( g / 2 ) 0 0 sin ( g / 2 ) cos ( b / 2 ) 0 sin ( b / 2 ) 0 cos ( a / 2 ) sin ( a / 2 ) 0 0 = cos ( g / 2 ) cos ( b / 2 ) cos ( a / 2 ) + sin ( g / 2 ) sin ( b / 2 ) sin ( a / 2 ) cos ( g / 2 ) cos ( b / 2 ) sin ( a / 2 ) sin ( g / 2 ) sin ( b / 2 ) cos ( a / 2 ) cos ( g / 2 ) sin ( b / 2 ) cos ( a / 2 ) + sin ( g / 2 ) cos ( b / 2 ) sin ( a / 2 ) sin ( g / 2 ) cos ( b / 2 ) sin ( a / 2 ) cos ( g / 2 ) sin ( b / 2 ) sin ( a / 2 )
After converting the raw data into quaternions, the quaternions were converted into unit quaternions to facilitate extracting features.

2.3.2. Extracting Features

After extracting and converting raw data to unit quaternions, the features were extracted from the data to represent each type of motion in the form of feature vectors. The extracted features used in motion recognition include features of time-domain, frequency-domain and wavelet. The time-domain features include the mean, variance, standard deviation, skewness, kurtosis, quartiles, average absolute deviation and correlation coefficient between axes [21,22,23]. Frequency-domain features include the peak value, energy of the discrete Fourier transform spectrogram and discrete cosine transform [24,25]. Wavelet features include approximate wavelet coefficients and wavelet detail coefficients obtained after discrete wavelet transform [26]. In this study, we extracted the time-domain features of motion data.
1.
Extracting time-domain features
After raw data were converted into the unit quaternion of 17 skeleton points, the scalar component was removed, leaving the three vectors of [w, x, y, z]. For each skeleton point, the features are represented as an n × 1 dimensional vectors: X = X 1 , X 2 , . , X n T . The mean, variance, standard deviation, skewness, kurtosis and quartile deviation of the time-domain features were extracted. The description of the features is shown in Table 1.
The calculation equations for these features are as follows:
Mean:
m = 1 n i = 1 n X i
Variance:
s 2 = 1 n i = 1 n ( X i m )
Standard deviation:
s = s 2
Skewness:
S k = 1 n i = 1 n ( X i m ) 3 1 n i = 1 n ( X i m ) 2 3 / 2
Kurtosis:
K = 1 n i = 1 n ( X i m ) 4 1 n i = 1 n ( X i m ) 2 2
Quartile deviation:
Q = Q 3 Q 1
In Equation (8), Q1 represents the first quartile value, indicating that 25% of the value of vectors is less than or equal to Q1. Q3 represents the third quartile value, indicating that 75% of the value of vectors is less than or equal to Q3.
2.
Normalization
Normalization refers to transforming a dimensional expression into a scalar expression, which simplifies the calculations. In this study, the features were normalized to facilitate subsequent data analysis and improve the convergence speed of the classifier. The characters were normalized in the range of [0, 1], using the following equation:
x i = X i X min X max X min
In Equation (9), xi is the i-th data after normalizing. Xi is the i-th data in the feature vector before normalizing, while Xmax and Xmin, respectively, are the maximum and minimum values in the feature vector.
3.
Dimensionality reduction of feature vectors
High dimensionality of the feature vectors during training would result in the classifiers encountering problems such as large calculation load, data redundancy and poor visibility. In order to prevent these problems, it is recommended that dimensionality reduction be performed [27,28]. Dimensionality-reduction methods commonly applied in research include principal component analysis (PCA), linear discriminant analysis (LDA) and independent component analysis (ICA) [27]. In this study, PCA was used to reduce the dimensionality of the features.
PCA is used for dimensionality reduction to calculate the covariance matrix and its eigenvalues and arrange them according to the size of the eigenvalues [28,29]. By setting the cumulative variance contribution rate threshold, the eigenvectors corresponding to a small number of eigenvalues are selected, and the projection matrix is formed. Finally, the original high-dimensional data can be projected to the low-dimensional space. This method has been widely used in motion recognition. Altun et al. [22] used IMU to recognize 19 actions in daily life, and the dimension of the extracted feature vector was as high as 1170. They used PCA to reduce the dimension to 30 dimensions from 1170.
The steps of dimensional reduction on PCA are as follows:
  • Let the original data be the n-dimensional data of m;
  • Form the original data into matrix X with n-rows and m-columns;
  • Zero-average each row of matrix X, that is, subtract the average value of this row;
  • Calculate the covariance matrix;
  • Calculate the eigenvalues of the covariance matrix and the corresponding eigenvector r.
Sort the eigenvectors row-by-row, from top to bottom, according to the corresponding eigenvalues, into a matrix, and take the first k rows to form a matrix P. The matrix P is the data after dimension reduction to k dimension.

2.4. Assessing Motion Accuracy of Baduanjin

Motion accuracy can be evaluated by assessing the difference between the test motions and the standard motions, and/or the difference or similarity between motions of students and teacher. After obtaining the differences or similarities between the motions, the motion accuracy of students can be scored by ratio mapping, such as the method adopted by X. M. Chen et al. [8]. However, the problem with this method is that the prerequisite stated that student achievements have to meet the normal distribution condition. It is not easy to guarantee that the condition is met in actual teaching. Therefore, two teachers were invited to score the levels of students’ motions, and the assessment of motion accuracy was converted to a classification problem under the same type of motion.

2.4.1. Classifiers

1.
k-NN
In k-NN, the k-Nearest Neighbors of the vector x in the training set are considered [22]. From k (preset) samples with the smallest distance, the category with the largest number of the same label was selected, and the test vector was classified into this category. In k-NN, the distance is generally applied Euclidean distance, and k is the preset value. However, there is no rule for the preset k value. In studies, the preset k value is that an appropriate value is related to the actual study situation [30]. Function fitcknn (Statistics and Machine Learning Toolbox) for k-NN was used in the MATLAB environment in this study [31].
2.
SVM
SVM is a common classifier in motion recognition [32,33]. SVM constructs an N-dimensional hyperplane that optimally separates the dataset into categories on the theory of structural risk minimization [34]. It has significant advantages in classifying small samples and high-dimensional data [35]. In this study, SVM was applied to different feature vectors that belonged to more than two classes (8 classes). Following the one-versus-the-rest method, n different binary classifiers were trained, where each classifier recognizes one of n motion types. Function fitcecoc (Statistics and Machine Learning Toolbox) for SVM was used in the MATLAB environment in this study [36].
3.
NB
NB is a simple probabilistic classifier based on Bayes theorem with an intense independence assumption [37]. In human motion recognition, NB is necessary to calculate the Probability Density Function (EDF) of each feature and then calculate the posterior probabilities that the tested sample belongs to different categories. Function fitcnb (Statistics and Machine Learning Toolbox) for NB was used in the MATLAB environment in this study [38].
4.
Logistic Regression
Logistic Regression is the process of modeling the probability of discrete outcomes for a given input variable. The standard Logistic Regression models binary outcomes, which take two values: true/false and yes/no. Polynomial Logistic Regression can model the situation where there are more than two possible discrete results [39]. Function fitclinear (Statistics and Machine Learning Toolbox) for Logistic Regression was used in the MATLAB environment in this study [40].
5.
DT
DT is a supervised machine learning technique used to derive Decision Trees from training data [41]. DT is a predictive model, expressed as a recursive division from the feature space to the subspace that forms the prediction basis [42]. DT is a directed tree with roots. In the tree structure, leaves represent categories, non-leaf nodes are features and branches represent a collection of features that lead to the classification [41]. Function fitctree (Statistics and Machine Learning Toolbox) for DT is used in the MATLAB environment in this study [43].
6.
ANN
ANN is a computational model that simulates the structure of brain neurons for information processing. It consists of an input layer, one or more hidden layers and an output layer. Each layer contains many neurons, and each neuron contains an activation function [44]. In the study, two commonly used ANN, Back Propagation Neural Network (BPNN) and Radial Basis Function Neural Network (RBFNN), were used as classifiers to train and classify motions.
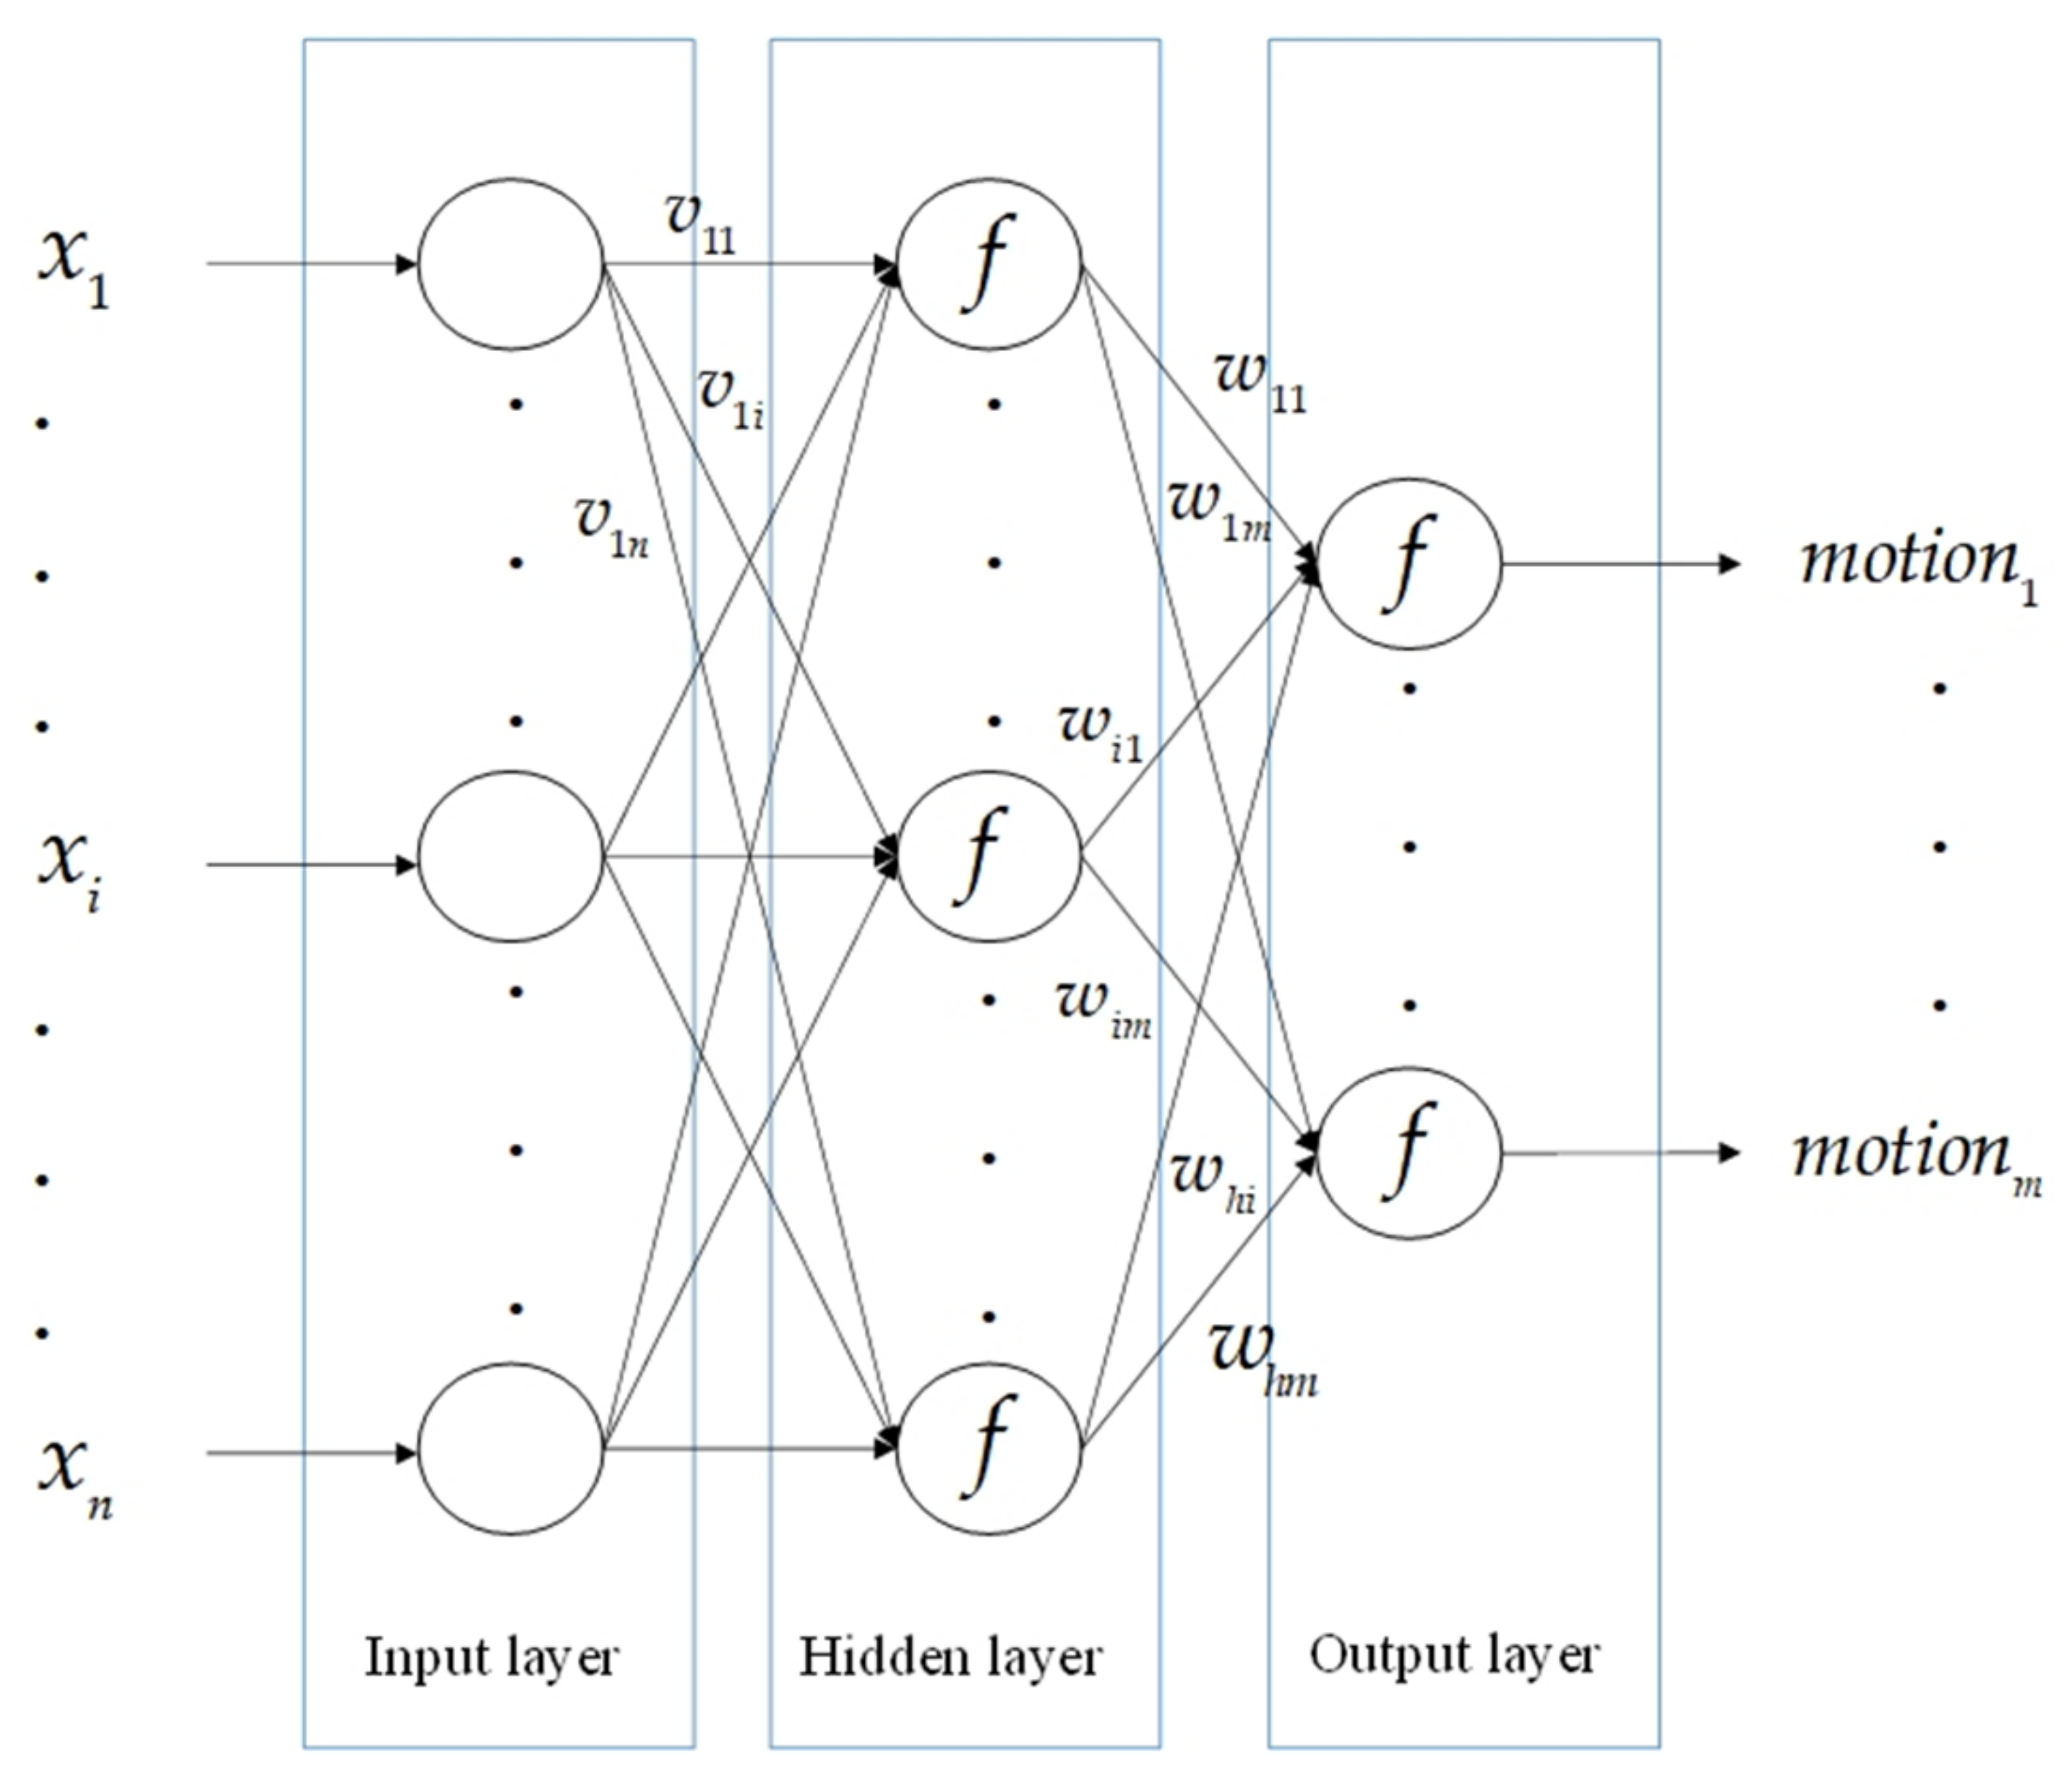
  • BPNN is a multilayer feedforward network trained according to the error backpropagation algorithm. It has an excellent ability to approximate any continuous function and healthy nonlinear mapping function [14]. In this study, BPNN is constructed with three layers. The first layer is the input layer. The number of neurons is equivalent to the dimension of the feature vectors; the second layer is the hidden layer. The tangent sigmoid equation is applied as the activation equation:
    f ( x ) = 2 ( 1 + e 2 x ) 1
The third layer is the output layer. The number of neurons is equal to the number of classified motions, and the activation equation is the tangent sigmoid equation. The basic architecture diagram is shown in Figure 4.
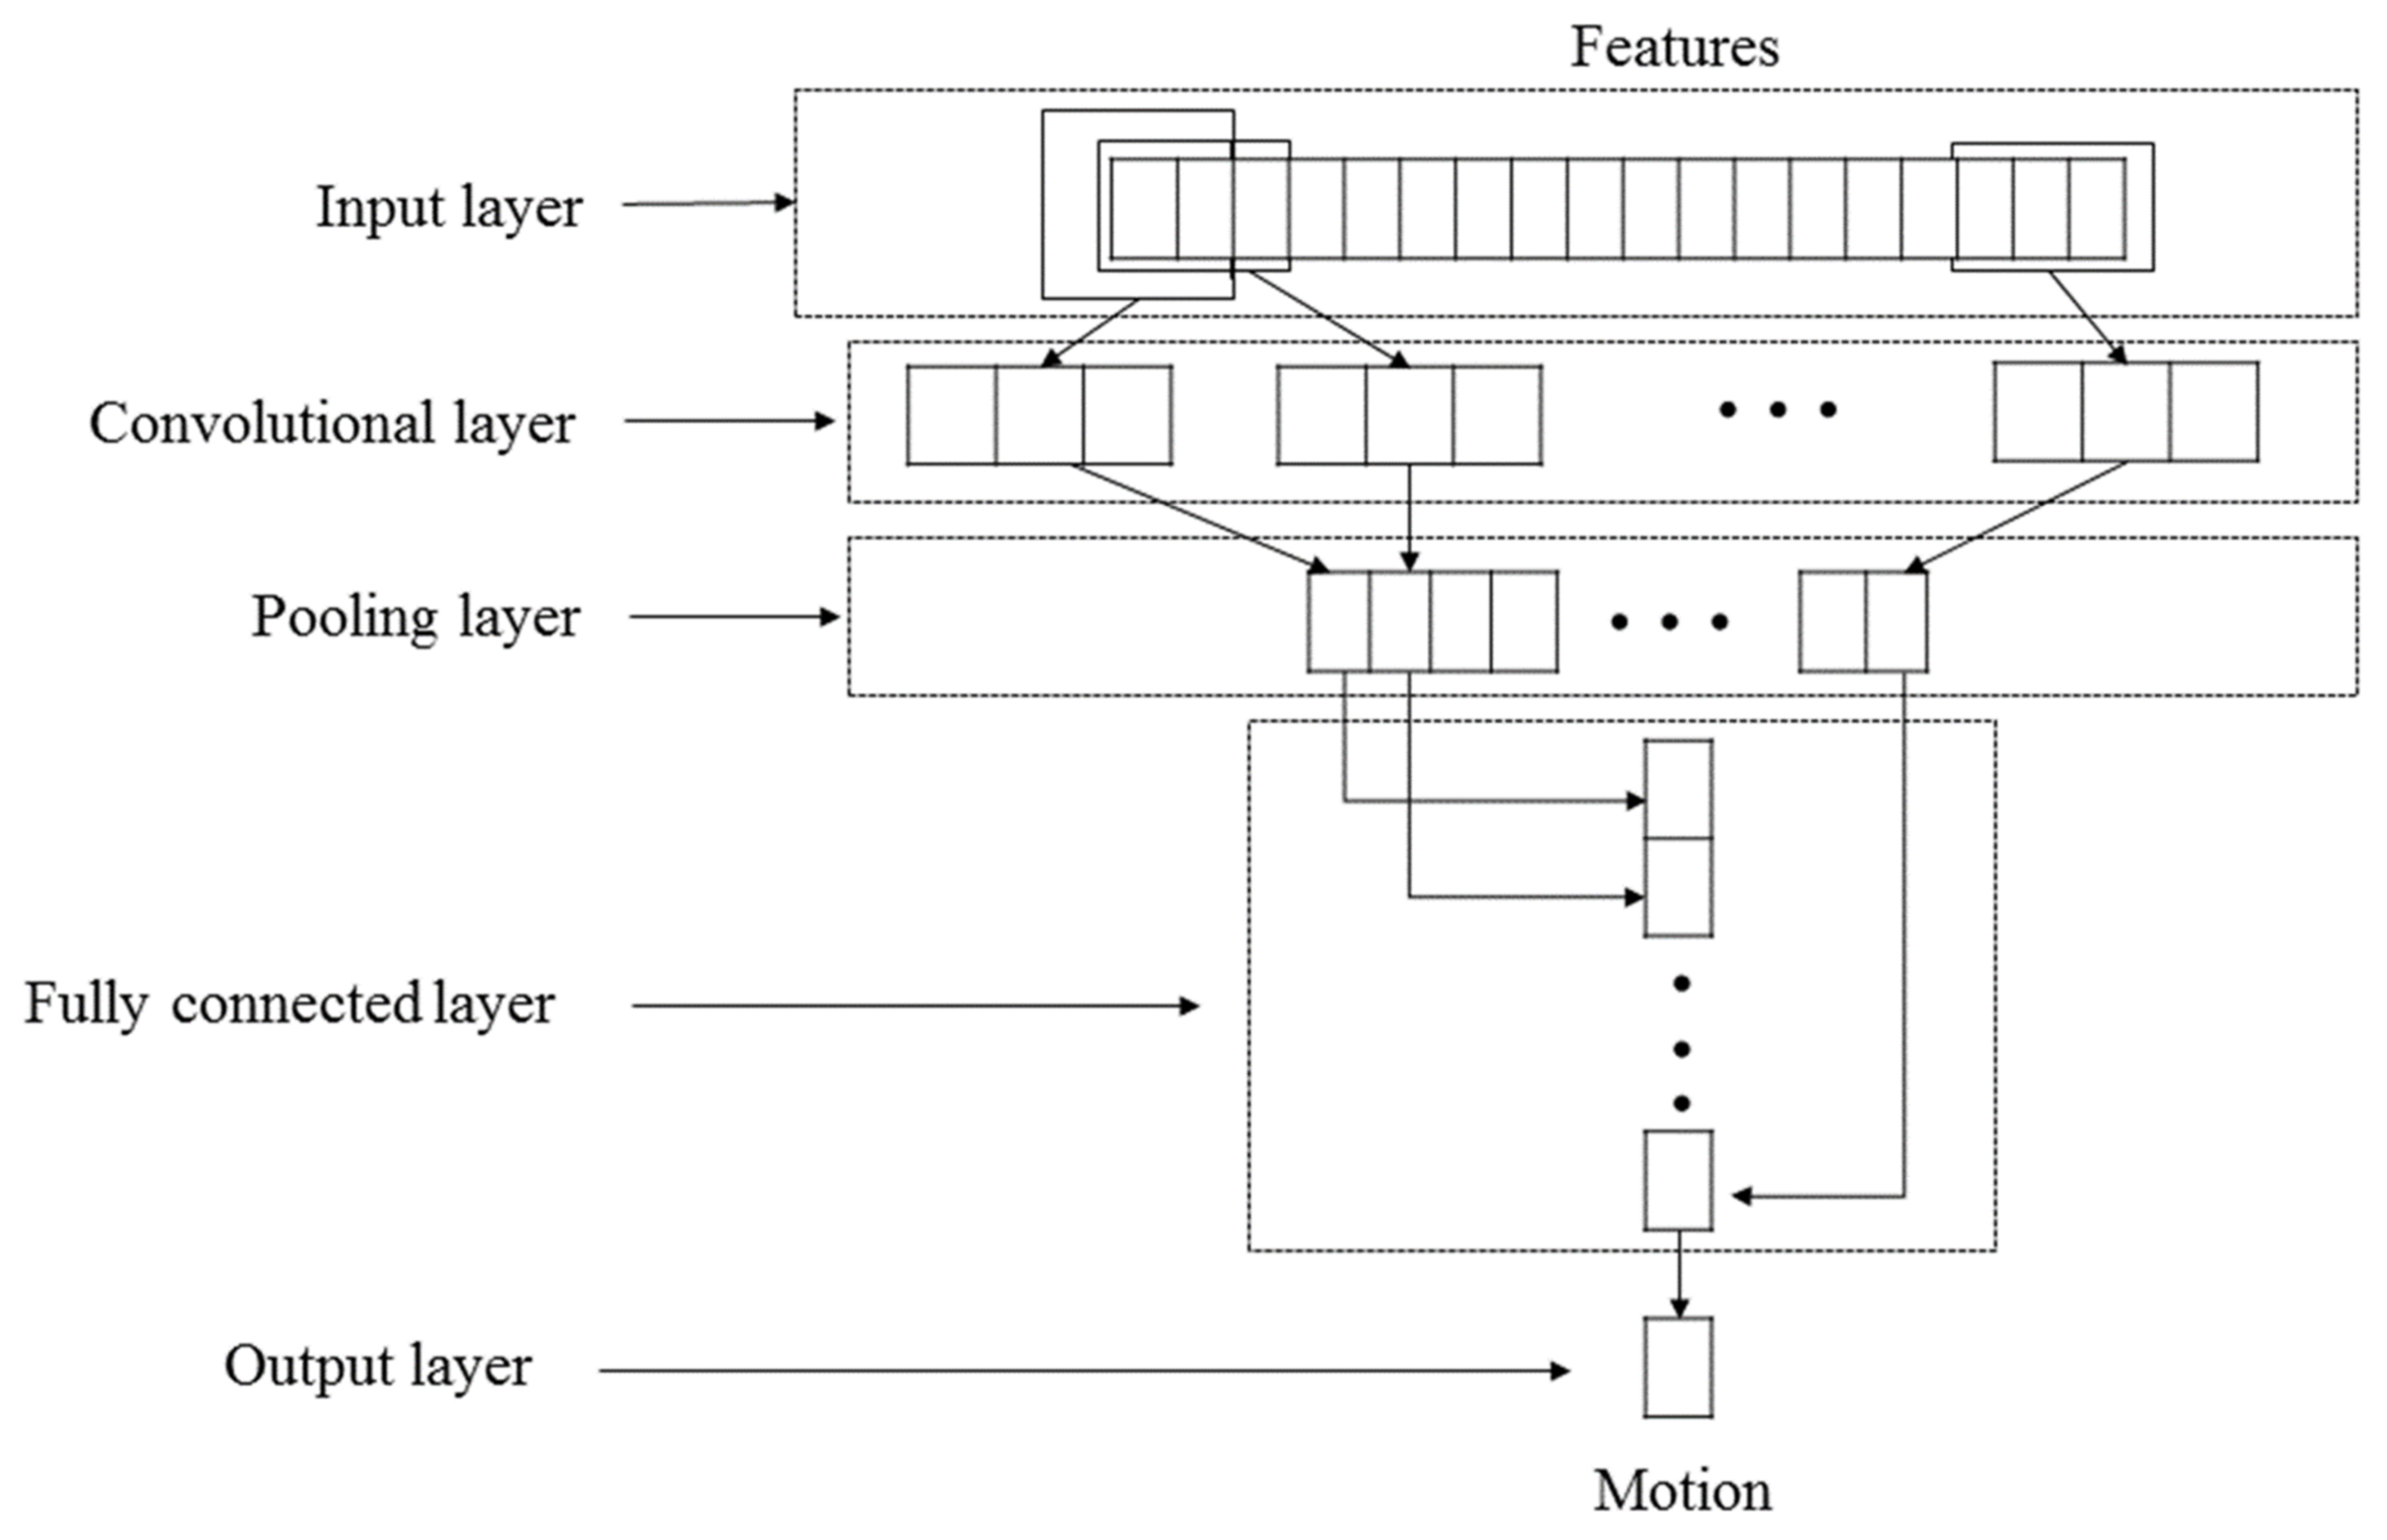
  • A BPNN has a large amount of calculation and processing time [45]. The RBFNN is also a kind of feedforward network that is trained by using a supervised training algorithm, but the calculation and processing time is lower than that of BPNN. The main advantage of the RBFNN is that it has only one hidden layer and uses the radial basis equation as the activation equation [46]. The basic architecture of RBFNN is the same as the basic architecture of BPNN, which contains three layers, namely input, hidden and output layers, as shown in Figure 4. Unlike BPNN, the Gaussian equation is used as the basic equation; therefore, in RBFNN, the general formula for the output of the RBFNN is expressed as follows:
    f ( x ) = i = 1 M w i exp ( x c i 2 d 2 )
7.
1D-CNN
CNN, one of the representative deep learning algorithms, is a Feedforward Neural Network with convolutional calculations and deep structure [47]. The main structure of CNN includes the input layer, hidden layer and output layer. There are main structures in the hidden layer: the convolutional layer, the pooling layer and the fully connected layer [47]. CNN can process data of different dimensions (1D-CNN, 2D-CNN and 3D-CNN). Among them, 1D-CNN can receive one-dimensional vectors through the input layer [48]. In this study, the extracted features were input into 1D-CNN as one-dimensional vectors for supervised learning. The basic architecture diagram of 1D-CNN is shown in Figure 5.

2.4.2. Evaluation

For a specific dataset, most studies use cross-validation and statistical testing to compare the performance of classifiers. Cross-validation can effectively use limited data to find suitable model parameters and prevent overfitting. In cross-validation, the dataset is grouped in a certain way: one part is used as the train set, and the other part is used as the test set. First, the train set is used to train the classifier, and then the test set is used to evaluate the classifier on the trained model. Cross-validation methods include K-fold cross-validation and leave-one-out validation. The commonly used 10-fold cross-validation was applied in this study. In this study, the classification results are presented in a confusion matrix and recognition accuracy. The confusion matrix shows the degree of confusion between different actions. The recognition accuracy is used to evaluate the classification effectivity of the classifier:
Accuracy = Number   of   correctly   classified overall   sample   size

2.5. Recognizing Motions of Baduanjin

In this study, motion recognition used the extracted features from the motion to train classifiers to classify motions. Different classifiers were applied, and their suitability was verified for the motion recognition of Baduanjin. The classifiers were the same as those used to assess motion accuracy, namely k-NN, SVM, NB, Logistic Regression, DT and ANN (BPNN and RBFNN). The method of motion recognition is similar to assessing the motion accuracy of Baduanjin.

3. Materials and Methods

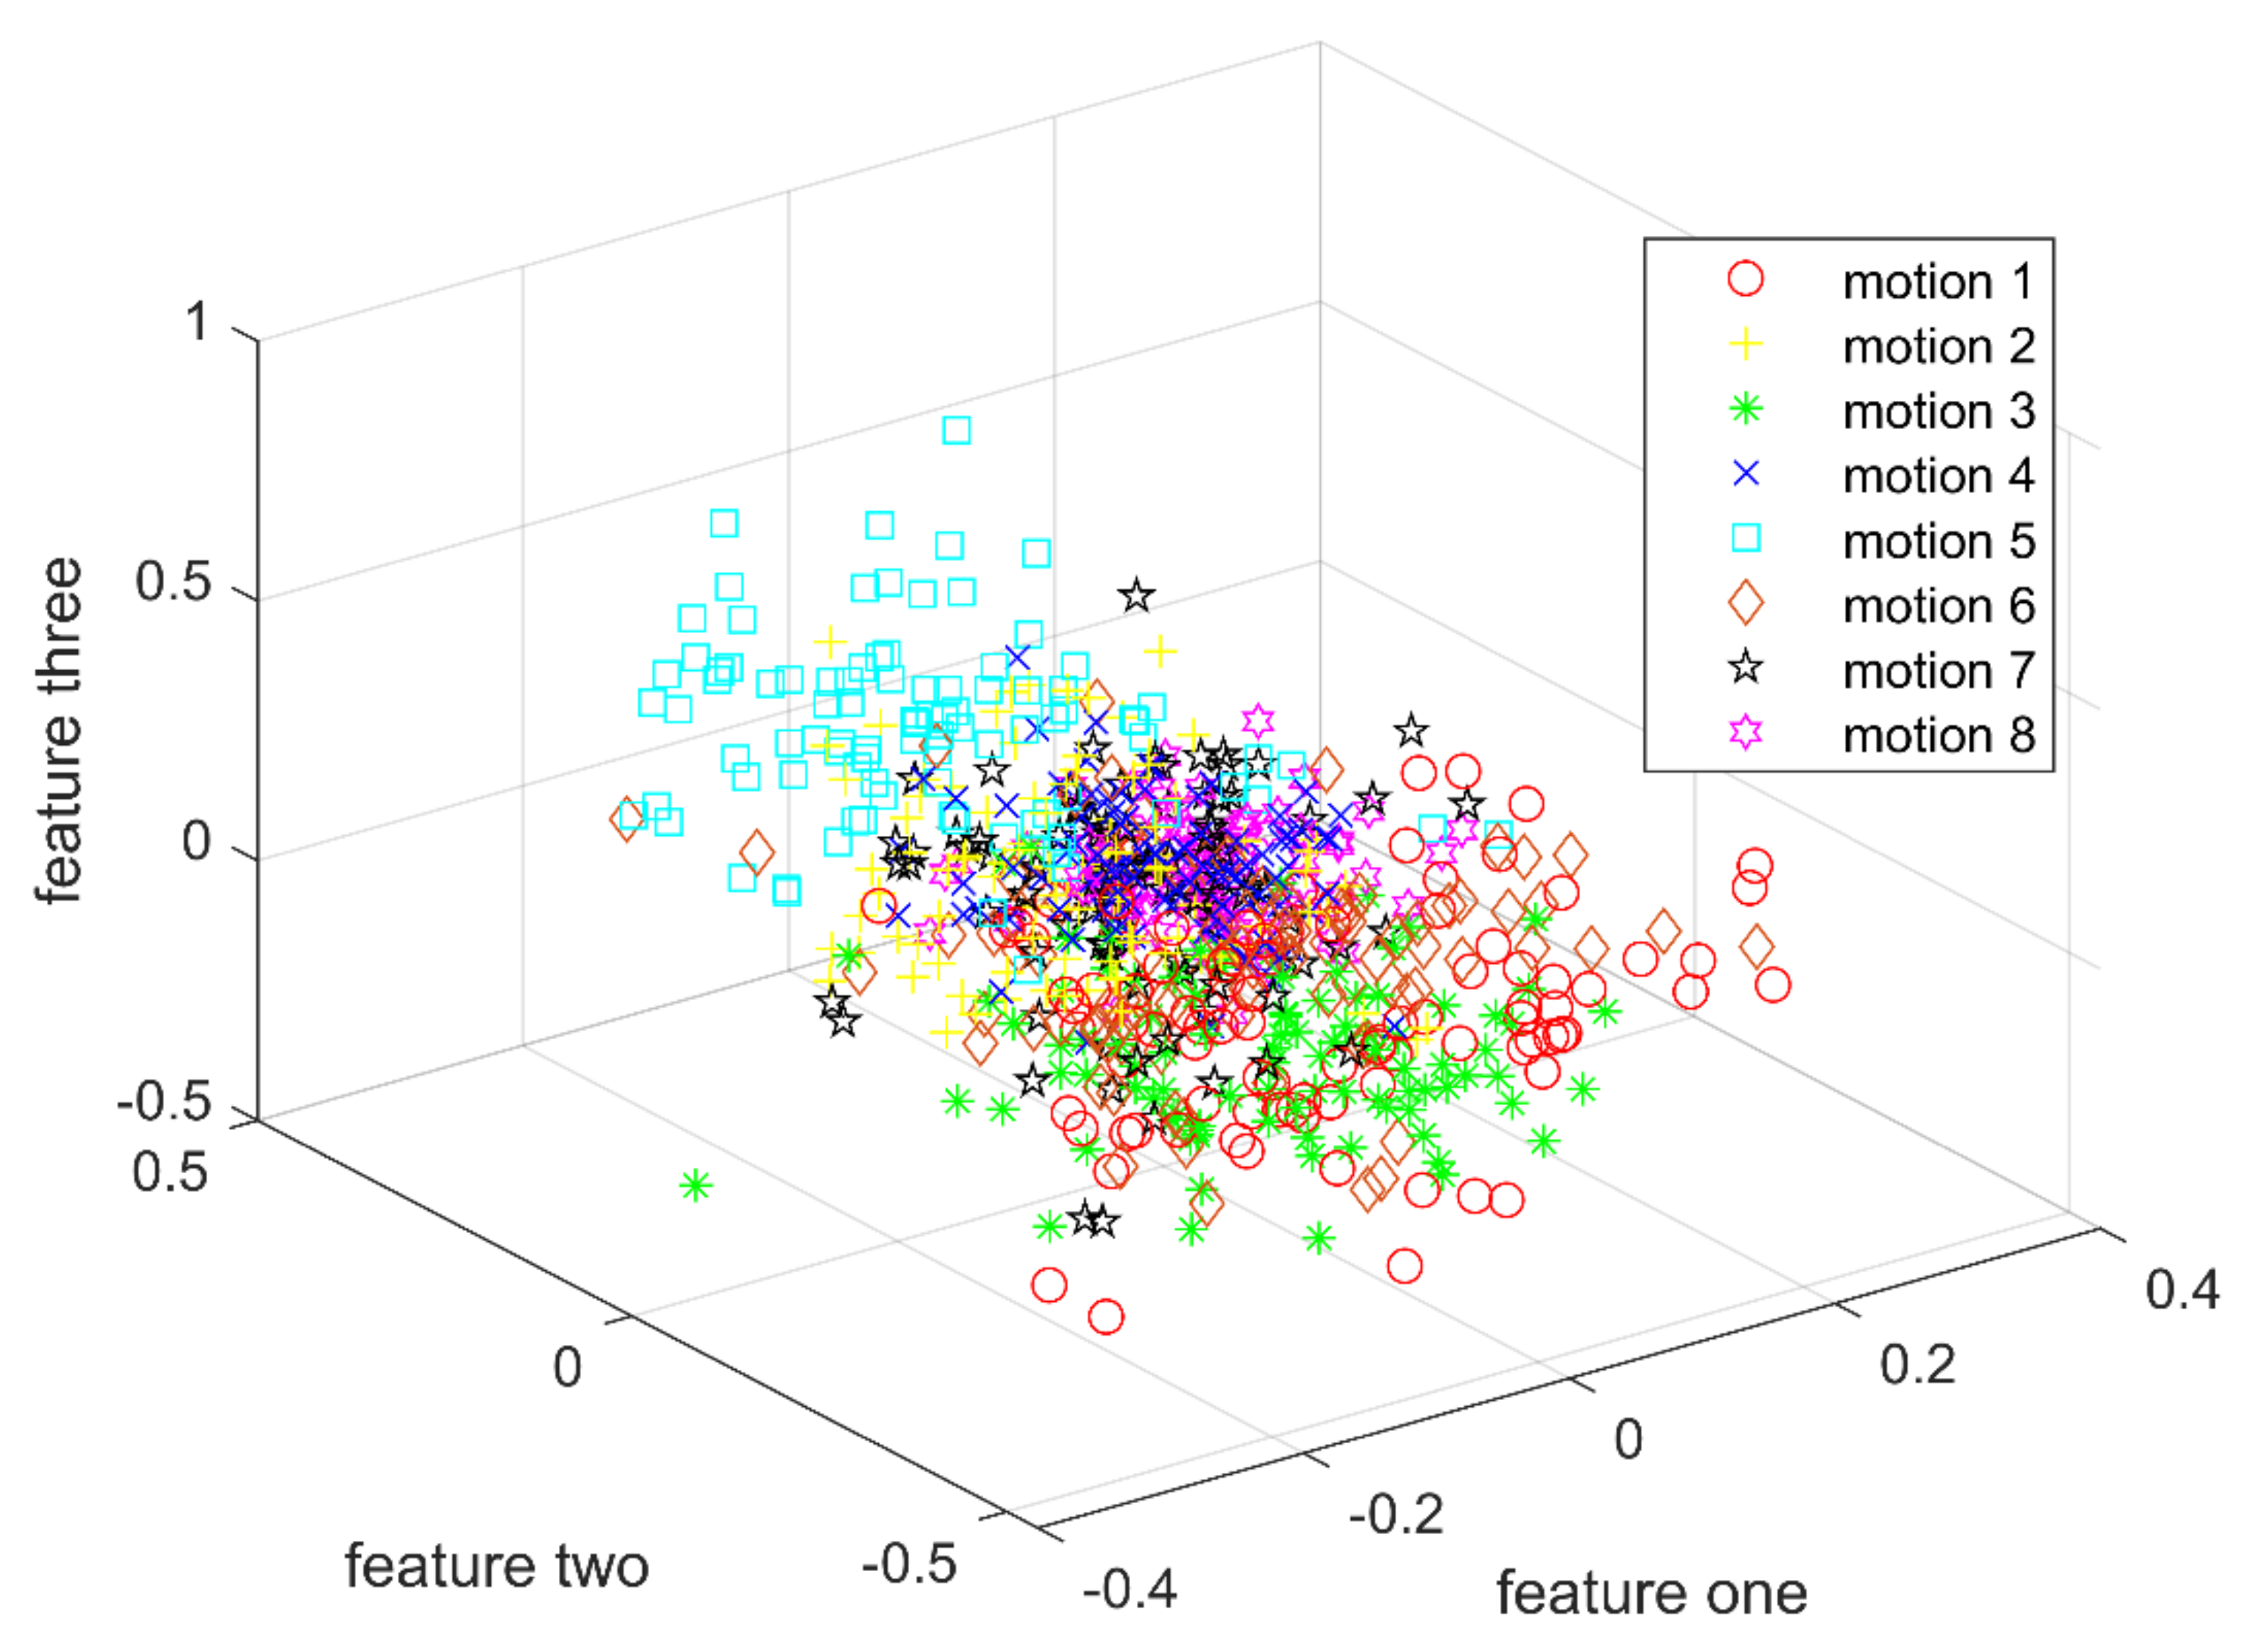
3.1. Extracting Features and Dimensionality Reduction

A total of 55 participants were recruited in two batches to participate in the study. In the first batch, 20 participants were recruited to collect the IMU data with 60 sets (three times for each participant). In the second batch, 35 participants practiced Baduanjin motions once to measure motion data. Thus, a total of 95 sets of data with a dataset of 95-set × 8-motions = 760-motions. All participants gave their informed consent for inclusion before they participated in the study.
There were 17 skeleton points measured by Perception Neuron 2.0 used in this study. The features extracted by a motion sequence are 306. By using PCA to reduce the dimensionality of features with the error is less than 5%, the dimension can be reduced from 306 to 96. The first three features of the eight motions of Baduanjin are shown in Figure 6.

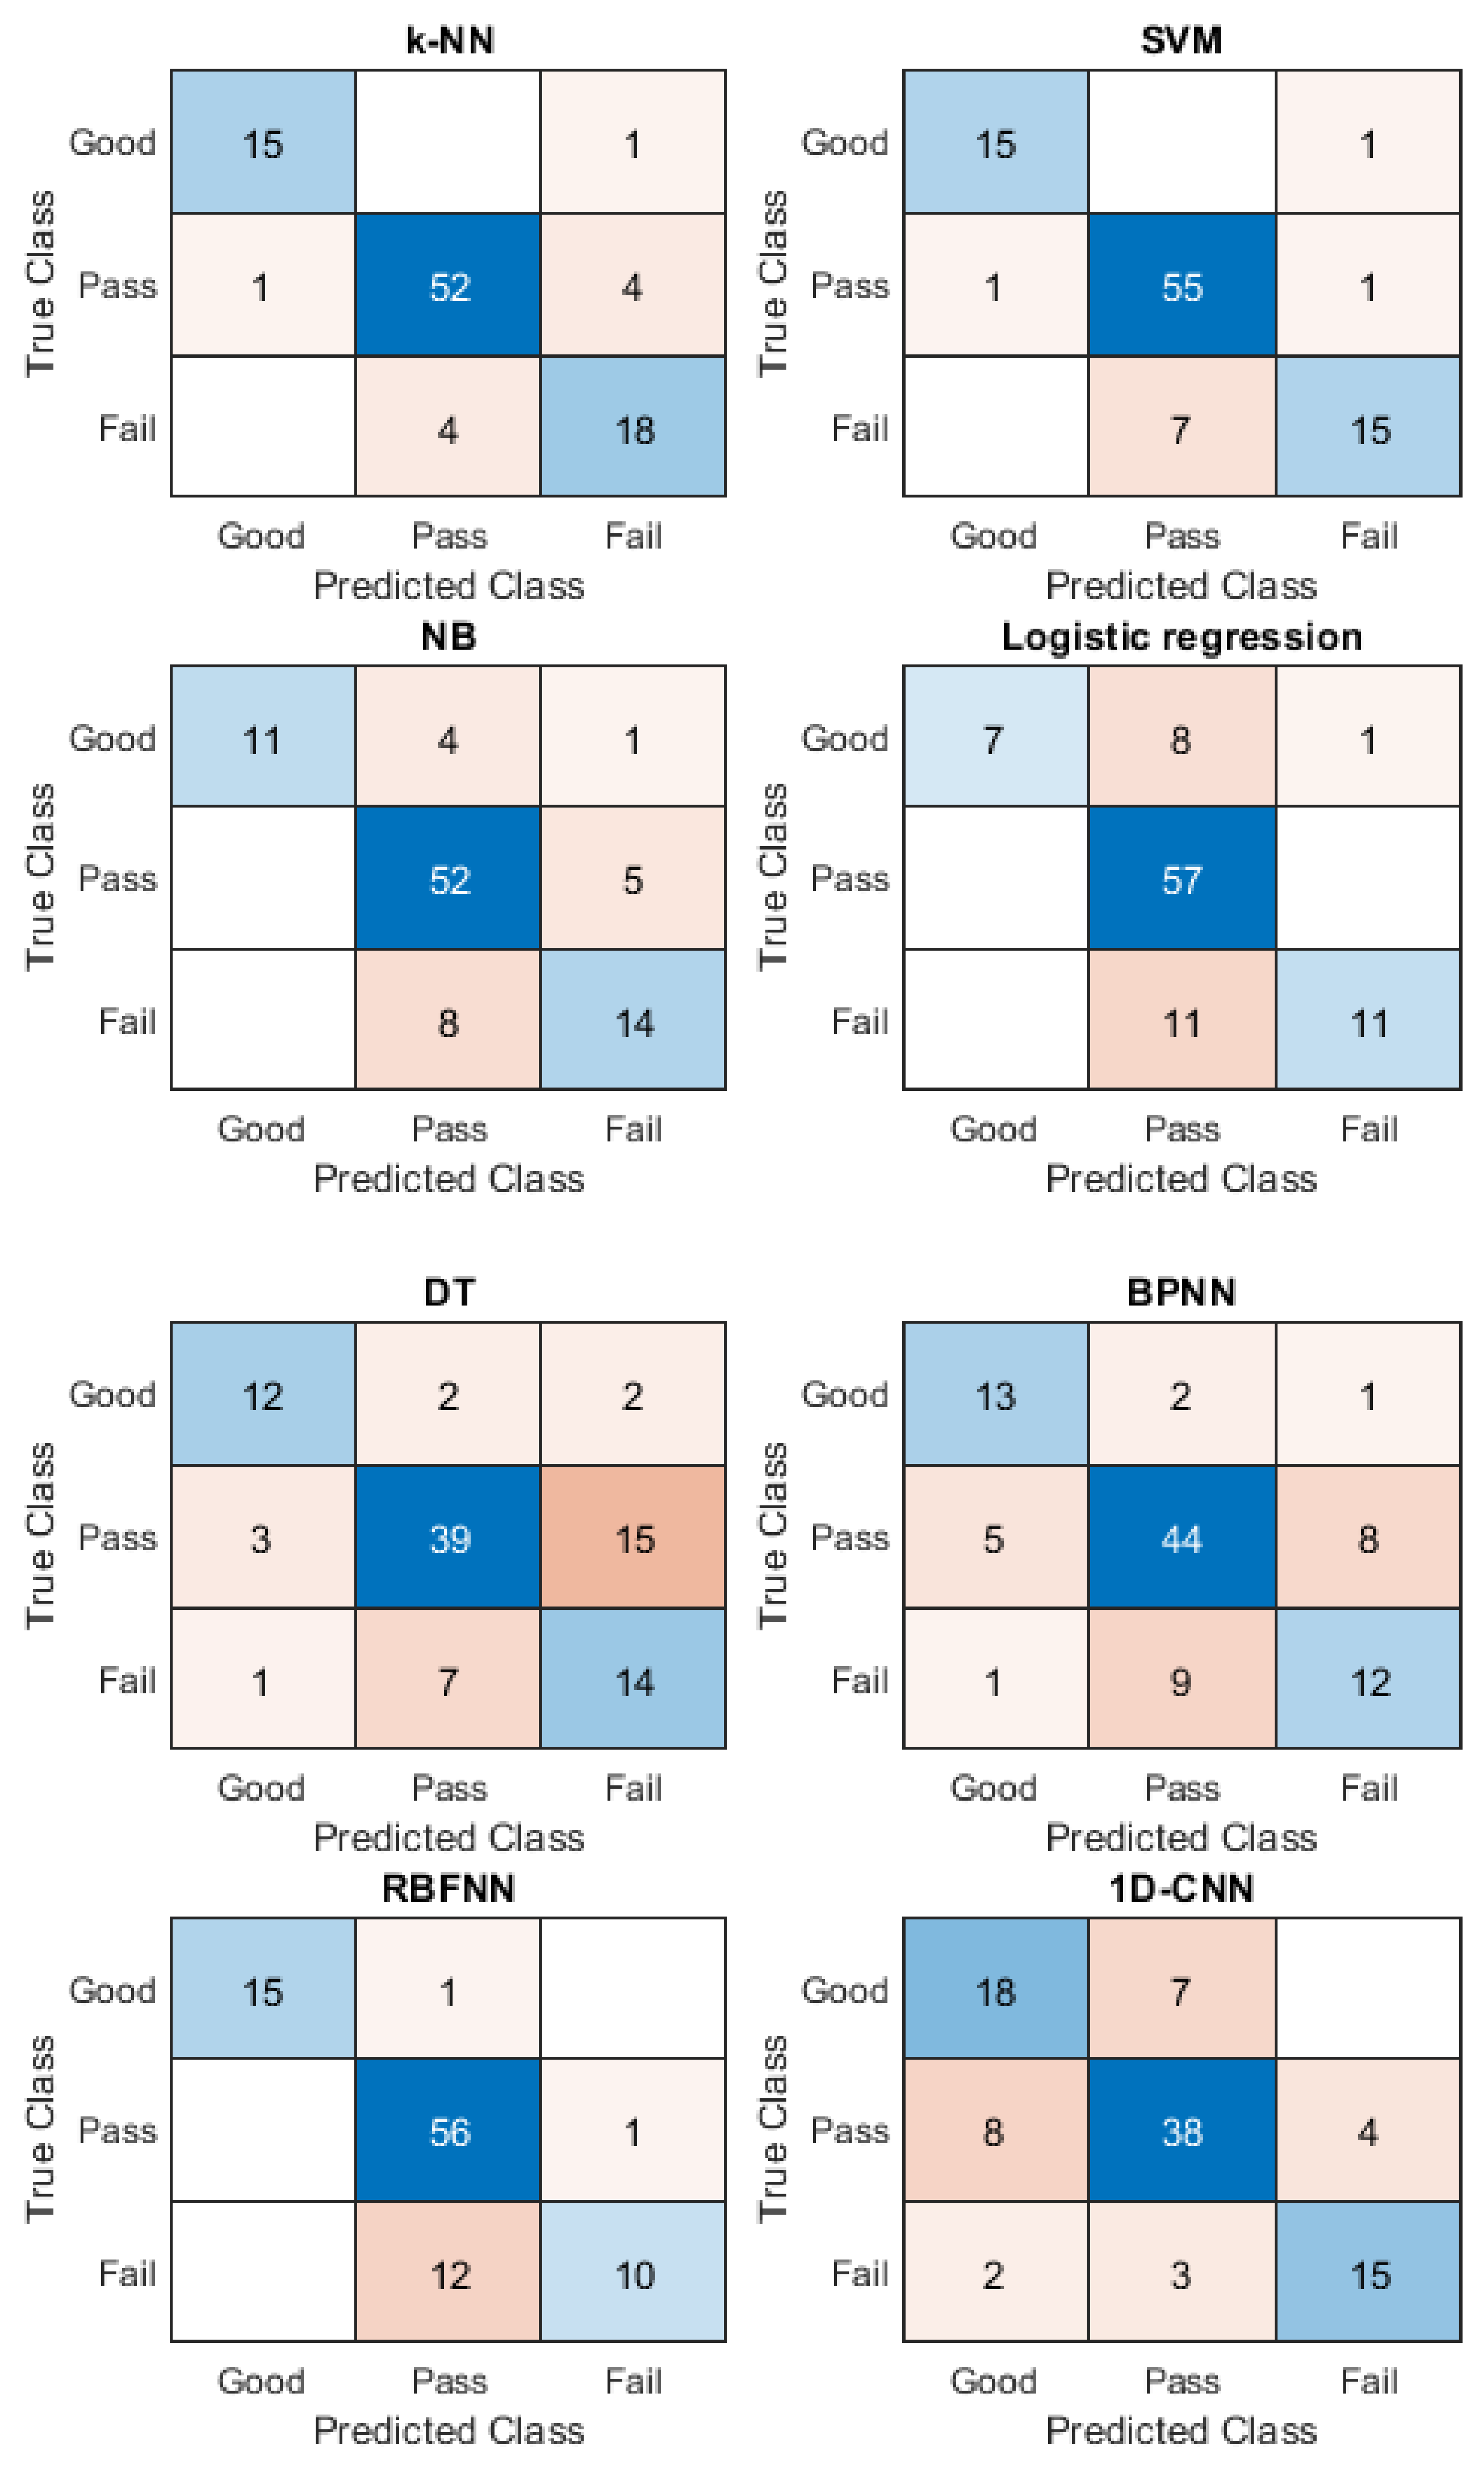
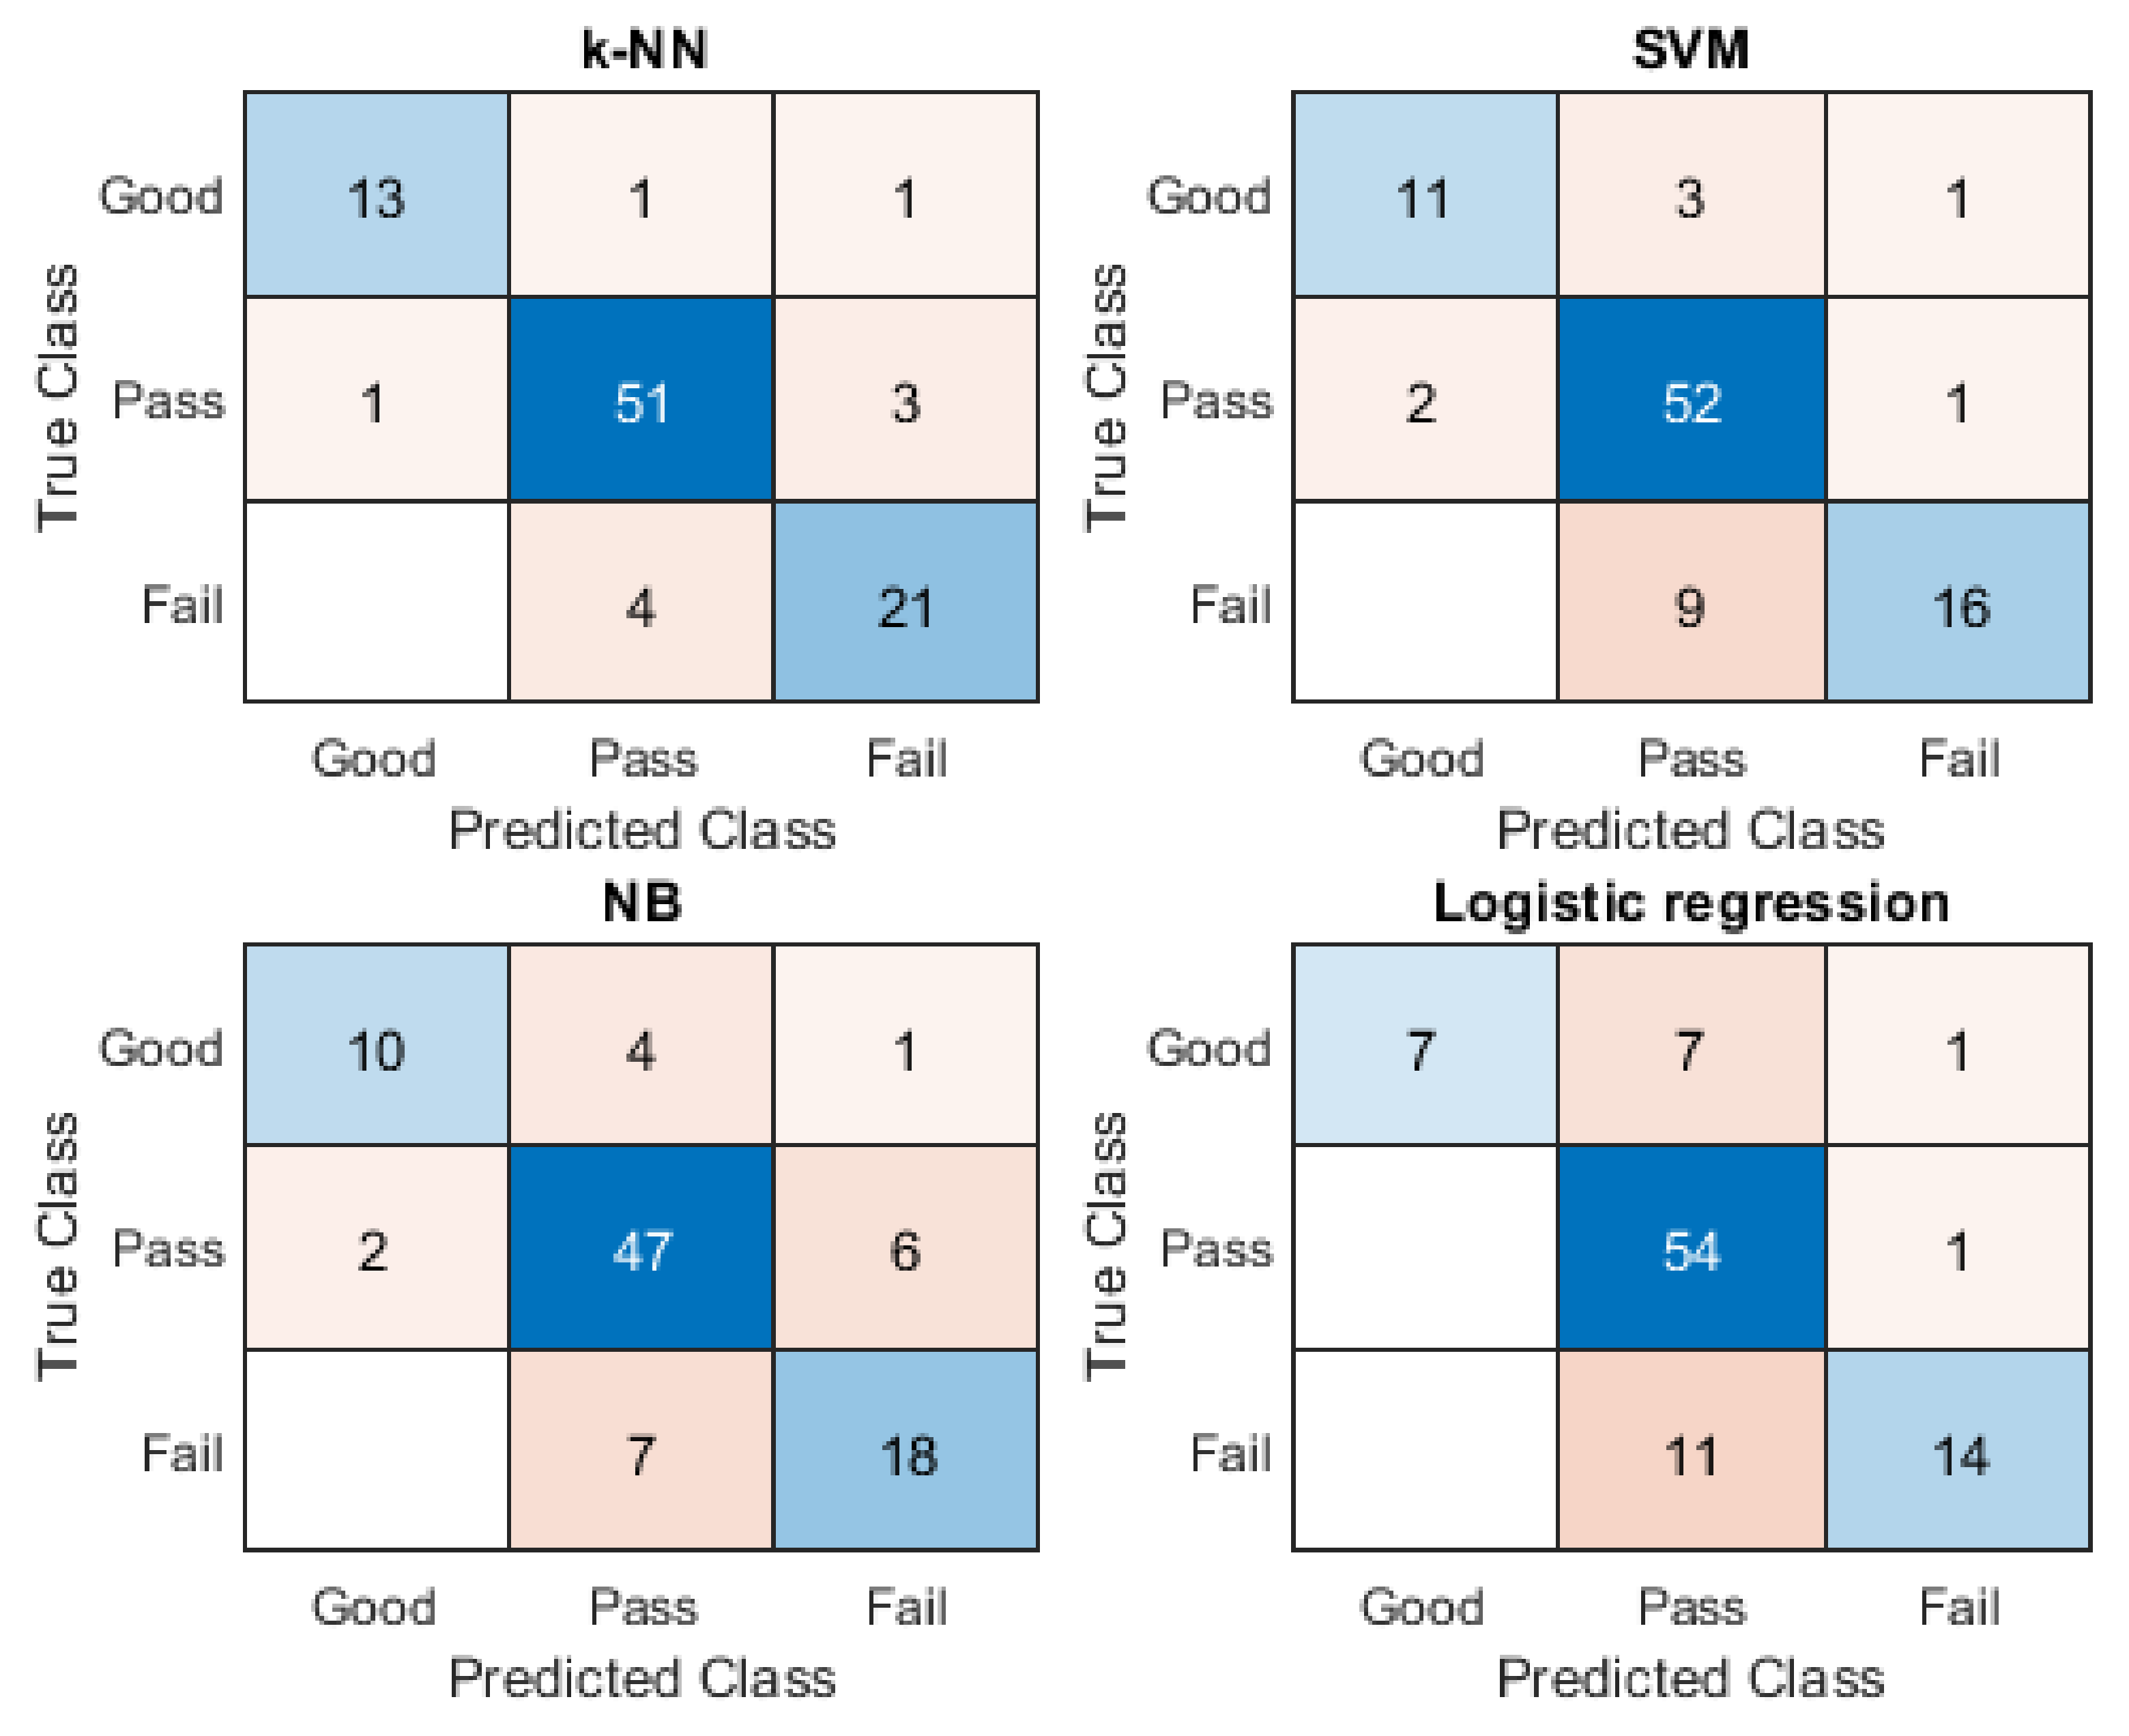
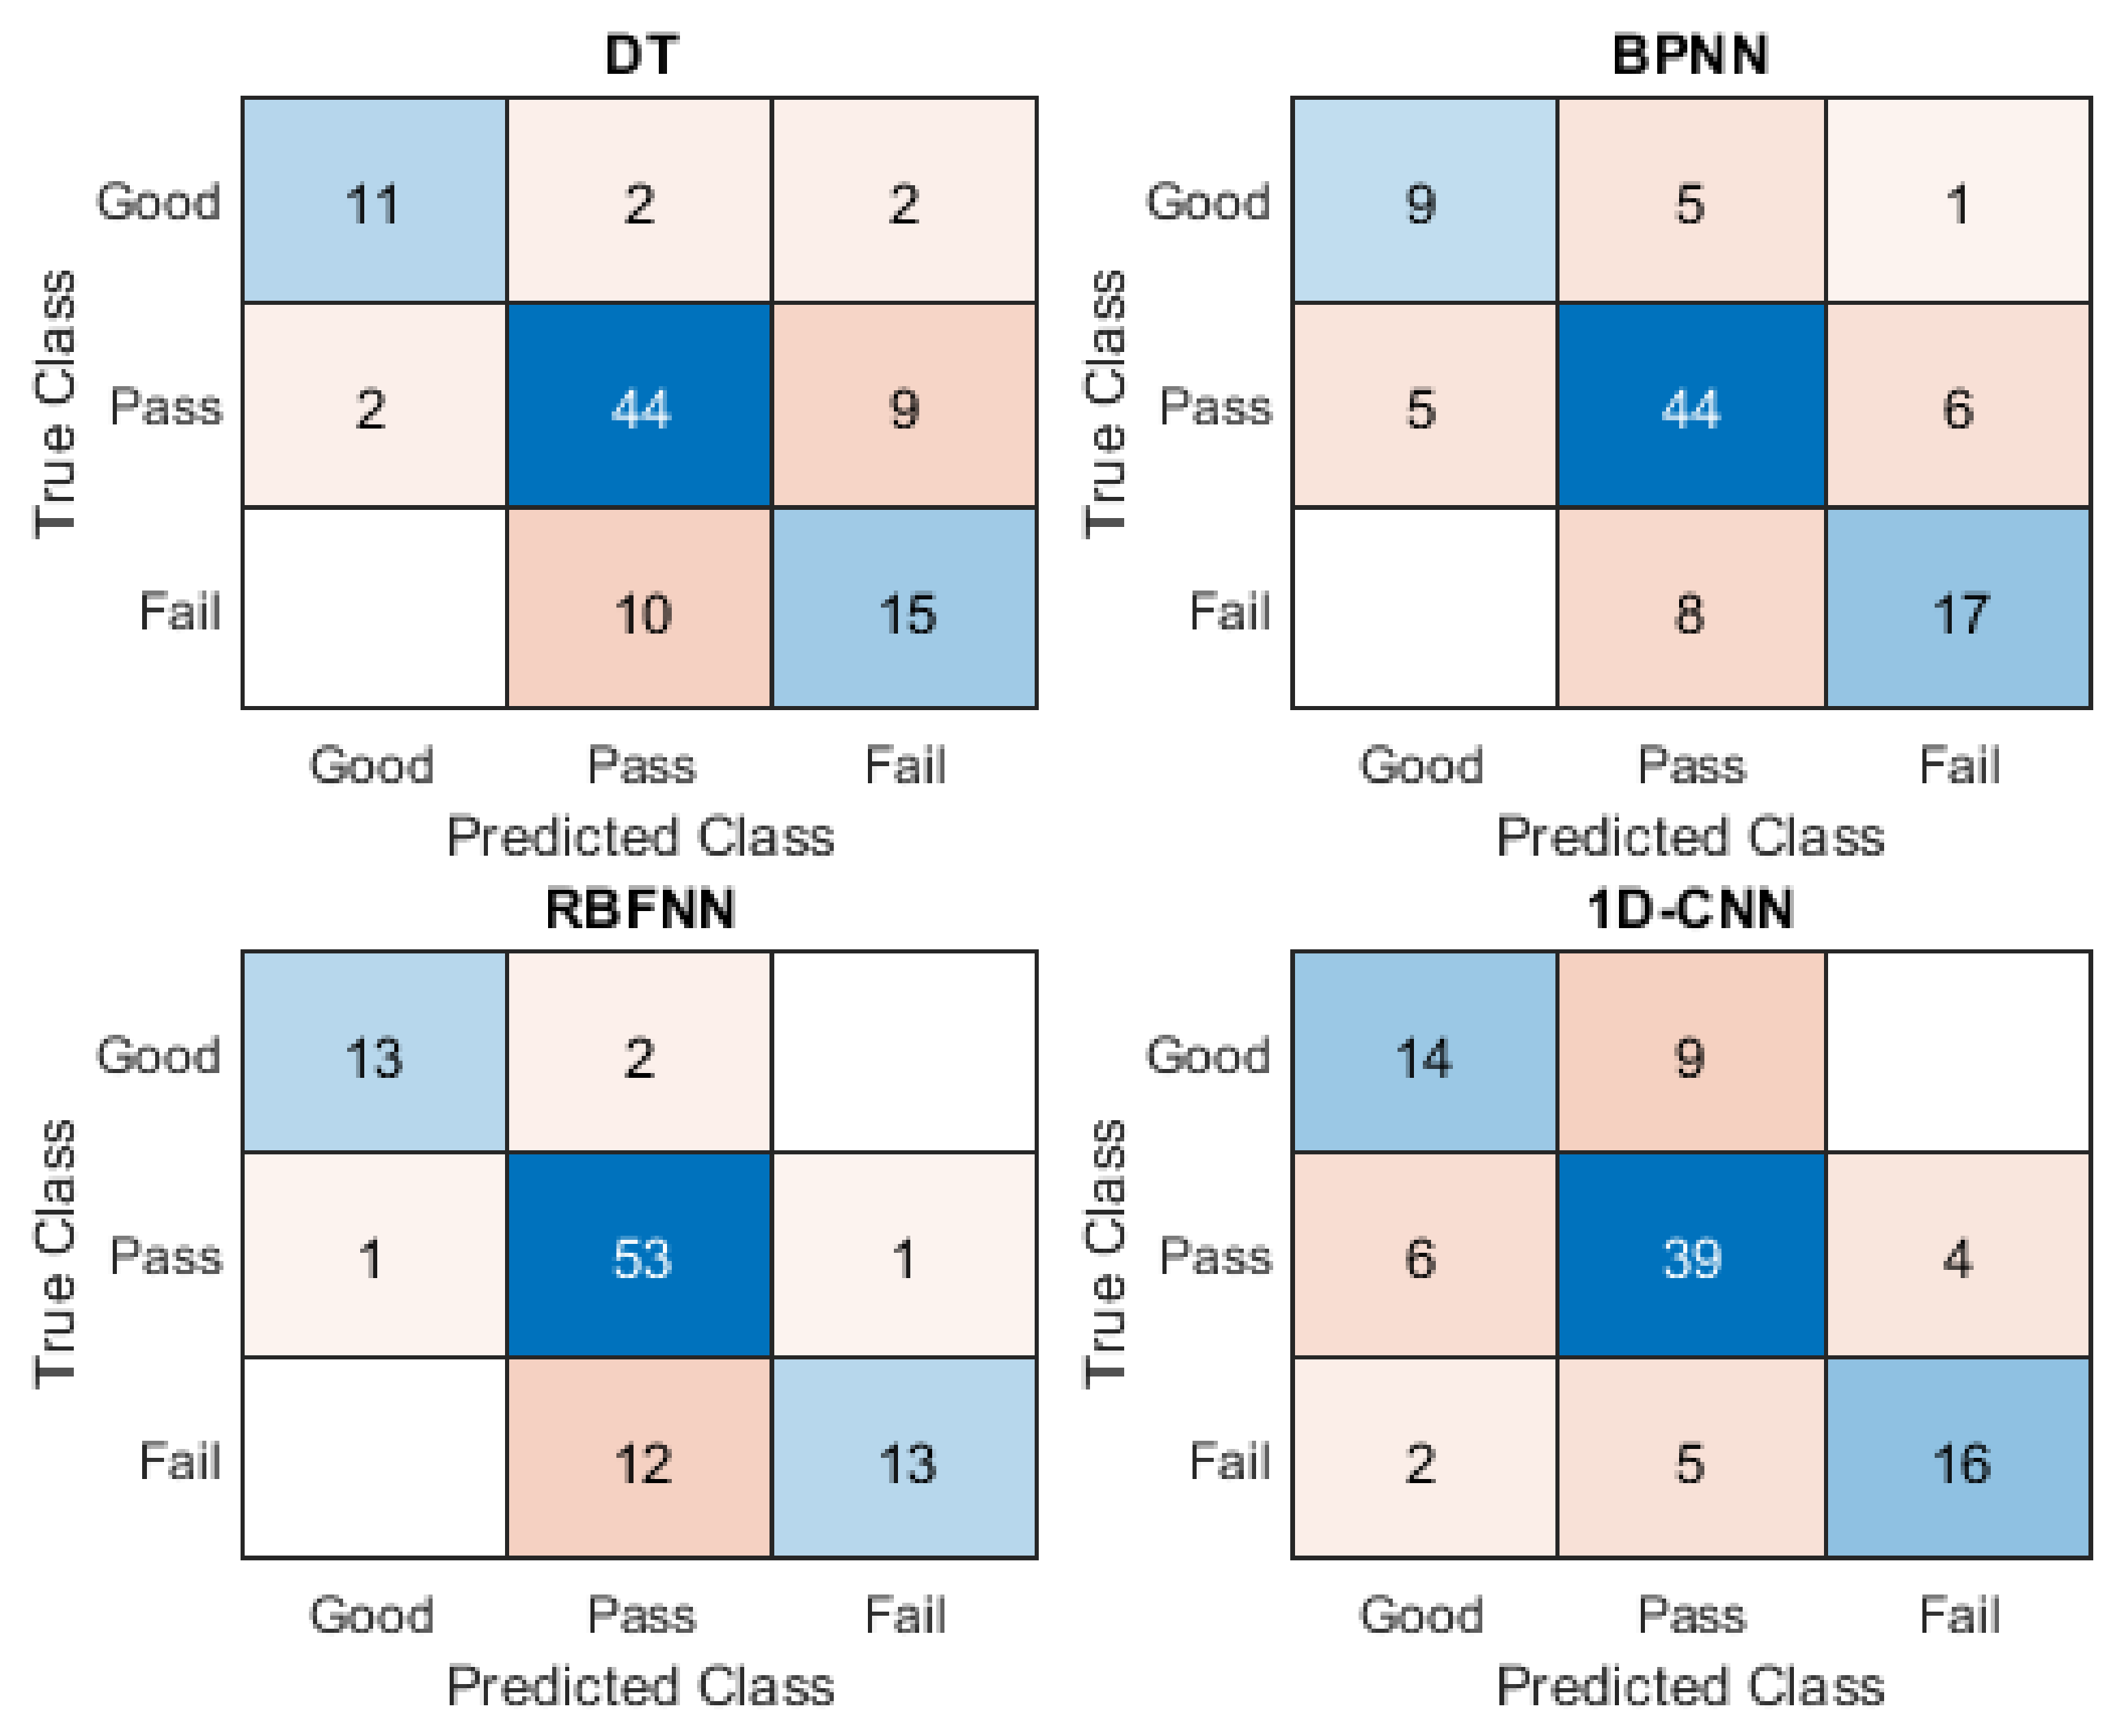
3.2. Assessing Motion Accuracy of Baduanjin

Before performing the motion assessment, two traditional Chinese sports teachers from a university in Southwest China were invited to give the scores for the motion accuracy. The teachers have more than ten years of experience teaching Baduanjin in the university, and they were required to score each student’s motion based on recorded videos. Each motion was scored according to three categories: Fail, Pass and Good. To ensure the consistency of assessment, the Kendall correlation coefficient test was used to calculate the correlation between scores on motion accuracy of students from the two teachers. The results are shown in Table 2.
From Table 2, we can see that the captured motions of Baduanjin from students have three different levels of motion accuracy, namely Fail, Pass and Good, except for Motion-8, where no student failed in this motion. According to the two teachers, this is because Motion-8 is the simplest motion in Baduanjin and easy to learn (Figure 7). Students can master the essentials of Motion-8 through short-term learning, but long-term practice is needed to achieve high motion accuracy. Moreover, the Kendall coefficient between the scores from the two teachers ranged from 0.824 (Motion-3) to 0.944 (Motion-7). This result indicates that the two teachers have a high degree of consistency in the scores of the students’ motion accuracy.
On scores of teachers, through the application of 10-fold cross-validation, the effectiveness of different classifiers was trained and verified to assess the motion accuracy. The accuracy of motion assessment of different classifiers, using scores from Teacher A, is shown in Table 3. Using Motion-1 as an example, the confusion matrices for different classifiers for Motion-1, using scores from Teacher A, are shown in Figure 8.
The accuracy of motion assessment of different classifiers, using scores from Teacher B, is shown in Table 4. Using Motion-1 as an example, the confusion matrices for different classifiers for Motion-1, using scores from Teacher B, are shown in Figure 9.
Table 3 and Table 4 show that, where the scores of Teacher A and Teacher B were used as the supervision for training classifiers, k-NN has the best accuracy for all types of motions, except for Motion-7. The accuracy for motion assessment on all motions (except Motion-7) is over 86%. However, for assessing the motion accuracy of Motion-7, the results show that SVM has the highest accuracy, reaching 95.79% (for Teacher A) or 87.37% (for Teacher B). It is found from the confusion matrixes that, for the classifiers, k-NN and SVM, which achieved higher accuracy, the confusion in the assessment of motion accuracy on Motion-1 mainly occurs between Pass and Fail.
Besides the accuracy of evaluation, for practical applications, the processing time for each classifier is verified in this study. The processing time of different classifiers for evaluating motion accuracy is shown in Table 5.
For the processing time from Table 5, the processing time of k-NN is the shortest among the eight classifiers (the processing time is 0.008 s). Moreover, the processing time of SVM is the second longest, which needs 4.751 s to complete the calculation.

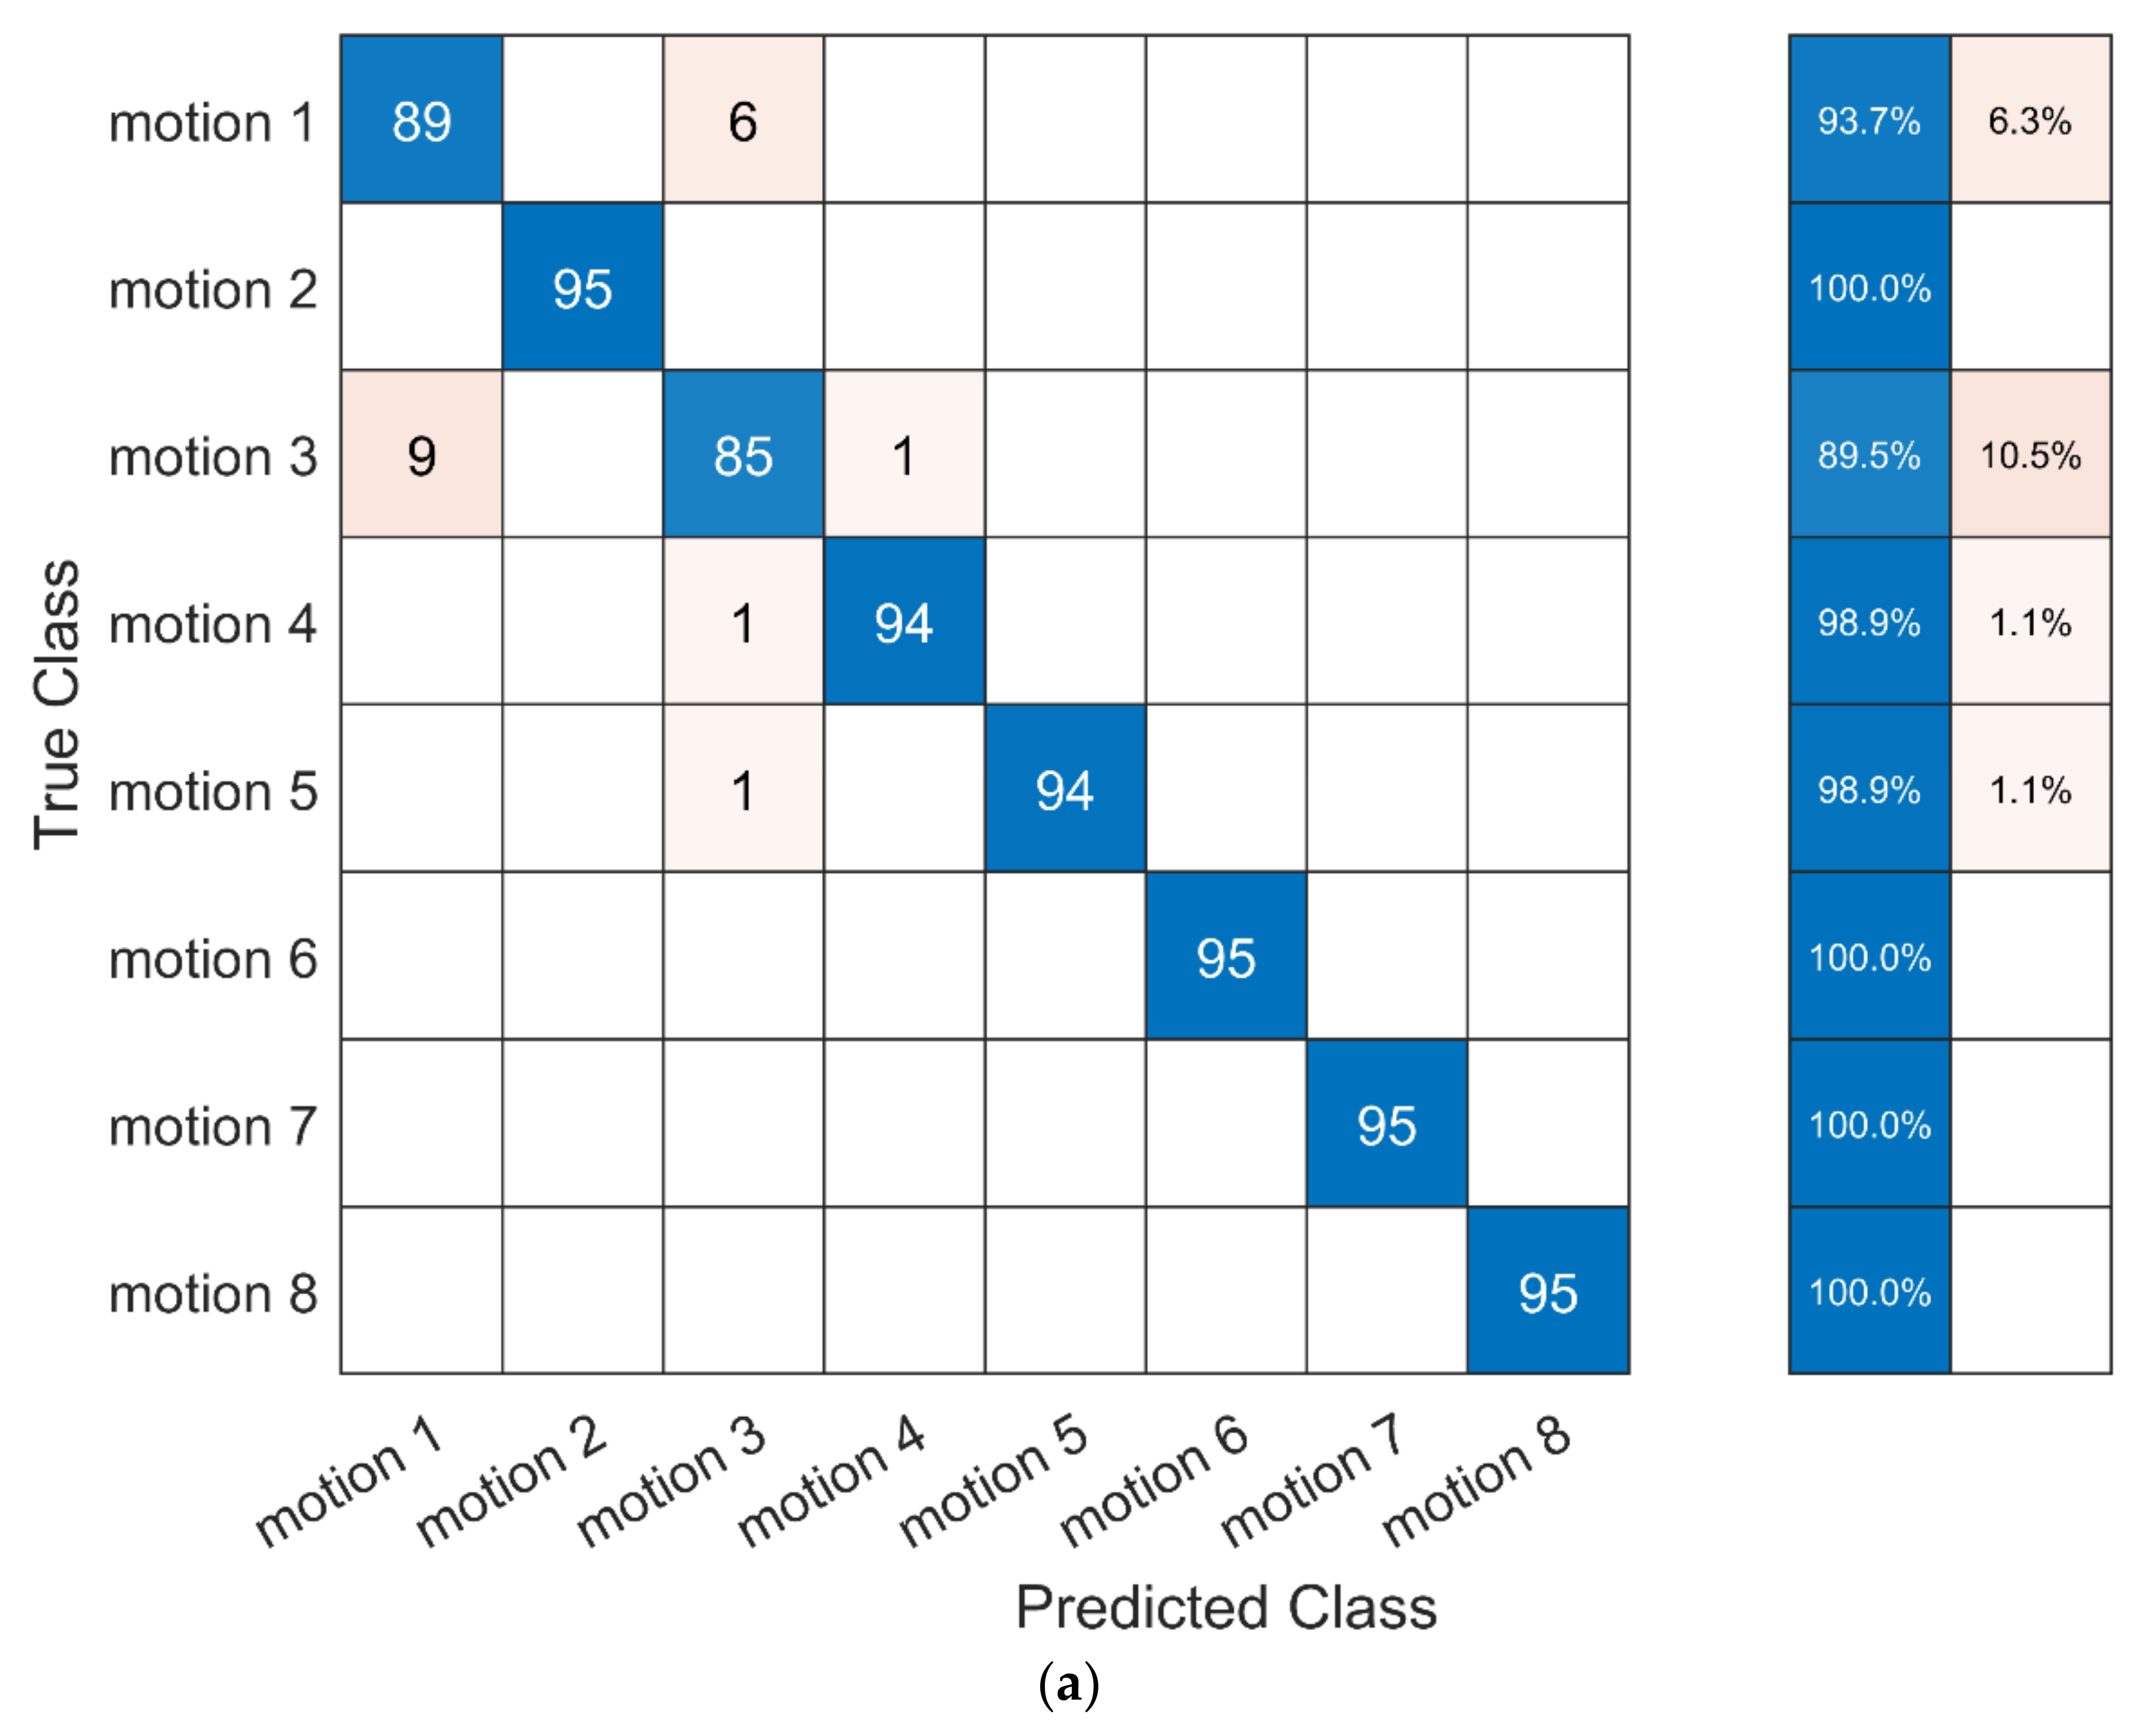
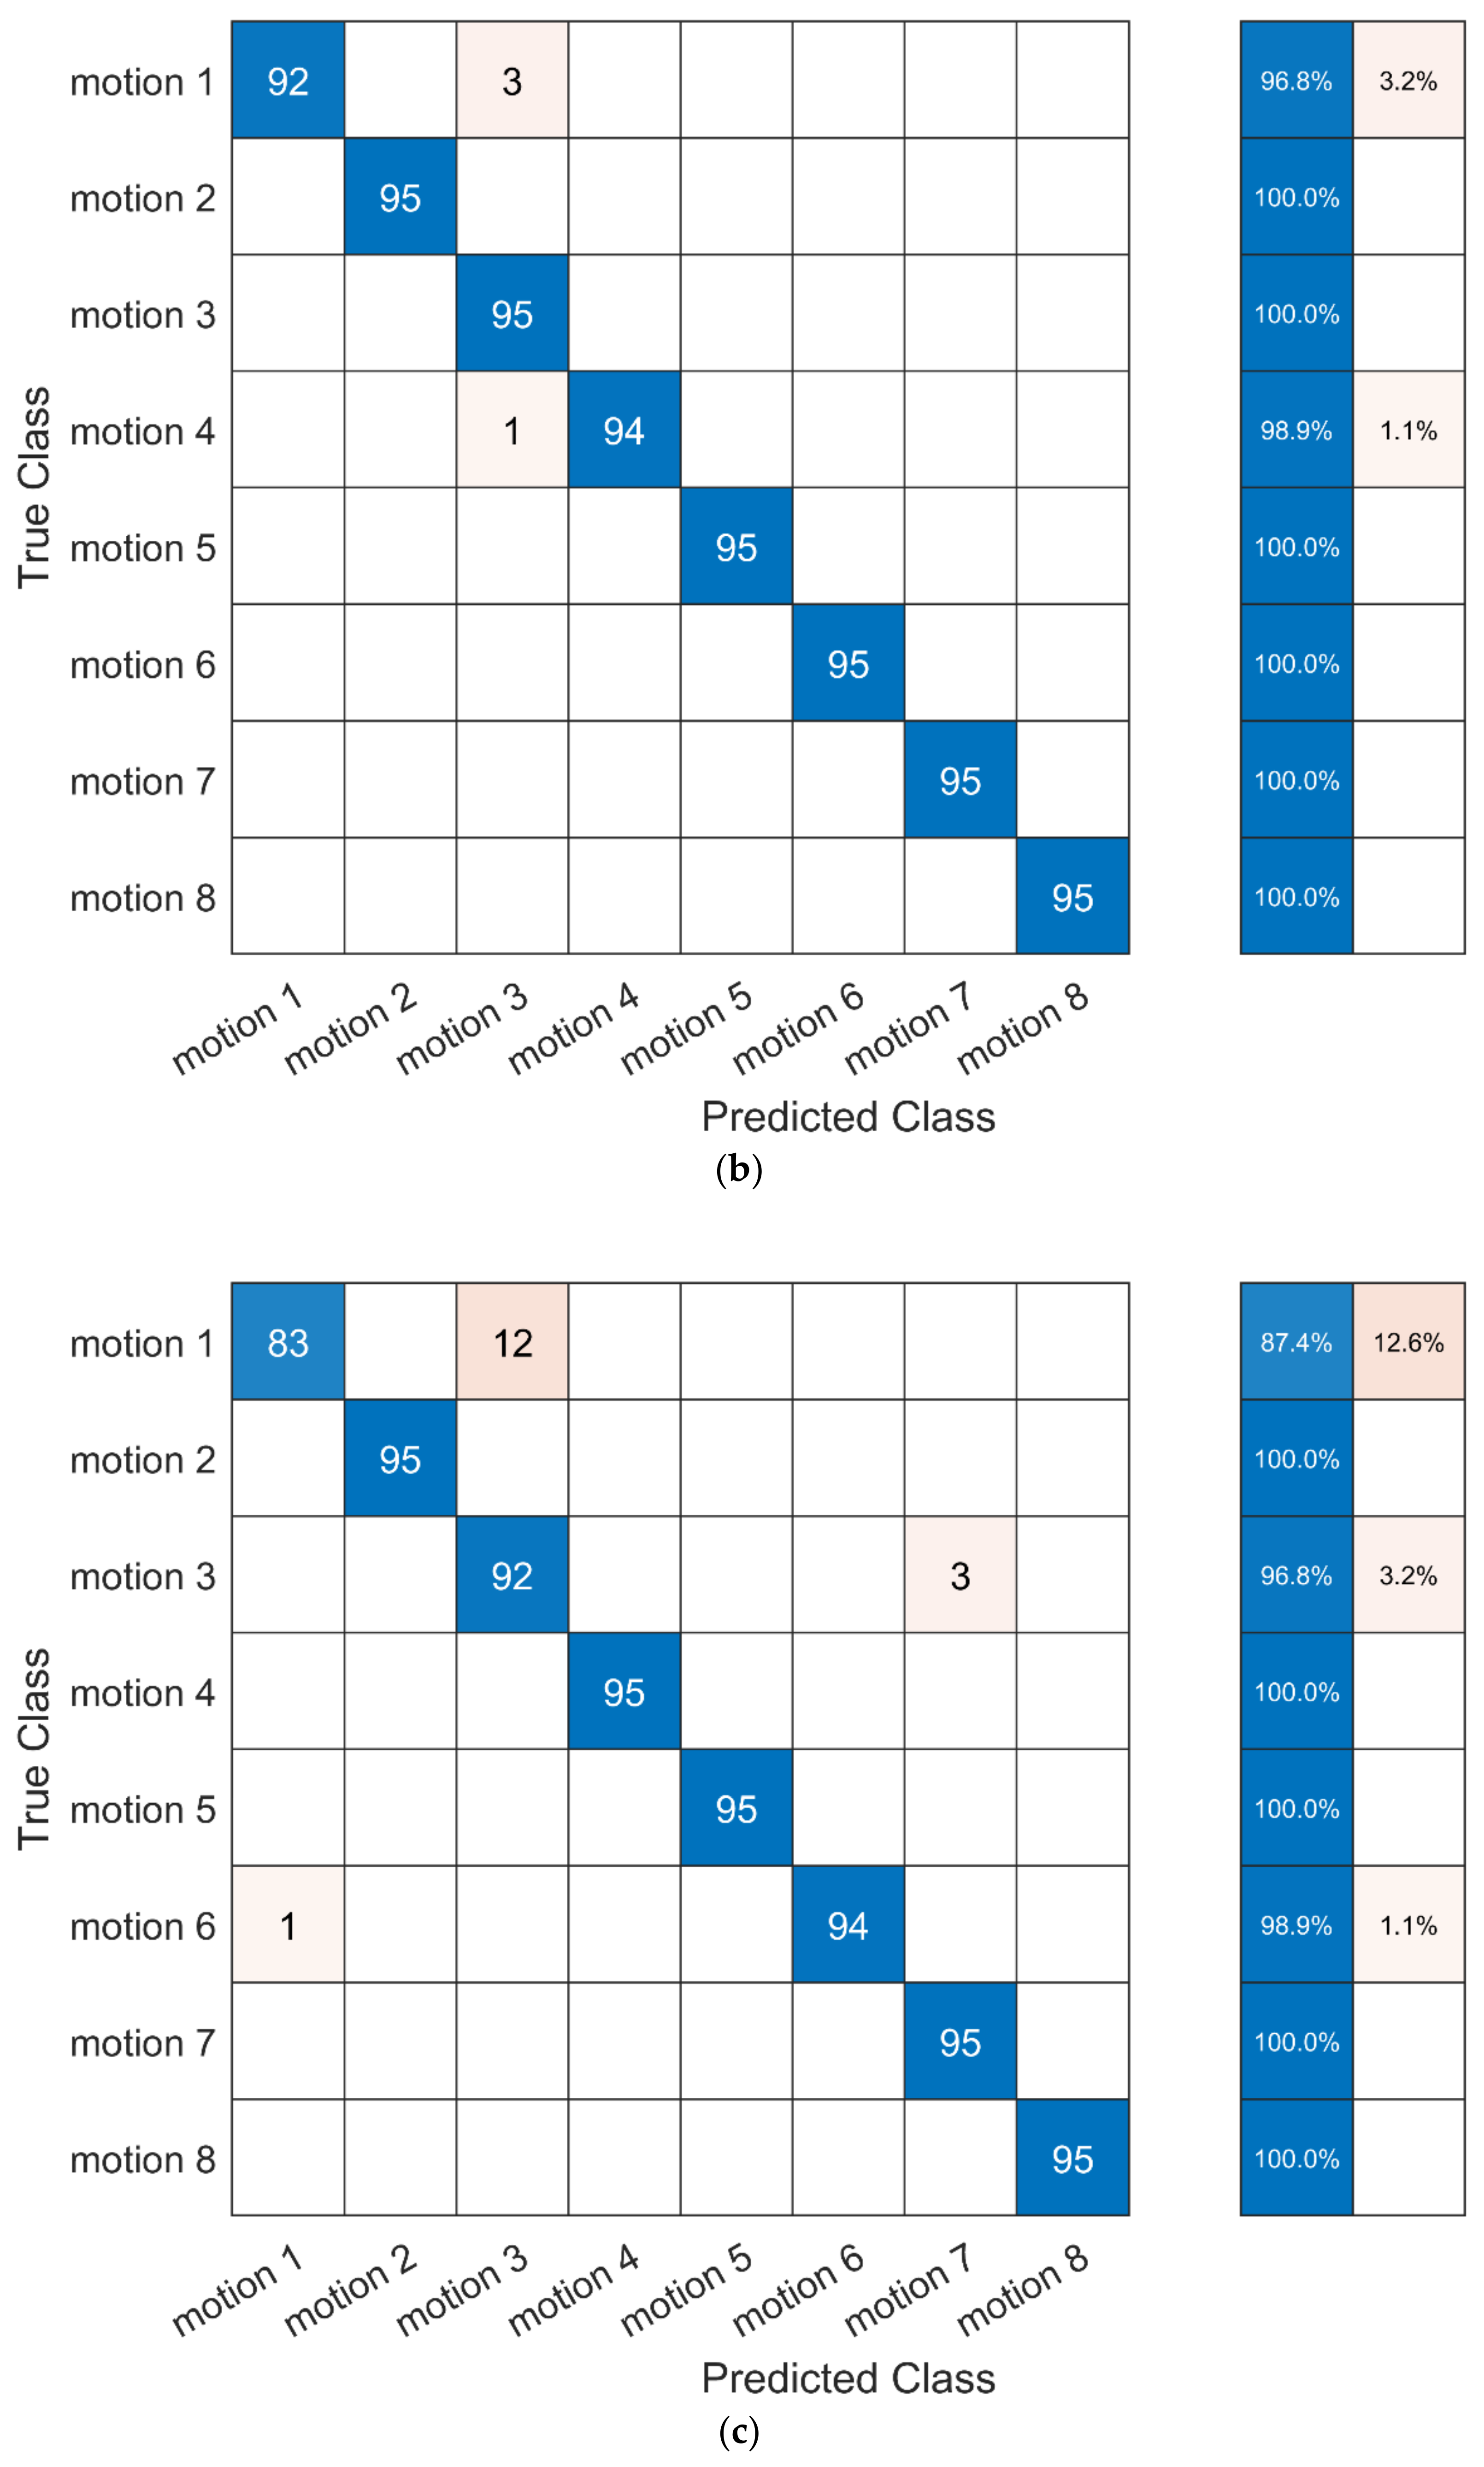
3.3. Recognizing Motions of Baduanjin

Applied 10-fold cross-validation, accuracy and processing time of motion recognition on different classifiers are shown in Table 6. The confusion matrices of motion recognition on different classifiers are shown in Figure 10.
Table 6 and the confusion matrixes in Figure 10 show that, among the eight different classifiers, the accuracy of motion recognition of Baduanjin by four classifiers is over 95%. Overall, 1D-CNN has the highest recognition accuracy, with 99.74%. The recognition accuracy of 1D-CNN for all motions is between 98.9% (motion 1 and motion 3) and 100%. However, the two classifiers of ANN were not satisfactory (86.97% and 75.53%), as they did not reach 90% accuracy. Furthermore, from the confusion matrix, it is found that, for classifiers with high accuracy (k-NN, SVM, NB, Logistics regression and 1D-CNN), the confusion between motions mainly occurs between Motion-1 and Motion-3. The reason could be that Motion-1 and Motion-3 are mainly upper-limb movements and relatively similar.
In terms of processing time for the motion recognition, k-NN recorded the shortest time among the eight classifiers (0.055 s). In contrast, the longest processing time is 1D-CNN (80.958 s), followed by SVM (0.917 s).

4. Discussion

When students learn the motions of Baduanjin, it would be advantageous to know the accuracy of the motions in real time, so that they can make the correction immediately. However, due to the high student–teacher ratio, students are unable to know the accuracy of motions during the teaching and learning process. On the other hand, given the unique motion characteristics of Baduanjin, it is difficult to assess the accuracy of students’ motions without an experienced teacher. Therefore, the study aimed to use IMU to obtain motion data to assess the accuracy of students’ motions of Baduanjin. For assessing motion accuracy, some studies have transformed it into comparing the assessed motions with the standard motions [8,49]. For example, Chen et al. [8] used one sequence-based method to assess motion accuracy for another traditional Chinese martial art, namely Tai Chi. They applied DTW to calculate the difference of the motion data between students and teachers to assess the motion accuracy of Tai Chi, and the correlation of assessment to teachers was about 80%. However, in teaching traditional Chinese sports, such as Baduanjin, the motion accuracy is assessed by using the grade scoring method, which means that assessing the motion accuracy of Baduanjin is one classifier problem. In this study, on the extracted time-domain features of the motion data, the assessment results of teachers were used as the motion classification criteria to train the classifiers. From the study results, it can be seen that some classifiers can have the capability to be close to a teacher’s assessment. Among the selected classifiers, k-NN has the best accuracy of classification, whether it is trained by using scores from Teacher A or Teacher B as the standard. The lowest accuracy of assessing the eight motions of Baduanjin on k-NN reached 86%. However, k-NN does not achieve the highest accuracy entirely when assessing the eight motions of Baduanjin. The accuracy of SVM in Motion-7 is higher than that of k-NN. Nevertheless, the problem of SVM is that the processing time of SVM is much longer than that of k-NN. The processing time of k-NN is the least of the seven selected classifiers, i.e., only 00.8 s. Therefore, the current study results show that, when assessing the motion accuracy of Baduanjin, k-NN as a classifier is the best choice in terms of accuracy and processing time.
Traditional Chinese martial arts, including Baduanjin, require that the sequence of motions must be followed. The recognition of motions helps students find out whether there are errors in the sequence of motions when they are learning and practicing Baduanjin. The recognition result of the study shows that 1D-CNN has the highest accuracy to recognize the motions (99.74); however, this classifier has problems classifying Motion-1 and Motion-3. Another classifier, SVM, is slightly different from 1D-CNN on the accuracy (99.47%), but the average processing time (0.914 s) of SVM is much less than 1D-CNN. The shortest processing time is k-NN, and the accuracy also reached 97.63%. Therefore, if only considering the accuracy of recognizing motion, 1D-CNN is the best classifier. However, if the accuracy and processing time are taken into account, SVM is better than 1D-CNN to meet the needs of practical application.
From the results, the accuracy of two commonly used ANN, namely BPNN and RBFNN, in motion recognition and motion assessment is not recommended. For example, the accuracy of RBPNN and BPNN in motion recognition is only 86.97% and 75.53%, respectively. Besides, BPNN also has the disadvantage that the processing time is much longer than other verified classifiers. The low accuracy of the two ANN classifiers may be caused by the insufficient sample size, which is one of the limitations of the study.
Moreover, we used the type of sample-based method for assessing motions and recognizing motions, and there is another type of sequence-based method which is not involved in this study [17]. It needs to be tested in future research to compare which of the two types of methods is more suitable for assessing and recognizing motions of Baduanjin.

5. Conclusions

The results show that, when using the extracted features of the motion data captured by IMU, an appropriate classifier needs to be selected that can effectively assess the motion accuracy of Baduanjin and recognize motions. Its adaptation/extension is to assess motion accuracy and recognize motions for other traditional Chinese martial arts.

Author Contributions

Conceptualization, H.L., S.K. and H.J.Y.; methodology, H.L., S.K. and H.J.Y.; validation, H.L., S.K. and H.J.Y.; data curation, H.L. and H.J.Y.; writing—original draft preparation, H.L.; writing—review and editing, S.K. and H.J.Y.; supervision, S.K. and H.J.Y.; funding acquisition, H.L. and H.J.Y. All authors have read and agreed to the published version of the manuscript.

Funding

This research was funded by Neijiang Normal University, grant no. YLZY201912-1/-11; and the University of Malaya Impact Oriented Interdisciplinary Research Grant Programmer, IIRG, grant no. IIRG001A-19IISS.

Institutional Review Board Statement

The study was conducted according to the guidelines of the Declaration of Helsinki and approved by the University of Malaya Research Ethics Committee (UM.TNC2/UMREC–558, 28 May 2019).

Informed Consent Statement

Informed consent was obtained from all subjects involved in the study.

Data Availability Statement

The data presented in this study are available on request from the corresponding author. The data are not publicly available due to the data involves the human body three-dimensional data of the participants.

Conflicts of Interest

The authors declare no conflict of interest. The funders had no role in the design of the study; in the collection, analyses or interpretation of data; in the writing of the manuscript; or in the decision to publish the results.

References

  1. Li, H.; Khoo, S.; Yap, H.J. Differences in Motion Accuracy of Baduanjin between Novice and Senior Students on Inertial Sensor Measurement Systems. Sensors 2020, 20, 6258. [Google Scholar] [CrossRef] [PubMed]
  2. The Central People’s Government of the People’s Republic of China. Healthy China 2030. Available online: http://www.gov.cn/zhengce/2016-10/25/content_5124174.htm (accessed on 21 July 2021).
  3. Ministry of Education of People’s Republic of China. Several Opinions on Comprehensively Improving the Quality of Higher Education. Available online: http://www.moe.gov.cn/srcsite/A08/s7056/201203/t20120316_146673.html (accessed on 7 August 2021).
  4. Li, F.Y.; Chen, X.H.; Liu, Y.C.; Zhang, Z.; GUO, L.; Huang, Z.L. Research progress on the teaching status of fitness Qigong Ba Duan Jin. China Med. Her. 2018, 15, 63–66. [Google Scholar] [CrossRef] [PubMed]
  5. Zhan, Y.Y. Exploring a New System of Martial Arts Teaching Content in Common Universities in Shanghai. Master’s Thesis, East China Normal University, Shanghai, China, 2015. [Google Scholar]
  6. Yamaoka, K.; Uehara, M.; Shima, T.; Tamura, Y. Feedback of flying disc throw with Kinect and its evaluation. Procedia Comput. Sci. 2013, 22, 912–920. [Google Scholar] [CrossRef] [Green Version]
  7. Elaoud, A.; Barhoumi, W.; Zagrouba, E.; Agrebi, B. Skeleton-based comparison of throwing motion for handball players. J. Ambient Intell. Humaniz. Comput. 2019, 11, 419–431. [Google Scholar] [CrossRef]
  8. Chen, X.M.; Chen, Z.B.; Li, Y.; He, T.Y.; Hou, J.H.; Liu, S.; He, Y. ImmerTai: Immersive motion learning in VR environments. J. Vis. Commun. Image Represent. 2019, 58, 416–427. [Google Scholar] [CrossRef]
  9. Thomsen, A.S.S.; Bach-Holm, D.; Kjærbo, H.; Højgaard-Olsen, K.; Subhi, Y.; Saleh, G.M.; Park, Y.S.; la Cour, M.; Konge, L. Operating room performance improves after proficiency-based virtual reality cataract surgery training. Ophthalmology 2017, 124, 524–531. [Google Scholar] [CrossRef]
  10. Van der Kruk, E.; Reijne, M.M. Accuracy of human motion capture systems for sport applications; state-of-the-art review. Eur. J. Sport Sci. 2018, 18, 806–819. [Google Scholar] [CrossRef] [PubMed]
  11. Spörri, J.; Schiefermüller, C.; Müller, E. Collecting kinematic data on a ski track with optoelectronic stereophotogrammetry: A methodological study assessing the feasibility of bringing the biomechanics lab to the field. PLoS ONE 2016, 11, e0161757. [Google Scholar] [CrossRef] [PubMed] [Green Version]
  12. Panjkota, A.; Stancic, I.; Supuk, T. Outline of a qualitative analysis for the human motion in case of ergometer rowing. In Proceedings of the 9th WSEAS International Conference on Simulation, Modelling and Optimization, Iwate Prefectural University, Iwate, Japan, 23–25 March 2010; pp. 182–186. [Google Scholar]
  13. Schuler, N.; Bey, M.; Shearn, J.; Butler, D. Evaluation of an electromagnetic position tracking device for measuring in vivo, dynamic joint kinematics. J. Biomech. 2005, 38, 2113–2117. [Google Scholar] [CrossRef] [PubMed]
  14. Noitom Technology Ltd. Perception Neuron 2.0. Available online: https://www.noitom.com.cn/perception-neuron-2-0.html (accessed on 20 August 2020).
  15. McGinnis, R.S. Advancing Applications of IMUs in Sports Training and Biomechanics. Ph.D. Thesis, University of Michigan, Ann Arbor, MI, USA, 2013. [Google Scholar]
  16. Rokoko Company. Tech Specs of Smartgloves. Available online: https://www.rokoko.com/products/smartgloves/tech-specs (accessed on 12 August 2021).
  17. Mannini, A.; Sabatini, A.M. Machine Learning Methods for Classifying Human Physical Activity from On-Body Accelerometers. Sensors 2010, 10, 1154–1175. [Google Scholar] [CrossRef] [Green Version]
  18. Sers, R.; Forrester, S.E.; Moss, E.; Ward, S.; Zecca, M. Validity of the Perception Neuron inertial motion capture system for upper body motion analysis. Measurement 2019, 149, 107024. [Google Scholar] [CrossRef]
  19. Dai, H.; Cai, B.; Song, J.; Zhang, D.Y. Skeletal animation based on BVH motion data. In Proceedings of the 2nd International Conference on Information Engineering and Computer Science, Wuhan, China, 25–26 December 2010; pp. 1–4. [Google Scholar]
  20. Yap, H.J.; Taha, Z.; Dawal, S.Z.M. A Generic Approach of Integrating 3D Models into Virtual Manufacturing. J. Zhejiang Univ. SCIENCE C (Comput. Electron.) 2012, 13, 20–28. [Google Scholar] [CrossRef]
  21. Gao, L.; Bourke, A.K.; Nelson, J. Evaluation of accelerometer based multi-sensor versus single-sensor activity recognition systems. Med. Eng. Phys. 2014, 36, 779–785. [Google Scholar] [CrossRef]
  22. Altun, K.; Barshan, B.; Tunel, O. Comparative study on classifying human activities with miniature inertial and magnetic sensors. Pattern Recognit. 2010, 43, 3605–3620. [Google Scholar] [CrossRef]
  23. Zhang, M.; Sawchuk, A.A. Human Daily Activity Recognition With Sparse Representation Using Wearable Sensors. IEEE J. Biomed. Health Inform. 2013, 17, 553–560. [Google Scholar] [CrossRef] [PubMed]
  24. Bao, L.; Intille, S.S. Activity Recognition from User-Annotated Acceleration Data. In Proceedings of the Pervasive Computing, Pervasive 2004, Vienna, Austria, 21–23 April 2004. [Google Scholar]
  25. Altun, K.; Barshan, B. Human Activity Recognition Using Inertial/Magnetic Sensor Units. In Proceedings of the First International Workshop on Human Behavior Understanding (HBU 2010), in conjunction with the 20th International Conference on Pattern Recognition, Istanbul, Turkey, 20 August 2010; pp. 38–51. [Google Scholar]
  26. Khan, A.M.; Lee, Y.K.; Lee, S.Y.; Kim, T.S. A Triaxial Accelerometer-Based Physical-Activity Recognition via Augmented-Signal Features and a Hierarchical Recognizer. IEEE Trans. Inf. Technol. Biomed. 2010, 14, 1166–1172. [Google Scholar] [CrossRef]
  27. Subasi, A.; Gursoy, M.I. EEG signal classification using PCA, ICA, LDA and support vector machines. Expert Syst. Appl. 2010, 37, 8659–8666. [Google Scholar] [CrossRef]
  28. Minhas, R.; Mohammed, A.A.; Wu, Q. A fast recognition framework based on extreme learning machine using hybrid object information. Neurocomputing 2010, 73, 1831–1839. [Google Scholar] [CrossRef]
  29. Guo, Z.B.; Zhang, Y. A Similar Distribution Discriminant Analysis with Orthogonal and Nearly Statistically Uncorrelated Characteristics. Math. Probl. Eng. 2019, 2019, 3145973. [Google Scholar] [CrossRef] [Green Version]
  30. Kenyhercz, M.W.; Passalacqua, N.V. Missing Data Imputation Methods and Their Performance with Biodistance Analyses. In Biological Distance Analysis; Pilloud, M.A., Hefner, J.T., Eds.; Elsevier Inc.: Amsterdam, The Netherlands, 2016; pp. 181–194. [Google Scholar]
  31. MathWorks. Fitcknn. Available online: https://www.mathworks.com/help/stats/fitcknn.html?s_tid=srchtitle (accessed on 2 February 2021).
  32. Boubou, S.; Suzuki, E. Classifying actions based on histogram of oriented velocity vectors. J. Intell. Inf. Syst. 2015, 44, 49–65. [Google Scholar] [CrossRef]
  33. Jegham, I.; Khalifa, A.B.; Alouani, I.; Mahjoub, M.A. Vision-based human action recognition: An overview and real world challenges. Digit. Investig. 2020, 32, 200901. [Google Scholar] [CrossRef]
  34. Morris, C.W.; Autret, A.; Boddy, L. Support vector machines for identifying organisms—A comparison with strongly partitioned radial basis function networks. Ecol. Model. 2001, 146, 57–67. [Google Scholar] [CrossRef]
  35. Erfani, S.M.; Rajasegarar, S.; Karunasekera, S.; Leckie, C. High-dimensional and large-scale anomaly detection using a linear one-class SVM with deep learning. Pattern Recognit. 2016, 58, 121–134. [Google Scholar] [CrossRef]
  36. MathWorks. Fitcecoc. Available online: https://www.mathworks.com/help/stats/fitcecoc.html?s_tid=srchtitle (accessed on 10 February 2021).
  37. Iglesias, J.A. Creating Evolving User Behavior Profiles Automatically. IEEE Trans. Knowl. Data Eng. 2012, 24, 854–867. [Google Scholar] [CrossRef] [Green Version]
  38. MathWorks. Fitcnb. Available online: https://www.mathworks.com/help/stats/fitcnb.html?searchHighlight=fitcnb&s_tid=srchtitle (accessed on 2 February 2021).
  39. Edgar, T.W.; Manz, D.O. Research Methods for Cyber Security; Syngress: Cambridge, MA, USA, 2017. [Google Scholar]
  40. MathWorks. Fitclinear. Available online: https://www.mathworks.com/help/stats/fitclinear.html#namevaluepairarguments (accessed on 3 February 2021).
  41. Lin, T. Code Comment Analysis for Improving Software Quality. In The Art and Science of Analyzing Software Data; Bird, C., Menzies, T., Zimmermann, T., Eds.; Morgan Kaufmann: San Mateo, CA, USA, 2015; pp. 493–517. [Google Scholar]
  42. Dev, V.A.; Eden, M.R. Gradient Boosted Decision Trees for Lithology Classification. Comput. Aided Chem. Eng. 2019, 47, 113–118. [Google Scholar] [CrossRef]
  43. MathWorks. Fitctree. Available online: https://www.mathworks.com/help/stats/fitctree.html?searchHighlight=fitctree&s_tid=srchtitle (accessed on 3 February 2021).
  44. Oyewale, A.M.; Kasali, A.O.; Phazamile, K.; Abiodun, M.V.; Adeyinka, A.I. Forecasting Inflation Rates Using Artificial Neural Networks. J. Comput. Math. 2019, 9, 201–207. [Google Scholar] [CrossRef]
  45. Wang, G.; Cheng, G.; Carr, T.R. The application of improved NeuroEvolution of Augmenting Topologies neural network in Marcellus Shale lithofacies prediction. Comput. Geosci. 2013, 54, 50–65. [Google Scholar] [CrossRef]
  46. Satapathy, S.K.; Dehuri, S.; Jagadev, A.K.; Mishra, S. EEG Signal Classification Using RBF Neural Network Trained with Improved PSO Algorithm for Epilepsy Identification. In EEG Brain Signal Classification for Epileptic Seizure Disorder Detection; Satapathy, S.K., Dehuri, S., Jagadev, A.K., Mishra, S., Eds.; Academic Press: Cambridge, MA, USA, 2019; pp. 67–89. [Google Scholar]
  47. Goodfellow, I.; Bengio, Y.; Courville, A. Deep Learning; MIT Press: Cambridge, MA, USA, 2016; Volume 1. [Google Scholar]
  48. Mathworks. Convolutional Neural Network. Available online: https://www.mathworks.com/discovery/convolutional-neural-network-matlab.html?s_tid=srchtitle_convolutional%2520neural%2520network%2520_1 (accessed on 12 August 2021).
  49. Alexiadis, D.S.; Daras, P. Quaternionic Signal Processing Techniques for Automatic Evaluation of Dance Performances From MoCap Data. IEEE Trans. Multimed. 2014, 16, 1391–1406. [Google Scholar] [CrossRef]
Figure 1. Flow diagrams of the study.
Applsci 11 07630 g001
Figure 2. Eight standard motions of Baduanjin.
Applsci 11 07630 g002
Figure 3. The skeleton model of BVH file for Perception Neuron 2.0.
Applsci 11 07630 g003
Figure 4. The basic architecture diagram of BPNN.
Applsci 11 07630 g004
Figure 5. The basic architecture diagram of 1D-CNN.
Applsci 11 07630 g005
Figure 6. The first three features of the eight motions of Baduanjin.
Applsci 11 07630 g006
Figure 7. Motion-8.
Figure 7. Motion-8.
Applsci 11 07630 g007
Figure 8. The confusion matrices of different classifiers for Motion-1, using scores from Teacher A.
Applsci 11 07630 g008
Figure 9. The confusion matrices of different classifiers for Motion-1, using scores from Teacher B.
Applsci 11 07630 g009aApplsci 11 07630 g009b
Figure 10. The confusion matrices of motion recognition on different classifiers: (a) k-NN, (b) SVM, (c) NB, (d) Logistics regression, (e) DT, (f) BPNN, (g) RBFNN and (h) 1D-CNN.
Applsci 11 07630 g010aApplsci 11 07630 g010bApplsci 11 07630 g010cApplsci 11 07630 g010dApplsci 11 07630 g010e
Table 1. The extracted features in this study.
Type of FeatureFeature IDThe Description of the Features
Time-domain features1–3The mean value of the three vectors of x, y, z
4–6The variance value of the three vectors of x, y, z
7–9The standard deviation value of the three vectors of x, y, z
10–12The skewness value of the three vectors of x, y, z
13–15The kurtosis value of the three vectors of x, y, z
16–18The quartile deviation value of the three vectors of x, y, z
Table 2. The grading by two teachers and the Kendall correlation of the scores.
MotionsTeacher ATeacher BKendall Value
GoodPassFailGoodPassFail
Motion-11657221555250.941
Motion-22153212450210.882
Motion-32658112349230.831
Motion-42258151949270.824
Motion-52057182056190.838
Motion-62355172054210.907
Motion-729597266270.944
Motion-861340613400.862
Table 3. Accuracy of motion assessment of different classifiers, using scores from Teacher A.
ClassifiersAccuracy (%)
Motion-1Motion-2Motion-3Motion-4Motion-5Motion-6Motion-7Motion-8
k-NN89.47 192.63 191.58 192.63 189.47 192.63 187.3788.42 1
SVM89.47 184.2180.0092.63 180.0075.7995.79 180.00
NB81.0583.1674.7490.5377.8980.0082.1176.84
Logistic Regression78.9571.5862.1181.0584.2177.8981.0576.84
DT73.6865.2665.2661.0565.2662.1173.6865.26
BPNN73.6861.0563.1670.5378.9566.3281.0573.68
RBFNN83.1667.3775.7975.7978.9575.7984.2170.53
1D-CNN74.7471.5876.8469.4776.8488.4291.5878.95
1 The highest accuracy.
Table 4. Accuracy of motion assessment of different classifiers, using scores from Teacher B.
ClassifiersAccuracy (%)
Motion-1Motion-2Motion-3Motion-4Motion-5Motion-6Motion-7Motion-8
k-NN89.47 186.32 188.42 191.58 191.58 186.32 185.2686.32 1
SVM83.1672.6374.7486.3283.1684.2187.37 173.68
NB78.9578.9568.4288.4280.0081.0584.2175.79
Logistic Regression78.9571.5862.1181.0584.2177.8981.0576.84
DT73.6865.2665.2661.0565.2662.1173.6865.26
BPNN73.6861.0563.1670.5378.9566.3281.0573.68
RBFNN83.1667.3775.7975.7978.9575.7984.2170.53
1D-CNN72.6372.6362.1176.8480.0087.3781.0578.95
1 The highest accuracy.
Table 5. Processing time of different classifiers for assessing motion accuracy.
ClassifiersProcessing Time (s)
k-NN0.008 1
SVM4.751
NB0.021
Logistics regression0.020
DT0.010
BPNN7.709
RBFNN0.063
1D-CNN9.179
1 Minimum processing time.
Table 6. Accuracy and processing time of recognizing motions on different classifiers.
ClassifiersAccuracy (%)Processing Time (s)
k-NN97.630.055 2
SVM99.470.914
NB97.890.174
Logistics regression99.210.407
DT84.470.087
BPNN86.9713.270
RBFNN75.530.295
1D-CNN99.74 180.958
1 The highest accuracy. 2 Minimum processing time.
Publisher’s Note: MDPI stays neutral with regard to jurisdictional claims in published maps and institutional affiliations.

