
Assessing Urban Accessibility in Monterrey, Mexico: A Transferable Approach to Evaluate Access to Main Destinations at the Metropolitan and Local Levels

 , ,
, ,  , ,
, ,  , and
, and 
Abstract
:1. Introduction
2. Materials and Methods
2.1. Software
2.2. Data Processing
2.3. Study Area
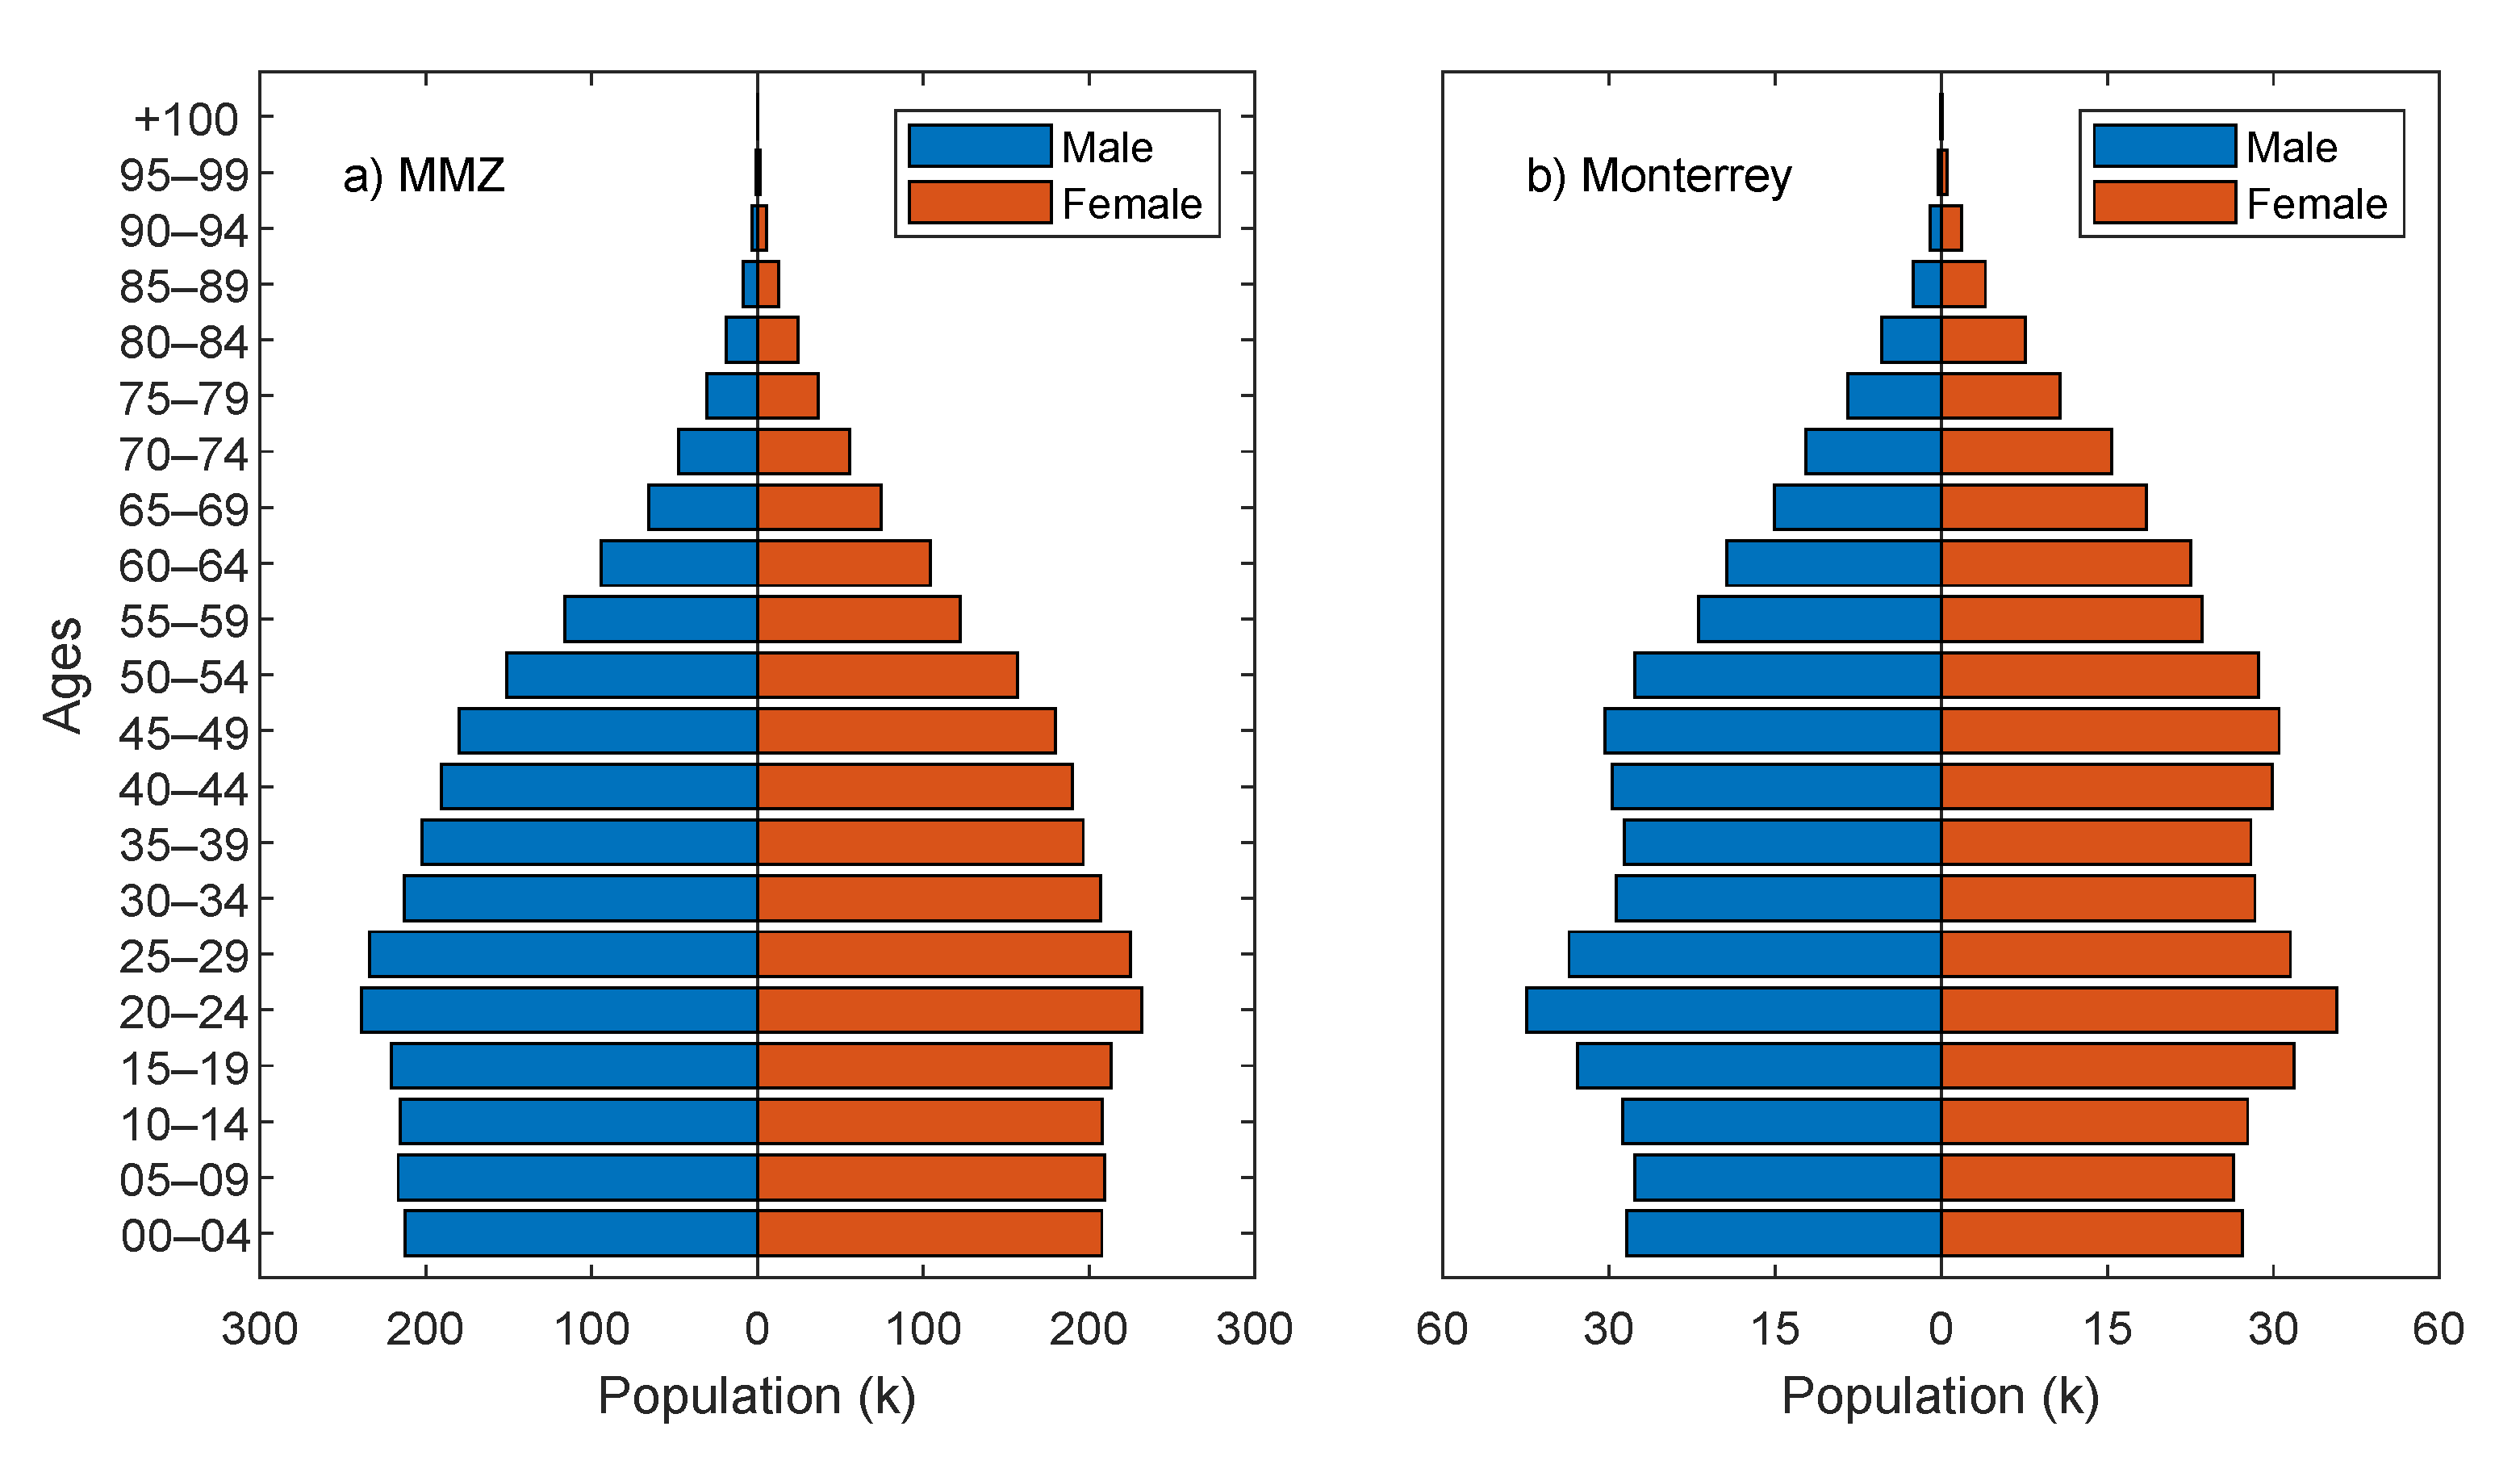
2.3.1. Monterrey Metropolitan Area
- Percentage of the population within 6 and 14 y who do not attend school;
- Percentage of the population 15 y or older who have not completed their basic education;
- Percentage of the population without entitlement to access the public health system;
- Percentage of dead children from women between 15 and 49 y;
- Percentage of particular occupied households without running water;
- Percentage of particular occupied households without drainage connected to the public network or a septic tank;
- Percentage of particular occupied households without a toilet connected to running water;
- Percentage of particular occupied households with dirt floors;
- Percentage of particular occupied households with some level of overcrowding;
- Percentage of particular occupied households without a fridge.
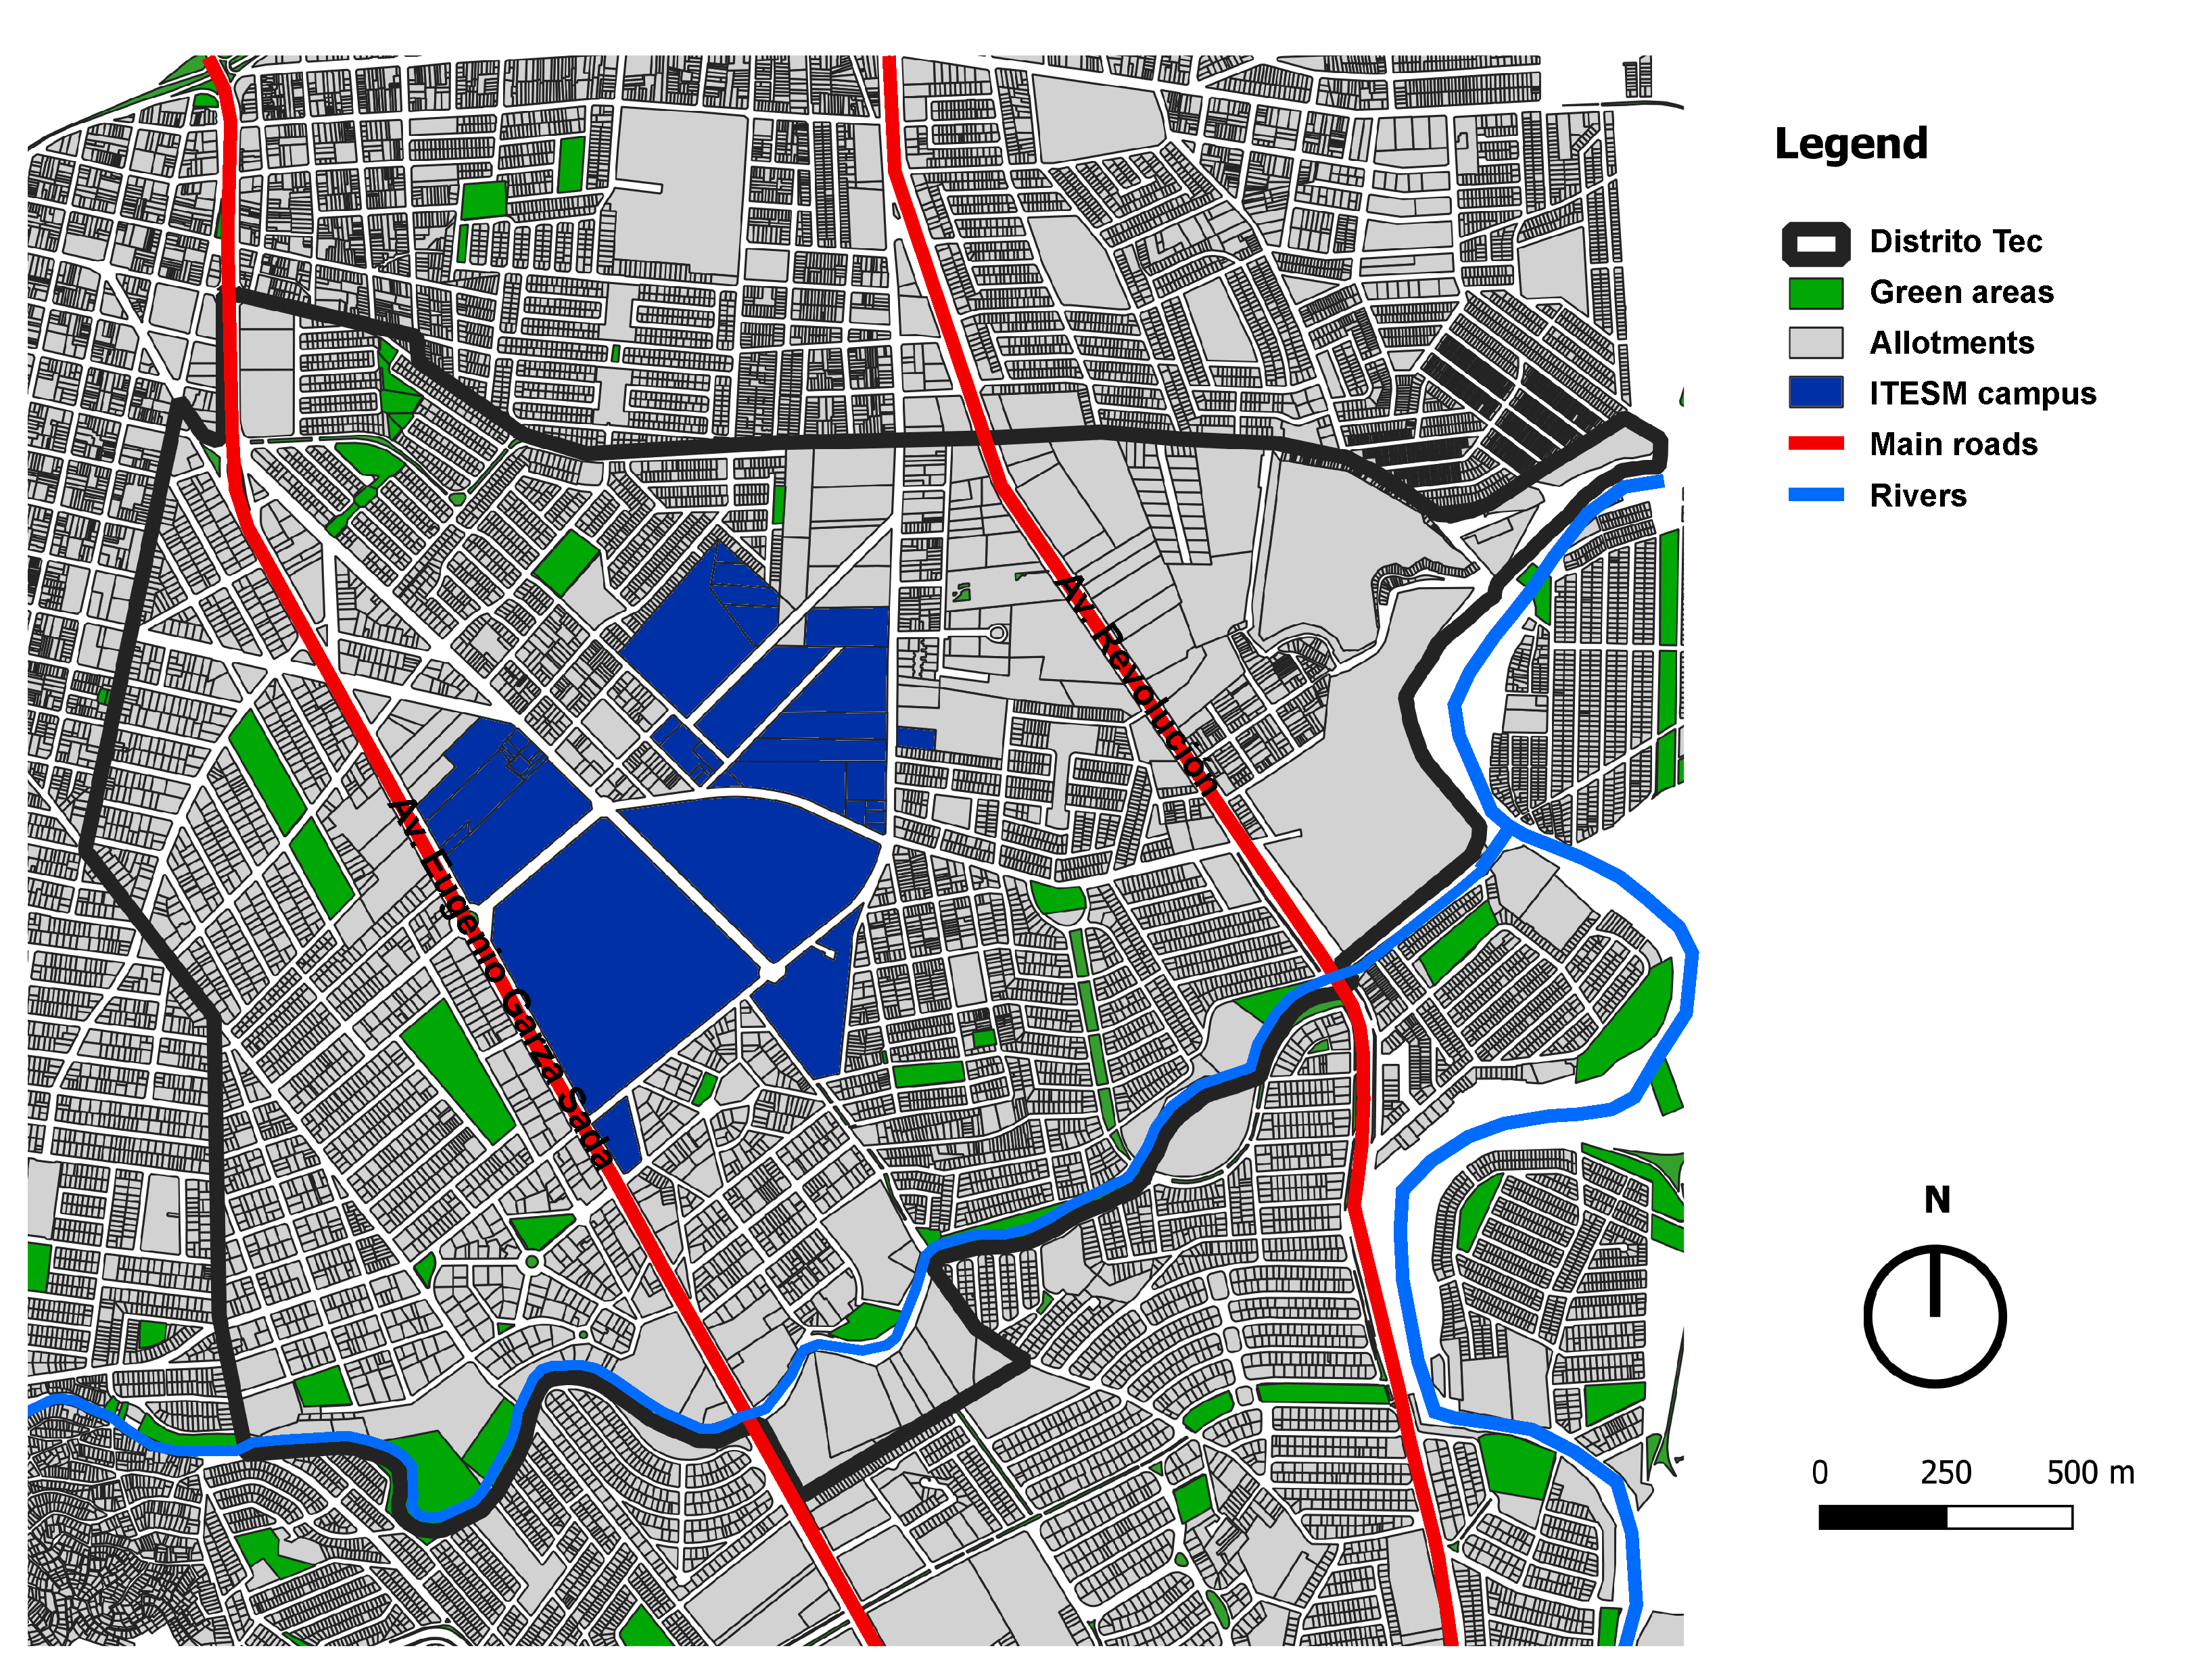
2.3.2. Distrito Tec Area
3. Analysis and Results
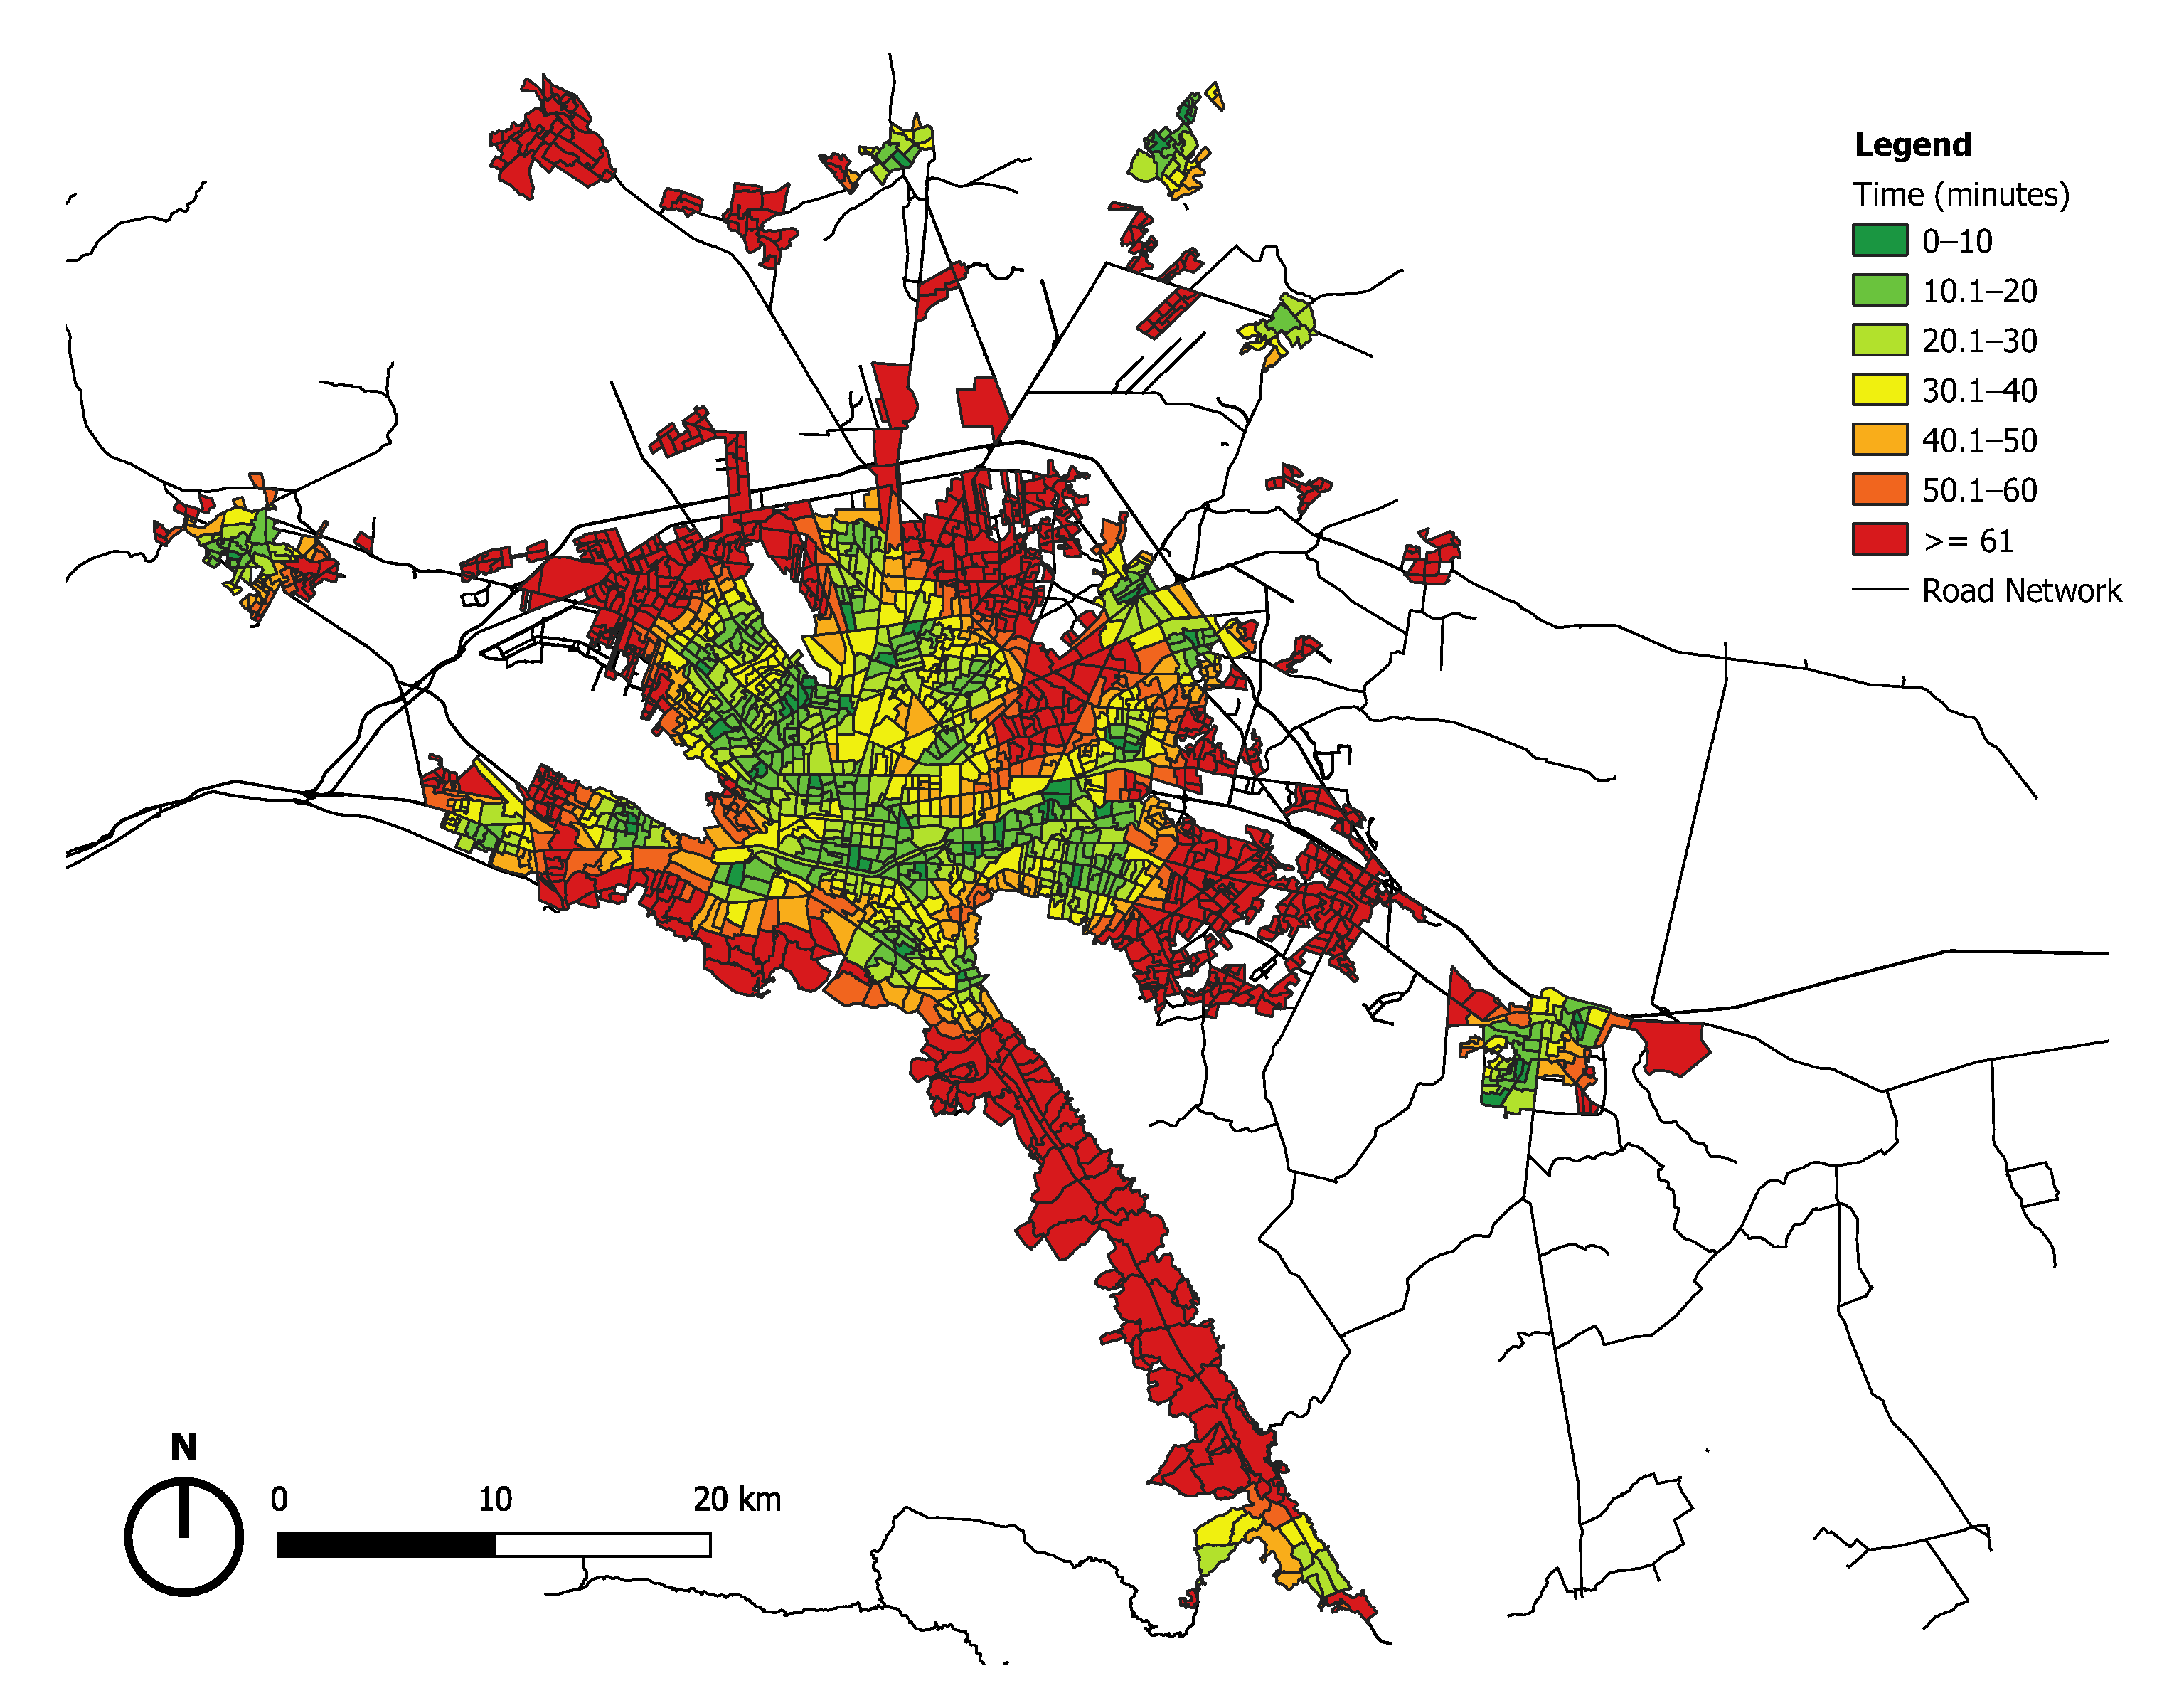
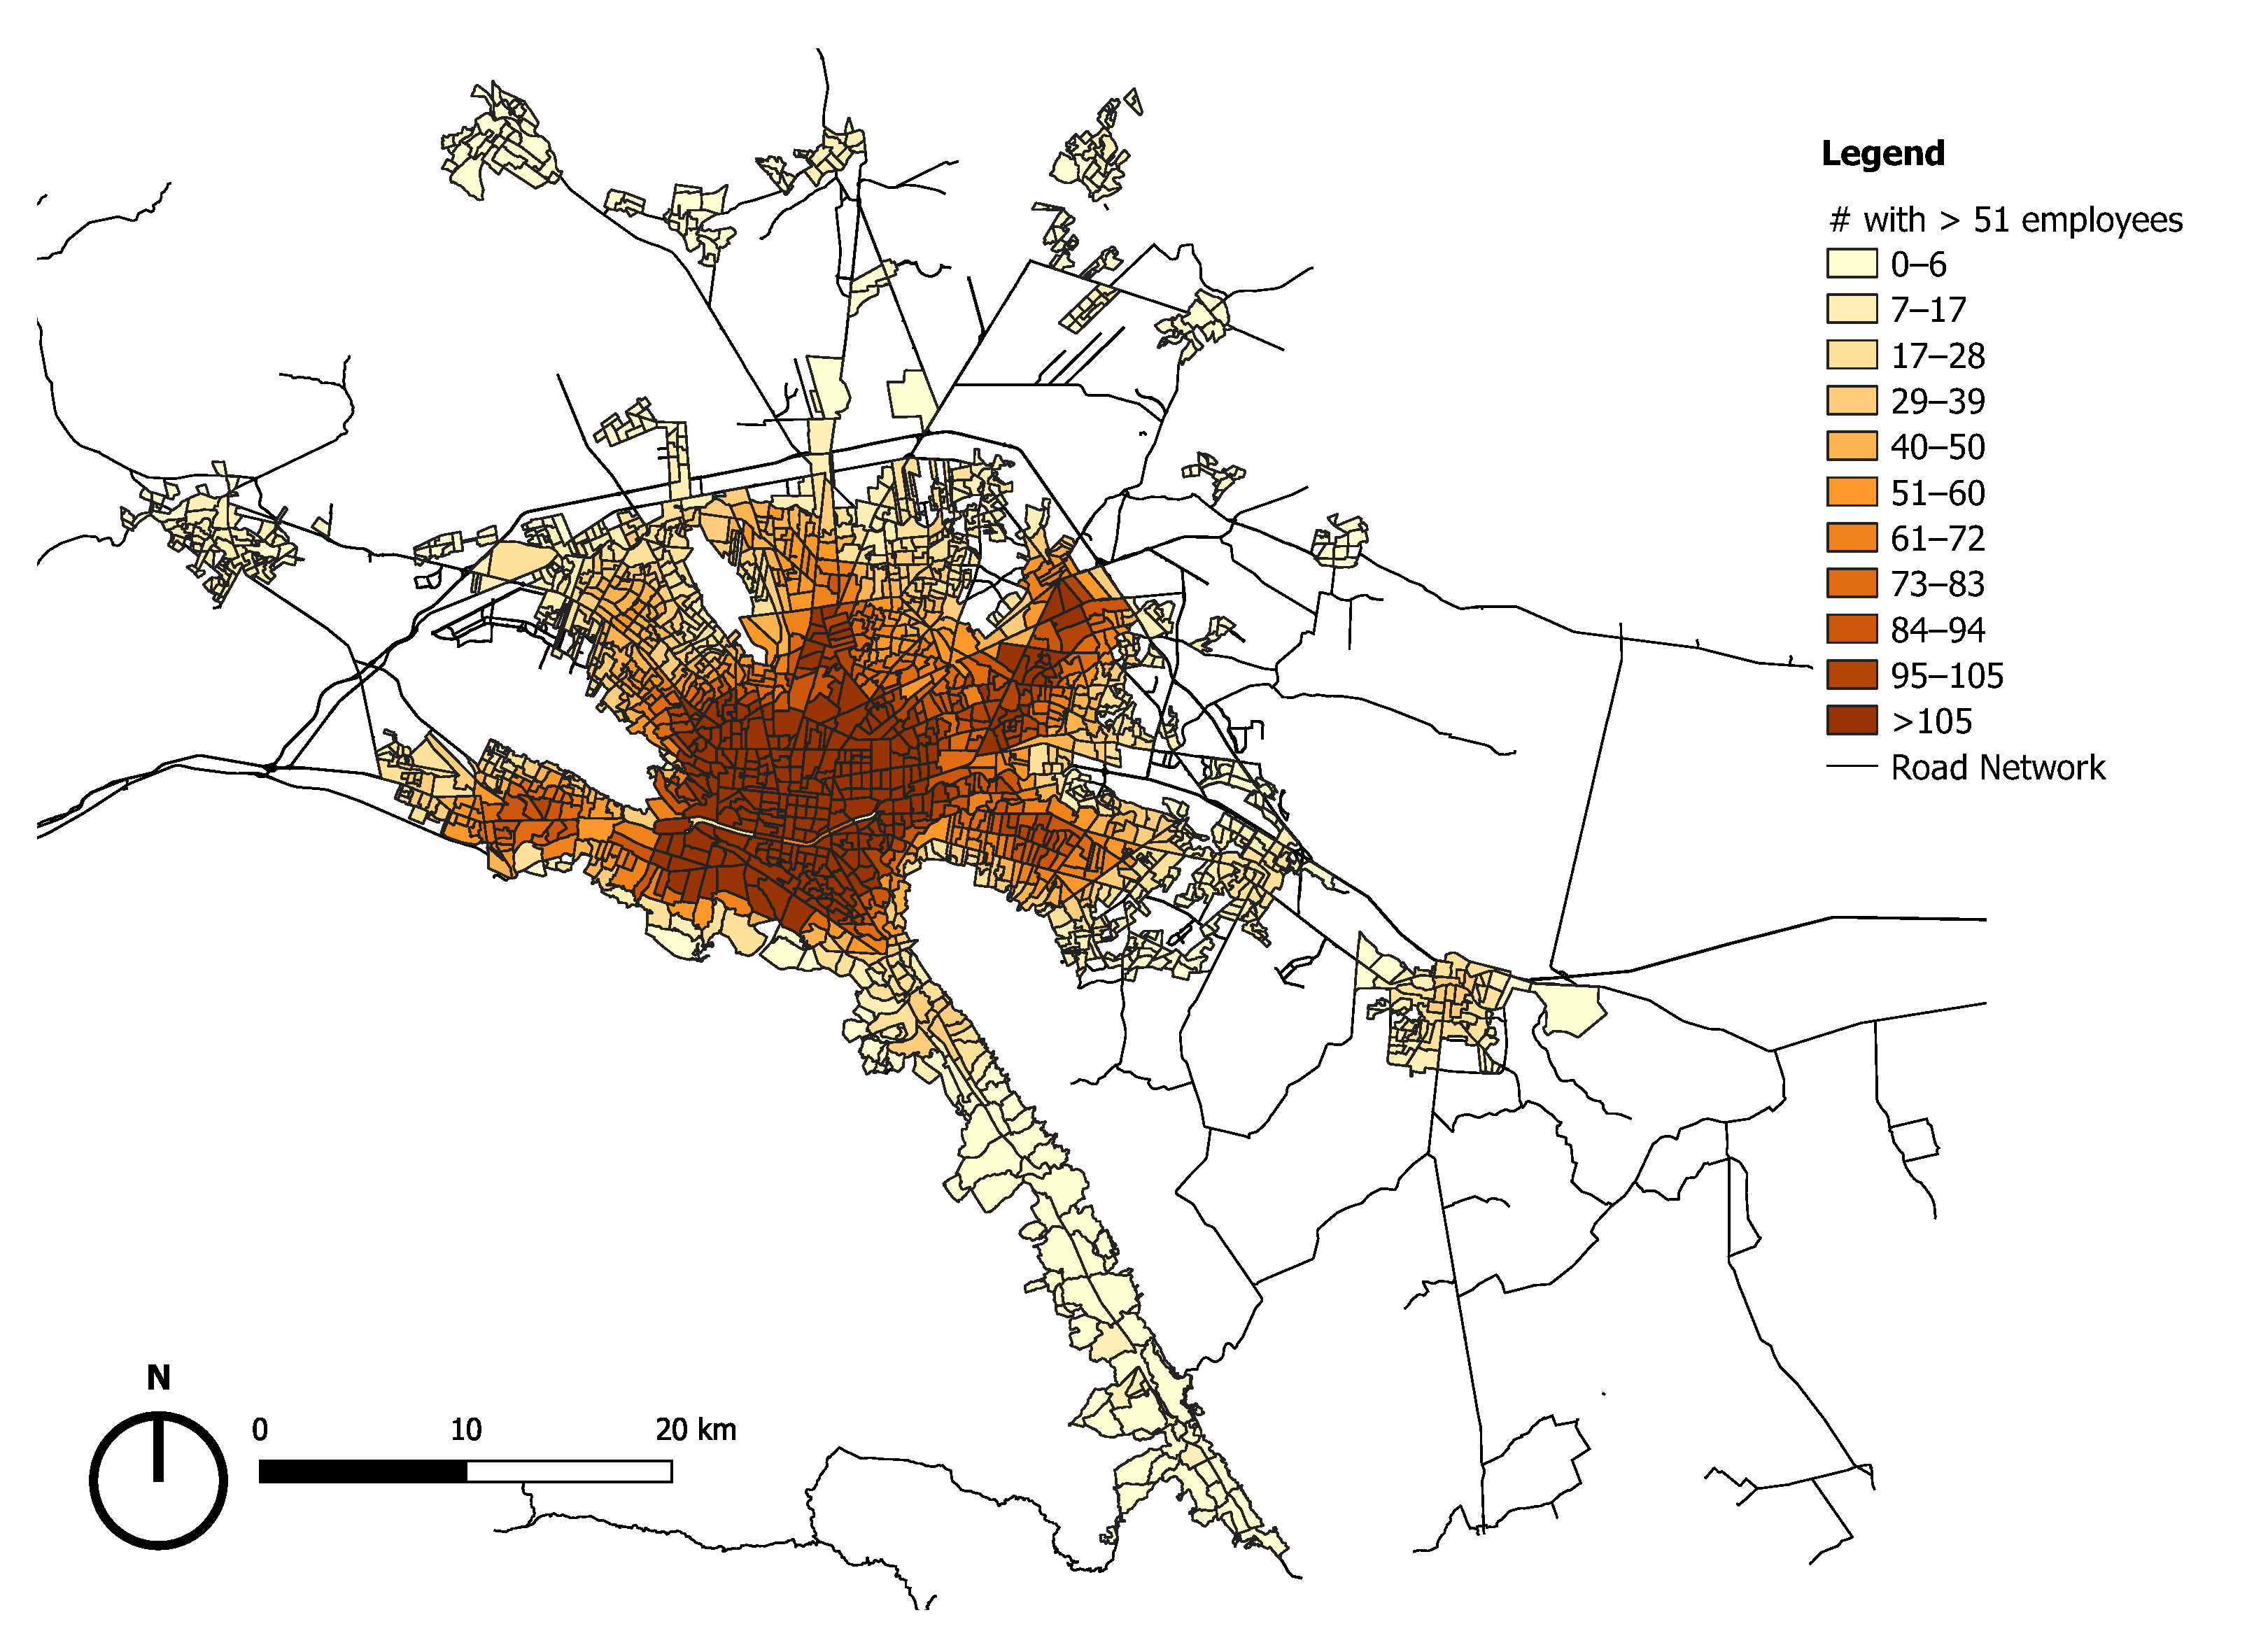
3.1. Monterrey Metropolitan Area
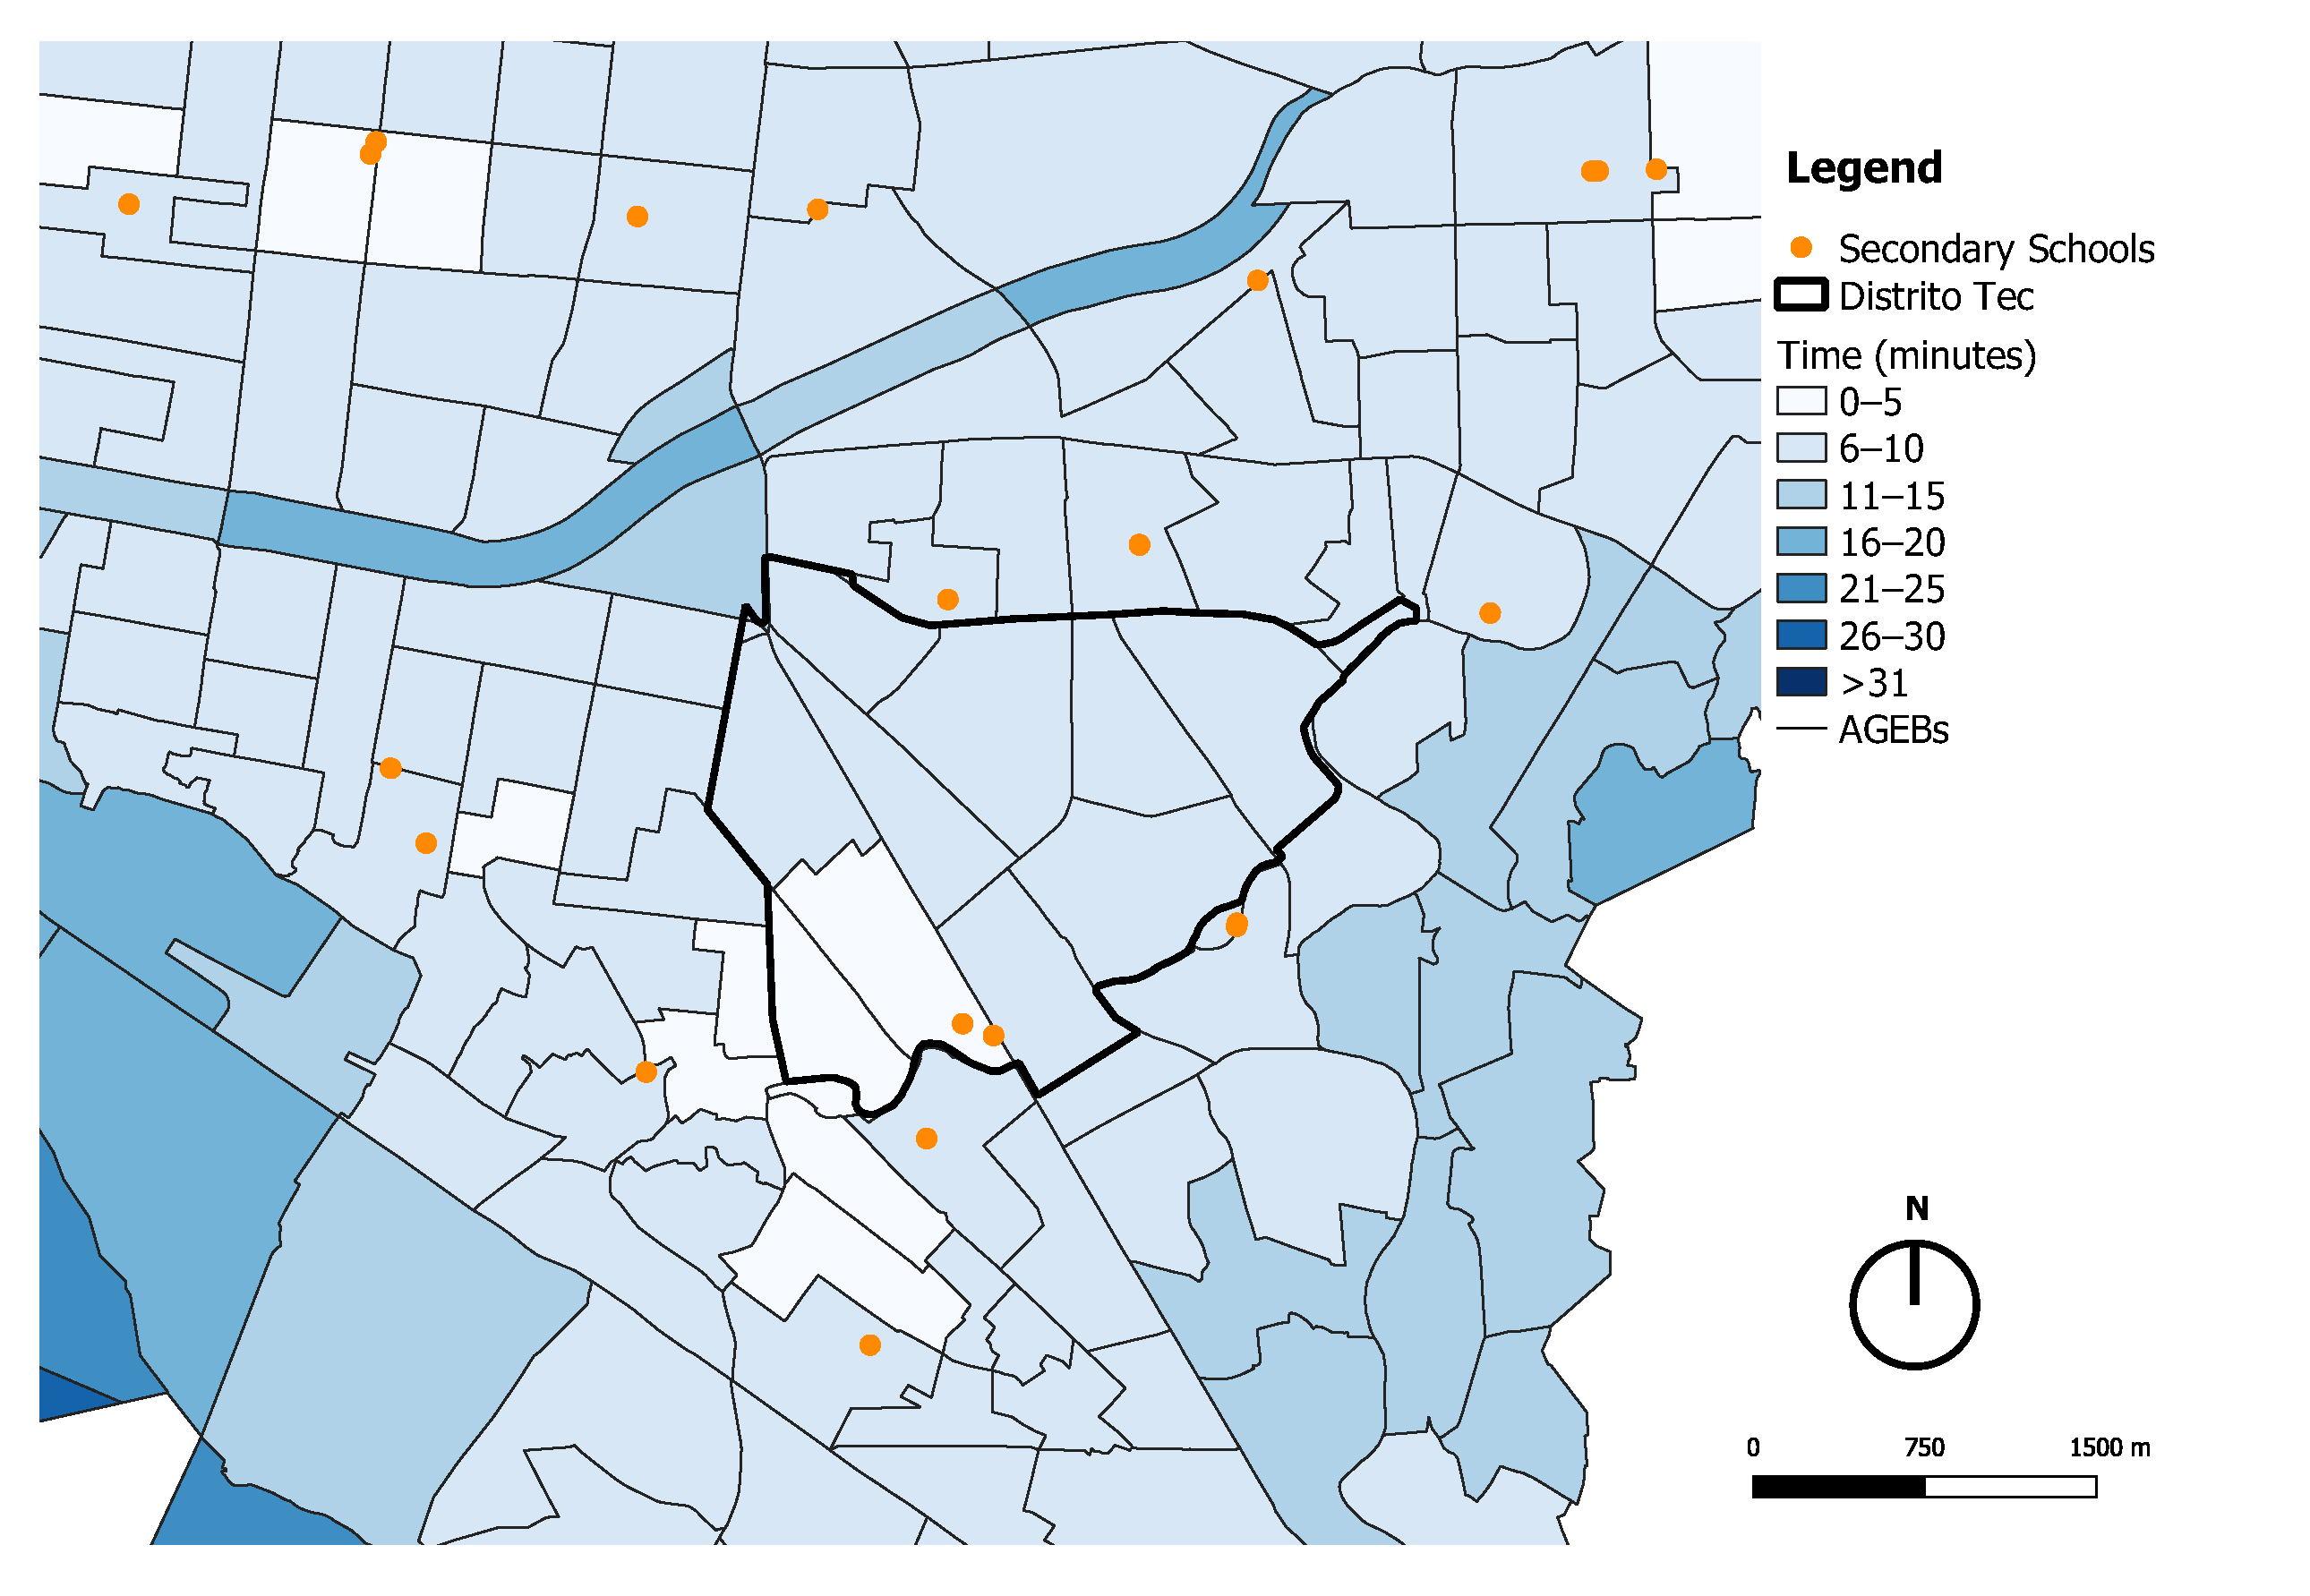
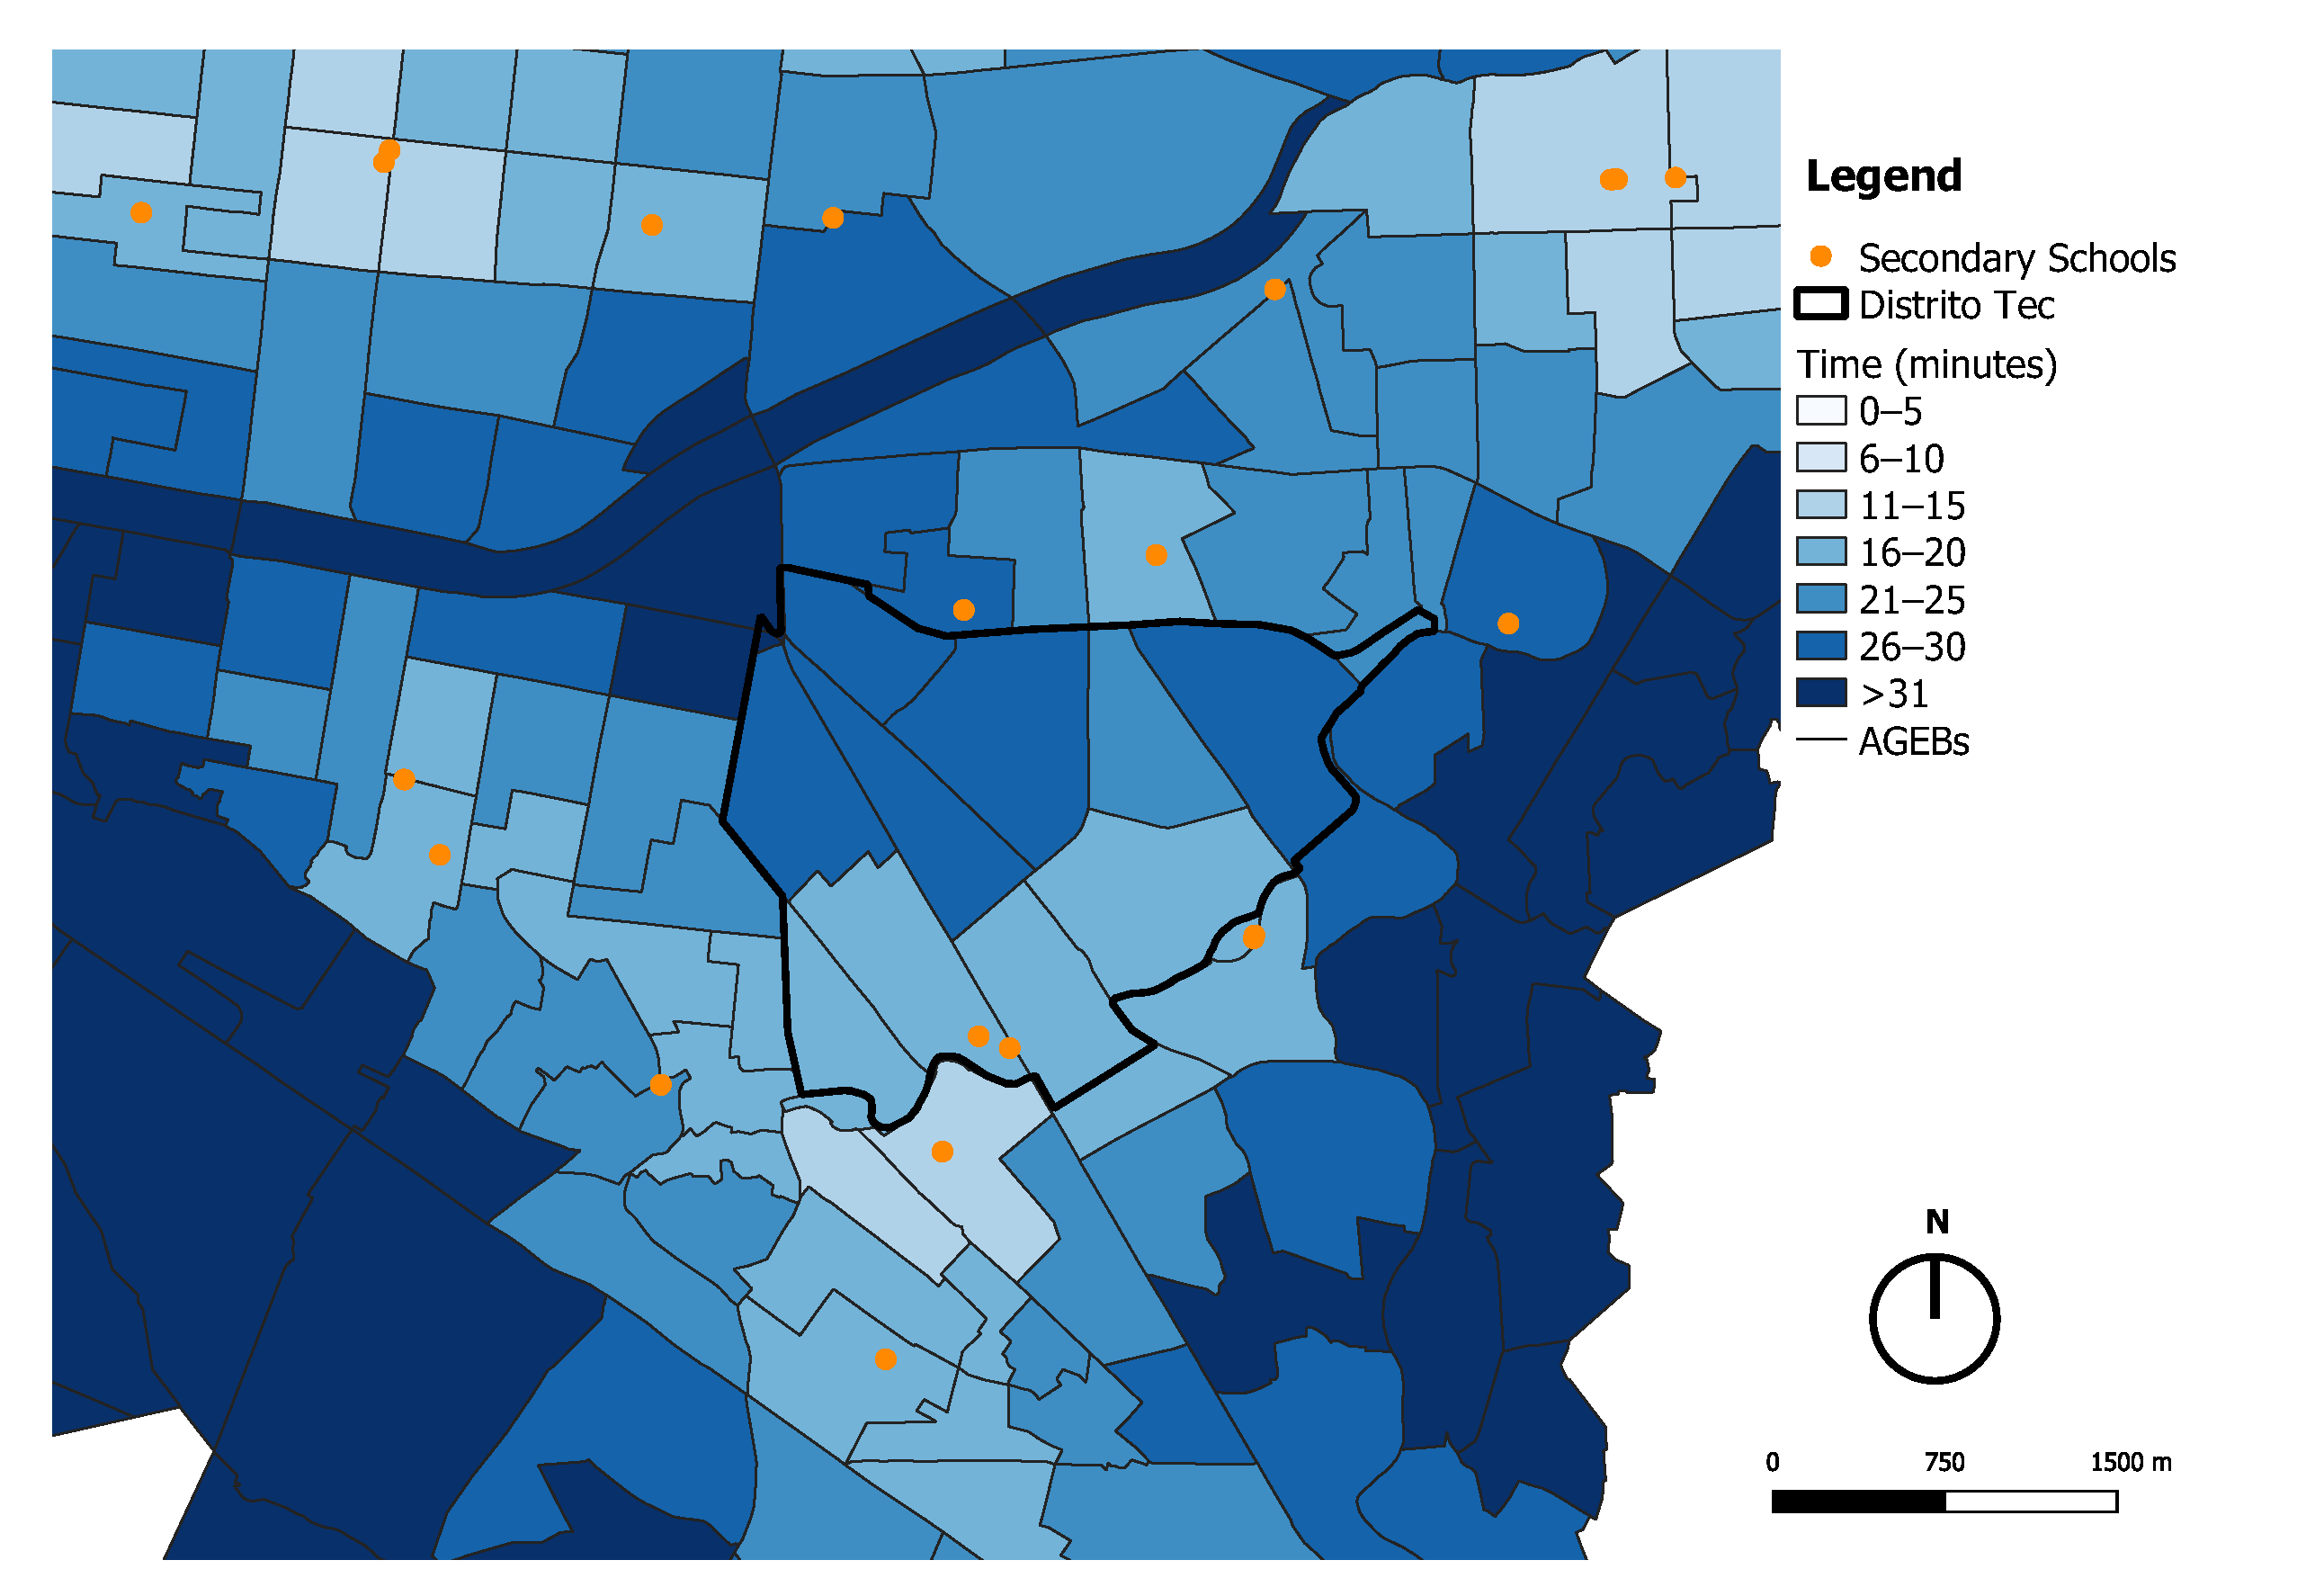
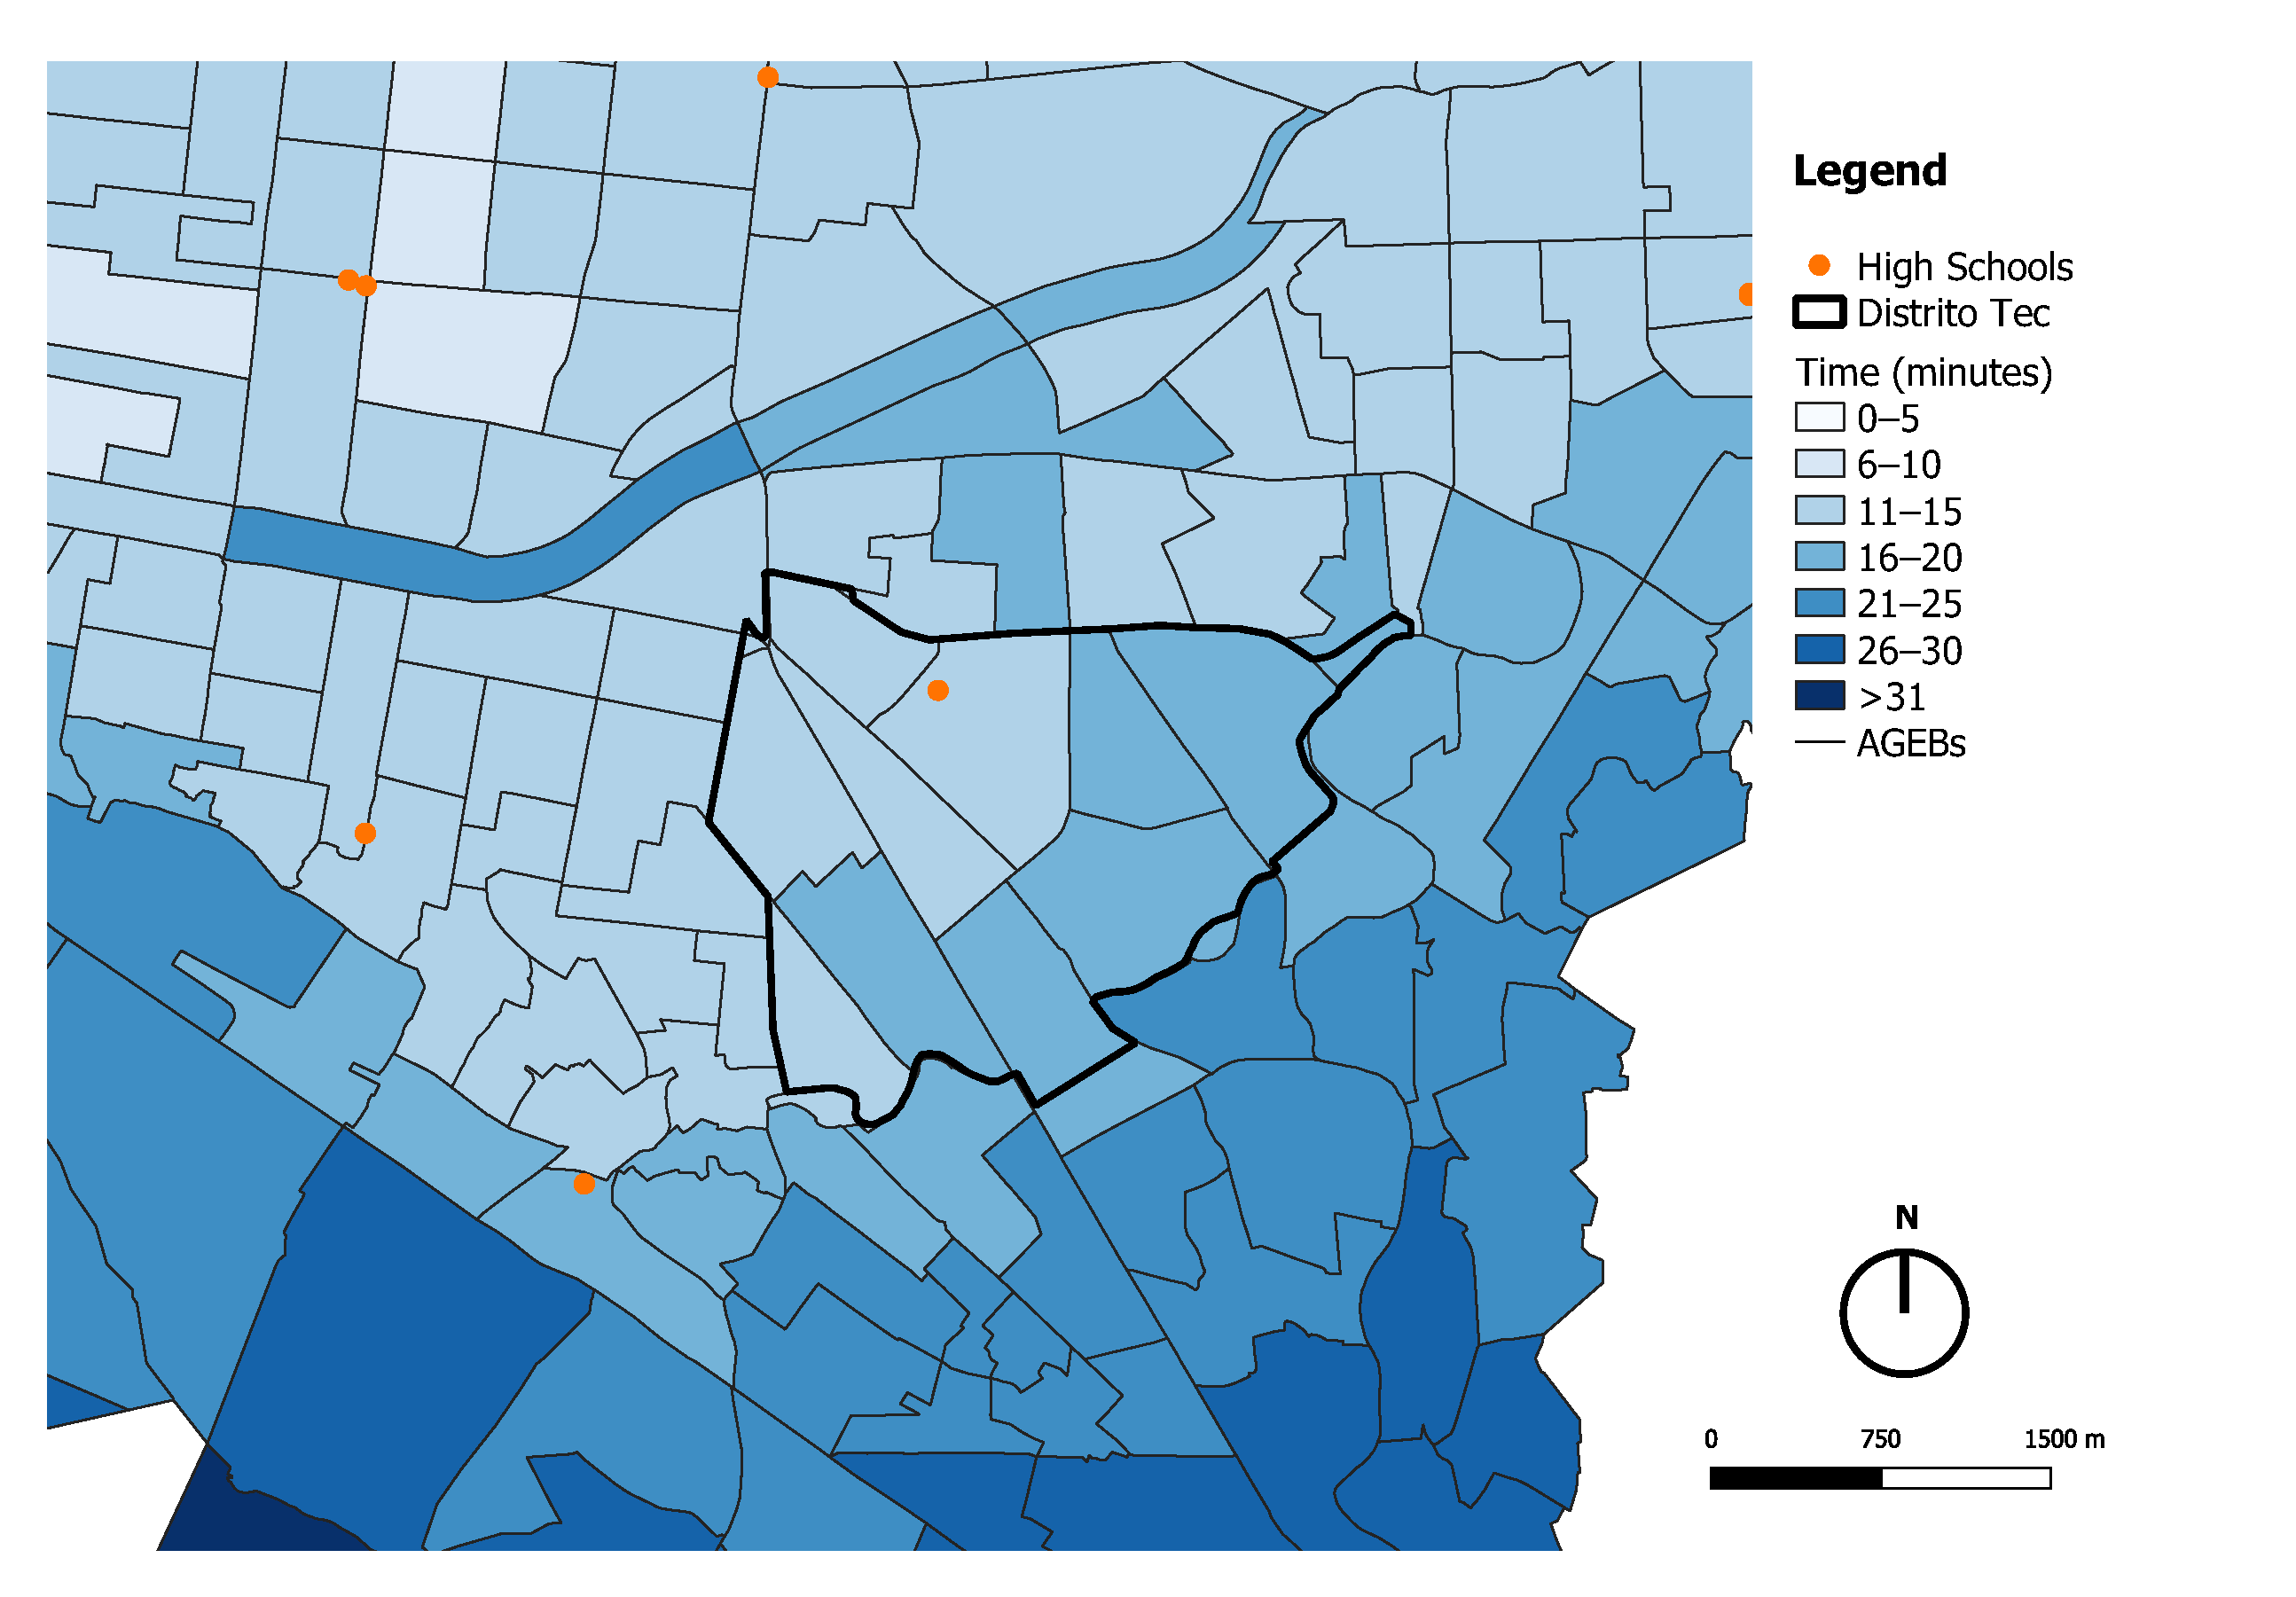
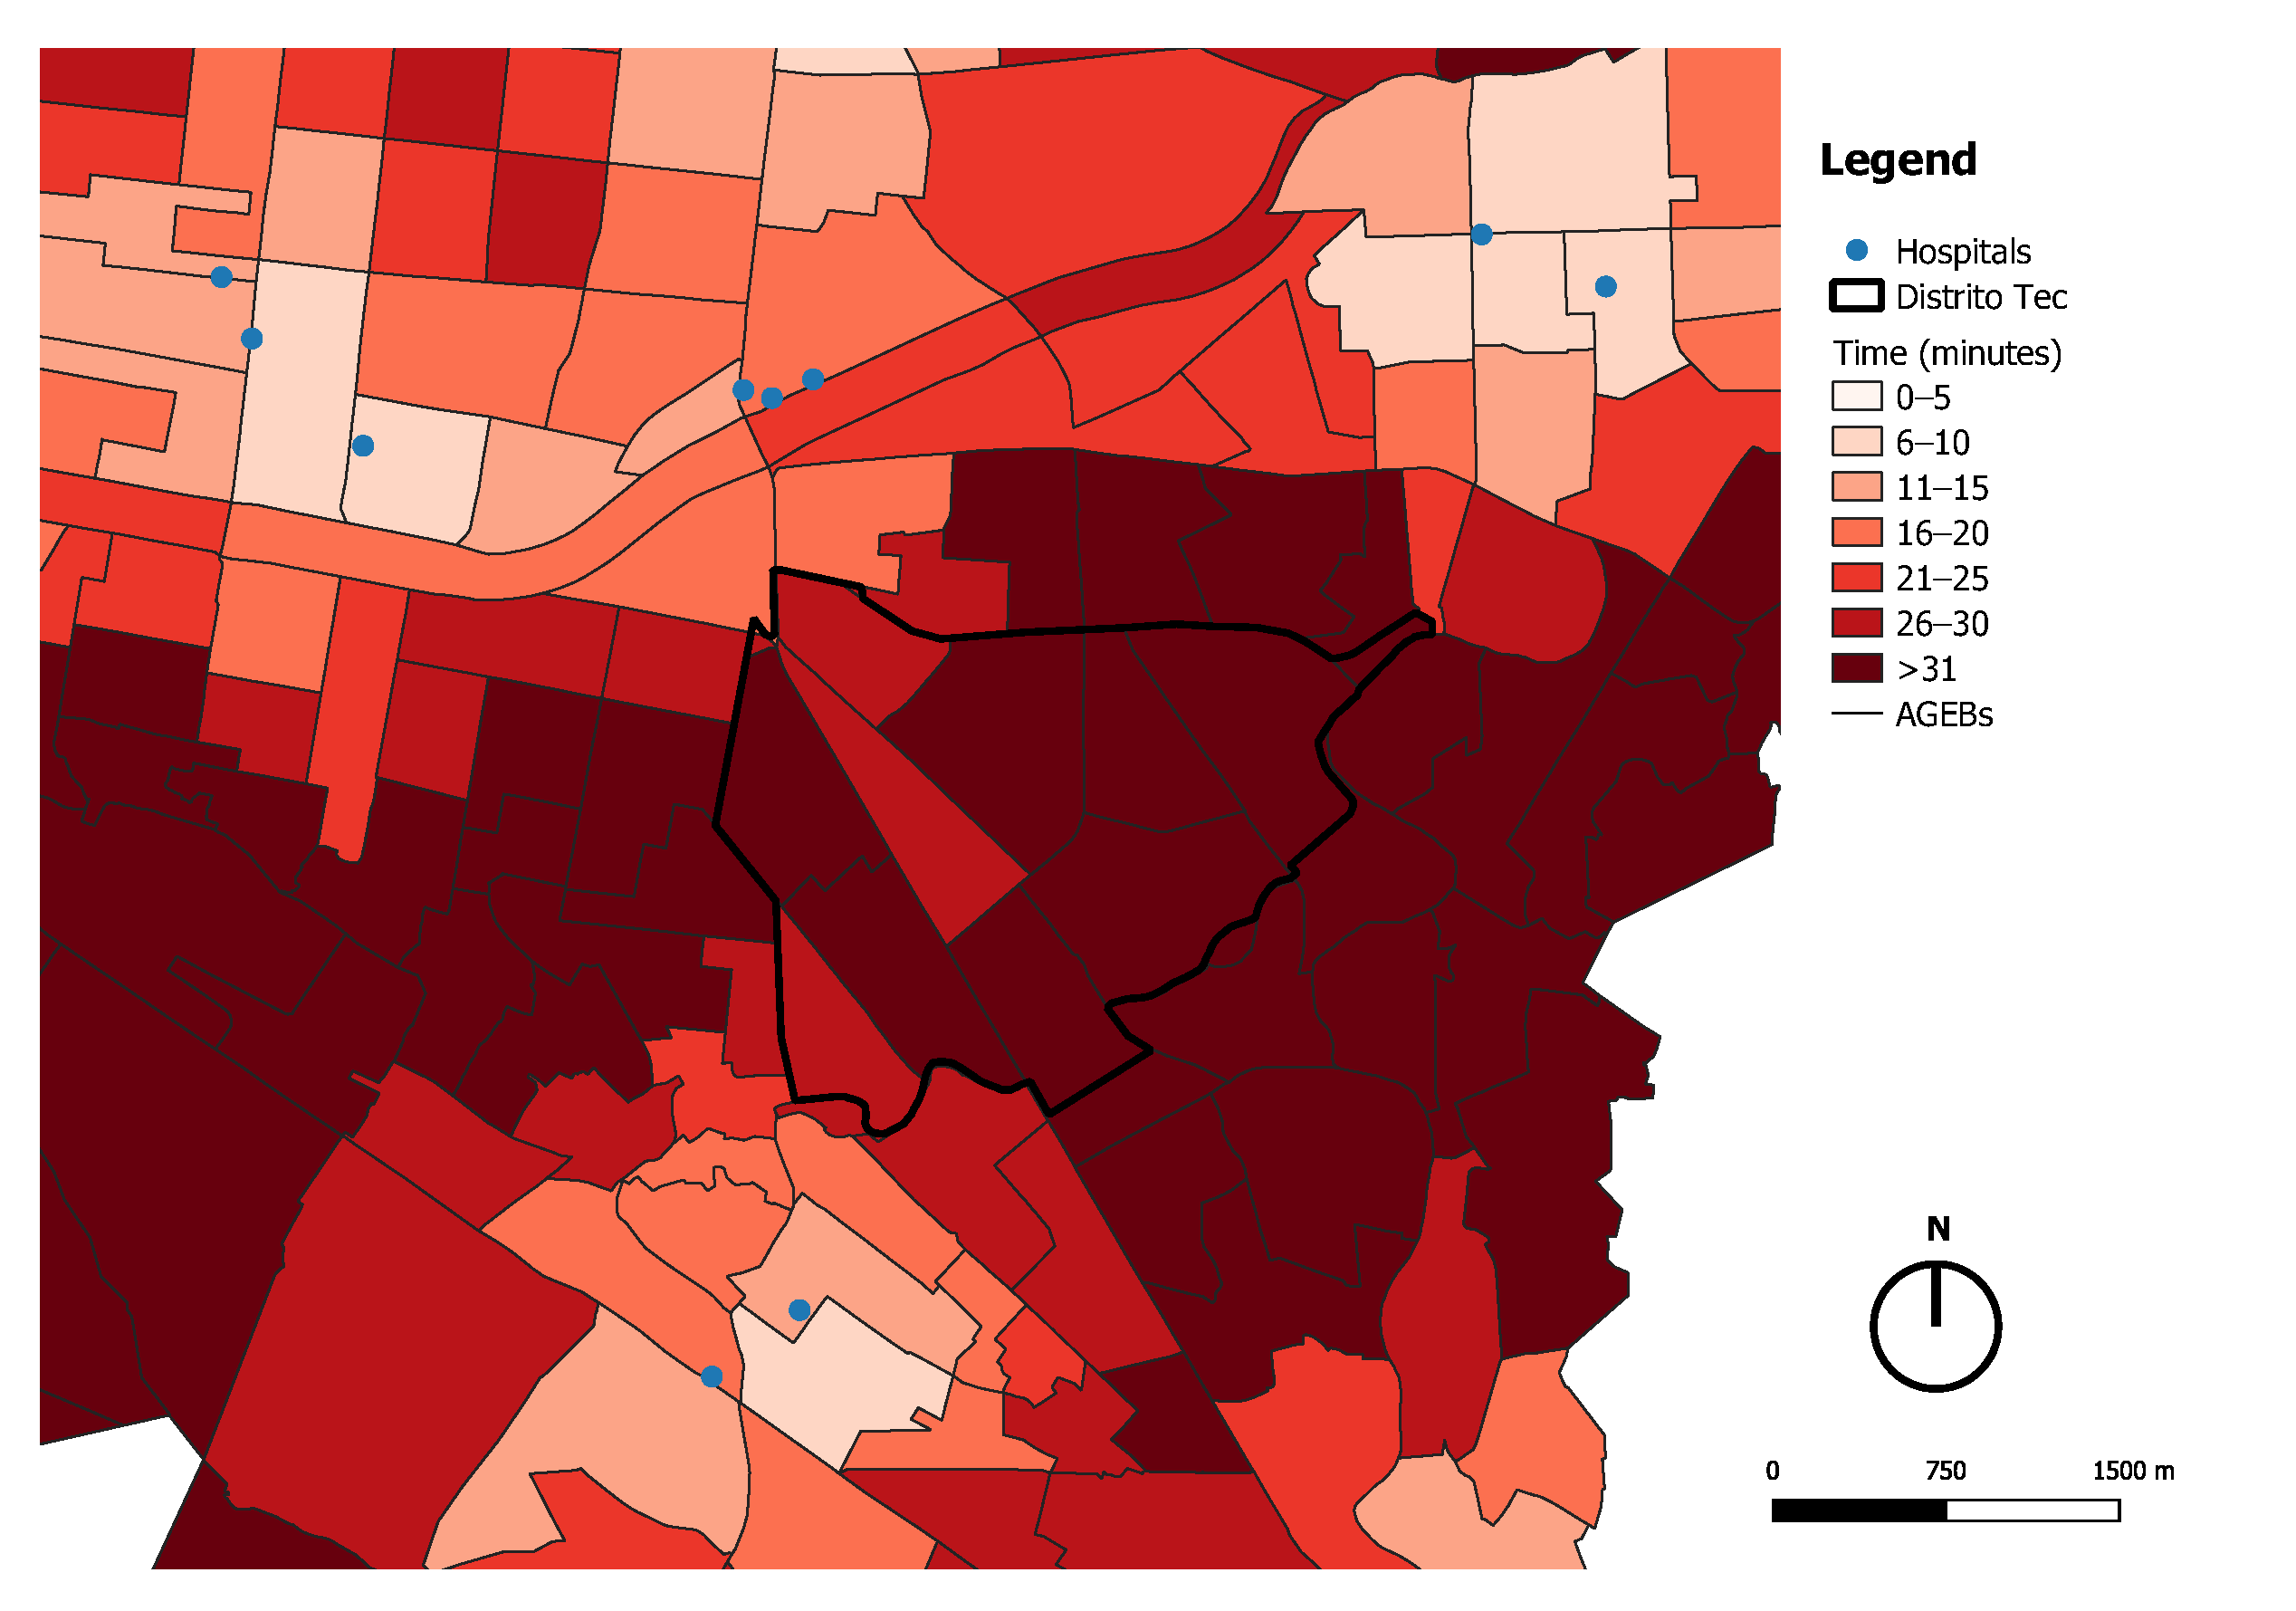
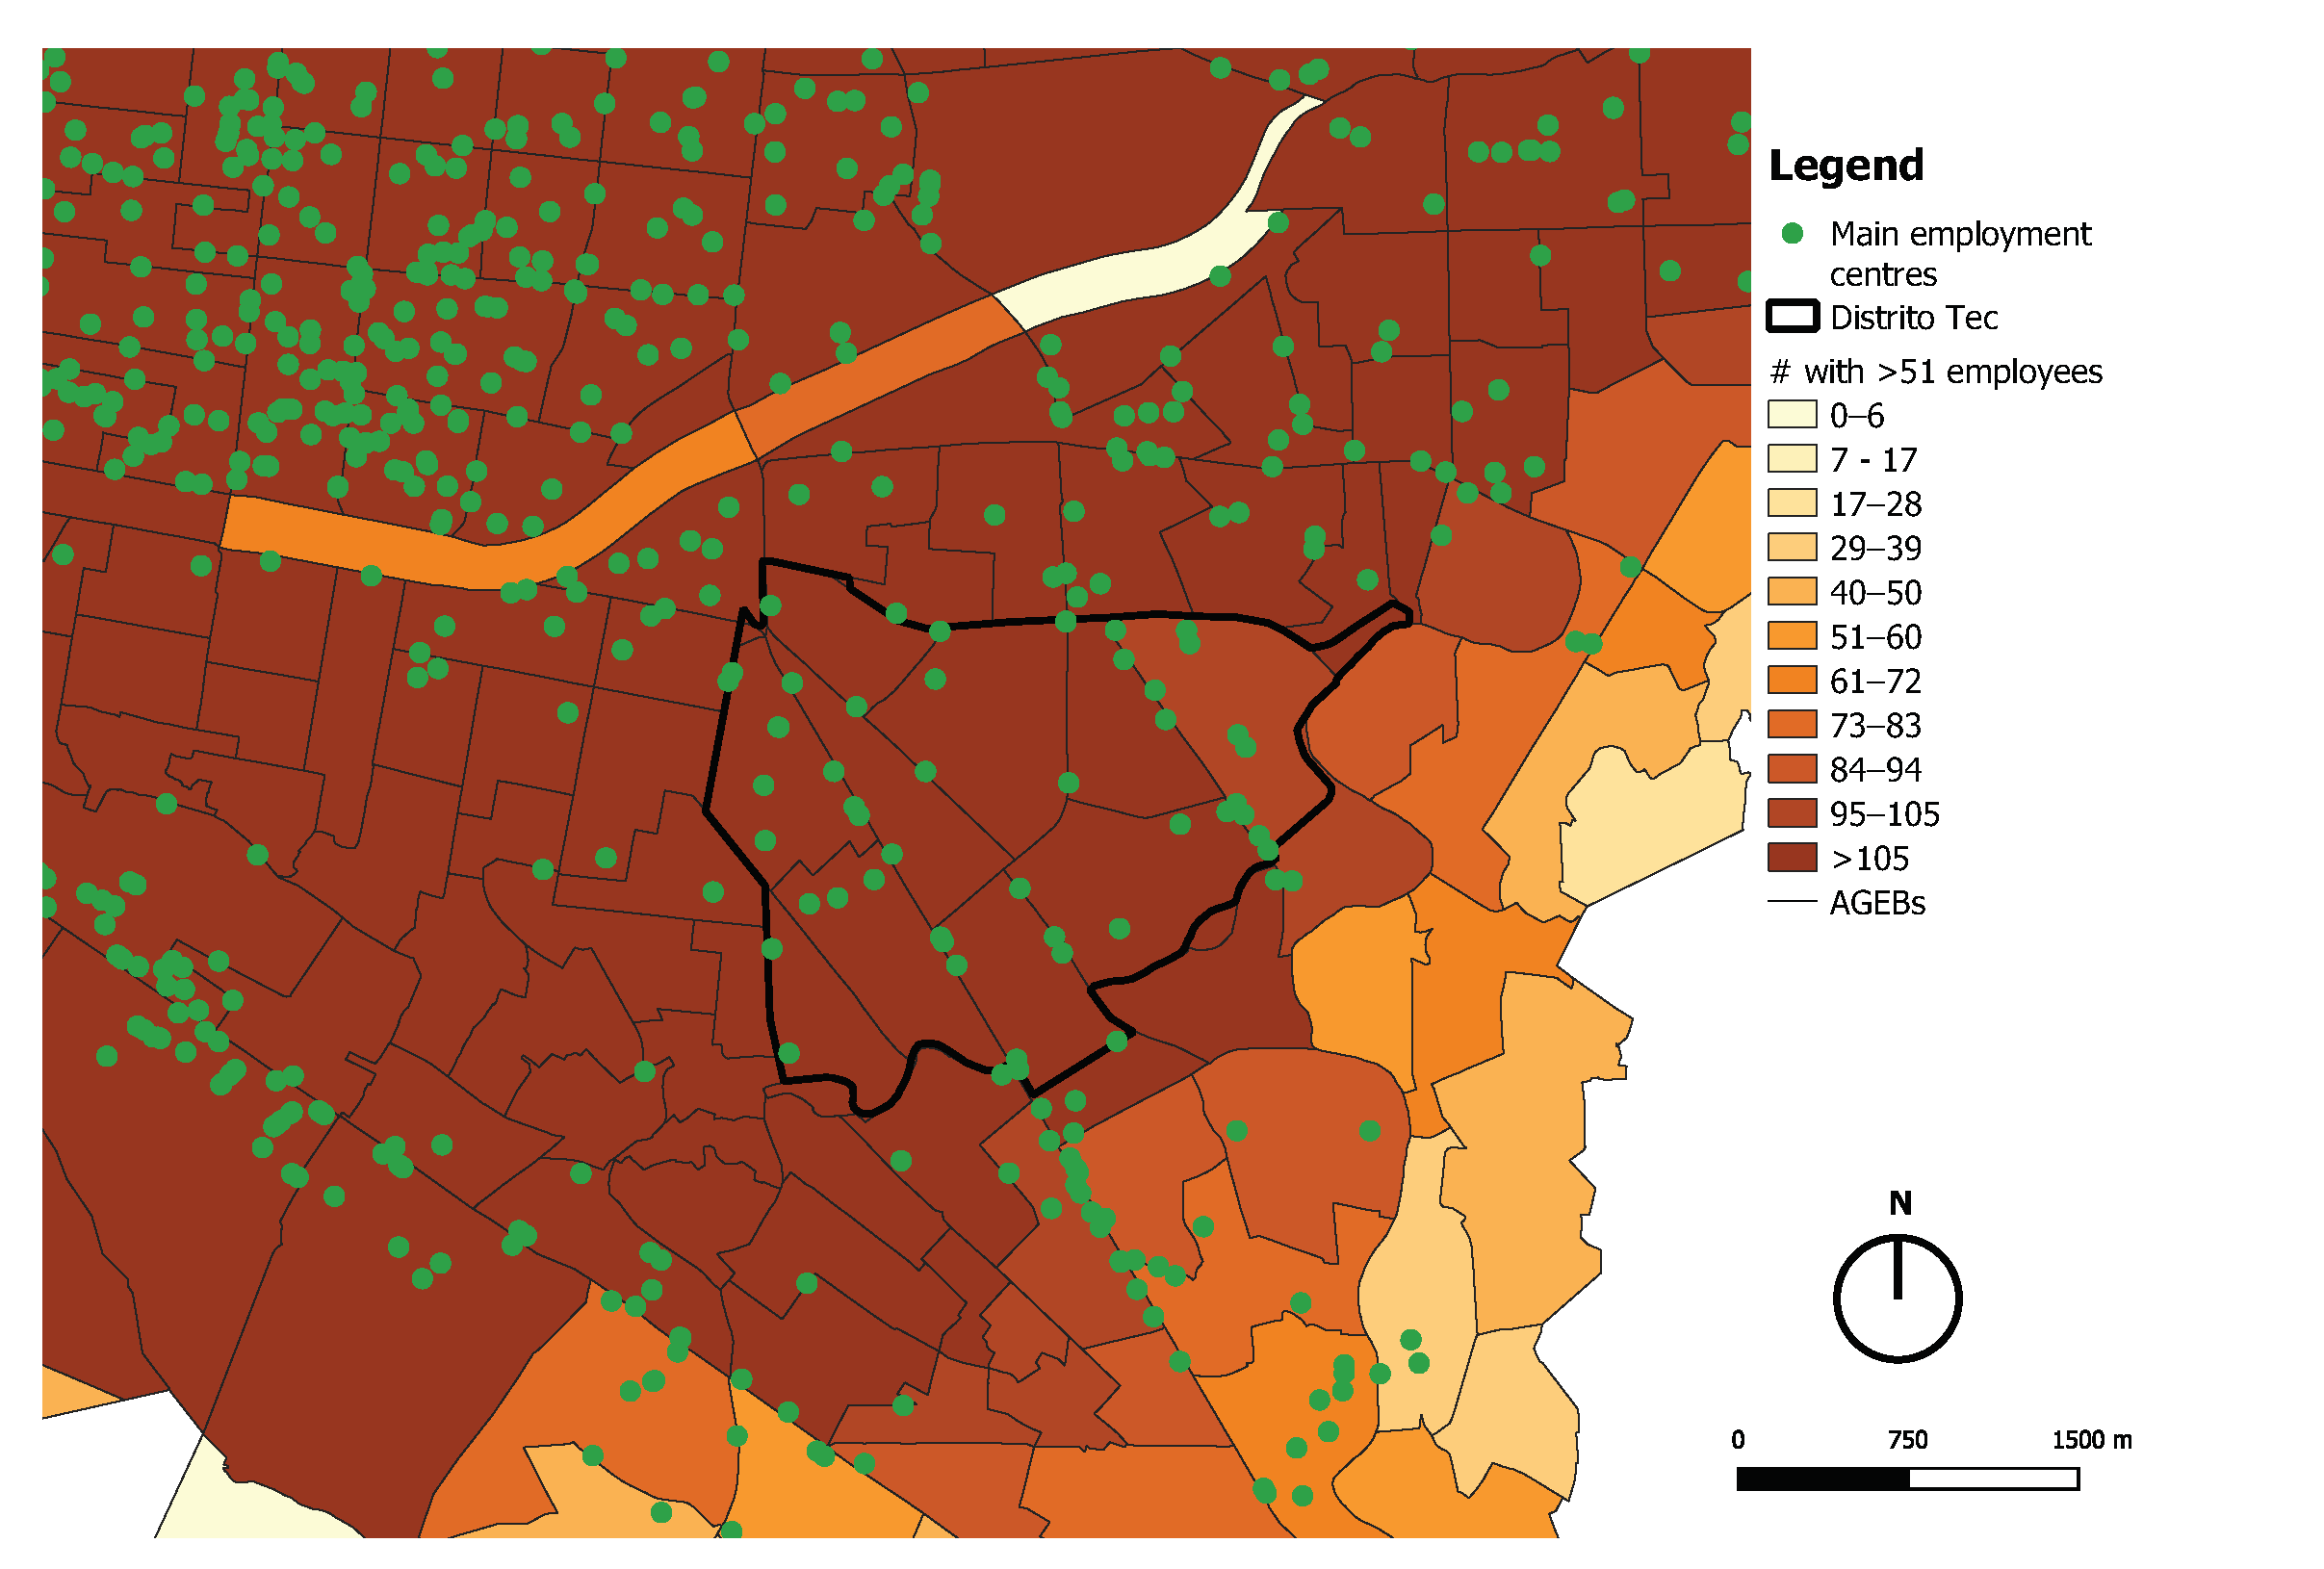
3.2. Distrito Tec Area
4. Discussion
- Rethink the planning of the city starting at the local level. The results demonstrate that the MMZ is extremely heterogeneous and that not all of the population of urban areas has the same needs. Hence, before thinking about what interventions at a large scale have to be made, it is important to understand what is happening at the microlevel. To do so, speaking to citizens and opening citizen participation spaces are crucial to extract relevant information about what are the most important needs. If this process is replicated throughout the entire city, many of the metropolitan issues will be solved without having to perform metropolitan interventions. This is a win-win procedure, as the authorities spend less of their budgets and do so more wisely and local people obtain tailor-made solutions to their problems;
- Embrace land use mixture. People need more than their house to carry out their daily lives. Therefore, each neighbourhood should have enough land use mixture to allow the local population to access commercial activities, recreation, education, employment, and health. If people can find all these opportunities in the vicinity of their household, mobility and all its negative effects would dramatically reduce. Furthermore, the short distances that people would require to travel would encourage the use of sustainable transport modes such as walking or cycling. The authorities have a key role in influencing the structure of the city through building permits. Thus, they should not provide any permits to create residential areas unless they ensure that the needed land use mix will be available for the local population to address their daily needs;
- Promote the use of bicycles and other micromobility vehicles. The results demonstrate that using a bike drastically increases the number of destinations that a person can reach in a given time. Therefore, the improvements that have to be made in terms of mobility and transport networks in the MMZ and at the local level should concentrate on increasing the quality and coverage of public transport for metropolitan journeys and creating open streets with safe and comfortable cycling lanes for short and local trips. By doing so, the number of destinations (opportunities) does not necessarily have to be increased, but only the ease of reaching them. If the MMZ wants to reduce the extreme use of motorised vehicles, the first step to take is to reduce the public space designated to them by creating a safe built environment for other transport users;
- Accessibility is a social and gender policy. Usually, the groups with the lowest incomes live in areas of the city where accessibility levels are low and marginalisation levels are high; this is not an exception for the MMZ. Therefore, increasing accessibility in such areas will bring massive benefits to such populations as their transportation expenditures (for the specific case of women, this is known as the “Pink Tax”) will decrease, as well as their travel distances and times, hence improving their quality of life and sense of belonging to their local community. Additionally, women in Mexican cities usually have more complex travel patterns than men, as they tend to visit many different destinations in one day (trip-chaining), carry heavy things, and accompany other persons (mobility of care) in their trips [23]. Consequently, making all these destinations easier and less expensive to access will bring important improvements to the travel behaviours and patterns of women. Finally, women argue that they usually feel unsafe when using public transport [23]; thus, using bikes and walking as their main transport modes will make them feel safer in their daily trips. In addition, further research should be conducted to assess the changing needs of an ageing society and accessible mobility in MMZ;
- Decentralise the city. As in many other cities in the world, most of the main employment centres of the city are located in central areas. This localisation pattern results in a phenomenon where, during the morning, the origin of most trips to go to work is from suburban areas, and the destination is the centre of the city. In the afternoon, most people travel back home, and the mobility pattern is inverted, starting in the centre and ending in suburban areas. Such a way of structuring the city creates traffic, as well as extremely long average distances and travel times, which result in high economic, social, and environmental costs. Hence, it is important to apply planning processes or economic activities (especially commerce and services) that encourage the localisation of such activities in different parts of the city, creating subcentres and reducing the need for metropolitan mobility.;
- Increase the density of the city. With only 698 people per square kilometre, the MMZ is not a dense city. Large sprawling cities with low densities go against accessibility, as there is not enough critical mass (demand) to implement some opportunities throughout the entire city. This generates a dependency on middle to large-distance motorised travel. Considering the nature of the MMZ, it is recommended that the city no longer sprawl. To do so, it has to generate all-income-level vertical housing in central areas. The authorities play a key role in doing so by putting in action economic incentives for developers (such as tax waivers or reductions) to build social vertical housing in central areas and by eradicating any permits to develop large monofunctional suburban residential gated communities. This is an ambitious plan for a city like the MMZ, as it has historically grown horizontally and with most of its population preferring single-family housing schemes rather than apartments. Nevertheless, the transformation of its urban structure to a denser area will bring massive social, economic, and environmental benefits to the local population in the short, middle, and long term;
- Downsize urban infrastructure and equipment. It has been demonstrated that high-capacity and large-scale destinations such as public general hospitals or shopping centres attract many persons who live in other districts. Therefore, having a larger number of small-scale opportunities dispersed along the city would allow locals to access their daily needs in their neighbourhood. This would drastically reduce middle to long distance mobility, as well as the use of motorised vehicles. It is important to mention that certain destinations, such as specialised hospitals, will still have a metropolitan radius of influence. For these kinds of opportunities, sustainable and diverse transport alternatives have to be guaranteed;
- Use of technology. One of the major lessons that the COVID-19 pandemic has left is the massive potential that technology has to reshape education, commerce, and employment. This can generate important changes in the urban realm. By encouraging the use of technology in schools, commerce, and employment centres (e-learning, e-commerce, and home offices), mobility can drastically reduce the need to go to a specific location every day. Lowering the number of travelling people reduces the overloading of public transport, as well as the traffic levels, bringing important social, economic and environmental benefits. Additionally, spaces that are no longer needed, such as some office buildings, can be reconverted (taking advantage of their usual central location) to other uses such as commerce, housing, or schools. Finally, it must be said that using technology brings considerable economic benefits to employers, the government, and society, as mobility is expensive for all.
5. Conclusions
Author Contributions
Funding
Institutional Review Board Statement
Informed Consent Statement
Data Availability Statement
Acknowledgments
Conflicts of Interest
References
- Nations, U. Cities and Polution. Available online: https://www.un.org/en/climatechange/climate-solutions/cities-pollution#:~:text=According%20to%20UN%20Habitat%2C%20cities,cent%20of%20the%20Earth%27s%20surface (accessed on 28 May 2021).
- Leo, A.; Morillón, D.; Silva, R. Review and analisys of urban mobility strategies in Mexico. Case Stud. Transp. Policy 2017, 5, 299–305. [Google Scholar] [CrossRef]
- Chavez-Rodriguez, L.; Lomas, R.T.; Curry, L. Environmental justice at the intersection: Exclusion patterns in urban mobility narratives and decision making in Monterrey, Mexico. DIE ERDE J. Geogr. Soc. Berl. 2020, 151, 116–128. [Google Scholar] [CrossRef]
- Montalvo-Urquizo, J.; Villarreal-Marroquín, M.G.; Hernández-Castillo, J.J.; Hernández-González, H.E. MWTP: Monterrey Weather, Traffic and Pollution Database for Geospatial Analysis. arXiv 2017, arXiv:1703.04526. [Google Scholar]
- Sisto, N.P.; Ramírez, A.I.; Aguilar-Barajas, I.; Magaña-Rueda, V. Climate threats, water supply vulnerability and the risk of a water crisis in the Monterrey Metropolitan Area (Northeastern Mexico). Phys. Chem. Earth 2016, 91, 2–9. [Google Scholar] [CrossRef] [Green Version]
- de Nuevo León, G. Programa Integral de Movilidad Urbana Sustentable (PIMUS-ZMM). 2010. Available online: https://www.nl.gob.mx/publicaciones/documento-ejecutivo-pimus (accessed on 19 March 2021).
- Hancke, G.P.; de Silva, B.C.; Hancke, G.P. The role of advanced sensing in smart cities. Sensors 2013, 13, 393–425. [Google Scholar] [CrossRef] [PubMed] [Green Version]
- Tec, D. Distrito Tec. 2021. Available online: http://distritotec.itesm.mx/categorias/colonias/ (accessed on 19 March 2021).
- Rezende, D.A.; Bustani, C.E.G. The urban districts and tourist improvement in the Strategic Digital City: The DistritoTec in Monterrey, Mexico. TURyDES Rev. Tur. Desarro. Local 2018, 11, unpaginated. [Google Scholar]
- Krajzewicz, D.; Heinrichs, D.; Cyganski, R. Intermodal Contour Accessibility Measures Computation Using the ‘UrMo Accessibility Computer’. Int. J. Adv. Syst. Meas. 2017, 10, 111–123. [Google Scholar]
- Mora, H.; Gilart-Iglesias, V.; Pérez-Del Hoyo, R.; Andújar-Montoya, M.D. A comprehensive system for monitoring urban accessibility in smart cities. Sensors 2017, 17, 1834. [Google Scholar] [CrossRef] [PubMed] [Green Version]
- Geurs, K.; Ritsema van Eck, J.R. Accessibility Measures: Review and Applications. Evaluation of Accessibility Impacts of Land-Use Transportation Scenarios, and Related Social and Economic Impact; Technical Report 90715; Netherlands Environmental Assessment Agency: The Hague, The Netherlands, 2001. Available online: https://www.pbl.nl/en/publications/Accessibility_measures__review_and_applications (accessed on 19 March 2021).
- Moreno, C.; Allam, Z.; Chabaud, D.; Gall, C.; Pratlong, F. Introducing the “15-minutes City”: Sustainability, Resilience and Place Identity in Future Post-Pandemic Cities. Smart Cities 2021, 4, 6. [Google Scholar] [CrossRef]
- Oswald Beiler, M.R.; Phillips, B. Prioritizing Pedestrian Corridors Using Walkability Performance Metrics and Decision Analysis. J. Urban Plan. Dev. 2016, 142, 04015009. [Google Scholar] [CrossRef]
- Krajzewicz, D.; Nieland, S.; Balzaretti, J.; Heinrichs, D. Assessing Sustainable Development Goals: A Transferable Approach Using Contour Accessibility Measures at the Example of Berlin and Mexico City. In Proceedings of the MOVICI-MOYCOT 2018: Joint Conference for Urban Mobility in the Smart City, Medellin, Colombia, 18–20 April 2018; pp. 1–7. [Google Scholar] [CrossRef]
- Park, S.; Nielsen, A.; Bailey, R.T.; Trolle, D.; Bieger, K. A QGIS-based graphical user interface for application and evaluation of SWAT-MODFLOW models. Environ. Model. Softw. 2019, 111, 493–497. [Google Scholar] [CrossRef]
- Kwan, M.P. Space-time and integral measures of individual accessibility: A comparative analysis using a point-based framework. Geogr. Anal. 1998, 30, 191–216. [Google Scholar] [CrossRef]
- López-Alonso, M. Growth with Inequality: Living Standards in Mexico, 1850–1950. J. Lat. Am. Stud. 2007, 39, 81–105. [Google Scholar] [CrossRef]
- CONAPO. Anexo C Metodología de Estimación del Índice de Marginación Urbana. 2010. Available online: http://www.conapo.gob.mx/work/models/CONAPO/Resource/862/4/images/06_C_AGEB.pdf (accessed on 28 May 2021).
- CONAPO. Datos Abiertos del Índice de Marginación. Available online: http://www.conapo.gob.mx/es/CONAPO/Datos_Abiertos_del_Indice_de_Marginacion/ (accessed on 28 May 2021).
- Saroha, J. Types and Significance of Population Pyramids. World Wide J. Multidiscip. Res. Dev. 2018, 4, 59–69. [Google Scholar]
- Bai, X.; Nagendra, H.; Shi, P.; Liu, H. Cities: Build networks and share plans to emerge stronger from COVID-19. Nature 2020, 584, 517–520. [Google Scholar] [CrossRef] [PubMed]
- Soto-Villagrán, P. Análisis de la Movilidad, Accesibilidad y Seguridad de las Mujeres en tres Centros de Transferencia Modal (CETRAM) de la Ciudad de México; Technical Report IDB-TN-1780; Banco Interamericano de Desarrollo: Mexico City, Mexico, 2019. [Google Scholar] [CrossRef]


| Variable | Database | Institution | URL (All Data Was Accessed on 20 February 2021) |
|---|---|---|---|
| Municipalities | INEGI | INEGI | https://www.inegi.org.mx/app/biblioteca/ficha.html?upc=702825218867 |
| Blocks | INEGI | INEGI | https://www.inegi.org.mx/app/biblioteca/ficha.html?upc=702825218867 |
| AGEBs | INEGI | INEGI | https://www.inegi.org.mx/app/biblioteca/ficha.html?upc=702825218867 |
| DENUE | DENUE | INEGI | https://www.inegi.org.mx/app/descarga/default.html |
| Roads | OSM | OSMF | https://www.openstreetmap.org/#map=10/24.6488/-100.5263 |
| Code | Category | What Does It Include? |
|---|---|---|
| 611112 | Public sector preschools | Economic units of the public sector which are mainly dedicated to providing preschool education including indigenous, and community types. |
| 611122 | Public sector primary schools | Economic units of the public sector which are mainly dedicated to providing primary education including indigenous, community, and adult types. |
| 611132 | Public sector general secondary | Economic units of the public sector which are mainly dedicated to providing secondary education including tele-secondary (televised lessons), community, and adult types. |
| 611142 | Public sector technical secondary | Economic units of the public sector which are mainly dedicated to providing technical secondary education including indigenous types. |
| 611152 | Public sector terminal technical | Economic units of the public sector which are mainly dedicated to providing technical high school education of a terminal nature. |
| 611162 | Public sector high schools | Economic units of the public sector which are mainly dedicated to providing general or technical baccalaureate education, of a preparatory nature, including tele-baccalaureate (televised lessons). |
| 622112 | General public sector hospitals | Economic units of the public sector which are mainly dedicated to providing medical services for a wide range of diseases among children, women, the elderly, or patients in general. These economic units have facilities for the hospitalisation of patients and are known as general, paediatric, geriatric, and women’s disease hospitals. |
| 622212 | Public sector addiction medical services and psychiatric hospitals | Economic units of the public sector which are mainly dedicated to providing treatment to patients who require hospitalisation due to psychological disorders and addiction. |
| 622312 | Public sector hospitals of services for other medical specialties | Economic units of the public sector which are dedicated primarily to the care of specific diseases or the condition of an apparatus or system. These economic units have facilities for the hospitalisation of patients and are known as oncology, gynaecological-obstetric, pneumonia, and cardiology hospitals. |
| 462111 | Retail trade supermarkets | Economic units (supermarkets) which are mainly dedicated to the retail trade of a wide variety of products, such as food, clothing, cleaning supplies and household items, organised into sections or specialised exhibition areas that facilitate direct access by the public to the goods. |
| Scale (Accessibility) | Time (min) | Distance Cycling (m) | Distance Walking (m) |
|---|---|---|---|
| Low | >30 | >6000 | >1800 |
| Medium | 15–30 | 3000–6000 | 900–1800 |
| High | 0–15 | 0–3000 | 0–900 |
| Type of Hospital | Regional | Urban |
|---|---|---|
| General Hospital (SSA) | 60 km (or max. 2 h) | population centre |
| General Hospital (IMSS) | 30 km to 200 km (or 30 min to 5 h) | 1 h to the population centre |
| Urban Health Centre (SSA) | 5 to 15 km (or 30 min) | 1 km (or max. 30 minutes) |
| Medical Unit (ISSSTE) | 30 to 60 min | 30 min |
| Medical Unit (IMSS) | 15 km (or 20 min) | 5 km (or 10 min) |
| Health Clinic (ISSSTE) | only local scope | 30 min |
| Hospital Clinic (ISSSTE) | 2 h max. | population centre |
| Regional Hospital (ISSTE) | 3 to 4 h | population centre |
Publisher’s Note: MDPI stays neutral with regard to jurisdictional claims in published maps and institutional affiliations. |
© 2021 by the authors. Licensee MDPI, Basel, Switzerland. This article is an open access article distributed under the terms and conditions of the Creative Commons Attribution (CC BY) license (https://creativecommons.org/licenses/by/4.0/).
Share and Cite
Gaxiola-Beltrán, A.L.; Narezo-Balzaretti, J.; Ramírez-Moreno, M.A.; Pérez-Henríquez, B.L.; Ramírez-Mendoza, R.A.; Krajzewicz, D.; Lozoya-Santos, J.d.-J. Assessing Urban Accessibility in Monterrey, Mexico: A Transferable Approach to Evaluate Access to Main Destinations at the Metropolitan and Local Levels. Appl. Sci. 2021, 11, 7519. https://doi.org/10.3390/app11167519
Gaxiola-Beltrán AL, Narezo-Balzaretti J, Ramírez-Moreno MA, Pérez-Henríquez BL, Ramírez-Mendoza RA, Krajzewicz D, Lozoya-Santos Jd-J. Assessing Urban Accessibility in Monterrey, Mexico: A Transferable Approach to Evaluate Access to Main Destinations at the Metropolitan and Local Levels. Applied Sciences. 2021; 11(16):7519. https://doi.org/10.3390/app11167519
Chicago/Turabian StyleGaxiola-Beltrán, Ana Luisa, Jorge Narezo-Balzaretti, Mauricio Adolfo Ramírez-Moreno, Blas Luis Pérez-Henríquez, Ricardo Ambrocio Ramírez-Mendoza, Daniel Krajzewicz, and Jorge de-Jesús Lozoya-Santos. 2021. "Assessing Urban Accessibility in Monterrey, Mexico: A Transferable Approach to Evaluate Access to Main Destinations at the Metropolitan and Local Levels" Applied Sciences 11, no. 16: 7519. https://doi.org/10.3390/app11167519
APA StyleGaxiola-Beltrán, A. L., Narezo-Balzaretti, J., Ramírez-Moreno, M. A., Pérez-Henríquez, B. L., Ramírez-Mendoza, R. A., Krajzewicz, D., & Lozoya-Santos, J. d.-J. (2021). Assessing Urban Accessibility in Monterrey, Mexico: A Transferable Approach to Evaluate Access to Main Destinations at the Metropolitan and Local Levels. Applied Sciences, 11(16), 7519. https://doi.org/10.3390/app11167519