Abstract
Saudi Arabia is one of the countries with the highest number of road accidents and associated fatalities in the world. Speeding has been identified as an important cause of increased traffic accidents, which also aggravate their severity. Road safety improvement strategies are primarily based on the accurate identification of accident hotspots. Installing speed cameras at a network level is an expensive road safety measure, and its spatiotemporal effectiveness should be assessed. In this study, a traffic accident risk assessment framework has been developed and implemented on the 84 km long Buraydah Ring Road in the Qassim region of Saudi Arabia. The selected highway was divided into 42 (×2 km long) segments using the ArcGIS software. A risk scoring scheme was developed to incorporate both the frequency and severity of road accidents. Speed cameras installation at various segments showed a 70% decline in total accident counts, 53% in accidents with property damage, 84% decline in accidents causing injury, and complete absence of accidents with fatalities. The 48% segments were identified as hotspots with risk level ≥ medium, while the speed cameras installation completely eliminated the hotspots from the study area. The proposed framework can be implemented on major high-speed highways, accommodating high traffic volumes, for hotspot identification and evaluation of various road safety measures in Saudi Arabia and elsewhere.
1. Introduction
Safe mobility is a critical element for urban and rural communities and is a basic right of road users [1]. Roadway accidents are one of the leading causes of injuries and fatalities in many countries around the world. With approximately 1.35 million fatalities, road traffic accidents have become a global public health concern and is reported to cause of deaths for children and young adults aged 5–29 years [2,3,4]. Road transport safety is influenced by both several human factors (e.g., driver’s performance, awareness, knowledge, and perception), environmental factors (e.g., poor visibility due to rainfall or sand storms), and vehicle characteristics (e.g., vehicle weight, engine size, wheelbase and age of vehicle) [5]. Multiple factors interact in road crashes, which are generally grouped in relation to the infrastructure (road condition), the vehicle (state of the vehicle) and the driver (human condition) [6,7,8]. More than 300,000 traffic accidents occur in the Kingdom of Saudi Arabia (KSA) every year [9]. Traffic accidents account for over 30 percent of hospital bed occupancy, and the country is losing more than SR 13 billion due to traffic accidents [5]. The severity of a crash is associated with driver characteristics (such as sleep, distraction, overspending), accident characteristics (such as sudden lane deviation or collisions with other moving cars, road barriers, pedestrians, or motorcyclists), and environmental conditions [10].
The primary indicator used in ranking the severity of the road safety situation is the number of fatalities per 10,000 registered vehicles [6]. KSA is a developing country that suffers high rates of injuries and fatalities caused by roadway accidents. A high fatality rate of 28.8 per 100,000 population makes Saudi Arabia amongst the countries with the highest fatality rate in the Middle East; moreover, the fatalities are about eight times higher and injury crashes are twice as frequent as in the USA [11]. Reasons behind the high rates may potentially be associated with a wide variety of factors, such as ever-increasing vehicle registrations and usage, high-income rates, low fuel cost, extensive roadway construction throughout the country, and a high percentage of young drivers. Traffic accidents represent the leading cause of death and disability in the young, 16 to 36 years old, drivers in KSA [12]. Hence, planning, implementation, and post-evaluation of traffic calming measures is inevitable for KSA.
Different types of traffic calming measures and their effects are well-reported, e.g., speed cameras [13], traffic lights turning red if speed limit is exceeded [14], speed control using automatic detection of road signs [15], and vertical and horizontal deflections [16]. For instance, installing speed cameras significantly reduced the number of accidents in United Kingdom from 17% to 39% between 1992 and 2016. Accordingly, the fatalities within 500 m of the installed cameras reduced at a high percentage ranging from 58% to 68% during the same period [13]. The Saudi Arabia Ministry of Transport is putting serious efforts into improving road safety in all the regions of the country. Some efforts, including the installation of speed cameras and appropriate signs and lane-marking have significantly improved the overall road safety on both the urban and rural highways. However, an effective accident risk assessment methodology to evaluate the impact of these measures on accident reduction remains unaddressed to date.
There are few studies available in current literature that explored the patterns, trends, and relationships between driver behavior and crash severity in different cities of KSA [17,18,19]. Hussien [20] identified hazardous road locations based on accident frequency per 100 km in KSA. Jamal et al. [5] used logistic regression models to predict crash severity and identified the significant factors (drivers and crash characteristics) contributing to a large number of accidents at the national level. Rahman et al. [19] proposed various effective accident prevention and mitigation techniques, such as traffic control, traffic-calming measures, safety education initiatives, and collaboration of key stakeholders for Dammam, KSA. Moreover, for practical implementation of safety measures at the local or regional level, a more detailed analysis is required with much smaller road segments.
Qassim Province is one of the thirteen administrative regions of KSA, and it is located at the center of the country. In the past, Qassim has a high road traffic accident rate similar to other regions in the Kingdom, and one of the main reasons is over speeding [21]. The review of past studies revealed that there is no previous study that identifies accidents’ hotspots in the main roadways in the Qassim region. The main goal of this research is to develop a framework for traffic accident risk identification and management for Qassim region. The proposed traffic accident risk assessment framework is used for exploring the highway safety situation before and after installation of traffic enforcement scheme (speed cameras). The GIS-based risk assessment methodology will help traffic engineers to identify hotspots and implement rational road safety measures in KSA and elsewhere.
2. Related Works
For improving road safety, the first step is identification of accidents hotspots. In most cases, road traffic crashes (RTCs) occur in certain locations along the road networks named crash hotspots. Although they have different definitions, they are generally perceived as locations with frequent crashes. Development of the hotspots hazard index (based on the frequency of accidents and corresponding severities) can be a great tool to identify the problem locations and implement rational safety measures. The presence of hotspots comes from the awareness of the apparent spatial relationship between neighboring accident locations [22]. The next step is the diagnosis of these spots followed by finding countermeasures, estimating effects and costs, prioritizing, implementing and lastly follow-up and evaluation [23]. There are several methods that have been utilized in the hotspot identification process. The most widely used methods in this regard are nearest neighborhood hierarchical clustering (NNHC), kernel density estimation method (KDE), local indicators of spatial association (LISA). full Bayesian (FB) empirical Bayes (EB) are also very popular in identifying patterns of accident hotspots. The KDE method involves a network-constrained estimation of kernel density that is a kind of spatial analysis. To estimate collision density, KDE uses expected collision counts and graphically displays the areas with high densities of expected collision counts [24]. In other words, KDE determines spatial patterns, in which the density of events around each point is calculated and scaled by the distance between the point and each event. Because a discrete density surface is made continually by interpolation, KDE describes a smooth and continuous surface map of risk targets even with limited data [25]. However, the KDE uses only accidents number around each point without taking into account the severity of the accidents.
In the LISA method for the identification of hotspots, the entire area is first divided into spatial units. This is followed by the determination of the local density estimate known as the LISA index for each spatial unit. The obtained LISA indices are then used to evaluate the spatial concentration of observed traffic accidents at the neighboring unit. A spatial unit is identified as a hotspot if the LISA index for that spatial is greater than a fixed threshold. In the NNH method for hotspot identification, predefined criteria is used to cluster the spatially distributed points. Clustering is iteratively repeated until all the points falling within the threshold distance are grouped together to one cluster (known as hotspot), or the process is terminated when the clustering criteria fails [26]. FB and EB are based on statistical inference to yield the expected crash frequencies at similar sites based on historical crash records [27]. Unlike previous accident hotspot identification methods, both EB and FB methods also account for regression-to-mean (RTM) of traffic accidents, giving them an edge over traditional methods. All the methods mentioned above for hotspot identification are grouped under two main categories [28,29], i.e., (i) methods based on observed accident frequencies and (ii) methods based on expected accident frequencies. The accident rate for the former analysis method is determined by calculating the number of accidents vehicle entering the road junction or per-vehicle kilometer for road segments. Numerous studies have shown that methods based on observed accident frequencies may be inadequate because traffic accidents exhibit both spatial and temporal heterogeneity, which means that crash risk factors vary from one geographic location to another and from one time zone to other. These variations may be attributed to various factors such as driver attributes, animal populations, roadway characteristics, weather conditions, crash recording procedures, and thresholds. Alternatively, based on expected crash frequencies have attracted researchers’ attention as it caters for unobserved heterogeneity in accident data.
Table 1 summarizes the past studies conducted on hotspots identification. It contains detailed information on each research study, including the theme of the study, the study area, methods adopted, prevalent accident risk factors, and proposed mitigation measures. It may be observed from the table that previous studies have adopted different types of clustering techniques (such as fuzzy clustering, k-means clustering, KDE, firefly clustering) for accident hotspot identification. Similarly, the application of various statistical regression modeling techniques (like Poisson regression, negative binomial, geographically weighted regression, and EB) was also proposed. Several studies have used ArcGIS-based methodologies for identifying the accident hotspot locations.

Table 1.
Summary of past studies on hotspot identification and road safety.
ArcGIS, developed by Environmental Systems Research Institute (Esri), Redlands, CA, USA, is a powerful spatial analysis package that can effectively identify hotspots and allows an accurate data selection, screening and reduction, and spatial analysis of the monitoring results in most of the studies. The spatial clusters developed in a GIS environment can be used for traffic accident pattern detection [22]. It also allows to develop of spatial statistics based on geographically referenced data [2,22]. Fewer studies in the Middle East and Gulf region in Table 1 suggest that an urgent attention on this important topic to improve road safety in this part of the world.
3. Materials and Methods
3.1. Accident Risk Assessment Framework
Figure 1 presents the flow chart of the risk assessment framework developed for traffic accident hazard identification in the present research. The framework starts by defining the boundaries of the study area. Then, accidents’ data for the years (2017–2019) were collected from relevant agencies and authorities. The subsequent step imports the data to ArcMap and identifies the actual accident locations on the area’s map. The road under study was divided into segments of an equal length (2000 m approx.) followed by an estimation of the risk index for each hotspot. The framework culminates at a comparison between the situations before and after the installation of speed cameras to evaluate the effectiveness of accident control measures adopted in the past.
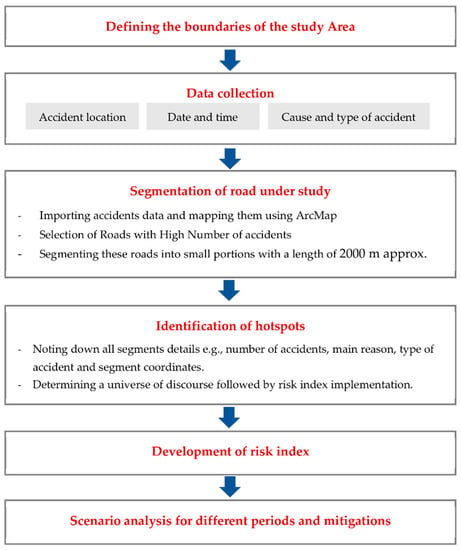
Figure 1.
Traffic accident risk assessment framework.
3.2. Study Area and Collection of Baseline Data
The Qassim region, one of the 13 administrative regions, located almost at the center of the country, accounts for about 3.2% of the total Kingdom’s area. It is geographically located between 40°00′ E, 45°00′ E longitude and 23°30′ N, 28°00′ N latitude. The Qassim region consisting of ten sub-provinces and 155 local centers has been divided into 13 governorates, including Emara_Buraidah (the capital governorate), AlAsyah, Uyun Al-Jiwa, Al-Badaya’a, Al Bakiriyah, Daria, Al Mithnab, Al Nabhanya, Ar Rass, Riyadh Al-Khabra, Al Shammasiya, Unaizah and Oklat AlSkoor [46]. Figure 2 shows the location of the Qassim region and its governorates. With a population of 1,370,727 and an area of 58,046 km², the Qassim region is one of the Middle East’s leading producers of luxury dates. Annual production of 205,000 tons of various varieties of dates (both the local consumption and international exports), enhances the economic value of the region. In addition to dates, Qassim has been known for other agricultural resources with an extensive production of fruits and vegetables. Such extensive agricultural activities add to the heavy traffic volumes on major highways.
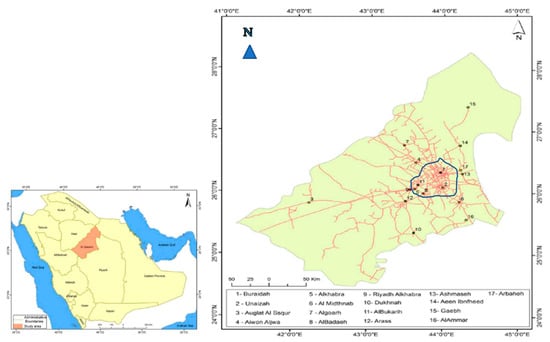
Figure 2.
Road network of Qassim Region. Qassim region is highlighted on small Saudi Arabia’s map given in the left side of the figure. Blue boundary marks the study area boundaries in Qassim Region.
Being located in the center of the country, the Qassim region holds a particular geographical significance. It borders Hail Region to the north and north-west, the Northern border region to the northeast, Riyadh region to the south and east, and the Medina region to the West and Southwest (Figure 2). Its centrality makes it an important transit route between the various sections of the KSA, strengthened by the interconnected network of highways, railways, and air routes [21]. The capital city of Qassim is Buraydah, which accommodates around 49% of the region’s total population. Qassim has a moderate level of traffic safety. Recently, Al-tit et al. [47] identified over speeding, irregular bypasses, irregular rotations, lack of prioritizing of other vehicles, irregular stops, lack of road readiness, driver carelessness, use of a cell phone while driving, and disobedience with traffic laws as the 10 significant causes of road traffic accidents in addition to lack of use of seat belts. The 85 km long Buraydah Ring Road (BRR) connecting all major city’s collectors and distributors is one of the most important highways of the region. Thus, we selected BRR as our study area and obtained the accident data from the Ministry of Transportation in Riyadh. Accident records for three years (2017 to 2019), along with the date and time, location, accident cause, and accident type were obtained and processed.
3.3. Segmentation of Highway
After launching the map of the Qassim region, the data file was separated into three different files accounting for years (2017–2019) and imported as three separate layers in ArcMap. Accidents of each year were given a different colour in order to facilitate the identification process. The main roads were selected and segmented into small segments 2000 m in length approximately. This was done by picking a starting point using “identify” tool and noting down its coordinates. Then “measure” tool was used to find the next point on the same road at a distance of 2000 m. These coordinates were assigned a labelled point using “Go To XY” tool Figure 3 illustrates the Buraydah Ring Road and its segments shown in green colour.
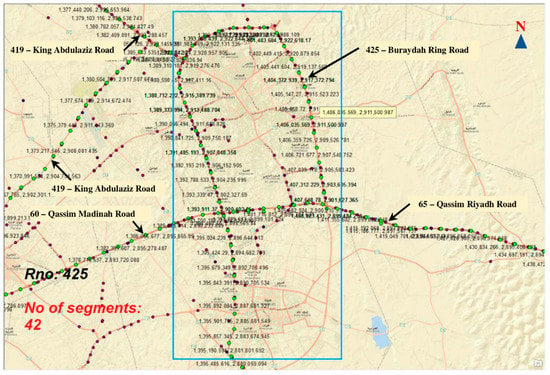
Figure 3.
Number of segments on Buraydh Ring Road—Highway 425.
3.4. Identification of Hotspots
The following step-by-step procedure was adopted for hotspot identification in the present study:
Step 1: Obtain the raw data from the Ministry of Transport, including all the accident data such as time, date, coordinates, road details, cause of an accident, type of accident and so on.
Step 2: Filter the data by road number and divided it into separate files accounting for years 2017, 2018, and 2019.
Step 3: Download the base map of the study area on ArcGIS and mark the accidents on it. Also, select the proper coordination system and set its parameters.
Step 4: Select the start and end points of the study area.
Step 5: Divide the main roads into 2000 m long segments. This segment length was selected based on closely distant grade-separated junction on BRR, which resulted in short straight road sections without any merging and diverging traffic volumes.
Step 6: Calculating the risk index (see details in the following section) for each segment and decide whether it is a hotspot or not based on the score number.
3.5. Accident Risk Index
The accident risk depends on both the frequency (number of accidents per day) and the corresponding consequences (e.g., property damage and death). For each hotspot, the accident risk index (ARI) was calculated using the following conventional relationship between accident frequency and consequence:
Frequency was defined as the number of accidents per day, while the consequence was expressed in terms of the severity of the accident. Table 2 presents the domain of discourse for both frequency and consequence adopted in the present study. A risk score was calculated for each type of accident at each hotspot.
Table 2.
Domain of discourse for risk factors.
As different types of accidents have varying significance depending of the severity, and there is a need for weighted risk assessment. Therefore, ARI at each hotspot was calculated using the following equation:
where Wi is the importance weight of each type of accident, Fi is the frequency of each type of accident, and Ci the corresponding consequence. Table 3 linguistically outlines the overall calculated risk as “very low”, “low”, “medium”, “high”, and “very high”. The risk estimated from equation (1) is essentially a score ranging from 1 to 100. After applying the weights given in the last column of Table 3, the ARI gives an aggregated risk score ranging between 0 and 77. The segments with a risk index higher than “medium” have been considered as hotspots.
Table 3.
Domain of discourse for accident risk index.
4. Results
The 84 km long BBRwas divided into 42 segments. The length of each segment was 2 km. Figure 4 shows the total number of accidents with respect to injury severity types for the year 2017. It should be noted that there were no speed cameras installed till the end of the year 2017, which resulted in more than 150 accidents on the BRR. This high number yields around 0.414 accidents per day (or around one accident every two days). Another way of describing the seriousness of the situation is accidents per kilometer, which is 1.8 accidents/km for the study area. Although the number of deaths were not very high, 74 accidents with injuries show the severity of the accidents. The speed limit of this road is 120 kph, which was frequently violated due to the absence of speed cameras.
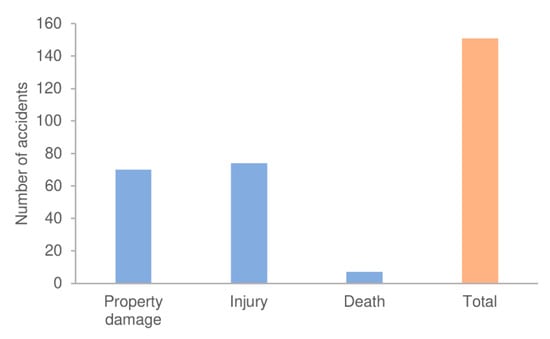
Figure 4.
Numbers and types of accidents on Buraydah Ring Road in year 2017.
Table 4 presents the data for five typical road segments from the study area with very low, low, medium, high, and very high-risk scores for the year 2017. Some of the segments (no. 5 in Table 4) observed no accidents and can be considered as safe with a “very low” risk index. The segments with occasional accidents (no. 3 in Table 4) with property damage or injury, but no accident with loss of life, obtained a “low” risk index. Such segments may need some attention for safety improvement but cannot be considered as hotspots. Segments with medium and high risk have observed high frequency of accidents with property damage or injury. These segments are hotspots even without any loss of life and need safety enhancement. Very high-risk segments have to be given utmost attention to save human lives and reduce the accident frequency.
Table 4.
Examples of five hotspots with different risk score for year 2017.
After observing high accidents and fatality rates, the Ministry of Transport installed speed cameras on both the urban and rural highways all around the country. Starting from the last quarter of 2017 to the end of the first quarter of 2018, the speed cameras were installed at hazardous locations observed with high accident frequency. Figure 5 illustrates the total number of accidents with respect to their types for the years 2018 and 2019. It can be seen in the figure that total accident counts were reduced to 70%, with a 53% decrease in accidents with property damage only and an 84% decline in accidents causing injury. The most significant improvement was achieved in reducing the severity of the accidents when no accident resulted in a loss of life.
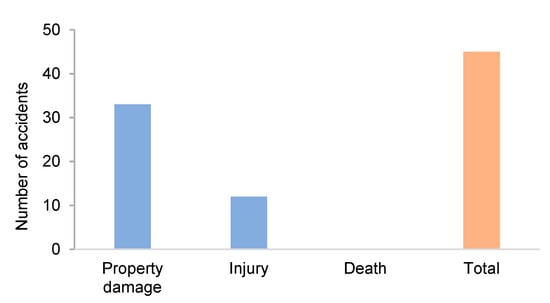
Figure 5.
Numbers and types of accidents on Buraydah Ring Road in year 2018–2019.
Figure 6 illustrates the results of accident risk assessment for the BRR. Figure 6a shows that 48% of the segments were hot spots with risk ≥ medium before the installation of speed cameras. It can also be seen that most of the hotspots existed on the North-west and Southwest sides of the study area due to more congested traffic activities and the presence of a large number of junctions. For example, segment 13 is a hot spot with high risk covers the junction between the BRR and the Qassim Madinah Highway. Likewise, segments 23 and 24 were also high-risk hot spots covering the junction between King Abdulaziz Highway and the BRR. Furthermore, segments 29 and 30 were identified as high-risk hotspots right after crossing Internal Ring Road at the Northern part of the BRR. An evident decrease in the number and severity of accidents can be observed in Figure 6b, where all the segments obtained very low or low-risk scores after the installation of speed cameras.
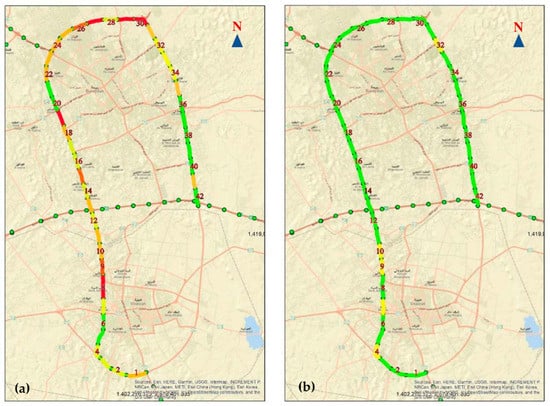
Figure 6.
Risk assessment results showing hot spots on Buraydah Ring Road: (a) before installation of speed cameras, (b) after installation of speed cameras.
5. Discussion
A speed range-based fine system was introduced after the installation of speed monitoring cameras. A 10 km/h buffer speed was allowed over and above a given speed limit as per this system. For instance, no fines up to 130 km/h on a highway segment with a 120 km/h speed limit. The fines start at speeds higher than the buffer speed but less than 20 km/h. The fine amount doubles or more for over-speeding by 20 km/h to 30 km/h, and so on. Figure 7 describes an evident accident risk reduction after the installation of speed camera. This road safety improvement strategy has eliminated the hot spots on the Buraydah Ring Road with no segment with a medium or higher risk index. The results show that such type of countermeasure worked successfully, as the drivers’ behavior changed.
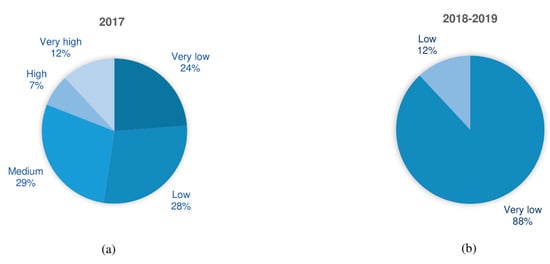
Figure 7.
Percentages of the road segments with risk levels: (a) before installation of speed cameras; (b) after installation of speed cameras.
The results presented in Figure 7 demonstrate the direct benefits of speed cameras on major highways in terms of risk reduction. Table 5 presents the data obtained for other main highways in Qassim Region. The data shows a more than 50% reduction in a total number of accidents and a 33% to 100% decline in fatalities. It is worth to mention that the stated percent reduction in traffic accidents as well as associated fatalities may be partly due to regression-to-mean (RTM) phenomenon in addition to those resulted from countermeasures (cameras) installation. According to RTM traffic accidents follows natural short-term fluctuations around expected/mean accidents frequencies. Thus, it is statistically possible that a period of high accident frequencies will be followed by low accident frequencies even in the absence of mitigation interventions and vice versa. For this study, the percent reduction in both accident frequencies and fatalities was significantly high that may not be solely attributed to RTM phenomenon, which implies that speed cameras were effective in improving the highway safety in the study area.
Table 5.
Summary of accident data on main roads in Qassim Region before and after installation of speed cameras.
Although significant improvements have been achieved with the installation of speed cameras in the study area, a rapid increase in traffic volumes is expected in the future. With this increase, additional road safety measures would be required. It can be seen in Figure 6 that the segments connected to major collectors and distributors of the Buraydah City suffered through higher accident risk prior to speed cameras installation. These approaches need to be carefully analyzed for additional safety measures. Heavy traffic is common on major highways of the Qassim Region due to the extensive inter and intra-regional agricultural trade. Past studies on traffic safety in Saudi Arabia have identified the significant factors (road, driver, and environmental) contributing to road accidents. Geometrics of merging and diverging lanes, traffic control, and traffic calming steps need to be carefully evaluated for their site-specific implementations in the Qassim Region. The accident risk assessment methodology developed in the present study can be implemented on the Highways given in Table 5 and other major urban or rural highways in Saudi Arabia for hotspot identification and appropriate positioning of speed cameras.
6. Conclusions
Saudi Arabia is one of the countries with the highest number of road accidents in the world. The fatality rate is also much higher than the global average. Over-speeding is of the most important cause of such high frequency and severity of road accidents in the country. Road safety improvement strategies primarily base on the identification of hotspots on the highway under study. Installing speed cameras is an expensive traffic calming measure, and its post-implementation spatiotemporal effectiveness should be assessed. Overall, the government traffic calming strategies has proven the effectiveness of its programs to improve the traffic safety in Saudi Arabia.
An accident risk assessment framework incorporated the frequency and severity of road accidents to evaluate the effectiveness of speed cameras. For spatiotemporal analysis of accident risk, ArcGIS divided the 84 Km long Buraydah Ring Road in Qassim Region into forty-two (2 km long) segments. Short length segments effectively identified the hotspots on the ring road keeping in view the closely located merging and diverging lanes that connect several entry and exist points around the city. The risk assessment framework identified traffic accident hotspots before and after the implementation of the traffic enforcement scheme, i.e., speed cameras installation. Following the implementation of the enforcement scheme, the accident statistics showed, a 70% decline in total accidents counts, 53% in accidents with property damage, 84% decline in accidents causing injury, and complete absence of accidents with fatalities. Prior to the installation of speed cameras, 48% of the segments were found to be the hotspots with risk level ≥ medium. As per the study results, the installation of speed cameras significantly minimized the number of hotspots from the study area. The methodology can be implemented on the highways accommodating high traffic volumes in KSA and elsewhere for hotspot identification.
Future studies need to focus on identification of significant factors (i.e., vehicles, roads, drivers) affecting the frequency and severity of the accidents in the Qassim region. In addition, socio-political sustainability of other traffic safety strategies (e.g., awareness, trainings, and incentives) should also be evaluated. Another application of the framework could be hotspot identification based on different road user groups. Although the developed framework effectively evaluated the impact of speed cameras on traffic accident risk, future studies can evaluate other traffic calming measures, such as traffic lights turning red if speed limit is exceeded, speed control using automatic detection of road signs, and vertical and horizontal deflections.
Author Contributions
M.A. was involved in conceptualization, data collection, resources, supervision, paper review, and funding acquisition. R.A. was involved in data analysis, methodology, software, and paper writing. H.H. was involved in conceptualization, methodology, supervision, and manuscript writing. F.A., M.S., A.J., and S.A. were involved in conceptualization and paper review. All authors have read and agreed to the published version of the manuscript.
Funding
This research was funded by Deanship of Scientific Research, Qassim University with Grant No. qec-1-3-2017-p-3057.
Institutional Review Board Statement
Not applicable.
Informed Consent Statement
Not applicable.
Data Availability Statement
Highly confidential data and cannot be publically shared due to the confidentiality agreement between the research and data sharing organization.
Acknowledgments
The authors gratefully acknowledge Qassim University represented by the Deanship of Scientific Research on the material support for this research under the number (qec-1-3-2017-p-3057) during the academic year 1439 AH/2018 AD. Authors also acknowledge the Ministry of Transport, Riyadh, Saudi Arabia for data sharing.
Conflicts of Interest
The authors declare no conflict of interest.
References
- Mohamed, M.; Bromfield, N.F. Attitudes, driving behavior, and accident involvement among young male drivers in Saudi Arabia. Transp. Res. Part F Traffic Psychol. Behav. 2017, 47, 59–71. [Google Scholar] [CrossRef]
- Shume, A. Road Traffic Crashes and Identification of Black spots in Bahir Dar City Using Gis. Ph.D. Thesis, Bahir Dar University, Bahir Dar, Ethiopia, 2020. [Google Scholar]
- Llopis-Castelló, D.; Findley, D. Influence of Calibration Factors on Crash Prediction on Rural Two-Lane Two-Way Roadway Segments. J. Transp. Eng. Part A Syst. 2019, 145, 04019024. [Google Scholar] [CrossRef]
- Shah, S.A.R.; Ahmad, N. Road Infrastructure Analysis with Reference to Traffic Stream Characteristics and Accidents: An Application of Benchmarking Based Safety Analysis and Sustainable Decision-Making. Appl. Sci. 2019, 9, 2320. [Google Scholar] [CrossRef] [Green Version]
- Jamal, A.; Rahman, M.T.; Al-Ahmadi, H.M.; Mansoor, U. The dilemma of road safety in the eastern province of Saudi Arabia: Consequences and prevention strategies. Int. J. Environ. Res. Public Health 2020, 17, 157. [Google Scholar] [CrossRef] [Green Version]
- Yohannes, A.Y.W.; Minale, A.S. Identifying the hot spot areas of road traffic accidents. Jordan J. Civ. Eng. 2015, 9, 358–370. [Google Scholar] [CrossRef]
- Pérez-Acebo, H.; Ziółkowski, R.; Linares-Unamunzaga, A.; Gonzalo-Orden, H. A Series of Vertical Deflections, a Promising Traffic Calming Measure: Analysis and Recommendations for Spacing. Appl. Sci. 2020, 10, 3368. [Google Scholar] [CrossRef]
- Chen, Y.; Li, Y.; King, M.; Shi, Q.; Wang, C.; Li, P. Identification methods of key contributing factors in crashes with high numbers of fatalities and injuries in China. Traffic Inj. Prev. 2016, 17, 878–883. [Google Scholar] [CrossRef]
- Al-Atawi, A.M.; Kumar, R.; Saleh, W. A framework for accident reduction and risk identification and assessment in Saudi Arabia. World J. Sci. Technol. Sustain. Dev. 2014, 11, 214–223. [Google Scholar] [CrossRef]
- Zahid, M.; Chen, Y.; Khan, S.; Jamal, A.; Ijaz, M.; Ahmed, T. Predicting Risky and Aggressive Driving Behavior among Taxi Drivers: Do Spatio-Temporal Attributes Matter? Int. J. Environ. Res. Public Health 2020, 17, 3937. [Google Scholar] [CrossRef]
- Alogaili, A.; Mannering, F. Unobserved heterogeneity and the effects of driver nationality on crash injury severities in Saudi Arabia. Accid. Anal. Prev. 2020, 144, 105618. [Google Scholar] [CrossRef] [PubMed]
- Seelex, S.F. Special communication. Toxicon 1963, 1, 81–87. [Google Scholar] [CrossRef]
- Tang, C.K. Do Speed Cameras Save Lives? Spatial Economics Research Center (SERC) Discussion Paper 221; London School of Economics: London, UK, 2017. [Google Scholar]
- Pérez-Acebo, H.; Otxoa-Muñoz, X.; Marquina-Llaguno, M.; Gonzalo-Orden, H. Analysis of the efficiency of traffic lights turning red in case of exceeding speed limit. Ingeniería e Investigación 2021, 41, e86047. [Google Scholar] [CrossRef]
- Souani, C.; Faiedh, H.; Besbes, K. Efficient algorithm for automatic road sign recognition and its hardware implementation. J. Real-Time Image Process. 2014, 9, 79–93. [Google Scholar] [CrossRef]
- Federal Highway Administration (FHA), Traffic Calming ePrimer—Module 1. Available online: https://safety.fhwa.dot.gov/speedmgt/ePrimer_modules/module1.cfm (accessed on 9 July 2021).
- Jamal, A.; Umer, W. Exploring the Injury Severity Risk Factors in Fatal Crashes with Neural Network. Int. J. Environ. Res. Public Health 2020, 17, 7466. [Google Scholar] [CrossRef] [PubMed]
- Jamal, A.; Zahid, M.; Rahman, M.T.; Al-Ahmadi, H.M.; Almoshaogeh, M.; Farooq, D.; Ahmad, M. Injury severity prediction of traffic crashes with ensemble machine learning techniques: A comparative study. Int. J. Injury Control Saf. Promot. 2021, 1–20. [Google Scholar]
- Rahman, M.T.; Jamal, A.; Al-Ahmadi, H.M. Examining hotspots of traffic collisions and their spatial relationships with land use: A GIS-based geographically weighted regression approach for Dammam, Saudi Arabia. ISPRS Int. J. Geo-Inf. 2020, 9, 540. [Google Scholar] [CrossRef]
- Hussien, H.H.; Eissa, F.H. Identifying Hazardous Road Locations in Saudi Arabia. Glob. Adv. Res. J. Eng. Technol. Innov. 2016, 5, 45–56. [Google Scholar]
- Barrimah, I.; Midhet, F.; Sharaf, F. Epidemiology of Road Traffic Injuries in Qassim Region, Saudi Arabia: Consistency of Police and Health Data. Int. J. Health Sci. 2012, 6, 31–42. [Google Scholar] [CrossRef]
- Satria, R.; Castro, M. GIS Tools for Analyzing Accidents and Road Design: A Review. Transp. Res. Procedia 2016, 18, 242–247. [Google Scholar] [CrossRef]
- Deme, D.; Bari, M. Full length research paper Traffic accident causes and its countermeasures on Addis Ababa-Adama expressway. J. Sci. Sustain. Dev. 2018, 2, 13–23. [Google Scholar]
- El-Dairi, M.; House, R.J. Optic Nerve Hypoplasia. In Handbook of Pediatric Retinal OCT and the Eye-Brain Connection; Elsevier BV: Amsterdam, The Netherlands, 2020; pp. 285–287. [Google Scholar]
- Bíl, M.; Andrášik, R.; Janoška, Z. Identification of hazardous road locations of traffic accidents by means of kernel density estimation and cluster significance evaluation. Accid. Anal. Prev. 2013, 55, 265–273. [Google Scholar] [CrossRef]
- Kim, D.-G.; Lee, Y.; Washington, S.; Choi, K. Modeling crash outcome probabilities at rural intersections: Application of hierarchical binomial logistic models. Accid. Anal. Prev. 2007, 39, 125–134. [Google Scholar] [CrossRef] [PubMed]
- Huang, H.; Chin, H.C.; Haque, M.M. Empirical evaluation of alternative approaches in identifying crash hot spots: Naive Ranking, Empirical Bayes, Full Bayes Methods. Transp. Res. Rec. 2009, 2103, 32–41. [Google Scholar] [CrossRef]
- Montella, A. A comparative analysis of hotspot identification methods. Accid. Anal. Prev. 2010, 42, 571–581. [Google Scholar] [CrossRef]
- Qu, X.; Meng, Q. A note on hotspot identification for urban expressways. Saf. Sci. 2014, 66, 87–91. [Google Scholar] [CrossRef] [Green Version]
- Tanprasert, T.; Siripanpornchana, C.; Surasvadi, N.; Thajchayapong, S. Recognizing Traffic Black Spots from Street View Images Using Environment-Aware Image Processing and Neural Network. IEEE Access 2020, 8, 121469–121478. [Google Scholar] [CrossRef]
- Mandloi, D.; Gupta, R. Evaluation of Accident Black Spots on Roads Using Geographical Information Systems (GIS); Map India, No. October; Birla Institute of Technology and Science: Pilani, India, 2003. [Google Scholar]
- Steenberghen, T.; Dufays, T.; Thomas, I.; Flahaut, B. Intra-urban location and clustering of road accidents using gis: A belgian example. Int. J. Geogr. Inf. Sci. 2004, 18, 169–181. [Google Scholar] [CrossRef]
- Jiang, H.; Zhong, L.; Li, C.; Feng, H. Research on identification method for road accident black spots with ordinal clustering method. In Proceedings of the 2011 International Conference on Remote Sensing, Environment and Transportation Engineering, Nanjing, China, 24–26 June 2011; pp. 2401–2404. [Google Scholar]
- Murat, Y. Fuzzy Clustering Approach for Accident Black Spot Centers Determination; INTECH Open Access Publisher: London, UK, 2012. [Google Scholar]
- Chen, H. Black Spot Determination of Traffic Accident Locations and Its Spatial Association Characteristic Analysis Based on GIS. J. Geogr. Inf. Syst. 2012, 4, 608–617. [Google Scholar] [CrossRef] [Green Version]
- Szénási, S.; Csiba, P. Clustering algorithm in order to find accident black spots identified by GPS coordinates. In Proceedings of the 14th SGEM GeoConference on Informatics, Geoinformatics and Remote Sensing, Sofia, Bulgaria, 17–26 June 2014; pp. 497–504. [Google Scholar]
- Hegyi, P.; Borsos, A.; Koren, C. Searching possible accident black spot locations with accident analysis and gis software based on GPS coordinates. Pollack Period. 2017, 12, 129–140. [Google Scholar] [CrossRef]
- Dereli, M.A.; Erdogan, S. A new model for determining the traffic accident black spots using GIS-aided spatial statistical methods. Transp. Res. Part A Policy Pract. 2017, 103, 106–117. [Google Scholar] [CrossRef]
- Shen, L.; Lu, J.; Long, M.; Chen, T. Identification of accident blackspots on rural roads using grid clustering and principal component clustering. Math. Probl. Eng. 2019, 2151284. [Google Scholar] [CrossRef]
- Yuan, T.; Zeng, X.; Shi, T. Identifying Urban road black spots with a novel method based on the firefly clustering algorithm and a geographic information system. Sustainability 2020, 12, 2091. [Google Scholar] [CrossRef] [Green Version]
- Bisht, L.S.; Tiwari, G. Assessing the Black Spots Focused Policies for Indian National Highways. Transp. Res. Procedia 2019, 48, 2537–2549. [Google Scholar] [CrossRef]
- Vindhya Shree, M.P.; Shashikiran, C.R.; Nandish Shanabog, C.S. Prioritization of Accident Black Spots using GIS. Int. J. Eng. Res. 2020, 9, 653–666. [Google Scholar] [CrossRef]
- Chen, Y.; Wang, K.; Zhang, Y.; Shi, Q. Identification of black spots on highways using fault tree analysis and vehicle safety boundaries. J. Transp. Saf. Secur. 2021, 13, 46–68. [Google Scholar] [CrossRef]
- Al-Jameel, H.A.; AbdAbas, A.Y. Identifying black spot locations at karbala city by using GIS system. Int. J. Civ. Eng. Technol. 2018, 9, 933–938. [Google Scholar]
- Elyasi, M.R.; Saffarzade, M.; Boroujerdian, A.M. A novel dynamic segmentation model for identification and prioritization of black spots based on the pattern of potential for safety improvement. Transp. Res. Part A Policy Pract. 2016, 91, 346–357. [Google Scholar] [CrossRef]
- UN HABITAT. State of Urban Development in Al-Qassim, Key Statistics in 13 Urban Areas. 2020. Available online: http://marsad-buridah.com/Uploads/2020/9/21/637362807026788801.pdf (accessed on 15 April 2021).
- Al-tit, A.A.; Dhaou, I.B.; Albejaidi, F.M.; Alshitawi, M.S. Traffic Safety Factors in the Qassim Region of Saudi Arabia. Sage Open 2020, 10, 2158244020919500. [Google Scholar] [CrossRef]
Publisher’s Note: MDPI stays neutral with regard to jurisdictional claims in published maps and institutional affiliations. |
© 2021 by the authors. Licensee MDPI, Basel, Switzerland. This article is an open access article distributed under the terms and conditions of the Creative Commons Attribution (CC BY) license (https://creativecommons.org/licenses/by/4.0/).