Abstract
The paper proposes a real-time model for electric vehicles (EVs) controlled load charging. The proposed demand-side management (DSM) of EVs is implemented based on queuing analysis with a nonhomogeneous arrival rate and charging service periods dataset. An electric vehicle model is used which is based on a statistical survey to represent the uncontrolled demand of the EVs. A probability distribution for the time at which EVs are plugged and the corresponding value of the state of charges (SOCs) are considered. The preferences of individual EVs have been fully exploited through a set of instructions to fulfill the needs of the vehicles’ owners. The designated preferences include the owner setting for both, charging price preferences (OPR), and the maximum estimated parking time duration (EPTD). The quasi-static time-series (QSTS) simulation is used to simulate real-time scenarios of the 24-h simulation period. The IEEE 123 nodes radial test feeder is analyzed with different daily load curves, EV charging scenarios, and wind power penetrations. The results show the effectiveness of the proposed DSM in avoiding excessive levels of charging with/without penetration of non-dispatchable wind power generation. The proposed DSM enables the EVs to charge with low tariff rates either at excessive renewable power generation or late evening hours with available committed bulk power plants and light loading conditions.
1. Introduction
Electric vehicles are the result of recent developments in modern transportation due to the growing concerns over carbon and greenhouse effects and reduce carbon emissions [1,2]. EVs became an essential approach to solve environmental problems because they have zero emissions and low noise [3]. The increase in the number of EVs is welcomed by green energy supporters [4]. However, uncoordinated EV charging results in undesirable impacts on the operation and performance of electrical systems [5,6,7]. In consequence, the EVs charging process is managed to reduce congestion or to balance the load and achieve peak load shaving [8]. Various studies have been reported to explore the effects of EVs charging on electrical power systems [9,10,11,12,13,14,15,16,17]. As an example, EV charging could lead to voltage variation, increase the load, and increase power losses of electrical grids [18]. Moreover, EV charging could affect the generation scheduling of the thermal generation units as well as the wind power plants [19].
The random nature of the EV state plays the main role in developing the EV model. The EV charging profile is determined in terms of several factors [11]: (1) the number of EVs, (2) the battery type, (3) the initial state of charge (SOC) at the beginning of the charging process, (3) the start time of EV charging process, and (4) type and location of chargers [20]. The initial SOC of EVs’ batteries always subject to an element of randomness, but the general pattern is influenced by the battery usage. The charge rate of EV batteries during the charging process should also follow the general charging characteristics determined by the battery type and the charging mode [21]. The normal and quick EV charging on regular weekdays and off-peak days in both summer and winter have been studied in [22].
Several statistical models have been proposed based on the random SOC that depended on the vehicle traveled distance. A statistical model was presented based on the National Travel Survey data [23]. The EV’s battery capacity, SOC, and energy consumption are used to model the EVs charging to assess their impact on the residential loads [24]. The probabilistic using Monte Carlo simulation of EVs has been developed with considering two EVs random variables: the time for vehicle arrival and energy demand [25]. The uncertainties characteristic of the EV is fully exploited whereas the transportation data have been used to extract the probability density function (pdf) [26].
The coordination of EV charging is very important to avoid many severe effects on power grids. Many control schemes have been proposed to overcome the negative impacts of EV charging. A control strategy using data-driven models has been implemented to relax power system components and prevent excessive loading due to EV charging demand [27,28,29]. Demand side management (DSM) works to guarantee EVs’ demand satisfaction in all grid situations and certifies grid stability [30,31,32,33,34]. At a low voltage transformer, DSM is used to shave the daily load while satisfying the EV charging process [35]. Real-time energy management is developed to reduce the EVs charging cost, and eliminate the charging impact with the existence of a photovoltaic (PV) system [36]. A control strategy is also developed for dynamic peak shaving at various scenarios considering the EV owner preferences [17]. A smart charging strategy with a two-stage optimization technique is applied to minimize the total energy loss at different penetration levels of EVs whereas the reactive power compensation from vehicle to grid (V2G) mode is utilized to reduce the energy losses [37]. A bi-directional charging power control of aggregated EV is analyzed in time series to assess generation modes [38].
A mathematical model-based M/M/s queue is presented using the fluid dynamic model to forecast the charging demand [39]. The model of EVs is used in the probabilistic load flow and the queueing theory to obtain the charging load of multiple EVs [40]. A nonhomogeneous Poisson process for the arrival rate of the EV during 24 h is used to create a suitable load profile [7]. The arrival rate is modeled based on the vehicle owner’s price preference whereas the probability of arriving vehicle in charging station is increased at lower prices and vice versa [7]. The electricity price is going to be affected by the integration of non-dispatchable renewable energy resources resulting in a dynamic electricity tariff [41]. The impacts of wind power generation on the electricity price in Germany is reported in a comprehensive study showing that wind power generation reduces the wholesale electricity price [42]. Recent research implementation using the queue model emphasizes the EV satisfaction level and preserves power networks [13]. In addition, incentive prices not only achieve reduced cost but improve the utilization of charging infrastructure [43]. In Ref. [44], the controlled charging demand is calculated by using a queuing model and integrated into the economic dispatch algorithm to find the optimal charging plan of each EV.
In this paper, a virtual queue is continuously developed to account for EVs owner satisfaction and to avoid excessive EVs charging load. The developed model is quite simple and any EVs plugged into the system can participate in the queue. The owner satisfaction is based on saving both the time and cost of the charging process during two scenarios for wind power generation. The main contributions of this work could be summarized as follows:
- Developing queue model to account for owner preferences such as electricity tariff rate (ETR) and estimated parking time duration (EPTD) (the time that the owner could keep his vehicle plugged in the grid).
- Using incentive electricity tariffs with wind power generation and investigating their impact on both owner and the grid in terms of charging cost and peak load shifting respectively.
- Simulation of 24-h scenarios using accelerated quasi-static time series (QSTS) engine [45,46].
2. Queue Model
2.1. Mathematical Formulation of Queue
This section presents the queuing analysis used to control EV’s charging load. Figure 1 shows the schematic diagram for a population of EVs connected to the network to start the charging process. From the network point of view, the process is a queueing system consisting of three main parts:
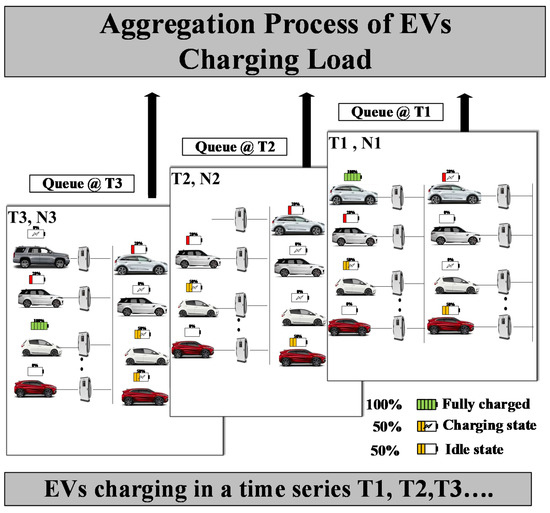
Figure 1.
The schematic diagram for EVs charging process with a dynamic queue model.
- Arrivals of EVs characterized by a statistical distribution with an arrival rate which is represented by a number NEV of the EV connected to the grid at a specific time T (see Figure 1)
- EVs queue includes several EVs waiting in a line to charge. It should be mentioned here that the line represents EVs connected to the network and all vehicles are connected to the network and are either charging or not.
- The charging service includes several servers (charging points NCP) subject to a statistical distribution of service times (charging time).
Hence, the DSM for EVs charging can be defined as a multi-servers (M/M/s) queue with identical server number (charging points) NCP. Each charging point has an operating process with an exponential Poisson service rate .
The most important parameters for any queue are: the average time spent in the queue, average queue length, and the overall average time spent in the system [47]. To obtain these parameters, a Markov chain is used in the queueing analysis [48].
A sequence of random variables is defined as a Markov chain for n steps, where the transition probability to the following state only depends on the current state.
where is the probability.
The transition probability between two state i and j in n steps can be expressed as:
where the transition matrix can be expressed as:
In this work, the arranged EVs in the queue is considered the state of the chain, where the state transition occurs when an EV arrived, or a connected EV reached its full charge state , hence it is virtually unplugged viz., idle state, or to depart physically. A birth-death is applied as a stochastic model to represent the evolving process of the system, wherein the queuing model “birth” denotes the customer arrival while “death” denotes the customer departure. The transition rate diagram is exhibited in Figure 2. The figure shows the transition for NEV states when all states have an arrival rate λ but there are two different service rates. In case of the number of EV less than the charging point NCP number (NEV < NCP) the service rate is otherwise, in case of the number of EV greater than the charging point number (NEV > NCP) in which all charging points have occupied, the rate is .
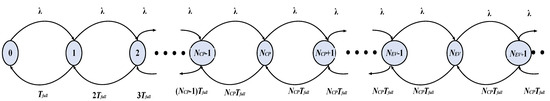
Figure 2.
Transition rate diagram.
By applying the Markov chain using the transition rate diagram shown in Figure 2 the transition probability matrix can be written as in (4).
The stationary condition which describes the steady-state condition is expressed by the following equation:
where is the stationary vector .
The general formula for the stationary distribution at any state n can be written as:
The value of can be calculated using the total probability condition as follows:
Consequently, the value of can be calculated using the following equation.
Thus, the performance of the queuing model can be determined once the initial condition is given. The average number of EVs available in the system is computed as follows:
The number of EVs waiting in the queue can be expressed [49]:
The overall time spent in the system can be calculated using:
However, the average waiting time in the queue can be given by [49]:
2.2. Numeric Example for the Queuing Model
This section gives a simple example of the queuing model that is used for EV arriving in the charging station.
Figure 3 presents the main inputs and outputs of the queuing model. Hence, the following numeric example demonstrates the application of this model in the EV-arriving process.
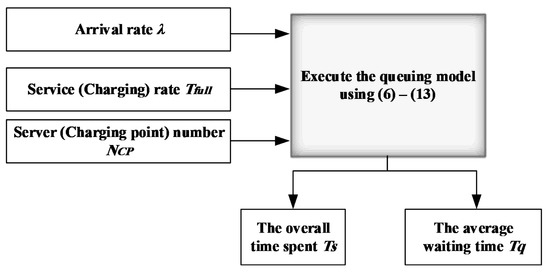
Figure 3.
Representation of the queuing model for EV.
Assume that a charging station has charging points = 3 and the arrival rate of the EV at this station . The charging point can charge the EV to be fully charged in hence, the service rate is 2 EV/h. Arriving EV balks when 6 EVs are in the system. Hence, to calculate the average waiting time and the overall time that the EV number 6 takes in the queue, the queue model is applied as follows:
To calculate the stationary vector for all state (EV = 6), should be evaluated first by applying (9), hence . Then the from can be calculated using (6). The first part of the Equation (6) will be applied as , which is and the values will be as follows:
However, when which is
The overall values of the stationary vector are calculated and arranged in Table 1.

Table 1.
Stationary vector.
From Table 1 it can be observed that:
The probability that all charging points are idle is:
The probability that an EV will not have to wait is:
The probability that an EV will have to wait is:
The probability that an EV balk is:
The average number of EVs available in the system is computed using (10) is:
The number of EVs waiting in the queue based on (11) is
The overall time spent in the system can be calculated using (12) is:
The average waiting time in the queue can be given by (13) is:
3. EVs Charging Based on Owner’s Preferences Queue
3.1. Owner Preferences
The developed queue charging model uses the owner’s preferences to manage demand and guarantee user satisfaction. Two factors are required from the owner: the owner preferred price-setting OPR and the EPTD. A real-time electricity tariff rate (ETR) variation is illustrated in Figure 4 hence, each owner can adopt his OPR, at which the battery starts charging. Related to the preferred price (see Figure 2) the marked portions represent cheap electricity prices to decrease the total cost of the charging where the cost can be calculated as
where, is the total charging cost, is the electricity tariff rate at time T, is the charging power, and are the starting and ending times of charging.
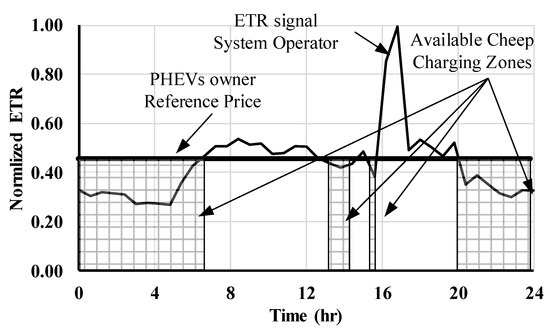
Figure 4.
Real-time ETR with the owner reference price.
In consequence, the EV charging process will respond with the changing of the real-time price, in addition, the owner can determine EPTD.
3.2. EVs Charging Queue
The charging strategy of the EV can be implemented using the queue model based on the owner’s preferences. As presented in the previous subsection, the owner feeds the control system with the EPTD and OPR when its EV is plugged in, then based on the owner’s OPR and the ETR, the queue model arranges the EV as presented in Algorithm 1 and shown in Figure 5.
| Algorithm1: EV queue charging formulation |
| 1: Initialize time step T, number of EVs , number of charging point 2: while (T < ) 3: for each plugged-in EV 6: Update EPTD and OPR 10: if1 11: State the EV to charging mode 12: else if1 13: Increment 14: Apply the queue model (6) to (13) to determine the Ts 15: if 2 16: State the EV to charging mode 17: else 18: State the EV to idle mode 19: end if2 20: end if1 21: 22: end while 23: return the final EV charging load |
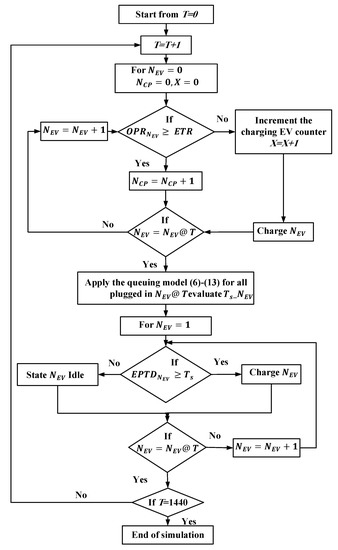
Figure 5.
Flowchart of real-time EV queue charging based on owner’s preferences.
3.3. Implementation of Real-Time Simulation with EV Charging
To study the impact of EV charging on the grid load demand, a real-time simulation is essentially required. Hence, in this work, QSTS simulation is used to compute a 24-h simulation period. In contrary to classical snapshot power flow simulation, QSTS is a sequential time series power flow and can be performed based on a varying load demand during a period. The classical loads such as commercial, industrial, residential are varying based on the daily load curves. However, to simulate the random behavior of EV load demand during 24 h without control, a statistical model can be used based on the lognormal distribution of the traveling millage to calculate the and normal distribution of the plugin time . Then, at each instant time T, the load of the EV can be estimated based on the number of the plug-in EVs and their SOC at this instant plus the classical load.
To manage and control the EVs load demand, a DSM is proposed in this work based on the queue as presented in Figure 6.
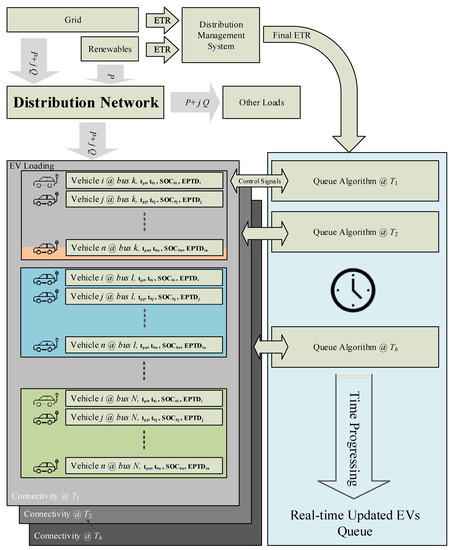
Figure 6.
Queuing management strategy for demand response at instant T for EVs aggregation N, at bus k.
Figure 6 shows the implementation of the proposed DSM for a set of EVs connected to bus k at instant time T. The figure demonstrates the interface of a single EV with the grid. The EVs status is updated at the instant time with four control variables , , , and . When the is greater than the ETR, the queuing algorithm generates the waiting time Tq, and the time spent in the system Ts for each EV. The controller then decides when the battery should charge or be idle. After the demand is determined, the total EV load is added to the classical demand, then the QSTS simulation is applied to compute a 24-h simulation period.
4. Result and Discussion
4.1. Test System Description
The IEEE 123 nodes test feeder is used to studying the feasibility of the proposed DSM for EVs charging load. The data of the feeder are extracted from [50]. Three different classical load profiles (residential, commercial, and industrial) are used as shown in Figure 7. Sample time of 1 min is chosen to run the QSTS. The QSTS is implemented using a sequential power-flow solver that is based on forward/backward sweep and programmed in C++ with a personal computer (Core I7, 2.66 GHz processor with 8 GB RAM). The nodes of the IEEE 123 test feeder are categorized into three types: residential, commercial, and industrial [46]. The residential demand is assumed to involve 40% of EV’s power penetration level with respect to the total demand of IEEE 123 nodes test feeder, hence, 400 EVs are used. It is assumed that all EVs use GMEV1 battery type, and it is satisfactory for the battery to reach 90% SOC.
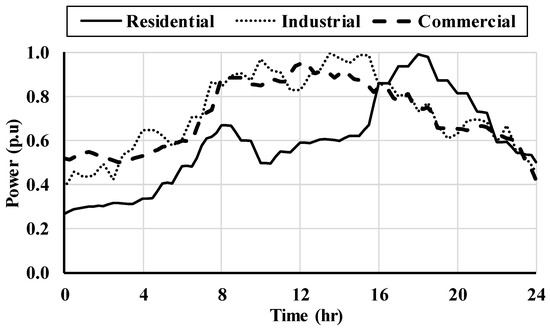
Figure 7.
Classical loading profiles.
The following different case studies are examined:
- Base case (without EV): this case represents the IEEE 123 with considering classical loads profile only.
- Case 1: (Uncontrolled EVs Charging) in this case, a statistical model [11] is used to present the impact of EV charging with the classical loads of the distribution system.
- Case 2: (Controlled EVs Charging) DSM based on queueing theory is used to manage the EVs charging demand with consideration of owner preferences.
- Case 3: Wind power generation is integrated to show its influence on the ETR and the total demand.
4.2. Generation of Case Datasets
In this work, for real-time management of the EVs charging based on the queue model, a set of data is generated to represent the arrival of electric vehicles into the grid. a non-homogeneous Poisson process is used to represent the arrival rate which is dependent on the statistical model of EV as shown in Figure 8. Furthermore, the battery’s characteristic is considered in the charging service rate and the number of servers’ changes based on the ETR. The pdf for the traveled miles and plugged-in time is used to distribute the 400 EVs randomly. The generated EVs distribution is used as input data to test out the proposed method. The lognormal distribution for the traveled distance is carried out using the mean value of 22.3 miles and the standard deviation of 12.4 miles. The plugged-in time is distributed normally with a mean of 1:00 AM and a standard deviation of 5 h [51]. The results of this algorithm are shown in the 3-D plot in Figure 9.
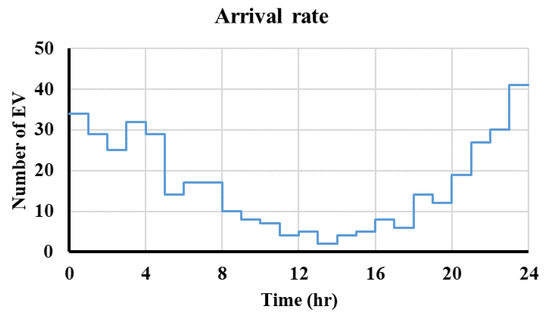
Figure 8.
The arrival rate of the EV.
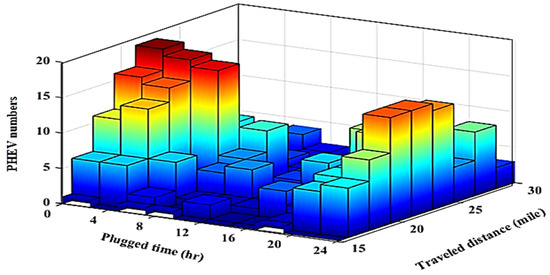
Figure 9.
Distribution of plugged time and traveled distance for 400 EVs.
4.3. Case 1 Results (Uncontrolled EVs Charging)
The uncontrolled EV charging impact is depicted in Figure 10, based on the statistical distribution [11] for the plugged time introduced in Figure 9, the majority of EVs connected to the grid in the time between 0:00 and 04:00, and their charging process increases the total demand from 1.5 p.u to 2.0 p.u as shown in Figure 8. With the number of connected EVs decreasing, and the charged EVs disconnecting, the total demand is reduced between 09:00 to 16:00. The load starts to increase again in the remaining time of the day.
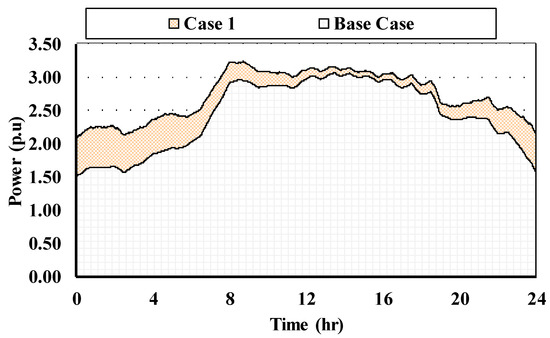
Figure 10.
Total demand with uncontrolled EVs charging Case1.
4.4. Case 2 Results (Owner Preferences)
In the developed DSM, each EV owner feeds the system with two control signals, the , and the price reference . To model the owner preferences in this work, a normal distribution for both signals is generated. It is assumed that the mean EPDT is 6.00 h with 1.00 h stander deviation, on the other hand, the OPR has a mean equal to 0.45 per unit price and 0.05 stander devotion. The obtained distribution results for both signals are exhibited in Figure 11. Based on the owner signals and the real-time ETR (see Figure 4) [16] which is provided by the DSM, the developed DSM based on the queuing theory gives the priority for the EV to charge or to be in the idle state. Figure 12 shows the demand for this case and it can be noted that an amount of demand has been shifted to the time where the ETR is low to avoid the high charging cost.

Figure 11.
Normal distribution for owner’s preferences 400 EVs.
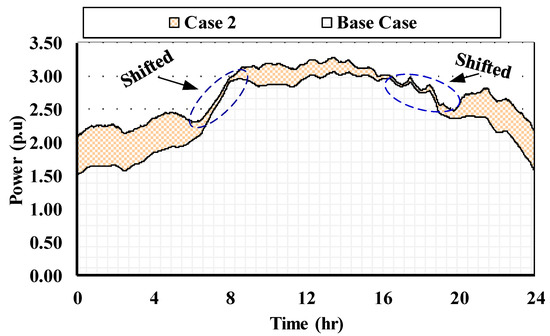
Figure 12.
Total demand with controllable EVs charging (Case 2).
4.5. Case 3 (Wind Power Impact)
4.5.1. Impact of Wind Power on ETR
Electrical systems use economic dispatch and unit commitment to ensure that power delivery to the load remains within the power system transmission and generation constraints, however, with the integration of renewable energy resources which have an intermittent nature as shown in Figure 13. Hence, wind power is non-dispatchable over time. Consequently, the best solution is to reduce the electricity price, which, gives controllable loads (COLs) such as EVs the availability to consume the extra generated power.
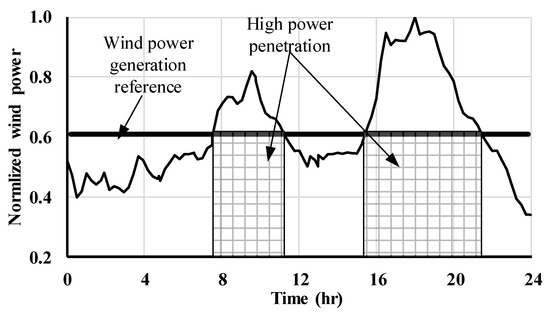
Figure 13.
Wind power generation.
This case study gives a new vision of how the integration of renewable energy resources can be more useful for both generations and the load side. The wind power generation is integrated with the IEEE-123 node system, with the maximum penetration of the wind power chosen to be 20% of the total demand of the IEEE-123 node. It is assumed that when the wind power generation is more than 60% of the total penetration the DSM should reduce the ETR to the minimum value. As such, the connected idle EVs can charge the excess generation power instead of shutting down generation units or using wind power curtailment. Hence, the change in ETR in the existence of wind power is exhibited in Figure 14.
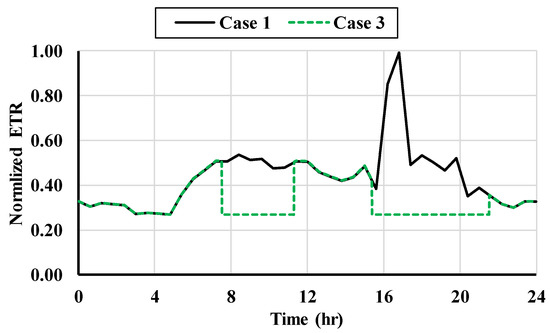
Figure 14.
Impact of the wind integration on ETR.
4.5.2. Case 3 Results
In this case, wind power generation (see Figure 13) is used with the EV’s DSM. The impact of wind energy intermittency on the total demand is illustrated in Figure 15 and it can note that the wind power generation shaves the peak demand caused by the EVs charging and the impact of the wind power in the EVs charging behavior is described in the next subsection.
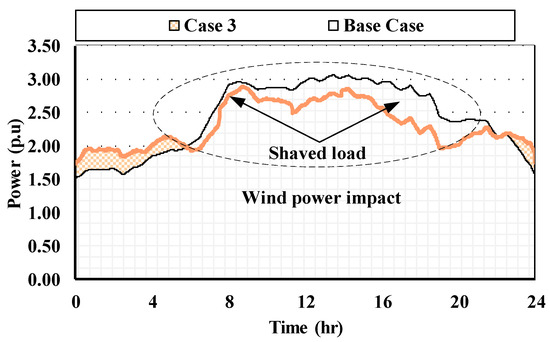
Figure 15.
Total load with wind and controlled EVs charging (Case 3).
4.6. Voltage Profile Results
To present the impact of the EV charging on the power system voltage profile, the QSTS is carried out and the voltage of all phases at each bus is calculated for 24 h. Figure 16 shows the impact of the EV charging on phase # a at the worst-case bus 114. The voltage profile in case1 and case 2 is lower than the limits of 0.95 p.u due to the EV charging. However, using the DSM with wind power generation increases the voltage to be within the limits as presented in case 3.
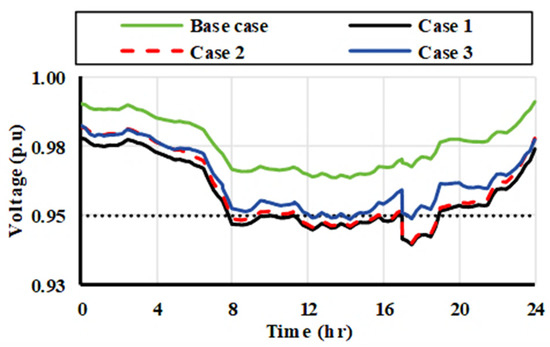
Figure 16.
Voltage profile at bus 114.
4.7. EVS Charging Behavior
The effect of the owner preferences based on EPTD and OPR as well as the wind power generation on arbitrary EVs charging process is presented in this section. Three EVs are chosen at different plugged-in times, the EVs numbered as EV#i, EV#j, and EV#k. Moreover, the SOC and operating charging power are presented for each EV.
Table 2 gives the initial parameter for the three arbitrary EVs, SOC is 40% for all selected EVs however, they have different plugged-in times. Each EV has a different owner preference variable. Figure 17a,b displays the operating power and SOC of EV#i respectively. In the case of no control (Case 1), the battery starts charging at the plugged-in time 09:23 whereas the battery stops charging and gets disconnected from the grid when the SOC reaches 90%.
Table 2.
Initial parameter and owner preferences for arbitrary EVS.

Figure 17.
EV#i charging behavior at different case studies.
However, in Case 2, with the owner preferences considered, the proposed DSM shows a flexible charging process and capable to perform discrete charging. EV#i is delayed and set at an Idle state as shown in Figure 17a,b due to the real-time ETR not meeting the OPR in this duration of time considering the EPTD limit.
In Case 3, with the integration of wind power generation, the battery is charged in two sessions. The first session starts at the plugged-in time of 09:23 and stops at 11:17 whereas the second session starts at 13:53 and reaches the required SOC at 16:00.
Similarly, for EV#j and #k, the charging behavior is affected by the DSM as depicted in Figure 18 and Figure 19 respectively. EV#j is in Idle state two times in case 2 and one time in case 3 when wind power has been integrated. Furthermore, EV#j is connected to the grid in case 3 after it has been sent to the waiting list two times in case 2.
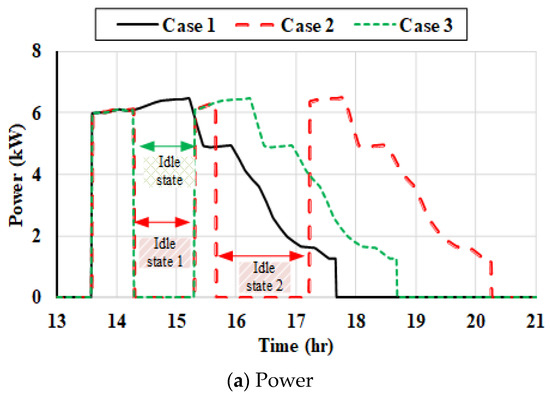

Figure 18.
EV#j charging behavior at different case studies.
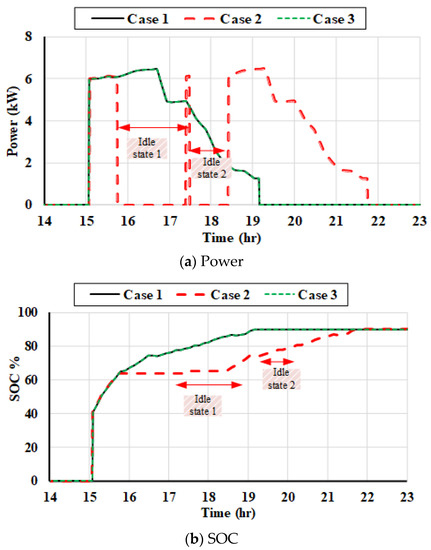
Figure 19.
EV#k charging behavior at different case studies.
4.8. Impact of DSM on Owner Satisfaction
Finally, it is important to study EV’s owner satisfaction with the proposed DSM. Owner satisfaction can be measured using the savings in charging costs and the overall time that the owner spends in the charging process compared to his EPTD. The saving in charging cost can be calculated using the following equation:
Table 3 summarizes the saving in the cost per unit price for the different case studies for the three arbitrary EVs. Significant savings in the cost occurred by using the proposed DSM to those EVs that start charging after 12:00 PM; the saving reached 42.1% and 55.4% for EV#j and #k respectively.
Table 3.
Obtained results for the arbitrary EVs.
However, EV#i starts charging in the morning, and the ETR is not high as in the evening, the saving is 7.6% and 34.2% in case 2 and case 3 respectively. Finally, all the EVs reach the specified SOC while the overall connected time is less than each owner’s EPTD.
5. Conclusions
This paper has presented a proposed DSM based on queuing theory for controlling the EVs charging load in the existence of wind power generation in power distribution networks. To represent the uncontrolled demand of the EV, a statistical model was used based on a statistical survey. QSTS was used to solve the 24 h power flow and study the impact of the external load presented by the EV charging process. The proposed DSM-based queueing model uses the owner preferences signal which includes the EPTD and OPR to manage the charging process by operating the EV in one of two states (charge or idle). The proposed DSM takes advantage of integrating wind power generation in the distribution system to help the DSM in case of more generation power available in the system. The IEEE 123 nodes radial test feeder was used to check the performance of the proposed DSM through the owner’s satisfaction based on the cost-saving and the overall time in the system. The results showed, using the proposed DSM, a significant cost saving was achieved for the EVs owner. In addition, shaving in the demand was obtained in the case of with and without wind power integration.
Author Contributions
Conceptualization, M.A.-A.; Data curation, S.K.; Formal analysis, S.A.A.; Funding acquisition, S.A.A.; Resources, F.J.; Software, A.S.; Writing—original draft, A.S.; Writing—review & editing, M.A.-A., S.K., F.J. and S.A.A. All authors have read and agreed to the published version of the manuscript.
Funding
This research received no external funding.
Institutional Review Board Statement
Not applicable.
Informed Consent Statement
Not applicable.
Data Availability Statement
Not applicable.
Acknowledgments
Researchers would like to thank the Deanship of Scientific Research, Qassim University for funding publication of this project.
Conflicts of Interest
The authors declare no conflict of interest.
References
- Sanguesa, J.A.; Torres-Sanz, V.; Garrido, P.; Martinez, F.J.; Marquez-Barja, J.M. A Review on Electric Vehicles: Technologies and Challenges. Smart Cities 2021, 4, 372–404. [Google Scholar] [CrossRef]
- Rietmann, N.; Hügler, B.; Lieven, T. Forecasting the trajectory of electric vehicle sales and the consequences for worldwide CO2 emissions. J. Clean. Prod. 2020, 261, 121038. [Google Scholar] [CrossRef]
- Saber, A.Y.; Venayagamoorthy, G.K. Plug-in vehicles and renewable energy sources for cost and emission reductions. IEEE Trans. Ind. Electron. 2011, 58, 1229–1238. [Google Scholar] [CrossRef]
- Alinejad, M.; Rezaei, O.; Kazemi, A.; Bagheri, S. An Optimal Management for Charging and Discharging of Electric Vehicles in an Intelligent Parking Lot Considering Vehicle Owner’s Random Behaviors. J. Energy Storage 2021, 35, 102245. [Google Scholar] [CrossRef]
- Darabi, Z.; Ferdowsi, M. Impact of Plug-In Hybrid Electric Vehicles on Electricity Demand Profile. In Smart Power Grids 2011; Springer: Berlin/Heidelberg, Germany, 2012; pp. 319–349. [Google Scholar]
- Das, H.; Rahman, M.; Li, S.; Tan, C. Electric vehicles standards, charging infrastructure, and impact on grid integration: A technological review. Renew. Sustain. Energy Rev. 2020, 120, 109618. [Google Scholar] [CrossRef]
- Hafez, O.; Bhattacharya, K. Queuing analysis based PEV load modeling considering battery charging behavior and their impact on distribution system operation. IEEE Trans. Smart Grid 2018, 9, 261–273. [Google Scholar] [CrossRef]
- Rigas, E.S.; Ramchurn, S.D.; Bassiliades, N. Managing electric vehicles in the smart grid using artificial intelligence: A survey. IEEE Trans. Intell. Transp. Syst. 2014, 16, 1619–1635. [Google Scholar] [CrossRef]
- Clement-Nyns, K.; Haesen, E.; Driesen, J. The impact of charging plug-in hybrid electric vehicles on a residential distribution grid. IEEE Trans. Power Syst. 2010, 25, 371–380. [Google Scholar] [CrossRef] [Green Version]
- Zhang, P.; Qian, K.; Zhou, C.; Stewart, B.G.; Hepburn, D.M. A methodology for optimization of power systems demand due to electric vehicle charging load. IEEE Trans. Power Syst. 2012, 27, 1628–1636. [Google Scholar] [CrossRef]
- Qian, K.; Zhou, C.; Allan, M.; Yuan, Y. Modeling of load demand due to EV battery charging in distribution systems. IEEE Trans. Power Syst. 2011, 26, 802–810. [Google Scholar] [CrossRef]
- Ayyadi, S.; Bilil, H.; Maaroufi, M. Optimal charging of Electric Vehicles in residential area. Sustain. Energy Grids Netw. 2019, 19, 100240. [Google Scholar] [CrossRef]
- Said, D.; Mouftah, H.T. A novel electric vehicles charging/discharging management protocol based on queuing model. IEEE Trans. Intell. Veh. 2019, 5, 100–111. [Google Scholar] [CrossRef]
- Wu, D.; Radhakrishnan, N.; Huang, S. A hierarchical charging control of plug-in electric vehicles with simple flexibility model. Appl. Energy 2019, 253, 113490. [Google Scholar] [CrossRef]
- Su, J.; Lie, T.; Zamora, R. Modelling of large-scale electric vehicles charging demand: A New Zealand case study. Electr. Power Syst. Res. 2019, 167, 171–182. [Google Scholar] [CrossRef]
- Razipour, R.; Moghaddas-Tafreshi, S.-M.; Farhadi, P. Optimal management of electric vehicles in an intelligent parking lot in the presence of hydrogen storage system. J. Energy Storage 2019, 22, 144–152. [Google Scholar] [CrossRef]
- Selim, A.; Abdel-Akher, M.; Aly, M.M. Plug-in hybrid electric vehicles aggregation and real-time active power control simulation analysis in distribution systems. In Proceedings of the 2016 18th International Middle East Power Systems Conference (MEPCON), Cairo, Egypt, 27–29 December 2016; IEEE: New York, NY, USA, 2016; pp. 723–728. [Google Scholar]
- Masoum, A.S.; Deilami, S.; Moses, P.S.; Masoum, M.A.; Abu-Siada, A. Smart load management of plug-in electric vehicles in distribution and residential networks with charging stations for peak shaving and loss minimisation considering voltage regulation. Gener. Transm. Distrib. IET 2011, 5, 877–888. [Google Scholar] [CrossRef]
- Liu, C.; Wang, J.; Botterud, A.; Zhou, Y.; Vyas, A. Assessment of impacts of PHEV charging patterns on wind-thermal scheduling by stochastic unit commitment. IEEE Trans. Smart Grid 2012, 3, 675–683. [Google Scholar] [CrossRef]
- Figenbaum, E. Battery Electric Vehicle Fast Charging—Evidence from the Norwegian Market. World Electr. Veh. J. 2020, 11, 38. [Google Scholar] [CrossRef]
- Taylor, J.; Maitra, A.; Alexander, M.; Brooks, D.; Duvall, M. Evaluations of plug-in electric vehicle distribution system impacts. In Proceedings of the 2010 IEEE Power and Energy Society General Meeting (PESGM 10), Minneapolis, MN, USA, 25–29 July 2010; IEEE: New York, NY, USA, 2010; pp. 1–6. [Google Scholar]
- Shao, S.; Pipattanasomporn, M.; Rahman, S. Challenges of PHEV Penetration to the Residential Distribution Network. In Proceedings of the 2009 IEEE Power & Energy Society General Meeting (PESGM 09), Cagary, AB, Canada, 26–29 July 2009; IEEE: New York, NY, USA, 2009; pp. 1–8. [Google Scholar]
- Rautiainen, A.; Repo, S.; Jarventausta, P.; Mutanen, A.; Vuorilehto, K.; Jalkanen, K. Statistical charging load modeling of PHEVs in electricity distribution networks using national travel survey data. IEEE Trans. Smart Grid 2012, 3, 1650–1659. [Google Scholar] [CrossRef]
- Shafiee, S.; Fotuhi-Firuzabad, M.; Rastegar, M. Investigating the impacts of plug-in hybrid electric vehicles on power distribution systems. IEEE Trans. Smart Grid 2013, 4, 1351–1360. [Google Scholar] [CrossRef]
- Green, R.C.; Wang, L.; Alam, M.; Depuru, S.S.S.R. Evaluating the Impact of Plug-In Hybrid Electric Vehicles on Composite Power System Reliability. In Proceedings of the North American Power Symposium (NAPS), Boston, MA, USA, 4–6 August 2011; IEEE: New York, NY, USA, 2011; pp. 1–7. [Google Scholar]
- El Nozahy, M.S.; Salama, M.M. A comprehensive study of the impacts of PHEVs on residential distribution networks. IEEE Trans. Sustain. Energy 2014, 5, 332–342. [Google Scholar] [CrossRef]
- Gong, Q.; Midlam-Mohler, S.; Serra, E.; Marano, V.; Rizzoni, G. PEV Charging Control Considering Transformer Life and Experimental Validation of a 25 kVA Distribution Transformer. IEEE Trans. Smart Grid 2015, 6, 648–656. [Google Scholar] [CrossRef]
- Jia, Q.-S.; Long, T. A review on charging behavior of electric vehicles: Data, model, and control. Control Theory Technol. 2020, 18, 217–230. [Google Scholar] [CrossRef]
- Abbasi, M.H.; Taki, M.; Rajabi, A.; Li, L.; Zhang, J. Coordinated operation of electric vehicle charging and wind power generation as a virtual power plant: A multi-stage risk constrained approach. Appl. Energy 2019, 239, 1294–1307. [Google Scholar] [CrossRef]
- Ireshika, M.A.S.T.; Preissinger, M.; Kepplinger, P. Autonomous Demand Side Management of Electric Vehicles in a Distribution Grid. In Proceedings of the 7th International Youth Conference on Energy (IYCE), Bled, Slovenia, 3–6 July 2019; IEEE: New York, NY, USA, 2019; pp. 1–6. [Google Scholar]
- Wang, Y.; Yang, Z.; Mourshed, M.; Guo, Y.; Niu, Q.; Zhu, X. Demand side management of plug-in electric vehicles and coordinated unit commitment: A novel parallel competitive swarm optimization method. Energy Convers. Manag. 2019, 196, 935–949. [Google Scholar] [CrossRef] [Green Version]
- Sarkis, G.; Georges, S.; Slaoui, F.H. A Novel Algorithm for Smart Grids-Optimal Load Scheduling. Int. Rev. Model. Simul. 2018, 11, 67. [Google Scholar] [CrossRef]
- Chang, T.H.; Alizadeh, M.; Scaglione, A. Real-Time Power Balancing Via Decentralized Coordinated Home Energy Scheduling. IEEE Trans. Smart Grid 2013, 4, 1490–1504. [Google Scholar] [CrossRef] [Green Version]
- Strbac, G. Demand side management: Benefits and challenges. Energy Policy 2008, 36, 4419–4426. [Google Scholar] [CrossRef]
- Mou, Y.; Xing, H.; Lin, Z.; Fu, M. Decentralized optimal demand-side management for PHEV charging in a smart grid. IEEE Trans. Smart Grid 2015, 6, 726–736. [Google Scholar] [CrossRef]
- Mohamed, A.; Salehi, V.; Ma, T.; Mohammed, O. Real-time energy management algorithm for plug-in hybrid electric vehicle charging parks involving sustainable energy. IEEE Trans. Sustain. Energy 2014, 5, 577–586. [Google Scholar] [CrossRef]
- Nafisi, H.; Agah, S.M.M.; Abyaneh, H.A.; Abedi, M. Two-stage optimization method for energy loss minimization in microgrid based on smart power management scheme of PHEVs. IEEE Trans. Smart Grid 2016, 7, 1268–1276. [Google Scholar] [CrossRef]
- Liu, Z.; Wang, D.; Jia, H.; Djilali, N.; Zhang, W. Aggregation and bidirectional charging power control of plug-in hybrid electric vehicles: Generation system adequacy analysis. IEEE Trans. Sustain. Energy 2015, 6, 325–335. [Google Scholar] [CrossRef]
- Bae, S.; Kwasinski, A. Spatial and temporal model of electric vehicle charging demand. IEEE Trans. Smart Grid 2012, 3, 394–403. [Google Scholar] [CrossRef]
- Li, G.; Zhang, X.-P. Modeling of plug-in hybrid electric vehicle charging demand in probabilistic power flow calculations. IEEE Trans. Smart Grid 2012, 3, 492–499. [Google Scholar] [CrossRef]
- Hirth, L. The market value of variable renewables: The effect of solar wind power variability on their relative price. Energy Econ. 2013, 38, 218–236. [Google Scholar] [CrossRef] [Green Version]
- Ketterer, J.C. The impact of wind power generation on the electricity price in Germany. Energy Econ. 2014, 44, 270–280. [Google Scholar] [CrossRef] [Green Version]
- Li, X.; Xiang, Y.; Lyu, L.; Ji, C.; Zhang, Q.; Teng, F.; Liu, Y. Price Incentive based Charging Navigation Strategy for Electric Vehicles. IEEE Trans. Ind. Appl. 2020, 56, 5762–5774. [Google Scholar] [CrossRef]
- Gao, S.; Jia, H. Integrated Configuration and Optimization of Electric Vehicle Aggregators for Charging Facilities in Power Networks With Renewables. IEEE Access 2019, 7, 84690–84700. [Google Scholar] [CrossRef]
- Abdel-Akher, M.; Selim, A.; Aly, M.M. Initialised load-flow analysis based on Lagrange polynomial approximation for efficient quasi-static time-series simulation. IET Gener. Transm. Distrib. 2015, 9, 2768–2774. [Google Scholar] [CrossRef]
- Selim, A.; Abdel-Akher, M.; Aly, M.M.; Kamel, S.; Senjyu, T. Fast quasi-static time-series analysis and reactive power control of unbalanced distribution systems. Int. Trans. Electr. Energy Syst. 2019, 29, e2673. [Google Scholar] [CrossRef] [Green Version]
- Gnedenko, B.; Kovalenko, I. Introduction to Queuing Theory. Mathematical Modeling; Birkhaeuser: Boston, MA, USA, 1989. [Google Scholar]
- Nelson, R. Probability, Stochastic Processes, and Queueing Theory: The Mathematics of Computer Performance Modeling; Springer Science & Business Media: New York, NY, USA, 2013. [Google Scholar]
- Rozanov, Y.A. Markov random fields. In Markov Random Fields; Springer: New York, NY, USA, 1982; pp. 55–102. [Google Scholar]
- Kersting, W.H. Radial Distribution Test Feeders. In Proceedings of the Power Engineering Society Winter Meeting, Columbus, OH, USA, 28 January–1 February 2001; IEEE: New York, NY, USA, 2001; pp. 908–912. [Google Scholar]
- National Travel Survey. Available online: https://www.gov.uk/government/uploads/system/uploads/attachment_data/file/8932/nts2010-01.pdf (accessed on 1 June 2021).
Publisher’s Note: MDPI stays neutral with regard to jurisdictional claims in published maps and institutional affiliations. |
© 2021 by the authors. Licensee MDPI, Basel, Switzerland. This article is an open access article distributed under the terms and conditions of the Creative Commons Attribution (CC BY) license (https://creativecommons.org/licenses/by/4.0/).