Abstract
Glass fiber-reinforced polymer (GFRP) ship structures have hull plate thicknesses of 10 mm or more and are fabricated using a higher proportion of resin matrix systems than E-glass fiber reinforcements. Therefore, GFRP is classified as a highly attenuative material, and this characteristic is a major cause of large errors in ultrasonic nondestructive testing for quality inspections. In this study, considering the aforementioned design and fabrication characteristics of GFRP ship structures, hull plate prototypes with various glass fiber weight fractions, glass contents (Gc), and laminate thicknesses were fabricated. Then, a pulse-echo ultrasonic test was performed with the fabricated prototypes, and the attenuation characteristics of the GFRP hull plates were investigated by conducting statistical analyses. These results demonstrated that with a variation of 30–50% in the Gc used for GFRP structure design, the plate thickness variation had a greater impact than the Gc variation on the attenuation characteristics. The increase in Gc naturally increased the scattering of ultrasonic waves but did not significantly affect the attenuation coefficient. The effects of the inner voids on the ultrasonic waves were also investigated, and the results confirmed that the laminates in this Gc region did not significantly affect attenuation.
1. Introduction
Nondestructive techniques are widely used for material evaluation and defect detection. Although X-ray and thermography approaches are effective methods for nondestructive testing (NDT) offering super-high resolutions, ultrasonic testing is more convenient and useful than other NDT techniques in terms of safety, cost, and the availability of facilities. Ultrasonic testing is one of the most common NDT methods for various applications in metals, concrete, plastics, and composites [1,2,3].
In ultrasonic testing, ultrasonic waves of a specific frequency generated by probes are transmitted from the front surface of the inspected media. These waves reach the back surface or encounter inner defects and are reflected. In this process, the characteristics of the travel time and ultrasonic signals are analyzed for gauging the thickness or for inspecting inner defects. In general, when ultrasonic waves are propagated in homogeneous metal media such as steel and aluminum, the reflection, transmission, and scattering of the signals at boundaries such as inner defects and back surfaces are analyzed to determine the state of the inspected specimens or for defect detection. However, composite materials are composed of reinforcements and matrix systems and are essentially anisotropic materials. As the relative densities of the constituent materials are different, their acoustic impedances are also different, and interfaces are generated for each ply [4]. In addition, owing to the various types of reinforcements, matrices, and fabrics, and the irregularities in the composite material, ultrasonic wave propagation in composite materials is complex. Although the densities of composite structures are lower than that those of steel structures, the irregularity of the crystalline particles in the former is greater, resulting in greater scattering or absorption of ultrasonic waves [5]. Therefore, composite materials are considered highly attenuative materials [5,6].
Composite structures, such as the glass fiber-reinforced polymers (GFRPs) used in composite ships, have inner defects including voids, pores, foreign objects, and resin-rich regions, depending on environmental factors such as the temperature and humidity as well as the operator’s skill level and the techniques employed during fabrication. These inner defects can significantly reduce the flexural and tensile strength [7], compressive strength [8], interlaminar shear strength [9], and fatigue strength [10] of the laminate, thus hindering effective ultrasonic testing. This is because inner defects such as voids interfere with ultrasonic wave propagation and cause the further loss of ultrasonic waves, resulting in increased attenuation characteristics. Therefore, it is also critical to evaluate the relationships between the ultrasonic attenuation characteristics and the inner defect contents. Related research is actively being conducted in the aerospace industry. For instance, Ishii et al. [11] and Lin et al. [12] confirmed that voids can increase the attenuation characteristics of carbon fiber-reinforced polymer (CFRP) laminates. CFRP aircraft laminates are typically thin, and their void content is less than 1% when fabricated using the infusion and vacuum-assisted resin transfer molding (VARTM) methods [13]. By contrast, GFRP ship structures have large hull plate thicknesses and require hand lay-up for fabrication, resulting in a high ratio of inner defects such as voids [13,14]. Mouritz [13] investigated the effects of artificially increasing the void content by 30% for GFRP composite laminates with thicknesses of 20–150 mm on their void content and ultrasonic attenuation. For increasing the void content, the attenuation characteristics increased accordingly. Gholizadeh et al. [1], Abdelal et al. [10], and Stone and Clarke [15] also reported the effects of defects such as voids on the ultrasonics of FRP laminates.
However, for more accurate NDT of composite materials, such as GFRP ship structures, it is necessary to investigate the attenuation characteristics by considering the design and fabrication characteristics of the composite ship. For example, it is commonly observed that the weight content of glass fibers and the laminate thickness depend on the role of the structure, and these factors can significantly affect attenuation. In addition, in laminates composed of tens to dozens of plies, the interfaces should be considered according to the structural characteristics.
2. Background
The objective of this study was to determine the ultrasonic attenuation characteristics of GFRP laminates, which are used as materials in most small ships, while considering the effects of ship design and fabrication characteristics. To this end, it was necessary to analyze the design and fabrication characteristics of the GFRP hull structure.
Typical variables governing the composite hull plate thickness are design variables such as the displacement, speed, and design load, as well as variables related to the composite materials, such as the type of reinforcement material, fabric type, glass fiber weight fraction, and mechanical properties [16,17]. The glass fiber weight fraction, quantified as the glass fiber content (Gc), is a critical design element that significantly affects the mechanical properties of the laminate. In general, Gc must be at least 30% to form a hull structure [18], and it usually does not exceed 70% [19]. Assuming that the fabrication quality of the GFRP structures is guaranteed, the use of a high Gc value is advantageous in terms of structural safety, weight, and eco-friendliness [19,20]. However, in general cases where the hand lay-up method is utilized for GFRP ship fabrication [21], a Gc value of 30–50% is used [16,22].
Considering the above-mentioned thickness characteristics of GFRP ships, the typical laminate thickness in an aircraft is 2–3 mm, whereas GFRP ships generally have hull plate thicknesses of 10 mm or more. Expectedly, in special cases, such as naval ships and coast guard ships, the hull plate thickness may be in the order of tens of millimeters [23]. Figure 1a shows a common fishing boat with a hull plate thickness of ~10 mm [16,24]. In comparison, a yacht approximately 15 m long has a hull plate thickness of approximately 15 mm [17].
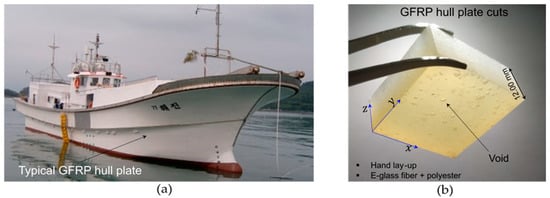
Figure 1.
(a) Typical 15 m long fishing boat with a hull plate thickness of 10 mm [25]. (b) GFRP hull plate cuts with inner defects.
In this study, the specimens were fabricated by considering the design and fabrication characteristics of the GFRP laminates utilized in the above-mentioned types of composite ships, and ultrasonic tests were performed. Specifically, the applied design characteristics of the GFRP vessel were Gc values of 30%, 40%, and 45% and laminate thicknesses from 8 mm to 20 mm. For the GFRP laminates, the types of fabric and resin commonly employed in the practice were used, and the specimens were fabricated by utilizing the hand lay-up method. The GFRP laminates fabricated as described above were subjected to pulse echo ultrasound A-scans, and the effects of Gc and thickness variations on the attenuation characteristics of the ultrasonic waves were statistically analyzed. In addition, by performing a burn-off test [17] to measure the exact void content of each GFRP laminate design case (Figure 1b), the effects of inner defects that may occur during the actual design and fabrication, such as voids, on the attenuation were analyzed.
3. GFRP Hull Plate Design and Fabrication
The hull plate of the composite ship was selected as the GFRP laminate design target for pulse echo ultrasonic testing. Hull plates are the largest components of composite ships and generally consist of a single-skin structure fabricated using molds; as described above, they are usually produced via the hand lay-up method.
In this study, the GFRP hull plates were divided into two groups. One group was designed with Gc values of 30%, 40%, and 45%, and the thickness was kept constant as much as possible, whereas the other group was designed with hull plate thicknesses of approximately 10 mm, 15 mm, and 20 mm with the Gc fixed at 40%. Thus, it was possible to examine the effects of the Gc and the thickness of the hull plate. For the hull plate design and fabrication, a 450 g/m2 E-glass fiber chopped strand mat (CSM) [26] was employed as the reinforcement, and polyester [27] was utilized as the resin matrix. The relative density of each material for the analysis of the experimental results was measured using a hydrometer [28]. The E-glass fiber and polyester resin were measured at 2.62 g/cm3 and 1.23 g/cm3, respectively. Table 1 and Table 2 provide the design information of each GFRP hull plate.

Table 1.
Design details of specimens in the Gc variation group.
Table 2.
Design details of the thickness variation group specimens.
All the hull plates were fabricated via the hand lay-up method. Figure 2 depicts the fabricated hull plates as well as the average thickness of each hull plate, measured using a Vernier caliper [29]. The thickness of each plate was measured at 50 different points, and the average thickness of each plate is shown in Figure 2. The thickness deviations of the plates were 0.29 mm, 0.41 mm, 0.42 mm, 0.80 mm, and 0.42 mm. The fabricated GFRP laminates could differ slightly from the design thickness owing to the fabrication characteristics. The laminates without significant differences from the design thickness were finally selected and utilized in the ultrasonic test.
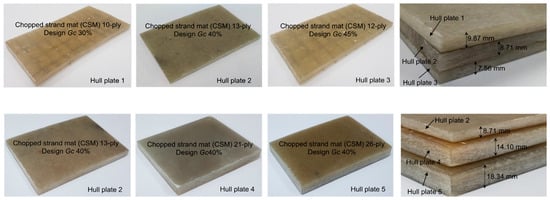
Figure 2.
Prototype hull plates fabricated according to the design plan.
4. Test Methods
4.1. Ultrasonic Inspection
To increase the measurement accuracy of the ultrasonic NDE of the GFRP laminate, it is recommended to use a low-frequency probe (0.50–2.25 MHz) [5,6]. In addition, pulse echo ultrasonic testing is recommended because only the measurement of one side of the hull structure is possible with the NDE method, owing to the dimensions of the structure and the hull structure characteristics [14,23]. Accordingly, in this study, traditional pulse echo ultrasonic testing was conducted, and A-scan inspection was performed using a probe [30] with a diameter of 12.70 mm and frequency of 1.00 MHz. Glycerin was used as the couplant.
The measurement points were set at 2 cm intervals along the width and length, and A-scans were performed at a total of 250 measurement points, with 5 hull plates and 50 measurement points per hull plate (Figure 3). As is shown in Figure 4, the attenuation characteristics at each measurement point were examined by analyzing the amplitude difference between the front and back surfaces of the GFRP hull plate through multiple back reflection signals.
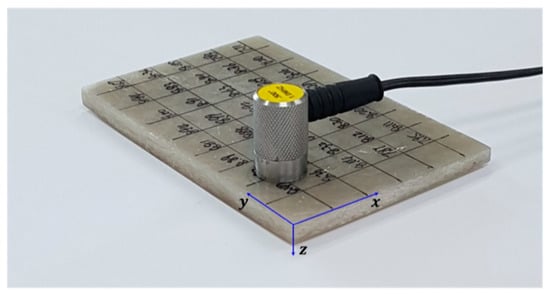
Figure 3.
Example pulse echo ultrasonic device used in the experiment.
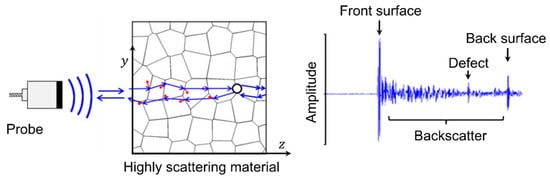
Figure 4.
Conceptual diagram of pulse echo testing for attenuation measurement, modified from [31].
Attenuation describes the decrease in ultrasound intensity with distance. In this study, the attenuation of ultrasonic waves through the GFRP hull plate was determined from the ratio between the amplitudes of the first and second echo heights. Here, the wave path length (L) was the total distance traveled by the ultrasonic wave during the first and second echoes, which was approximately twice the GFRP hull plate thickness.
The attenuation coefficient (α) [32], which is defined as the attenuation per path length, can be expressed as
where α is measured in dB/mm; AA and A are the amplitudes of the first and second back reflections, respectively, measured as percentages; and T is the laminate thickness (of each measurement point) in mm.
α = (20logAA/A)/2T,
4.2. Void Content Measurement
As reported previously, because composite materials are affected by inner defects, such as voids and the weight fraction of the reinforcement, these aspects were also considered in this study. Theoretical calculations and experimental measurements have been performed to determine the Gc for GFRP laminates. Among the methods utilized, burn-off testing has yielded the most accurate measurements [17].
After performing the ultrasonic A-scan, specimens with dimensions of 2 cm × 3 cm were cut from the hull plate in preparation for the burn-off test, which was conducted on 5 specimens representing each Gc in the hull plate group, in which the Gc was varied, and 5 specimens with each thickness in the hull plate group, in which the thickness was varied, for a total of 25 specimens. The burn-off test was performed according to the ASTM D3171 standard [33]. In this study, a 4.5-L electric muffle furnace was used. The furnace was heated to approximately 600 °C, and heating and cooling were repeated until the specimen weight variation was within 0.001 g. Polyester was calcinated from the laminate cut, the weight of the remaining E-glass fiber was analyzed, and the exact Gc values and void volumes (Vv) of the hull plate specimens were measured.
5. Experimental Results
5.1. Effects of the Glass Fiber Weight Fraction on Attenuation
Ultrasonic A-scanning was performed on all the hull plates, and the effect of the glass fiber weight fraction was analyzed based on the results for the hull plates in the Gc variation group with Gc = 30%, 40%, and 45%.
Figure 5 provides an example of the A-scan analysis, showing multiple back reflections for the three aforementioned types of plates, and Table 3 presents the results, including the attenuation and attenuation coefficients according to Equation (1) at three random measurement points on each of the three plates. The results demonstrate that the attenuation coefficient increased with the increasing Gc, and a variation in attenuation was also observed. However, because the thickness difference must be considered, the statistics of all the data needed be analyzed.
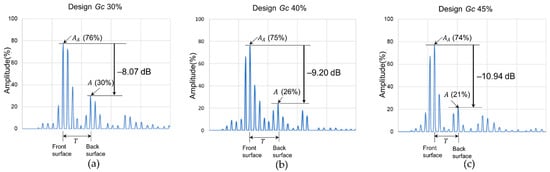
Figure 5.
Ultrasonic A-scan analysis results for each type of plate in the Gc variation group: (a) design Gc 30%; (b) design Gc 40%; and (c) design Gc 45%.
Table 3.
Characteristics of and attenuation analysis results for each plate in the Gc variation group.
The data obtained at the 150 measurement points on three hull plates in the Gc variation group are outlined above, and the attenuation variation was obtained as a function of the Gc, as shown in Figure 6a. When the hull plate thickness was similar but the Gc was increased, the mean attenuation values of the plates with Gc = 30%, 40%, and 45% were 6.80 dB, 8.10 dB, and 8.78 dB, respectively. It was considered that increasing the Gc led to greater attenuation with ultrasonic wave propagation. In addition, a residual plot was prepared to test the regression model of attenuation as a function of the Gc, and Figure 6b presents the results. A uniform distribution of residuals can be seen in the −2–2 dB section, regardless of the fitted values; therefore, the regression model was determined to be suitable.
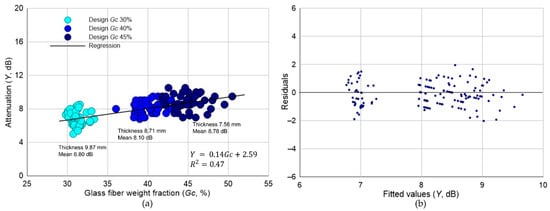
Figure 6.
Ultrasonic wave attenuation as a function of the Gc. (a) Regression analysis results. (b) Residual analysis results.
Figure 7a depicts the variation of the attenuation coefficient, which is defined as the attenuation per unit path length. The mean attenuation coefficients of the plates with Gc = 30%, 40%, and 45% were 0.35 dB/mm, 0.46 dB/mm, and 0.52 dB/mm, respectively. It can be concluded that during ultrasonic wave propagation, although E-glass fiber was the propagation medium, it increased the interference in the ultrasonic wave. In addition, it was assumed that the irregularity of the fiber chop, a characteristic of CSM, caused additional scattering. A uniform distribution of residuals can be seen between −0.1 and 0.1 dB/mm around 0, regardless of the fitted values; therefore, the regression model was determined to be suitable (Figure 7b).
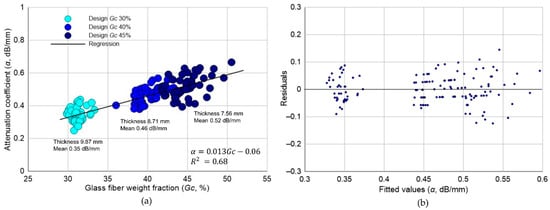
Figure 7.
Ultrasonic wave attenuation as a function of the Gc. (a) Regression analysis results. (b) Residual analysis results.
5.2. Effects of the Laminate Thickness on Attenuation
The effects of the thickness were analyzed based on the ultrasonic A-scan results of hull plate 2 (actual mean of 8.71 mm), hull plate 4 (actual mean of 14.10 mm), and hull plate 5 (actual mean of 18.34 mm) in the thickness variation group. Figure 8 provides an example of the analysis of the A-scan presentation, showing multiple back reflection results for each of the three plates, and Table 4 outlines the results, including the attenuation and attenuation coefficients according to Equation (1) at three random measurement points on the three plates. The attenuation increased significantly, whereas the attenuation coefficient showed no significant variation. Upon comparing these results with those shown in Figure 5 (obtained by varying the Gc), we could infer that attenuation increased significantly. The polyester added to increase the thickness of the plate could have led to the increase in attenuation [13,14]. The discussion section explains in detail the effects of the varying Gc and the thickness on attenuation and void formation.
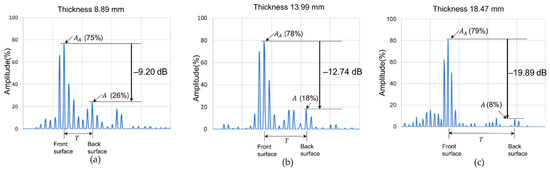
Figure 8.
Ultrasonic A-scan results for each type of plate in the thickness variation group. (a) Thickness = 8.89 mm. (b) Thickness = 13.99 mm. (c) Thickness = 18.47 mm.
Table 4.
Characteristics of and attenuation analysis results for each plate in the thickness variation group.
The data obtained at 150 measurement points were analyzed to obtain the results for hull plates 2, 4, and 5, which are shown in Figure 9. The Gc was designed to be fixed at 40%. As the mean thickness increased from 8.71 mm to 14.10 mm and 18.34 mm, the mean attenuation also significantly increased from 8.10 dB to 12.45 dB and 17.38 dB, respectively (Figure 9a). Based on the residual analysis, the regression model was confirmed to be suitable.
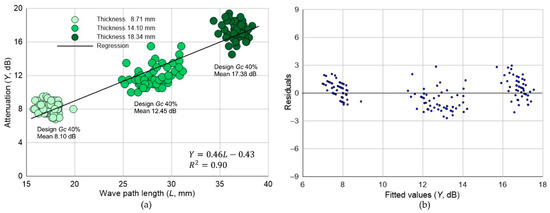
Figure 9.
Ultrasonic wave attenuation as a function of thickness. (a) Regression analysis results. (b) Residual analysis results.
Figure 10a presents the attenuation coefficients of the three hull plates with different thicknesses. Although the plate thickness differed by more than two times, the actual mean Gc was similar, with values of 39.40%, 40.29%, and 43.39%. Accordingly, the attenuation coefficients of all three plates were similar, being 0.46 dB/mm, 0.44 dB/mm, and 0.48 dB/mm. The regression model was confirmed to be suitable by constructing a residual plot.
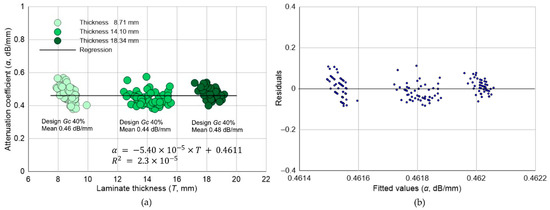
Figure 10.
Ultrasonic wave attenuation coefficient as a function of the thickness. (a) Regression analysis results. (b) Residual analysis results.
6. Discussion
6.1. Effects of Gc and Thickness Variation
Further statistical analysis was performed on the ultrasonic test results obtained using the Gc and thickness variation groups. The attenuation coefficient exhibited predictable levels of variation with the Gc and thickness. However, in the case of attenuation variation, there was also a significant difference between the two groups (Figure 6a and Figure 9a).
Both types of variation increased the attenuation, but when the Gc was varied, the irregularity of the wave was greater. This characteristic is thought to result from the fact that, although the ultrasonic wave speed increases upon increasing the laminate density, the E-glass fiber chop interferes with the wave simultaneously.
The increments in attenuation for the two groups were also different. The plates in the thickness variation group produced a larger change than the plates in the Gc variation group. The correlation analysis results obtained for each group also supported this finding. The Pearson correlation analysis revealed a larger correlation in the thickness variation group than in the Gc variation group, indicating that the plate thickness had a considerably higher correlation with the attenuation than the Gc (Figure 11). In particular, the analysis of the thickness variation group (Figure 11b) confirmed that the Gc had an almost negligible effect (ρ = –0.092), whereas the thickness had a highly significant effect (ρ = 0.948) on attenuation.
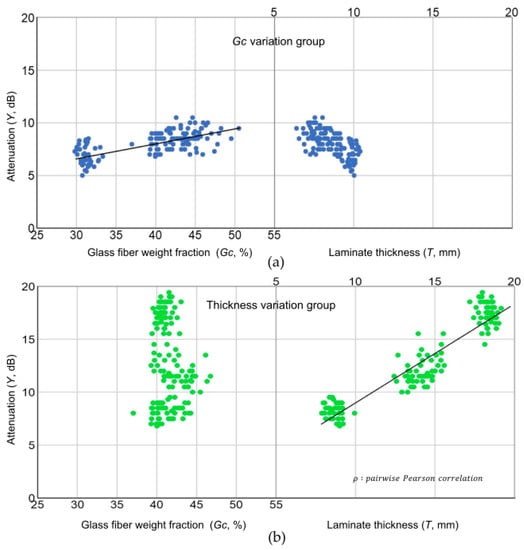
Figure 11.
Pearson’s correlation analysis to investigate the effect of the Gc and laminate thickness on attenuation. (a) Gc variation group. (b) Thickness variation group.
Therefore, when the Gc was in the range of 30%–45%, which is a typical range for the GFRP structure design, plate thickness variation had a greater impact on attenuation than Gc variation.
6.2. Effects of Voids
In typical GFRP structures, void generation increases with an increasing Gc or thickness; thus, the analysis was conducted while considering this aspect. Fifteen burn-off tests were performed with two groups of hull plates (Table 5 and Table 6), and Figure 12 presents the analysis results for each Gc and thickness variation group plate.
Table 5.
Gc values of the hull plate specimens according to burn-off testing.
Table 6.
Vv values of the hull plate specimens according to burn-off testing.
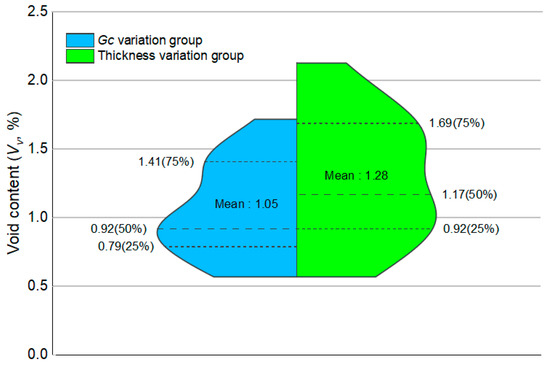
Figure 12.
Comparison of void volumes within the hull plate (Gc variation group vs. thickness variation group).
According to the analysis results (Figure 12), thickness variation had a slightly greater impact on the generation of voids than Gc variation. For a more detailed investigation, further statistical analyses were performed. The population mean T-test for the mean void volumes in the Gc and thickness variation group plates yielded a significance level of 0.078. Thus, there was a difference in the generation of voids between the two groups, but this difference was not significant. This is because the Gc values of the hull plate fabricated in this study were 32.28–43.83%, which did not indicate a high Gc region but rather a normal Gc region; thus, a high ratio of void generation was not observed. In fact, thickness variation had a greater effect on void generation than Gc variation. An average void volume of 1.8% was generated in the thickest plate (18.34 mm) According to an earlier study [34], hull plates with 50–60% Gc contain up to 3–6% voids, and the thickness of these hull plates is less than half that of the plates analyzed in this study. Therefore, inner defect volumes equal to approximately 1% of the plate volumes in both the variation groups were considered normal [23].
7. Conclusions
The purpose of this study was to investigate the attenuation characteristics of ultrasonic waves according to the design and fabrication characteristics of GFRP laminates for composite ships. To this end, various combinations of GFRP laminates with Gc values and thicknesses similar to the actual design values of hull plates were fabricated, and a pulse echo ultrasonic test was performed on the fabricated specimens. The conclusions of this study are as follows.
When the Gc was set to 30%, 40%, and 45% while the thickness was kept at similar values (7.56–9.87 mm), the attenuation coefficient showed a natural tendency to increase accordingly. However, some wave irregularities were identified, which are thought to have originated from the increase in the GFRP laminate density caused by increasing the E-glass fiber weight; the E-glass fiber chop also increased the ultrasonic wave scattering.
When the Gc value of the hull plate was kept constant at 40% and the thickness was changed to 10 mm, 15 mm, and 20 mm, all three measurement groups exhibited highly similar attenuation coefficients. The attenuation increased significantly, becoming approximately three times larger than that in the Gc variation group. This increase in attenuation could have occurred because the amount of polyester increased considerably when the thickness was increased at the same as the Gc, and the interface change between each ply of the laminate increased.
Considering the above results comprehensively, in the Gc range of 30–50%, which is the common range of Gc values applied in the design of laminate structures for GFRP ships, the plate thickness had a greater impact on the attenuation characteristics than the Gc. In addition, the effects of inner defects such as voids on the ultrasonic waves were relatively insignificant.
Author Contributions
Conceptualization, D.O. and J.H.W.; methodology, D.O. and J.H.W.; funding acquisition, D.O.; manufacturing, Z.H. and J.-W.J.; test and investigation, Z.H. and S.J.; writing—original draft, Z.H. and S.J.; writing—review and editing, D.O. All authors have read and agreed to the published version of the manuscript.
Funding
This research was a part of the project titled “Jeonnam Sea Grant Program”, funded by the Ministry of Oceans and Fisheries, Korea (grant number 20170347).
Conflicts of Interest
The authors declare no conflict of interest.
References
- Gholizadeh, S. A review of non-destructive testing methods of composite materials. Procedia Struct. Integr. 2016, 1, 50–57. [Google Scholar] [CrossRef] [Green Version]
- Dong, Y.; Ansari, F. Non-destructive testing and evaluation (NDT/NDE) of civil structures rehabilitated using fiber reinforced polymer (FRP) composites. In Service Life Estimation and Extension of Civil Engineering Structures; Karbhari, V.M., Lee, L.S., Eds.; Woodhead Publishing: Cambridge, UK, 2011; pp. 193–222. ISBN 978-1-84569-398-5. [Google Scholar]
- Mohamed, A.; Thameur, M.; Chedly, A. Ultrasonic velocity as a tool for physical and mechanical parameters prediction within geo-materials: Application on cement mortar. Russ. J. Nondestr. Test. 2018, 54, 345–355. [Google Scholar] [CrossRef]
- Chang, J.J.; Zheng, C.L.; Ni, Q.Q. The ultrasonic wave propagation in composite material and its characteristic evaluation. Compos. Struct. 2006, 75, 451–456. [Google Scholar] [CrossRef]
- Ibrahim, M.E. Nondestructive testing and structural health monitoring of marine composite structures. In Marine Applications of Advanced Fiber-Reinforced Composite; Graham-Jones, J., Summerscales, J., Eds.; Woodhead Publishing: Cambridge, UK, 2016; pp. 147–183. ISBN 978-1-78242-250-1. [Google Scholar]
- Ning, W. Structural Health Condition Monitoring of Carbon-Fibre Based Composite Materials Using Acoustic Emission Techniques. Master’s Dissertation, University of Birmingham, Birmingham, UK, 2015. [Google Scholar]
- Ma, W.; Liu, F. Effects of porosity on ultrasonic characteristic parameters and mechanical properties of glass fiber reinforced composites. Int. J. Mod. Phys. Conf. Ser. 2012, 6, 646–651. [Google Scholar] [CrossRef] [Green Version]
- Lee, J.; Soutis, C. Thickness effect on the compressive strength of T800/924C carbon fiber–epoxy laminates. Compos. Part A Appl. Sci. Manuf. 2005, 36, 213–227. [Google Scholar] [CrossRef]
- Klosterman, D.; Browning, C.; Hakim, I.; Lach, K. Investigation of various techniques for controlled void formation in fiberglass/epoxy composites. J. Compos. Mater. 2020, 55, 489–506. [Google Scholar] [CrossRef]
- Abdelal, N. Effect of Voids on Delamination Behavior under Static and Fatigue Mode I and Mode II. Ph.D. Thesis, University of Dayton, Dayton, OH, USA, 2013. [Google Scholar]
- Ishii, Y.; Biwa, S.; Kuraishi, A. Influence of porosity on ultrasonic wave velocity, attenuation and interlaminar interface echoes in composite laminates: Finite element simulations and measurements. Compos. Struct. 2016, 152, 645–653. [Google Scholar] [CrossRef] [Green Version]
- Lin, L.; Luo, M.; Tian, H.T.; Li, X.M.; Guo, G.P. Experimental investigation on porosity of carbon fibre-reinforced composite using ultrasonic attenuation coefficient. In Proceedings of the 17th World Conference on Nondestructive Testing, Shanghai, China, 25–28 October 2008. [Google Scholar]
- Mouritz, A.P. Ultrasonic and interlaminar properties of highly porous composites. J. Compos. Mater. 2000, 34, 218–239. [Google Scholar] [CrossRef]
- Lee, S.G.; Oh, D.K.; Woo, J.H. Experimental study on the characteristics of the change in glass-fiber weight content in ultrasonic inspection of GFRP hull structures. In Proceedings of the Society of Naval Architects of Korea 2020 General Meeting & Annual Autumn Conference, Changwon, Korea, 5–6 November 2020. [Google Scholar]
- Stone, D.E.W.; Clarke, B. Ultrasonic attenuation as a measure of void content in carbon-fibre reinforced plastics. Nondestruct. Test. 1975, 8, 137–145. [Google Scholar] [CrossRef]
- Jang, J.W.; Han, Z.Q.; Oh, D.K. Light-weight optimum design of laminate structures of a GFRP fishing vessel. J. Ocean Eng. Technol. 2019, 33, 495–503. [Google Scholar] [CrossRef]
- Han, Z.Q.; Jeong, S.H.; Noh, J.K.; Oh, D.K. Comparative study of glass fiber content measurement methods for inspecting fabrication quality of composite ship structures. Appl. Sci. 2020, 10, 5130. [Google Scholar] [CrossRef]
- RINA (Registro Italiano Navale). Rules for the Classification of Pleasure Yachts. Part B-Hull and Stability; Imago Media: Genova, Italy, 2019. [Google Scholar]
- Oh, D.K.; Han, Z.Q.; Noh, J.K.; Jeong, S.H. Laminate weight optimization of composite ship structures based on experimental data. J. Soc. Nav. Archit. Korea 2020, 57, 104–113. [Google Scholar] [CrossRef]
- Oh, D.K.; Lee, D.K.; Jeong, S.H. Environmental impact evaluation on lightweight structure design of a composite ship by LCA (Life Cycle Assessment). J. Korean Soc. Precis. Eng. 2019, 36, 875–881. [Google Scholar] [CrossRef]
- Greene, E. Marine composites non-destructive evaluation. In Proceedings of the SSC Ship Structure Symposium: Vessel Safety &Longevity through Ship Structure Research, Linthicum Heights, MD, USA, 18–20 May 2014. [Google Scholar]
- Song, J.H.; Oh, D.K. Lightweight structure design for composite yacht with optimum fiber mass content. In Proceedings of the International SAMPE Symposium and Exhibition, Long Beach, CA, USA, 25 May 2016. [Google Scholar]
- Mouritz, A.P.; Townsend, C.; Shah Khan, M.Z. Non-destructive detection of fatigue damage in thick composites by pulse-echo ultrasonics. Compos. Sci. Technol. 2000, 60, 23–32. [Google Scholar] [CrossRef]
- Han, Z.Q.; Jang, J.W.; Oh, D.K. Design margin of composite structure of Korean fishing vessel and assessment of its environmental impact. Shipbuild. China 2020, 61, 90–100. [Google Scholar]
- Typical GFRP Fishing Vessel. Available online: http://www.badaro.pe.kr/bbs/zboard.php?id=board010&page=1&sn1=on&divpage=1&sn=on&ss=off&sc=off&keyword=%B4%EB%B1%A4%C1%B6%BC%B1&select_arrange=headnum&desc=asc&no=1709 (accessed on 26 March 2021).
- Owens Corning. Available online: http://www.owenscorning.co.kr/reinforcements.asp (accessed on 26 March 2020).
- Aekyung Chemical Co., Ltd. Available online: https://www.akc.co.kr/product/list.do?bcode_id=BCK1&mcode_id=BCK1_1&scode_id=BCK1_1_3 (accessed on 26 March 2020).
- Alfa Mirage Co., Ltd. Available online: https://www.alfamirage.com/english/catalog/data/300s_features.pdf (accessed on 12 May 2020).
- Bluetec. Available online: https://ctx.cretec.kr/CtxApp/ebook/index.do (accessed on 12 May 2020).
- Dakota Ultrasonics. Available online: https://dakotaultrasonics.com/product/corrosion/cmx-dl-plus/ (accessed on 26 March 2020).
- Van Pamel, A. Ultrasonic Inspection of Highly Scattering Materials. Ph.D. Thesis, Imperial College London, London, UK, 2015. [Google Scholar]
- American Society for Testing and Materials. Standard Practice for the Measurement of the Apparent Attenuation of Longitudinal Ultrasonic Waves by Immersion Method (ASTM E664); ASTM International: West Conshohocken, PA, USA, 2020. [Google Scholar]
- American Society for Testing and Materials. Standard Test Methods for Constituent Content of Composite Materials (ASTM D3171-15); ASTM International: West Conshohocken, PA, USA, 2015. [Google Scholar]
- Lee, S.G.; Oh, D.K.; Woo, J.H. The effect of high glass fiber content and reinforcement combination on pulse-echo ultrasonic measurement of composite ship structures. J. Mar. Sci. Eng. 2021, 9, 379. [Google Scholar] [CrossRef]
Publisher’s Note: MDPI stays neutral with regard to jurisdictional claims in published maps and institutional affiliations. |
© 2021 by the authors. Licensee MDPI, Basel, Switzerland. This article is an open access article distributed under the terms and conditions of the Creative Commons Attribution (CC BY) license (https://creativecommons.org/licenses/by/4.0/).