Abstract
Social media, such as Twitter, is a source of exchanging information and opinion on global issues such as COVID-19 pandemic. In this study, we work with a database of around million tweets collected across five weeks of April–May 2021 to draw conclusions about public sentiments towards the vaccination outlook when vaccinations become widely available to the population during the COVID-19 pandemic. We deploy natural language processing and sentiment analysis techniques to reveal insights about COVID-19 vaccination awareness among the public. Our results show that people have positive sentiments towards taking COVID-19 vaccines instead of some adverse effects of some of the vaccines. We also analyze people’s attitude towards the safety measures of COVID-19 after receiving the vaccines. Again, the positive sentiment is higher than that of negative in terms of maintaining safety measures against COVID-19 among the vaccinated population. We also project that around and of the US population will get at least one dose of vaccine and be fully vaccinated, respectively, by the end of July 2021 according to our forecast model. This study will help to understand public reaction and aid the policymakers to project the vaccination campaign as well as health and safety measures in the ongoing global health crisis.
1. Introduction
Machine learning (ML) is the most recent method in data science that has paved the way for technological accomplishments and tools that would have been unimaginable a couple of years ago. Image recognition, sentiment analysis [1,2,3,4], product recommendations, spam/fraud detection [5], social media features, etc. are some of the real-world machine learning applications that are sweeping the world. Different web-based social media have been broadly utilized as a means of trading data by both the population and organizations all around the world. The quantity of social media users has started to increment quickly, particularly in the previous decade. Facebook, Twitter, YouTube, LinkedIn, and Pinterest saw huge increments over the previous year. Facebook is the most famous social media with 2.8 billion monthly active users [6], while Twitter has around 300 million monthly active users [7]. Twitter is encountering fast development and is rapidly acquiring fame everywhere in the world. The Twitter interface is utilized by certain users to help different viewpoints, for instance as a medium to fight, political missions, and information spreading, and it is assuming a significant part in social development.
Coronavirus is one of the moving themes on Twitter since January 2020 and has kept on being examined to date. A cluster of pneumonia cases in Wuhan, China, was reported to the World Health Organization (WHO) on 31 December 2019 and the cause of the pneumonia cases (the disease named as COVID-19) was identified as a novel betacoronavirus, the 2019 novel coronavirus (2019-nCoV, renamed as SARS-CoV-2) [8]. In March 2020, COVID-19 was declared as a pandemic by WHO considering more than 118,000 cases in 114 countries [9]. By 1 June 2021, there has been 3.57 million confirmed deaths and 171.19 million confirmed COVID-19 cases [10]. The situation has improved since vaccination of COVID-19 started to scale up. As we gain more evidence of the positive impacts of vaccination on transmission, it will help to strengthen public trust [11]. Considering this, analyzing the public opinion or sentiment is very important for motivating people to be vaccinated against COVID-19.
This paper aims at analyzing public sentiment on COVID-19 vaccination and the aftermath of vaccination regarding health safety measures. We scrape tweets based on different keywords filtering related to vaccines and health and safety issues after vaccination to help us understand public reaction and aid policymakers to project the vaccination campaign as well as health and safety measures. Analyzing the Twitter content empowers health experts, policymakers to learn about the public’s reaction to vaccination during the COVID-19 pandemic. It also elucidates people’s opinions on the health guidelines for the prevention of COVID-19 after getting vaccinated. Discoveries from this analysis related to health are useful as fundamental examinations for building more thorough models, which can be utilized to create proposals for the larger public and establish meaningful strategies and policies. The tweets in this study have caught discussions about vaccination and health guidelines during COVID-19 in numerous nations. Social media information permits scientists and researchers to have a global point of view, which is particularly shrewd during a worldwide pandemic. This study can be replicated by scraping tweets regularly until the COVID-19 pandemic comes to an end for understanding the overall public sentiment while the vaccination campaign is ongoing. In another part of the paper, we try to show the recent forecasting of the US population to have an understanding of the current vaccination scenario in the USA. We aim to have an overview on whether the vaccination campaign is proceeding properly and people are aware of the situation. We find that our forecast model also predicts a similar percentage of population as the US Government is targeting by a certain timeline. If the predicted percentage had been less, it would be an indicator to emphasize more on vaccination campaign. In addition, the health and government officials could plan accordingly beforehand to handle such scenario.
This type of study will be useful for the health and government officials to get insights about any newly discovered disease with early invention of vaccine for that particular disease. The contribution of this paper is two-fold.
- We performed sentiment analysis to have an overview of people’s opinion regarding the COVID-19 vaccination.
- −
- We analyzed the tweets on seven different types of COVID-19 vaccine and find public sentiments. This analysis is useful to figure out whether people are reluctant to vaccinate considering the side effects of some of the vaccines. In addition, this response indicates people’s interest and showing willingness to take vaccines in response to the vaccination campaign.
- −
- We collected tweets mentioning vaccination with different terms related to health guidelines. Public sentiment on these tweets help us learn people’s opinion on how they are following the health guidelines after getting vaccinated.
- We performed a time series forecasting on the vaccination scenario of the USA and predict the percentage of population that will be vaccinated by a certain timeline.
2. Related Works
There have been several works related to analyzing the Twitter dataset on different topics during the COVID-19 pandemic [12,13,14,15]. Only a few studies focus on the Twitter data related to COVID-19 vaccination [16,17].
Glowacki et al. [12] performed text mining to identify addiction concerns during the COVID-19 pandemic. They captured public tweets containing the two keywords “addiction” and “covid” together and came up with 14 prevalent topics and provided discussion on those topics. Their dataset includes only 3301 tweets. They aim at identifying the public discussion on addiction on Twitter during the COVID pandemic but have not focused on sentiment analysis on addiction due to the pandemic. In [13], the authors worked with Twitter data related to “Mask”. They found that the volume and polarity of mask related tweets has greatly increased during the timeline from 17 March 2020 to 27 July 2020. They also employed clustering techniques to organize these tweets into fifteen high-level themes and fifteen specific topics within each theme. They performed sentiment analysis on each theme and topic. They also applied an abstractive text summarization model using NLP to automatically interpret and describe the subject of the conversation occurring within each theme and topic cluster. Xue et al. [18] used a machine learning approach, Latent Dirichlet Allocation (LDA), to identify popular unigram, bigrams, salient topics and themes, and sentiments in the collected four million tweets on COVID-19 using 25 different hashtags in the period of 1 March 2020 to 21 April 2020. They used the NRC Emotion Lexicon to classify the sentiments into eight primary emotions: anger, anticipation, fear, surprise, sadness, joy, disgust, and trust. Their result show that Twitter users reveal fear when tweeting about COVID-19 new cases or death rather than trust. Pano and Kashef [14] presented sentiment analysis on tweets related to bitcoins during COVID-19 pandemic using VADER. They compared 13 different text preprocessing strategies for correlating the sentiment scores of the tweets with bitcoin price. Bhagat et al. [15] performed sentiment analysis using TextBlob on online education by webscraping 154 articles from online news and blogging websites during the COVID-19 pandemic. Their results show that over of the articles are positive, and, in general, the blogs have been more positive than the newspaper articles.
Chen and Dredze [19] were the first to analyze vaccine related images on Twitter. The goal was the identification of propagation of images being used in vaccine-related tweets and to predict with a logistic regression model if the image has been retweeted or not. The authors released the labeled dataset that can be used as sentiment classifier for images. Villavicencio et al. [16] based their study on sentiment analysis of COVID-19 vaccination tweets in the Philippines. The authors used Naïve Bayes model to classify English and Filipino language tweets (993 tweets) using the RapidMiner data science software with accuracy and showed the sentiments of Filipinos towards COVID-19 vaccines. Chaudhri et al. [17] recently analyzed whether people are in favor of receiving a COVID-19 vaccine. Their result shows that on average people have weakly positive sentiment in favor of receiving the COVID-19 vaccine shots. However, the authors in their analysis used a very limited number of tweets, only 900 tweets. They did not disclose how they selected those tweets or what things they considered while scraping them. The timeline of scraping the tweets is also not mentioned in the article.
Only the works in [16,17] are somehow related to our work. However, the work of Villavicencio et al. [16] is related to tweets in the Philippines only, whereas we collect tweets around the globe. For this reason, we have around million tweets, but they analyzed only 993 tweets. This work also uses the Naïve Bayes model to predict the classification, whereas we classify the tweets with lexicon-based classifier and use the publicly available tools TextBlob and VADER. Villavicencio et al. [16] performed manual annotation for the training data, i.e., they manually provided the sentiment labels for the training data to predict the test data. We do not predict the sentiment labels, rather we calculate labels using the well accepted sentiment analysis tools. Thus, we cannot show any accuracy comparison with the work of Villavicencio et al. [16]. For the work given in [17], the Twitter data collection criterion and timeline are missing, which are necessary if we want to compare our result with theirs. Their dataset consists of 900 tweets only and is also not publicly available, so we could not compare our work with theirs. In our case, we do a thorough study on people’s sentiment about the COVID-19 vaccines and if they are maintaining a healthy way of life after getting vaccinated. We choose seven different vaccines and collect tweets when vaccines are more accessible to the general public. Our work is reproducible given our implementation details and publicly available code-base. We show how sentiment analysis can be useful for health and government officials to lead the vaccination campaign based on people’s reaction.
Another contribution of this paper is related to time series forecasting of vaccinated population in the USA. Although there is a rich literature on different time series forecasting methods for many different applications [20,21,22], no prior work is relevant to COVID-19 vaccination forecast. The study done by the Centers for Disease Control and Prevention (CDC) [23] predicts the cumulative death for COVID-19, 4 weeks ahead using the ensemble method in R. Using this model, the CDC shows prediction for weekly death/cumulative deaths, daily hospitalization and weekly new COVID-19 cases. However, they still do not integrate any vaccination data for prediction of the vaccination scenario in the USA (state and national). This prediction takes into consideration, e.g., COVID-19 data, demographic data, and mobility data methods and estimates the impacts of interventions (social distancing, use of face coverings, etc.) and not a time series forecast. Another prediction of COVID-19 deaths and cases in the 15 countries of South and Central Europe is done in [24] using ensemble learning of the well known regression methods in WEKA. The dataset and detailed implementation are not well-described, so we cannot check how well their classifier could work on the vaccination dataset. Many other studies are focused on several other predictions: the stock market [22,25,26], business sales [27,28], temperature [29], weather [30], energy consumption [31,32], electricity [33,34], etc. We did not find any work that shows a forecast using vaccination data in the USA. Thus, we cannot show a comparison of our model in terms of accuracy with prior works. We do a time series forecasting on the US population to show what percentage of the population will be vaccinated in the near future time. This projection will help to inform public health decisions and policy making by projecting the number in the coming weeks.
3. Preliminaries
In this section, we describe the different Python libraries used in our work, the evaluation metrics, the methods for sentiment analysis, and the performance metrics for time series forecasting modeling.
3.1. Sentiment Analysis
There are two major approaches to sentiment analysis.
- Supervised machine learning or deep learning approaches.
- Unsupervised lexicon-based approaches.
As we do not have a pre-labeled dataset, we work with the second approach. In this section, we discuss two well-known sentiment analysis tools, TextBlob [35] and VADER [36].
3.1.1. TextBlob
TextBlob [35] is a Python library that provides support for different Natural Language Processing (NLP) tasks including sentiment analysis. TextBlob outputs the following two metrics for any input text.
Polarity is a float that lies within [−1, 1]. Negative values near −1 indicate negative sentiment, positive values near 1 indicate positive sentiments, and 0 indicates neutral sentiment.
Subjectivity is also a float which lies in the range of [0, 1]. Subjective sentences generally refer to personal opinion, emotions, or judgments, whereas objective refers to factual information. A sentiment that is more objective than subjective receives a lower score, which denotes a more likely-to-be-accurate reading or fact.
3.1.2. VADER
VADER [36] is a lexicon- and rule-based sentiment analysis tool. It is specifically designed for sentiments expressed on social media and works well on texts from other domains as well.
VADER provides output as the valence scores of each word in the lexicon, as ratios for proportions of text that fall into a positive, negative, or neutral category and all together sums to 1. The compound score is the most commonly used metric for sentiment analysis by researchers. Compound score is a float which lies in the range of [−1, 1]. The compound score is computed by summing the valence scores of each word in the lexicon, adjusted according to the rules, and then normalized to be between −1 and +1. Compound score indicates positive sentiment and compound score indicates negative sentiment. Neutral sentiment is defined by compound score .
3.2. Time Series Forecasting
The two general categories of machine learning (ML) are supervised and unsupervised learning. Supervised ML techniques are used when we a datum that we want to predict by using previous data of inputs and outputs to predict an output based on a new input. Unsupervised ML evaluates data in terms of traits and uses the traits to form clusters of items that are similar to each other. Time series forecasting is the process of using a model to generate predictions (forecasts) for future events based on known past events [22,37]. There are several machine learning methods:s regression, classification, clustering [38], dimensionality reduction, ensemble methods, neural nets and deep learning [39], transfer learning, reinforcement learning, Natural Language Processing (NLP),word embeddings, etc. Regression is one of the predictive modeling techniques which analyzes the correlations between a target and independent variables. It is used to predict model time series and then find the causal effect correlations among different factors [40].
3.2.1. Performance Metrics
We considered the following error and accuracy metrics to evaluate our forecasting model. The equation of the performance metrics are summarized in Table 1.

Table 1.
Performance evaluation metrics for time series forecasting.
- Mean Absolute Percentage Error (MAPE): The Mean Squared Error (MSE) is the average of the square of the forecast error. As the square of the errors are taken, the effect is that larger errors have more weight on the score. In this case, MAPE comes in handy where the data are not understood from the error measure itself. As MAPE is a percentage error, it gives a good idea of the relative error. MAPE is the most widely used unit-free measure.
- Direction accuracy: DAC is a measure of prediction accuracy of a forecasting method in statistics. It compares the forecast direction (upward or downward) to the actual realized direction. DAC is similar to a binary evaluation. The metric only considers the upward or downward direction in the time series and is independent of the quantitive value of the increase or decrease. DAC provides the probability that the forecasting method can detect the correct direction of the time series [41].
- Relative Absolute Error (RAE): Relative measures give an indication of how well the forecaster’s predictions are doing compared to just using the last known target value as the prediction. For RAE, the comparison is done with respect to absolute error with the last known target. RAE takes the total absolute error and normalizes it by dividing by the total absolute error of the simple predictor (i.e., the last known target).
- Root Relative Squared Error (RRSE): RRSE is similar to RAE. The difference is that RRSE takes the square root of the total squared error and normalizes it by dividing by the square root of the total squared error of the simple predictor (i.e., the last known target).
- Root Mean Squared Error (RMSE): MSE is more vulnerable to outliers since it gives extra weight to large errors. In addition, the squared errors are on different scale from the original data. Thus, RMSE, which is the square root of MSE, is often preferred to MSE as it is on the same scale as the data. However, RMSE is also sensitive to forecasting outliers. Researchers now seem to prefer unit-free measures for comparing methods [42,43].
3.2.2. Machine Learning Algorithms
We use the following well-known machine learning regression algorithms to build our forecasting model classifier.
- Support Vector Machine (SVM) for regression: The ability of SVM to solve nonlinear regression estimation problems makes SVM successful in time series forecasting. SVM regression acknowledges the presence of non-linearity in the data and provides a proficient prediction model. In the SVM regression method, the sequential minimal optimization algorithm from Alex Smola and Bernhard Scholkopf [44] is used. The utilization helps to replace all the missing values and transform the nominal attributes to binary values. It also helps to normalize the attributes by default values.
- k-Nearest Neighbor (KNN): KNN works by storing the entire training dataset and querying it to locate the k most similar training patterns when making a prediction. KNN regression calculates the average of the numerical target of the K nearest neighbors [45]. KNN regression uses the same distance functions as KNN classification. KNN is better than LR when the data have less noise. KNN requires much less hyperparameter tuning compared to MLP.
- Linear Regression (LR): Linear regression is a statistic approach to model the correlations between the scalar dependent variable Y and single or several explanatory variables denoted x. In this regression approach, linear predictor functions are used to model the correlations and the unknown parameters of the functions are evaluated by the data [46]. Decision trees support non-linearity, whereas LR only supports linear solutions.
- Random Forest (RF): RF regression contains several decision trees and targets the class that is the mode of the classes’ target by individual trees. The number of trees to be grown in the forest and the quantity of features or variables chosen at every node to develop a tree are the two standard parameters [47].
- M5 model tree: M5 tree is a decision tree learner for regression problems. The M5 algorithm assigns linear regression functions at the terminal nodes and fits a multivariate linear regression model to each subspace by classifying or dividing the whole data space into several subspaces. The M5 tree method deals with continuous class problems instead of discrete classes and can handle tasks with very high dimensions. It reveals piece-wise information of each linear model constructed to approximate nonlinear relationships of the dataset [48].
- Gaussian process for regression: The Gaussian algorithm is a very useful tool in non-linear multiple variate interpolation. It belongs to a kind of statistical framework in which observations happen in the continuous domain. During the process, each point of a certain continuous inputting space is related to the generally distributed random variable [49].
- Multilayer Perceptron (MLP): MLP is also known as Artificial Neural Networks (ANN). Neural networks are a complex algorithm to use for predictive modeling. This algorithm is inspired by a model of biological neural networks in the brain where small processing units called neurons are organized into layers that if configured well are capable of approximating any function. In regression problems, the interest lies in approximating a function that best fits the real value output [40]. MLP needs large training data compared to LR model and becomes slow due to its complex structure.
4. Methodology
In this section, we describe our Twitter dataset and the collection procedure. We mention our data pre-processing steps for sentiment analysis on two different datasets. We also discuss our machine learning forecast model for COVID-19 vaccination in the USA by presenting the methods for feature generation, training, and testing. We also provide the computational tools and environment in this section. We have made the collected corpus of tweets and the full source code publicly available (https://github.com/nawsafrin/covid-19) (accessed on 15 June 2021).
4.1. Computational Tools/Libraries
We used different Python libraries to do the sentiment analysis. For the collection of Twitter data and scraping tweets, we used Tweepy [50]. For natural language processing (pre-processing tweets before doing sentiment analysis), we used NLTK [51]. We used both TextBlob and VADER to do the sentiment analysis.
For building our machine learning forecast model, we used WEKA 3.8.3 [52] for the prediction of vaccinated US population.
4.2. Environment
Experiments in this study were performed on a personal computer with the configurations of Intel Core i7-4770 CPU 3.40 GHz × 8 Processor, 16 GB of RAM, 1 TB hard disk, 64-bit Windows 10 OS, and Ubuntu 16.04 LTS.
4.3. Sentiment Analysis
In this section, we describe the methodology of our work to perform sentiment analysis on Twitter data related to COVID-19 vaccination. Figure 1 portrays the schematic diagram for different steps of our sentiment analysis method on COVID-19 vaccination related tweets.
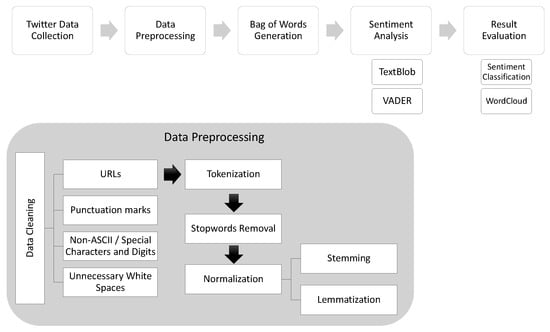
Figure 1.
Workflow for sentiment analysis on Twitter data using TextBlob and VADER.
4.3.1. Twitter Data Collection
We used the Twitter API [53] to collect around million original tweets using the Python library Tweepy [50]. We filtered the tweets by keywords associated with different COVID-19 vaccines and keywords mentioning a safe, healthy lifestyle after vaccination. Details about the keywords are mentioned in Table 2 and Table 3. The tweets were collected over a five-week period beginning on 10 April 2021 and ending on 17 May 2021. We discarded the retweets during this time period with the Twitter API filter. We also only collected tweets in English we used NLTK for further data analysis. Our Twitter data collection pipeline is shown in Figure 2. Twitter’s API provides access to of the public tweets by random sampling in near real time. Although questions might arise regarding biased or imbalanced data for collecting just sample from all tweets, it has been shown that sentiments found from the samples of tweets obtained via the API and the full tweet dataset reflect the same sentiment percentage with very little deviation (<1.8%) [54]. In compliance with the Twitter content redistribution policy [55], we only made the tweet IDs publicly available corresponding to the collected tweet text used in this work.
Table 2.
Twitter Dataset 1: Vaccination tweets used in our experimental evaluation.
Table 3.
Twitter Dataset 2: Tweets on healthy lifestyle used in our experimental evaluation.
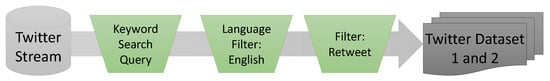
Figure 2.
Twitter data collection pipeline.
We categorized the collected tweets into two different datasets.
- Twitter Dataset 1: The first dataset has all the tweets related to different vaccines. In Table 2, we show the total number of tweets collected for each of the vaccines. We also list the keywords that we used to scrap those tweets. We also mention the unique number of tweets based on different pre-processing steps of the Twitter data done before the sentiment analysis.
- Twitter Dataset 2: We selected five topics related to maintaining safety/precautions in response to COVID-19 pandemic. We selected the precautionary actions for individuals that help reduce virus transmission during pandemics including social distancing, wearing face masks, hand hygiene, and restricting interpersonal contact to outdoor settings [11]. Additionally, we added another topic related to “travel” that was very restricted during the pandemic. For Twitter Dataset 2, we aimed to collect those tweets that have been shared by vaccinated people about their lifestyle after getting vaccines. Thus, we used the keywords [vaccine, vaccination, vaccinated, shot, fully vaccinated, first dose, second dose, 1st dose, 2nd dose] to scrap those tweets along with the keywords for particular topics, as listed in Table 3.
4.3.2. Pre-Processing of Data
- Data Cleaning: We removed the urls, punctuation marks, and special characters in this step.
- Tokenization: Text is divided into words (the smallest unit) in this step.
- Stopwords Removal: Some words such as “and”, “but”, “so”, and others are frequently used in the text but are not useful in the analysis. We do not use the predefined stopwords from any libraries because “not” or similar negative words, if removed, would change the sentiment of the sentence completely. Thus, we used our own list of stopwords that we made by modifying the most comprehensive collection of stopwords for the English language [56,57]. We removed all negative words from this mentioned list so that it does not impact sentiment analysis.
- Data Normalization:
- −
- Stemming: In this step, we normalized the words by truncating the words to their stem words. We used Porter Stemmer from the NLTK library.
- −
- Lemmatization: Next, we lemmatized words to get the root words according to the part of speech.
4.3.3. Sentiment Categorization
We used two sentiment analysis tools, TextBlob and VADER, to get the sentiment of the tweets. Sentiment analysis provides the polarity of the text. It also classifies text into positive and negative classes. Classification task can be performed by using different algorithms. Sentiment analysis methods can be machine learning-based or lexicon-based. In machine learning methods, a labeled dataset is required where the polarity/class of the text is already known. Lexicon is a collection of the predefined words where a polarity score is associated with each word. It is the easiest approach for sentiment classification. This classifier makes use of a lexicon and performs word matching which is used to categorize a sentence. In our work, both TextBlob and VADER use this lexicon-based approach.
In TextBlob, the sentiment category of each tweet is based on the polarity score of the text. For VADER, the classification is done based on the compound score.
We also generated the word clouds to visualize the important words based on the frequency of the words initially. However, this failed to provide useful information. Thus, we later used log-likelihood ratio [58,59,60,61] to generate the word clouds. We used Equation (1) to calculate the log-likelihood ratio for each sentiment category (positive, negative, and neutral). Here, denotes word, x denotes one of the sentiment categories, denotes rest of the sentiment categories.
4.4. Forecasting Model for COVID-19 Vaccination in the USA
We used WEKA for building our forecasting model classifier. We chose WEKA as it is more user-friendly. Another reason is that the saved model can be used by general users (health or government officials) who want to use this model for prediction. We used the WEKA’s time series framework to build our model [37]. The workflow for our forecasting method is shown in Figure 3. We used the well-known machine learning regression algorithms: SVM, KNN, LR, RF, M5 Tree, Gaussian regression, and MLP. Among all of these algorithms, we chose the algorithm that performs best with less error. According to the authors of [62,63,64], SVM often works best for time series forecasting, and we also obtained similar findings, as described in Section 5.3.
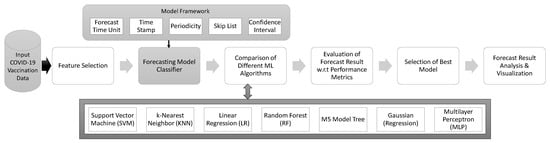
Figure 3.
Workflow for COVID-19 vaccination forecasting model using WEKA.
4.4.1. Vaccination Dataset
We used the publicly available COVID-19 vaccination dataset by Our World in Data [10], widely used by journalists, policymakers, WHO, researchers, and the public. We used the data from the months of March, April and May (26 May) as known past events to predict the future. We did not take data before March into consideration because the vaccine was very limited to certain people at that time.
4.4.2. Feature Selection
The vaccination dataset contains 59 different attributes. Descriptions of all the attributes can be found in [65]. We do not discuss all attributes here because they are not all relevant to the forecasting of vaccinations, for example, total_cases, new_cases, new_deaths, icu_patients, population, etc. Out of 59 different attributes, we identified the attributes given in Table 4 as those related to vaccination and interesting to forecast. Of these nine attributes, we do not consider the smoothed attributes [e,i] for further analysis because the USA the vaccination data are reported on a daily basis. We only selected the two attributes people_vaccinated and people_fully_vaccinated for prediction of the partially and fully vaccinated US population and obtain an overview of the vaccination scenario in the USA.
Table 4.
Features related to COVID-19 vaccination.
4.4.3. Time Series Forecasting Classifier
For the time series forecasting model, we needed to set the following parameters.
- Forecast Time Unit: We used two different time units, for the prediction of Fully Vaccinated Population. The shorter time period is 1 week (7 days) and the longer time period is 2 months (60 days). By definition, parameter values of 7 days indicate that we are setting up our system to forecast 7 days ahead from the last date of the input training dataset. For the prediction of partially vaccinated population, along with these two units, we also predict a middle timeline, that is 39 days, to get the prediction for 4 July, the Independence Day of the USA.
- Time stamp: We have a “Date” attribute in our dataset. Date was set for the “Time Stamp” parameter of our system.
- Periodicity: Periodicity allows the user to specify the periodicity of the data. As we predicted the vaccinated population on a daily basis, we chose “Daily” for this parameter value.
- Skip list: For daily forecasting, it might happen that the entity remains closed on certain days or holidays, for example, businesses, the stock market, etc. For such entities, these time periods do not count. In such cases, “Skip list” is used to supply these types of time periods that are not to be considered. For our dataset, we do not have any such time period for which the regular operation does not continue. Thus, we do not need to set the “Skip List” parameter.
- Confidence intervals: This parameter is used for the system to compute confidence bounds on the predictions that it makes. We used as the parameter value, which is also the default value of the parameter. The confidence level means that of the true target values fell within the interval. The confidence intervals were computed for each step-ahead level independently.
4.4.4. Selection of ML Algorithms
In this step, we changed the values of user-defined parameters associated with the different ML algorithms based on some statistical criteria and some some trial and error procedures. The values of the parameters can be found in our code-base. Then, we evaluated each algorithm based on the performance metric and identify the best methods with less error.
5. Experimental Evaluation
In this section, we summarize the results from our experimentation. In Section 5.1 and Section 5.2, we describe the overview of public sentiments related to COVID-19 vaccination. In Section 5.3, we describe the forecast result found from our model classifier.
5.1. Public Sentiment on Vaccination
In this section, we show the sentiment analysis for Twitter Dataset 1.
5.1.1. Vaccination Tweets by Location
We are interested to know from which locations the tweets have been made. According to the geographical distribution of the tweets, we found the top countries. The tweets that do not mention a location mentioned are labeled as “Unknown” source. In Figure 4, we can see that the top countries include USA Pfizer, Moderna and Johnson & Johnson), India (for Sputnik V and Covaxin), and UK (for Oxford-AstraZeneca).
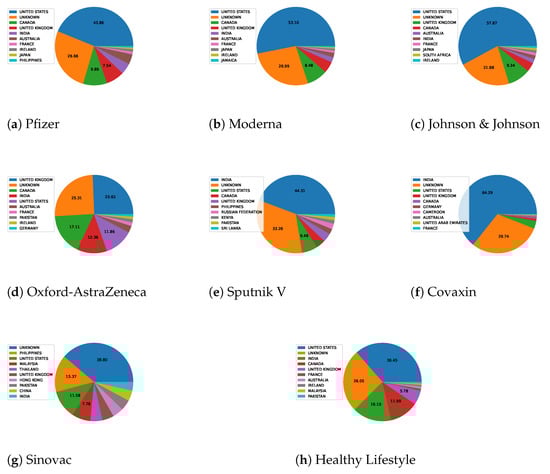
Figure 4.
Top countries with tweets for Twitter Dataset 1 (different vaccines) and Twitter Dataset 2 (healthy lifestyle).
5.1.2. Sentiment Distribution for Vaccination Tweets
We show the distribution of positive, neutral, and negative sentiment for different vaccines in Figure 5. Unless we pre-process data, many unimportant content remains in the analysis and misleads the result. Although in the raw data positive sentiment is more prevalent than neutral sentiment for all of the vaccines, after pre-processing, we observe that many neutral text contents were classified as positive sentiments in the raw tweets. From the subjectivity scores of the different vaccines, given in Figure A2, we see that, for lower subjectivity scores, the tweets are more prone to factual information, which leads to more neutral tweets. The polarity score distribution of the tweets for different vaccines is shown in Figure A1. Although in the collected tweet dataset the majority of the tweets are neutral, the positive sentiment is higher than that of the negative one. It provides a relief that, instead of some adversarial effects of some of the vaccines, people are taking the vaccination positively in the battle with COVID-19. For all of the vaccines, positive sentiment is 20–25%, negative sentiment is around , and the rest is neutral.
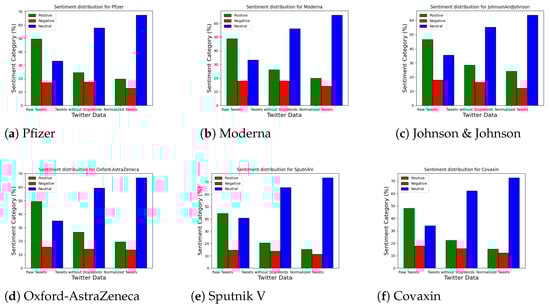
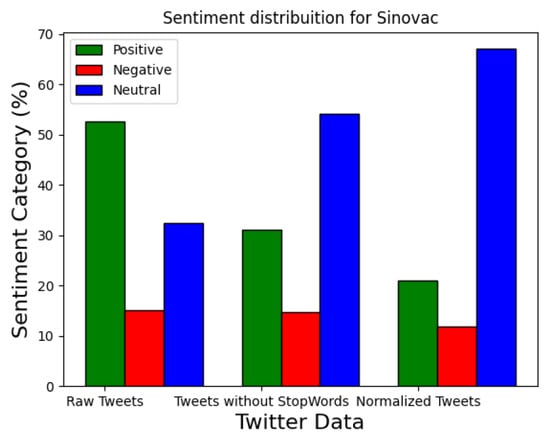
Figure 5.
Sentiment percentage distribution using raw and pre-proceseed tweets for different vaccines.
5.1.3. Sentiment Timeline for Vaccination Tweets
We show a day-to-day sentiment analysis of the tweets to have an understanding of the distribution of the tweets by date. This helps us to learn about some important topics on a particular day. Suppose, for the Johnson & Johnson vaccine (Figure 6c and Figure 7c), we see a high threshold of tweets on 13 April 2021. This high peak is due to the tweets about blood clots from taking the Johnson & Johnson vaccine and related news to this topic. We show the distribution using the results both TextBlob and VADER to get a better comprehension of which sentiment analysis tool is working well for these Twitter datasets. Comparing Figure 6 and Figure 7, we see that using both tools we have a similar trend. We observe from the following plots that VADER has the tendency to classify some neutral tweets into negative or positive ones and thus lessening the number of neutral tweets. In some cases (Figure 7c,d,f), the negative sentiment overrides the positive sentiments to a great extent. To verify such dissimilarities, we manually reviewed some tweets for the Johnson & Johnson vaccine dated 13 April 2021 where VADER (Figure 7c) shows a high peak of negative sentiment compared to TextBlob (Figure 6c) and listed some example tweets in Table 5. We observe that many tweets of positive and neutral sentiment as given in TextBlob are classified negative in VADER. Thus, for all of our other analyses regarding the sentiment analysis results, we mention the results found using TextBlob.
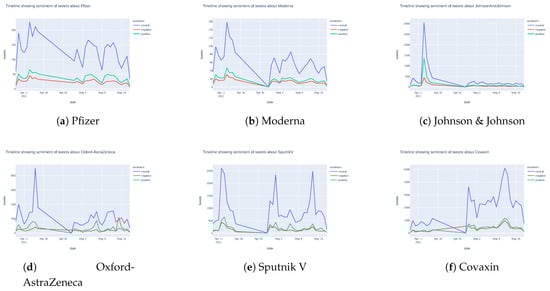
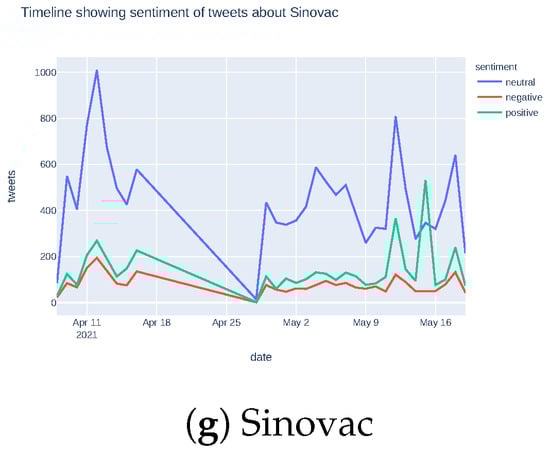
Figure 6.
Public sentiment for different vaccines with timeline using TextBlob.
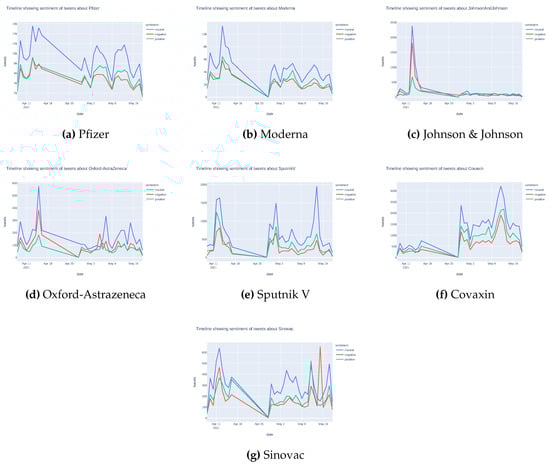
Figure 7.
Public sentiment for different vaccines with timeline using VADER.
Table 5.
Tweets on Johnson & Johnson Vaccine on 13 April 2021.
5.1.4. Top Frequency Words (Positive, Negative, Neutral) for Vaccination Tweets
In Figure 8, we show the high frequency word distribution for each vaccine. The words are categorized into negative, neutral and positive. Initially, we used the naive approach to generate the word clouds based on word frequencies, but the naive version does not reflect the significant results shown in Figure A3b (Moderna vaccine). In this case, positive, negative, and neutral, all three categories, portray the same words and do not capture any useful information (see the Appendix for details). Later, using the log-likelihood values, we obtained more relevant information, as given in Figure 8, for each of the vaccines. We obtained the most interesting findings in the negative category. For both the Johnson & Johnson vaccine and the Oxford-AstraZeneca vaccine, “Blood Clot” was pre-dominant in the negative category. Side effects of both of these vaccines [66] were propagated through tweets very rapidly, which is one of the advantages of social media that can be used by health officials. We also found that many people have fever and headache after taking the Moderna vaccine, as reflected in Figure 8b as the side effects of the Moderna vaccine Thus, we found the side effects of these different vaccines at a glance from the generated word clouds.
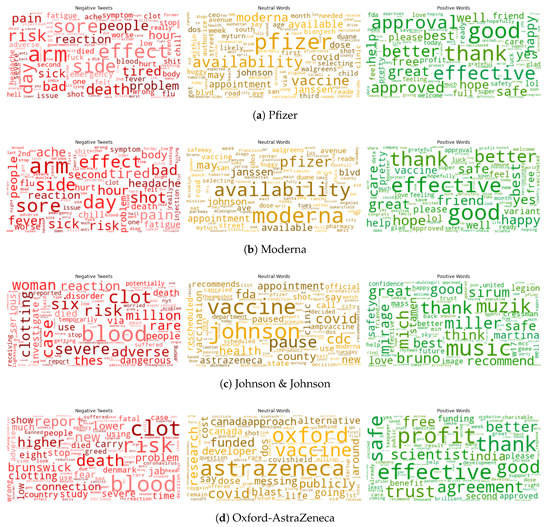
Figure 8.
Top frequency word distribution for different vaccines.
5.2. Public Sentiment on Healthy Lifestyle after Vaccination
In this section, we show the sentiment analysis for Twitter Dataset 2.
5.2.1. Post-Vaccination Tweets on Healthy Lifestyle by Location
Figure 4h shows that most tweets were generated in USA, India, and Canada, representing 34%, 15%, and 11% of the total tweets, respectively.
5.2.2. Sentiment Distribution for Post-Vaccination Tweets on Healthy Lifestyle
We show the distribution of positive, neutral, and negative sentiment for different post-vaccination tweets in Figure 9. Pre-processing of data is necessary, as explained in Section 5.1.2.
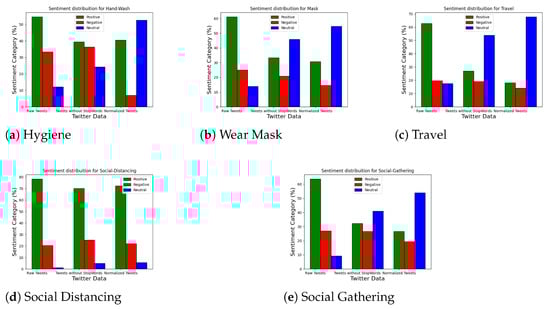
Figure 9.
Sentiment percentage distribution using raw and pre-proceseed tweets for Twitter Dataset 2 on healthy lifestyle.
For Twitter Dataset 2, we had the same observation. Only for the topic “social distancing” we have very few tweets with neutral sentiment, as given in Figure 9d. We provide a reasoning for such observation from the subjectivity score of the tweets given in Figure A5. In the case of tweets on “social distancing”, the distribution of subjectivity score is almost equally between fact and opinion. However, in the other four topics, the factual tweets overpower the judgemental tweets that leads to more neutral sentiment. We have shown the polarity score distribution of the tweets for Twitter dataset 2 in Figure A4. Observing Figure 9a–e, we see that, after vaccination, people are still conscious about maintaining a healthy lifestyle given around and of positive sentiment in maintaining social distancing and hygiene, respectively. The negative sentiment is and less for “social distancing” and “hygiene” topics, respectively. In the case of using mask, people have a moderate outlook.
We see around positive sentiment for wearing a mask and the negative sentiment is half that of the positive one. Vaccinated people have become more open to travel and social gatherings, as reflected by around difference between positive and negative sentiments. We are optimistic of the fact that negative sentiments do not override positive sentiments for any of the topics related to maintaining a healthy lifestyle after vaccination.
5.2.3. Sentiment Timeline for Vaccination Tweets
Observing Figure 10 and Figure 11, we can see some dissimilarities. As described in Section 5.1.3, VADER shows some misclassification for Twitter Dataset 2 as well. We manually inspected some tweets, and some misclassified example tweets with the sentiment are given in Table 6.
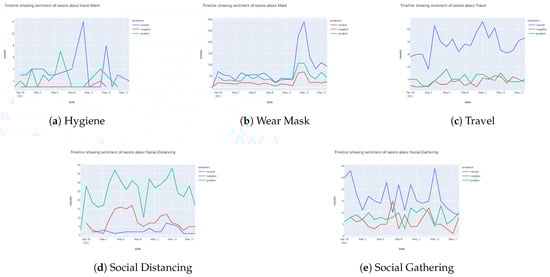
Figure 10.
Public sentiment for Twitter Dataset 2 on healthy lifestyle with timeline using TextBlob.
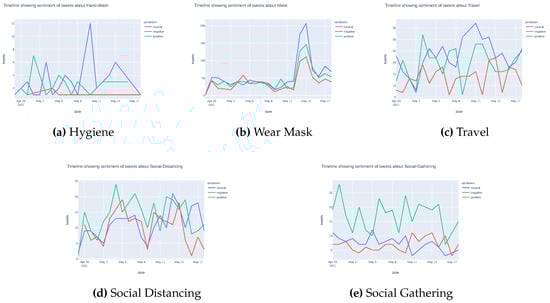
Figure 11.
Public sentiment for Twitter Dataset 2 on healthy lifestyle with timeline using VADER.
Table 6.
Random tweets from Twitter Dataset 2 on social distancing.
5.2.4. Top Frequency Words (Positive, Negative, Neutral) for Post-Vaccination Tweets on Healthy Lifestyle
In Figure 12, we show the high frequency word distribution for each topic, categorized into negative, neutral, and positive. Using word frequencies, no useful information can be observed. as shown in Figure A6. Later, using the log-likelihood values, we could better capture information for the positive words such as “stay, safe, well, happy, party, thank,” as given in Figure 12. In Figure 12c, we see the idea of travel ban in India and travel risk in Florida. However, the negative words are still scattered for other topics. Generating word clouds combining all topics provides a better overview of the negative words such as “ban, sick, stop, emergency, death, mask, risk” given in Figure 13. In Figure 13, at a glance, we can see that people are more reluctant to “mask” and lean towards “party” after getting vaccinated.
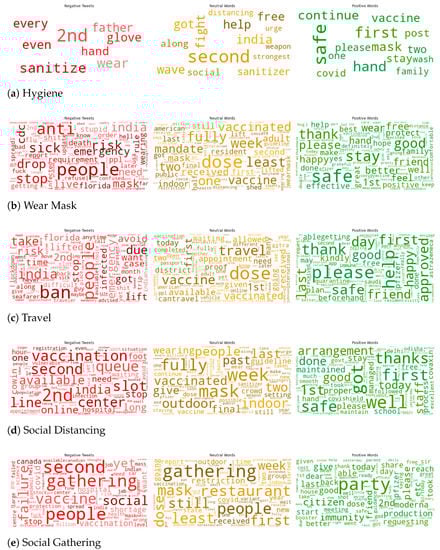
Figure 12.
Top frequency word distribution for Twitter Dataset 2 on healthy lifestyle.
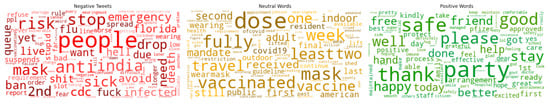
Figure 13.
Combined top frequency words on Twitter Dataset 2 on healthy lifestyle.
5.3. COVID-19 Vaccination Forecast for the USA
We used different machine learning models to forecast the fully vaccinated population of the USA. We also predicted the percent of the population that will be vaccinated with at least one dose of COVID-19 vaccine. The results are described in the subsequent sections.
5.3.1. Fully Vaccinated Population Prediction
The predicted outputs for a period of 60 days (2 months) from our model classifier are shown in Figure 14.
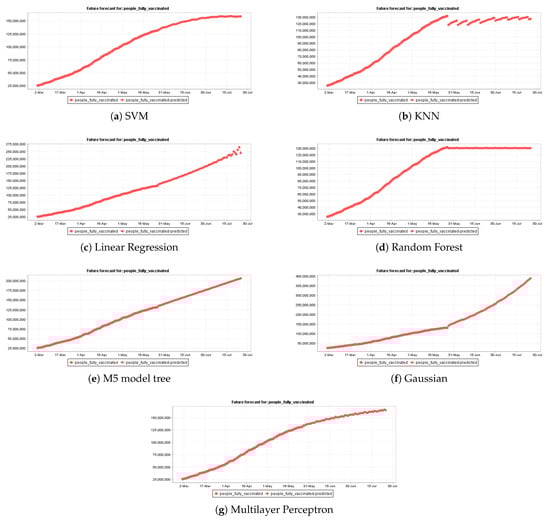
Figure 14.
COVID-19 vaccination prediction to forecast fully vaccinated population in the USA for different machine learning models with forecast time of 2 months.
We also performed a prediction for a shorter period of 7 days. For brevity, the predicted output is shown in Figure A7. The prediction accuracy and error of different models are given in Table 7. (We omit the values for RMSE while discussing our result because RMSE represents unit error instead of percentage error. We did not further process and convert RMSE to percentage error because the other metrics show relative representation as RMSE.) For the near-time forecast, SVM, M5 model tree, and MLP all have DAC. Although RF has the lowest MAPE, RAE, and RRSE, the DAC is below . The population of fully vaccinated people being an aggregation metric will always increase with time and so we prioritize the models having the highest DAC over minimum error metrics. Thus, we chose MLP model with DAC and the lowest error among SVM, M5 model tree and MLP models.
Table 7.
Prediction accuracy and error for different machine learning models to forecast fully vaccinated population in the USA.
For the 2-month prediction period, all models except KNN and LR have DAC. RF again has least errors, but Figure 14d shows that the predicted output is almost flat over the predicted time period. Considering the aggregation metric, we expect the output to increase over time, and thus selected a different model. Of all other methods, SVM has the lower error and is considered as the best classifier for the 2-month forecasting. Thus, using SVM, we can predict that by 25 July 2021 around of the US population will be fully vaccinated (2 doses as applicable according to the vaccine) against COVID-19.
5.3.2. Partially Vaccinated Population Prediction
The predicted outputs for partially vaccinated population of the USA for a period of 60 days (2 months) from our model classifier is shown in Figure 15. We also performed a prediction for the timeline 4 July 2021 to see the estimated percentage if it aligns with the US government expectations. The prediction accuracy and error for different models are given in Table 8. As for KNN and RF, the classifier does not work well, thus we do not mention the numbers in the table to keep it simple. For the 4 July forecast, SVM, M5 model tree, and MLP all have DAC. SVM has the lowest MAPE and RAE among these three models. Using SVM, the model predicts that around of the US population will get at least one dose of vaccine. If we consider only the adult population [67], this percentage becomes , which is nearly the expected percentage () given by US President Joe Biden [68].
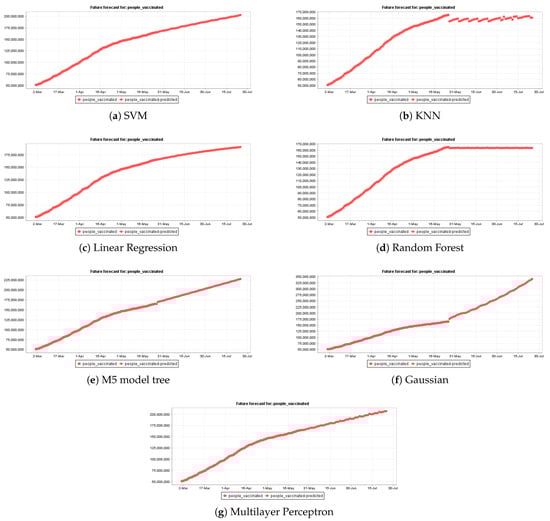
Figure 15.
COVID-19 vaccination prediction to forecast partially vaccinated population in the USA for different machine learning models with forecast time of 2 months.
Table 8.
Prediction accuracy and error for different machine learning models to forecast partially vaccinated population (at least one dose vaccine) in the USA.
For the 2-month prediction period, all models have DAC. Of all other methods, MLP has the lowest error and is considered as the best classifier for the 2-month forecasting. Thus, using MLP, we can predict that by 25 July 2021 around of the US adult population will get at least one dose of vaccine against COVID-19.
6. Conclusions
This is a study of COVID-19 vaccination in the aftermath of the 2020 COVID-19 outbreak with quantitative analysis. We analyze public sentiment on different COVID-19 vaccines from Twitter dataset. We find that the public sentiment is more positive than negative despite some side effects found in some of the vaccines. Although the majority of the tweets (60–70%) are deemed neutral, the remaining part consists of mostly positive tweets (20–25%). We also do an analysis of the public’s healthy lifestyle after vaccination. We find that people are conscious about maintaining social distancing with positive sentiments of where neutral sentiment was much less () compared to higher neutral sentiments in the remaining cases. People are also positive about maintaining hygiene with and positive and negative sentiments respectively. Although we observe that people are more reluctant to using masks and more prone to travel or do social gathering after vaccination, there is less difference between the positive and negative sentiments. However, it is a relief that the negative sentiments do not exceed the positive sentiments in any of the cases. We also show a time series forecast of the US population to be vaccinated for a time period of 2 months. Our vaccination forecast model predicts that around of the total population will get at least one dose vaccine and will be fully vaccinated by the end of July 2021. Our prediction model gives a similar estimate of having partial vaccination of the adults to be that the US Government is projecting to be on Independence Day (4 July 2021). The results of these analyses can be utilized to better comprehend Twitter users’ opinions about COVID-19 vaccination and their lifestyle after vaccination. The current discoveries give a steppingstone to measure the public’s conversation about COVID-19 vaccination and guidelines for a healthy way of life during the pandemic. This will help the public health authorities and policymakers to understand how individuals are endeavoring to adapt with their mental conditions during these extraordinary times and what services and resources should be made accessible to the public. This study will help health and government officials to better comprehend and plan vaccination campaigns. The constraints of this exploration are in the dataset size and time period during which it was collected. It would be interesting to have information from a longer time span to perceive how sentiments change over a longer time. especially when the pandemic comes to an end. Classifying tweets into different emotions, such as inspired, happy, annoyed, sad, angry, afraid, etc., to fully understand and reveal the sentiment of the tweets is also an interesting future direction.
Author Contributions
Conceptualization, N.S.S. and S.A.; methodology, N.S.S. and S.A.; software, N.S.S.; validation, N.S.S.; formal analysis, N.S.S.; investigation, N.S.S.; resources, N.S.S.; data curation, N.S.S.; writing—original draft preparation, N.S.S.; writing—review and editing, N.S.S. and S.A.; visualization, N.S.S.; supervision, S.A.; project administration, S.A.; funding acquisition, S.A. Both authors have read and agreed to the published version of the manuscript.
Funding
This work has been partially supported by Louisiana Board of Regents RCS Grant LEQSF (2017-20)-RDA-25.
Data Availability Statement
A part of data is made available according to Twitter policy in the publicly available code-base. Full data needs to be extracted from Twitter.
Acknowledgments
We thank the anonymous reviewers for the helpful comments and suggestions to improve this paper.
Conflicts of Interest
The authors declare no conflict of interest.
Abbreviations
The following abbreviations are used in this manuscript:
| ML | Machine Learning |
| CDC | Centers for Disease Control and Prevention |
| NLP | Natural Language Processing |
| NLTK | Natural Language Toolkit |
| VADER | Valence Aware Dictionary for Sentiment Reasoning |
| WEKA | Waikato Environment for Knowledge Analysis |
| SVM | Support Vector Machine |
| KNN | k-Nearest Neighbor |
| LR | Linear Regression |
| RF | Random Forest |
| MLP | Multilayer Perceptron |
Appendix A. Sentiment Analysis for Different Vaccines
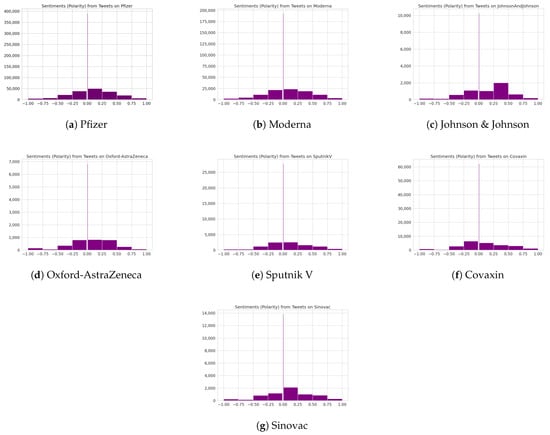
Figure A1.
Polarity Score of Sentiment for Different Vaccines.
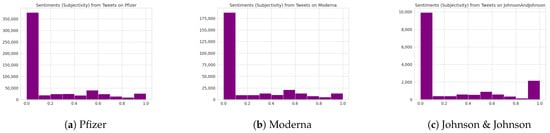
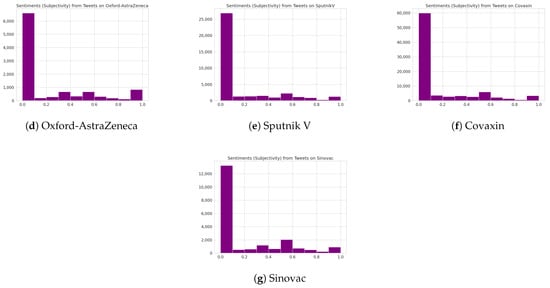
Figure A2.
Subjectivity Score of sentiment for different vaccines.
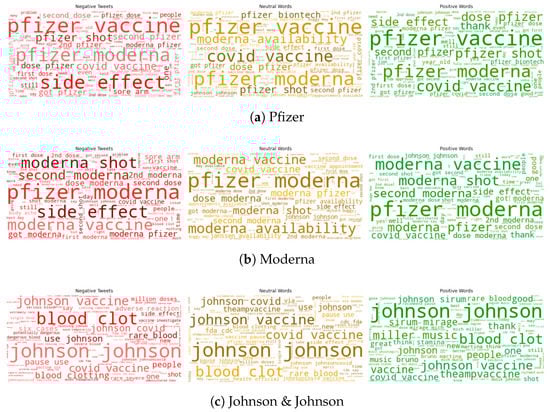
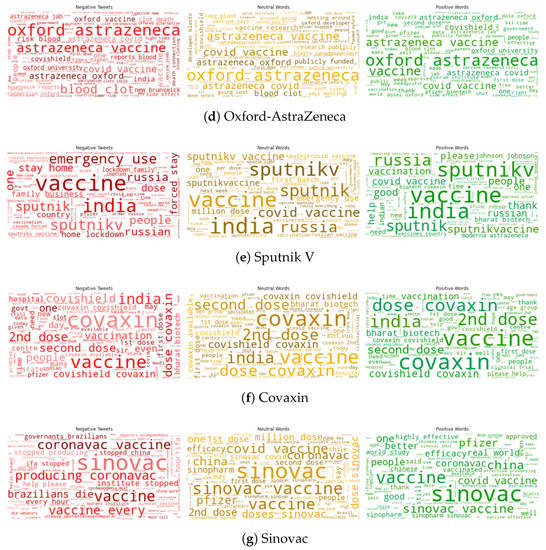
Figure A3.
Top frequency word distribution for different vaccines: word cloud generated using word frequencies.
Appendix B. Sentiment Analysis on Maintaining Healthy Lifestyle after Vaccination
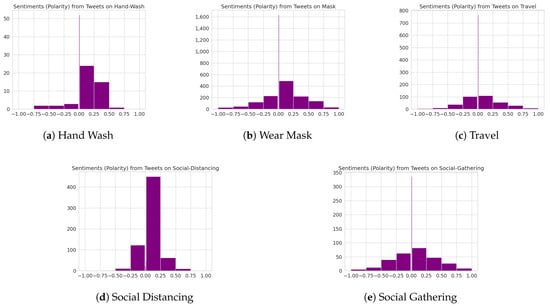
Figure A4.
Polarity score of public sentiment for Twitter Dataset 2 on health.
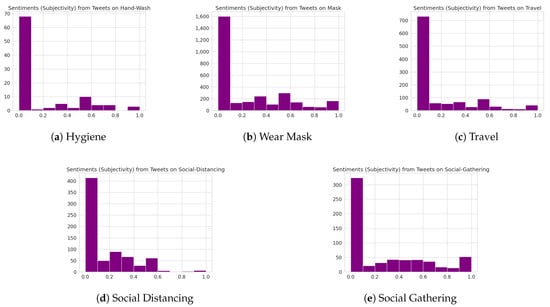
Figure A5.
Subjectivity score of public sentiment for Twitter Dataset 2 on health.
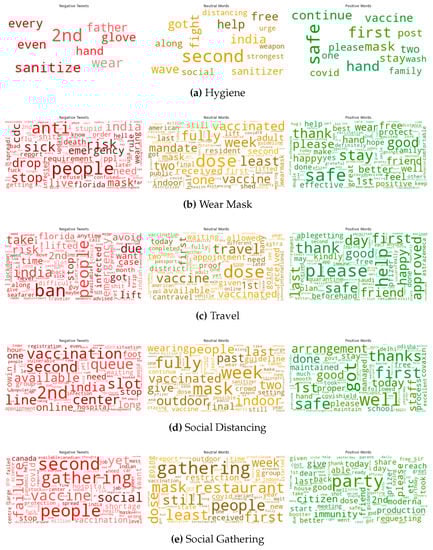
Figure A6.
Top frequency word distribution for Twitter Dataset 2 on health: word cloud generated using word frequencies.
Appendix C. COVID-19 Vaccination Forecast in the USA
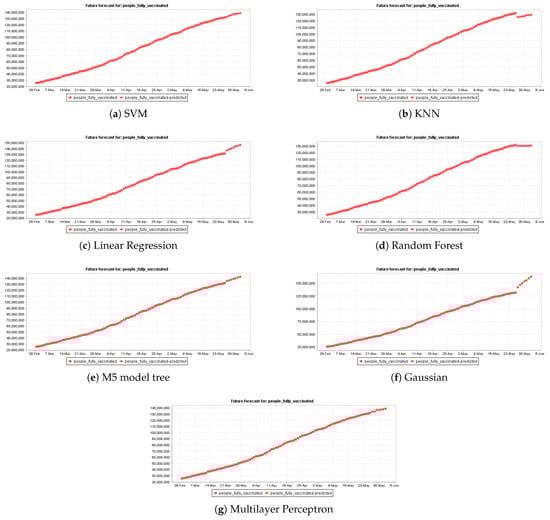
Figure A7.
COVID-19 vaccination prediction for different machine learning models with forecast time of 1 week.
References
- Medhat, W.; Hassan, A.; Korashy, H. Sentiment analysis algorithms and applications: A survey. Ain Shams Eng. J. 2014, 5, 1093–1113. [Google Scholar] [CrossRef] [Green Version]
- Patel, R.; Passi, K. Sentiment Analysis on Twitter Data of World Cup Soccer Tournament Using Machine Learning. IoT 2020, 1, 218–239. [Google Scholar] [CrossRef]
- Dandannavar, P.; Mangalwede, S.; Deshpande, S. Emoticons and their effects on sentiment analysis of Twitter data. In EAI International Conference on Big Data Innovation for Sustainable Cognitive Computing; Springer: Berlin/Heidelberg, Germany, 2020; pp. 191–201. [Google Scholar]
- Naseem, U.; Razzak, I.; Khushi, M.; Eklund, P.W.; Kim, J. COVIDSenti: A Large-Scale Benchmark Twitter Data Set for COVID-19 Sentiment Analysis. IEEE Trans. Comput. Soc. Syst. 2021. [Google Scholar] [CrossRef]
- Sattar, N.S.; Arifuzzaman, S.; Zibran, M.F.; Sakib, M.M. Detecting web spam in webgraphs with predictive model analysis. In Proceedings of the 2019 IEEE International Conference on Big Data (Big Data), Los Angeles, CA, USA, 9–12 December 2019; pp. 4299–4308. [Google Scholar]
- Facebook Reports Fourth Quarter and Full Year 2020 Results. Available online: https://investor.fb.com/investor-news/pressrelease-details/2021/Facebook-Reports-Fourth-Quarter\-and-Full-Year-2020-Results/default.aspx (accessed on 1 June 2021).
- Twitter Revenue and Usage Statistics (2021). Available online: https://www.businessofapps.com/data/twitter-statistics/ (accessed on 1 June 2021).
- Boldog, P.; Tekeli, T.; Vizi, Z.; Dénes, A.; Bartha, F.A.; Röst, G. Risk assessment of novel coronavirus COVID-19 outbreaks outside China. J. Clin. Med. 2020, 9, 571. [Google Scholar] [CrossRef] [PubMed] [Green Version]
- WHO Director-General’s Opening Remarks at the Media Briefing on COVID-19. 11 March 2020. Available online: https://www.who.int/director-general/speeches/detail/who-director-general-s-opening-remarks-at-the\-media-briefingon-covid-19---11-march-2020 (accessed on 1 June 2021).
- Roser, M.; Ritchie, H.; Ortiz-Ospina, E.; Hasell, J. Coronavirus pandemic (COVID-19). In Our World in Data; 2020; Available online: https://ourworldindata.org/coronavirus (accessed on 6 June 2021).
- Mathieu, E.; Ritchie, H.; Ortiz-Ospina, E.; Roser, M.; Hasell, J.; Appel, C.; Giattino, C.; Rodés-Guirao, L. A global database of COVID-19 vaccinations. Nat. Hum. Behav. 2021, 1–7. [Google Scholar]
- Glowacki, E.M.; Wilcox, G.B.; Glowacki, J.B. Identifying# addiction concerns on twitter during the COVID-19 pandemic: A text mining analysis. Subst. Abus. 2020, 42, 39–46. [Google Scholar]
- Sanders, A.C.; White, R.C.; Severson, L.S.; Ma, R.; McQueen, R.; Paulo, H.C.A.; Zhang, Y.; Erickson, J.S.; Bennett, K.P. Unmasking the conversation on masks: Natural language processing for topical sentiment analysis of COVID-19 Twitter discourse. medRxiv 2021. [Google Scholar] [CrossRef]
- Pano, T.; Kashef, R. A Complete VADER-Based Sentiment Analysis of Bitcoin (BTC) Tweets during the Era of COVID-19. Big Data Cogn. Comput. 2020, 4, 33. [Google Scholar] [CrossRef]
- Bhagat, K.K.; Mishra, S.; Dixit, A.; Chang, C.Y. Public Opinions about Online Learning during COVID-19: A Sentiment Analysis Approach. Sustainability 2021, 13, 3346. [Google Scholar] [CrossRef]
- Villavicencio, C.; Macrohon, J.J.; Inbaraj, X.A.; Jeng, J.H.; Hsieh, J.G. Twitter Sentiment Analysis towards COVID-19 Vaccines in the Philippines Using Naïve Bayes. Information 2021, 12, 204. [Google Scholar] [CrossRef]
- Chaudhri, A.A.; Saranya, S.; Dubey, S. Implementation Paper on Analyzing COVID-19 Vaccines on Twitter Dataset Using Tweepy and Text Blob. Ann. Rom. Soc. Cell Biol. 2021, 25, 8393–8396. [Google Scholar]
- Xue, J.; Chen, J.; Hu, R.; Chen, C.; Zheng, C.; Liu, X.; Zhu, T. Twitter discussions and emotions about covid-19 pandemic: A machine learning approach (2020). arXiv 2020, arXiv:2005.12830. [Google Scholar]
- Chen, T.; Dredze, M. Vaccine images on twitter: Analysis of what images are shared. J. Med. Internet Res. 2018, 20, e130. [Google Scholar] [CrossRef]
- Hyndman, R.J.; Khandakar, Y. Automatic time series forecasting: The forecast package for R. J. Stat. Softw. 2008, 27, 1–22. [Google Scholar] [CrossRef] [Green Version]
- Cao, L.J.; Tay, F.E.H. Support vector machine with adaptive parameters in financial time series forecasting. IEEE Trans. Neural Netw. 2003, 14, 1506–1518. [Google Scholar] [CrossRef] [Green Version]
- Rafiuzaman, M. Forecasting chaotic stock market data using time series data mining. Int. J. Comput. Appl. 2014, 101, 27–34. [Google Scholar] [CrossRef]
- Ray, E.L.; Wattanachit, N.; Niemi, J.; Kanji, A.H.; House, K.; Cramer, E.Y.; Bracher, J.; Zheng, A.; Yamana, T.K.; Xiong, X.; et al. Ensemble Forecasts of Coronavirus Disease 2019 (COVID-19) in the us. MedRXiv 2020. [Google Scholar] [CrossRef]
- Liapis, C.M.; Karanikola, A.; Kotsiantis, S. An ensemble forecasting method using univariate time series COVID-19 data. In Proceedings of the 24th Pan-Hellenic Conference on Informatics, Athens, Greece, 20–22 November 2020; pp. 50–52. [Google Scholar]
- Krollner, B.; Vanstone, B.J.; Finnie, G.R. Financial time series forecasting with machine learning techniques: A survey. In Proceedings of the ESANN, Bruges, Belgium, 28–30 April 2010. [Google Scholar]
- Zhang, N.; Lin, A.; Shang, P. Multidimensional k-nearest neighbor model based on EEMD for financial time series forecasting. Phys. A Stat. Mech. Appl. 2017, 477, 161–173. [Google Scholar] [CrossRef]
- Bandara, K.; Shi, P.; Bergmeir, C.; Hewamalage, H.; Tran, Q.; Seaman, B. Sales demand forecast in e-commerce using a long short-term memory neural network methodology. In Proceedings of the International Conference on Neural Information Processing, Sydney, NSW, Australia, 12–15 December 2019; Springer: Berlin/Heidelberg, Germany, 2019; pp. 462–474. [Google Scholar]
- Pavlyshenko, B.M. Machine-learning models for sales time series forecasting. Data 2019, 4, 15. [Google Scholar] [CrossRef] [Green Version]
- Papacharalampous, G.; Tyralis, H.; Koutsoyiannis, D. Univariate time series forecasting of temperature and precipitation with a focus on machine learning algorithms: A multiple-case study from Greece. Water Resour. Manag. 2018, 32, 5207–5239. [Google Scholar] [CrossRef]
- Medar, R.; Angadi, A.B.; Niranjan, P.Y.; Tamase, P. Comparative study of different weather forecasting models. In Proceedings of the 2017 International Conference on Energy, Communication, Data Analytics and Soft Computing (ICECDS), Chennai, India, 1–2 August 2017; pp. 1604–1609. [Google Scholar]
- Gonzalez-Vidal, A.; Jimenez, F.; Gomez-Skarmeta, A.F. A methodology for energy multivariate time series forecasting in smart buildings based on feature selection. Energy Build. 2019, 196, 71–82. [Google Scholar] [CrossRef]
- Mary, M.A.P. Classifying Future Scope in Energy Resources and Predicting Power Demand using Multilayer Perceptron. Turk. J. Comput. Math. Educ. (TURCOMAT) 2021, 12, 2332–2339. [Google Scholar]
- Usha, T.; Balamurugan, S.A.A. Seasonal based electricity demand forecasting using time series analysis. Circuits Syst. 2016, 7, 3320–3328. [Google Scholar] [CrossRef] [Green Version]
- Humeau, S.; Wijaya, T.K.; Vasirani, M.; Aberer, K. Electricity load forecasting for residential customers: Exploiting aggregation and correlation between households. In Proceedings of the 2013 Sustainable Internet and ICT for Sustainability (SustainIT), Palermo, Italy, 30–31 October 2013; pp. 1–6. [Google Scholar]
- Loria, S. textblob Documentation. Release 0.16. 26 April 2020. Available online: https://buildmedia.readthedocs.org/media/pdf/textblob/latest/textblob.pdf (accessed on 1 June 2021).
- Hutto, C.; Gilbert, E. Vader: A parsimonious rule-based model for sentiment analysis of social media text. In Proceedings of the International AAAI Conference on Web and Social Media, Ann Arbor, MI, USA, 1–4 June 2014; Volume 8. [Google Scholar]
- Time Series Analysis and Forecasting with Weka—Pentaho Data Mining. Available online: https://wiki.pentaho.com/display/DATAMINING/Time+Series+Analysis+and+Forecasting+with+Weka#TimeSeriesAnalysisandForecastingwithWeka-3.1BasicConfiguration (accessed on 1 June 2021).
- Sattar, N.S.; Arifuzzaman, S. Community Detection using Semi-supervised Learning with Graph Convolutional Network on GPUs. In Proceedings of the 2020 IEEE International Conference on Big Data (Big Data), Atlanta, GA, USA, 10–13 December 2020; pp. 5237–5246. [Google Scholar]
- Sattar, N.S.; Anfuzzaman, S. Data Parallel Large Sparse Deep Neural Network on GPU. In Proceedings of the 2020 IEEE International Parallel and Distributed Processing Symposium Workshops (IPDPSW), New Orleans, LA, USA, 18–22 May 2020; pp. 1–9. [Google Scholar]
- Zheng, H. Time Series Forecasting of China Stock Market Using Weka—Part 1. Introduction. 2017. Available online: https://medium.com/@kiaorahao/time-series-forecasting-of-china-stock-market-using-weka-part-1-introduction-71b68aed6d18 (accessed on 1 June 2021).
- Pesaran, M.H.; Timmermann, A. How costly is it to ignore breaks when forecasting the direction of a time series? Int. J. Forecast. 2004, 20, 411–425. [Google Scholar] [CrossRef] [Green Version]
- Armstrong, J.S.; Collopy, F. Error measures for generalizing about forecasting methods: Empirical comparisons. Int. J. Forecast. 1992, 8, 69–80. [Google Scholar] [CrossRef] [Green Version]
- Chen, C.; Twycross, J.; Garibaldi, J.M. A new accuracy measure based on bounded relative error for time series forecasting. PLoS ONE 2017, 12, e0174202. [Google Scholar] [CrossRef] [Green Version]
- Smola, A.J.; Schölkopf, B. A tutorial on support vector regression. Stat. Comput. 2004, 14, 199–222. [Google Scholar] [CrossRef] [Green Version]
- Maltamo, M.; Kangas, A. Methods based on k-nearest neighbor regression in the prediction of basal area diameter distribution. Can. J. For. Res. 1998, 28, 1107–1115. [Google Scholar] [CrossRef]
- Seal, H.L. Studies in the History of Probability and Statistics. XV The historical development of the Gauss linear model. Biometrika 1967, 54, 1–24. [Google Scholar] [PubMed]
- Breiman, L. Random forests. Mach. Learn. 2001, 45, 5–32. [Google Scholar] [CrossRef] [Green Version]
- Kisi, O.; Shiri, J.; Demir, V. Hydrological time series forecasting using three different heuristic regression techniques. In Handbook of Neural Computation; Elsevier: Amsterdam, The Netherlands, 2017; pp. 45–65. [Google Scholar]
- Roberts, S.; Osborne, M.; Ebden, M.; Reece, S.; Gibson, N.; Aigrain, S. Gaussian processes for time-series modelling. Philos. Trans. R. Soc. A 2013, 371, 20110550. [Google Scholar] [CrossRef] [PubMed]
- Available online: https://www.tweepy.org/ (accessed on 1 June 2021).
- Loper, E.; Bird, S. Nltk: The natural language toolkit. arXiv 2002, arXiv:cs/0205028. [Google Scholar]
- Frank, E.; Hall, M.; Holmes, G.; Kirkby, R.; Pfahringer, B.; Witten, I.H.; Trigg, L. Weka-a machine learning workbench for data mining. In Data Mining and Knowledge Discovery Handbook; Springer: Berlin/Heidelberg, Germany, 2009; pp. 1269–1277. [Google Scholar]
- What’s New with Twitter API v2 | Docs | Twitter Developer Platform. Available online: https://developer.twitter.com/en/docs/twitter-api/early-access (accessed on 1 June 2021).
- Wang, Y.; Callan, J.; Zheng, B. Should we use the sample? Analyzing datasets sampled from Twitter’s stream API. ACM Trans. Web (TWEB) 2015, 9, 1–23. [Google Scholar] [CrossRef]
- Developer Agreement and Policy—Twitter Developers|Twitter Developer Platform. Available online: https://developer.twitter.com/en/developer-terms/agreement-and-policy (accessed on 6 June 2021).
- Stopwords-Iso. stopwords-iso/stopwords-en. 2016. Available online: https://github.com/stopwords-iso/stopwords-en/blob\/master/stopwords-en.txt (accessed on 6 June 2021).
- Stopwords-Iso. stopwords-iso/stopwords-iso. 2020. Available online: https://github.com/stopwords-iso/stopwords-iso/blob/master/CREDITS.md (accessed on 6 June 2021).
- Comparing Word Form Counts. Available online: https://wordhoard.northwestern.edu/userman/analysis-comparewords.html#loglike (accessed on 6 June 2021).
- Clement, T.; Plaisant, C.; Vuillemot, R. The Story of One: Humanity scholarship with visualization and text analysis. Relation 2009, 10, 8485. [Google Scholar]
- Dunning, T.E. Accurate methods for the statistics of surprise and coincidence. Comput. Linguist. 1993, 19, 61–74. [Google Scholar]
- Rayson, P.; Garside, R. Comparing corpora using frequency profiling. In Proceedings of the Workshop on Comparing Corpora; Association for Computational Linguistics: Stroudsburg, PA, USA, 2000; pp. 1–6. [Google Scholar]
- Kumar, M.; Thenmozhi, M. Forecasting stock index movement: A comparison of support vector machines and random forest. In Proceedings of the Indian Institute of Capital Markets 9th Capital Markets Conference Paper; 2006; Available online: https://papers.ssrn.com/sol3/papers.cfm?abstract_id=876544# (accessed on 6 June 2021).
- Huang, W.; Nakamori, Y.; Wang, S.Y. Forecasting stock market movement direction with support vector machine. Comput. Oper. Res. 2005, 32, 2513–2522. [Google Scholar] [CrossRef]
- Kim, K.j. Financial time series forecasting using support vector machines. Neurocomputing 2003, 55, 307–319. [Google Scholar] [CrossRef]
- Owid. Owid/Covid-19-Data. Available online: https://github.com/owid/covid-19-data/blob/master/public/data/owidcovid-codebook.csv (accessed on 18 June 2021).
- Solis-Moreira, J. Study Confirms Rare Blood Clotting Risk Linked to ChAdOx1-S Vaccine—Benefits Still Outweigh Risks. 2021. Available online: https://www.news-medical.net/news/20210512/Study-confirms-rare-blood-clotting-risk-linked-to-ChAdOx1-S-vaccine-benefits-still-outweigh-risks.aspx (accessed on 1 June 2021).
- United States Population 2021 (Live). Available online: https://worldpopulationreview.com/countries/united-states-population (accessed on 1 June 2021).
- Lovelace, B., Jr.; Breuninger, K. Biden’s New Covid Vaccination Goal Is for 70 of Adults to Have at Least One Shot by July 4. 2021. Available online: https://www.cnbc.com/2021/05/04/covid-vaccines-biden-wants-70percent-with-at-least-1-shot-by-july-4.html (accessed on 1 June 2021).
Publisher’s Note: MDPI stays neutral with regard to jurisdictional claims in published maps and institutional affiliations. |
© 2021 by the authors. Licensee MDPI, Basel, Switzerland. This article is an open access article distributed under the terms and conditions of the Creative Commons Attribution (CC BY) license (https://creativecommons.org/licenses/by/4.0/).