Abstract
Steam methane reforming (SMR) process is regarded as a viable option to satisfy the growing demand for hydrogen, mainly because of its capability for the mass production of hydrogen and the maturity of the technology. In this study, an economically optimal process configuration of SMR is proposed by investigating six scenarios with different design and operating conditions, including CO2 emission permits and CO2 capture and sale. Of the six scenarios, the process configuration involving CO2 capture and sale is the most economical, with an H2 production cost of $1.80/kg-H2. A wide range of economic analyses is performed to identify the tradeoffs and cost drivers of the SMR process in the economically optimal scenario. Depending on the CO2 selling price and the CO2 capture cost, the economic feasibility of the SMR-based H2 production process can be further improved.
1. Introduction
Energy demand has steadily increased with the growing global economy [1]. Currently, energy generation systems rely heavily on fossil fuels, which lead to global warming, mainly due to the accumulation of CO2 in the atmosphere [2]. Net emissions of CO2 by human activities must approach zero to stabilize global mean temperature [3]. Carbon capture and utilization (CCU) and carbon capture and fixation (CCF) are promising approaches for reducing emissions of greenhouse gases (GHGs) and depletion of fossil resources, especially in the chemical industry [4]. For a more fundamental approach, however, it is necessary to develop new energy resources as alternatives to conventional fossil fuels and the corresponding energy generation systems [5]. A range of studies have been conducted to address this problem, including production of biofuels from fructose [6], production of drop-in fuels from biomass [7], analysis of energy systems utilizing various renewable resources [8], analysis of potential emissions of GHG from proven reserves of fossil fuels [9]. Especially, hydrogen has received substantial attention as a feasible energy carrier to deliver or store a tremendous amount of energy because of its clean properties [10]. In particular, the potential of hydrogen as an energy carrier for hydrogen refueling stations [11] and hydrogen fuel cell vehicles [12] has been reported.
Hydrogen can be produced by various methods, such as coal and biomass gasification, water electrolysis, and steam methane reforming (SMR) [13]. Coal and biomass gasification requires high operating temperatures, thereby resulting in high energy demands to produce small amounts of hydrogen [14]. Water electrolysis uses electricity generated from renewable resources such as wind and solar energy to produce hydrogen [15]. This method has environmental advantages, but because of its high capital cost for construction, it leads to high hydrogen production costs and has limited capacity compared to that of industrial hydrogen production [16]. Given the maturity of the technology and the capability of mass production, SMR is seen as a viable option for hydrogen production in the near future.
As shown in Figure 1, the SMR process consists of steam reforming, WGS reaction, and hydrogen purification, and is involved in a series of stages comprising natural gas resource use, hydrogen consumption in industry and fuel cells, and CCU. Hydrogen can potentially be used in a wide range of applications—transportation, industrial, residential, and portable, however, only a fuel cell electric vehicle is shown in Figure 1 as an example for simplicity.
Figure 1.
Schematic of industrial hydrogen production using steam methane reforming.
Many studies have been reported on SMR, but most of these studies have focused on an individual SMR reactor design [17], a specific SMR reaction [18], a specific water–gas shift (WGS) reaction [19], and the development of a new catalyst to improve the reaction yield [20]. However, in addition to the concerns of individual reactors, enhancing the efficiency and economics of the entire SMR system from a process perspective is important for engineering companies to secure competitiveness. In the hydrogen production process, operating conditions including the pressure of the reformer and the temperature of the WGS reactor are adjustable and design conditions including the number of WGS reactors can also be selected to improve process economics. Additionally, SMR is inevitably accompanied by CO2 emissions, which need to be isolated to satisfy environmental regulations [21], e.g., using a moving bed adsorption process [22]. The integration of carbon capture and SMR generally increases the cost of hydrogen production. Therefore, carbon capture is worth considering in the design of the entire SMR process because it affects the economics of the process [23].
No research has been conducted yet to investigate the economic feasibility of overall hydrogen production using SMR under a variety of operating and design conditions, including carbon emission allowances and carbon capture and sales. The purpose of this study is therefore to propose an optimal process configuration for an SMR-based hydrogen production system from an economic point of view, considering these conditions. We construct six scenarios according to different design and operating conditions and find which one is the most economically feasible through comparison. For the optimal scenario, a wide range of techno-economic analyses is performed to investigate the impact of key process and economic parameters on process economics.
2. Methods
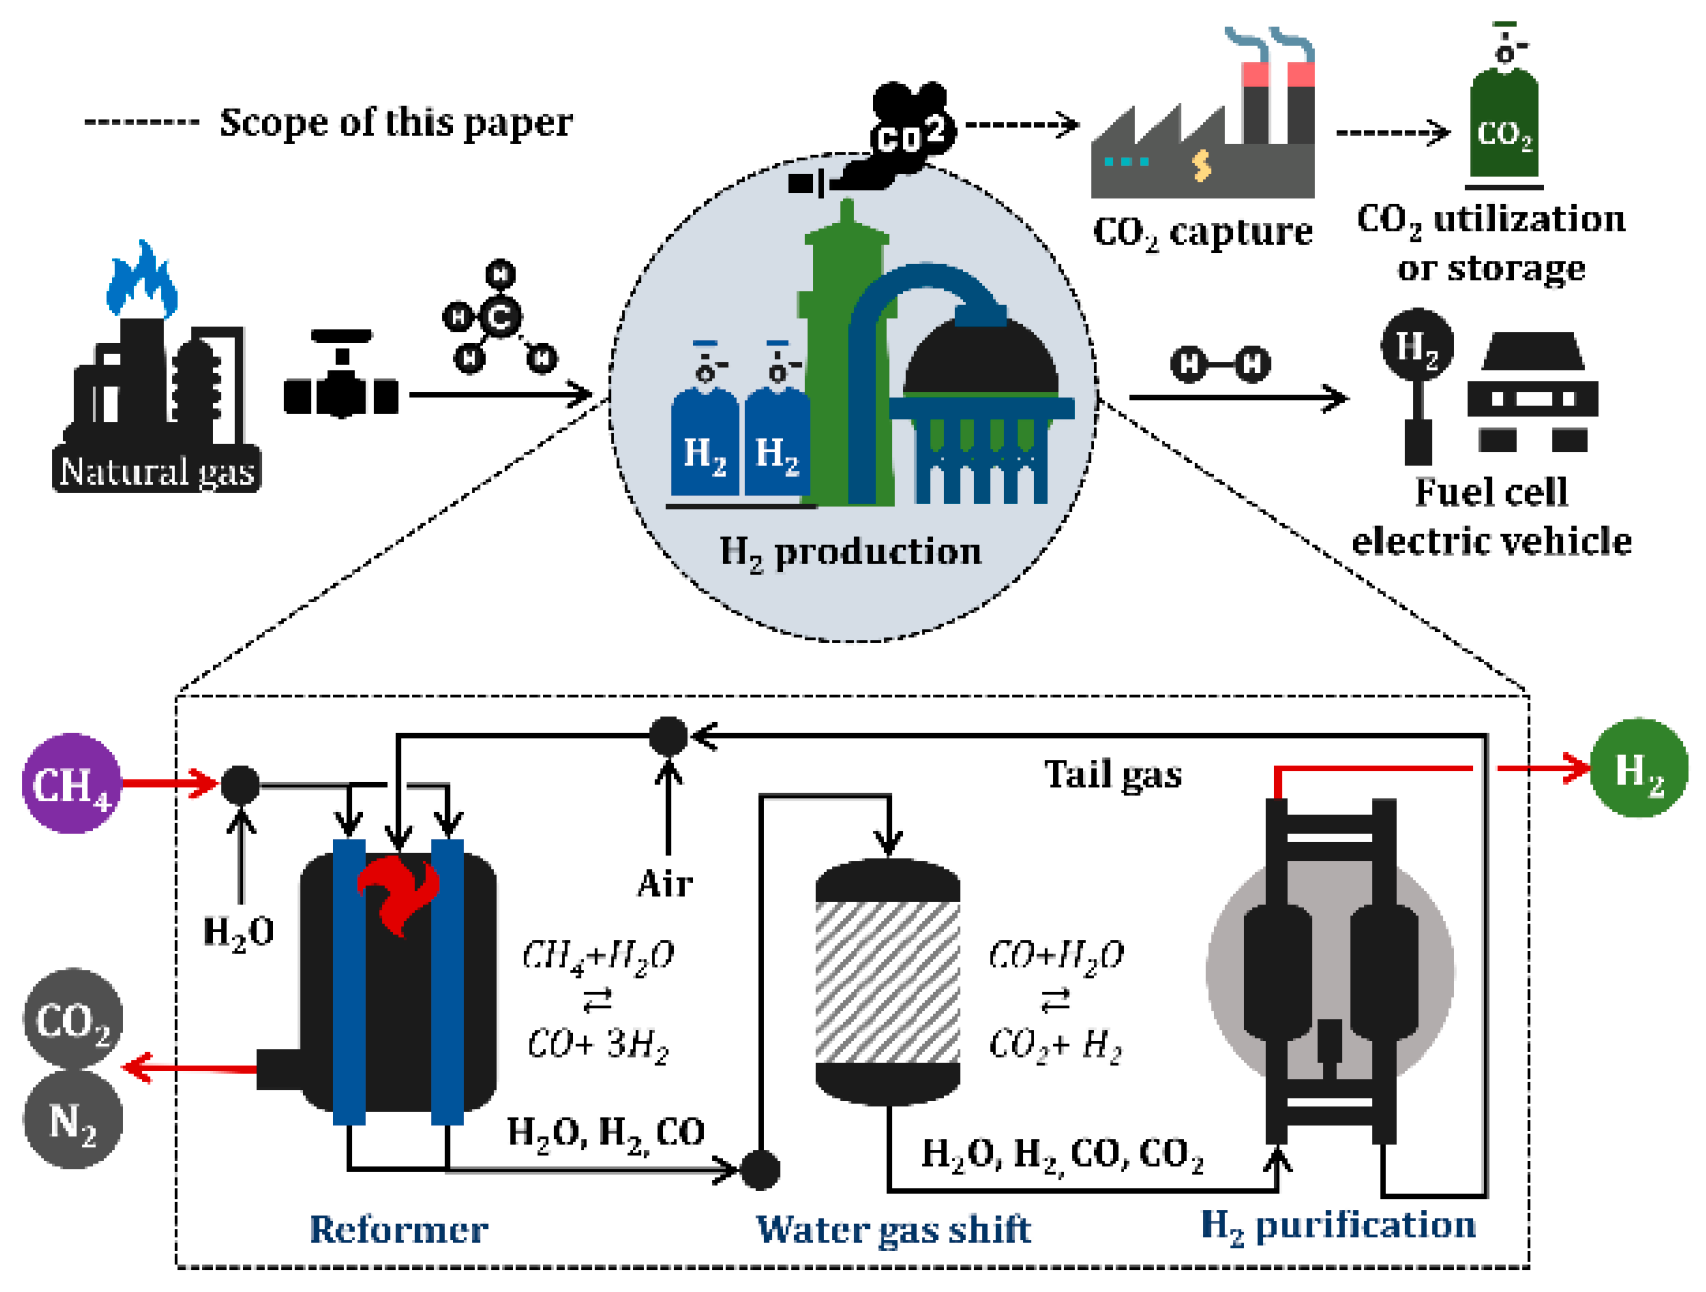
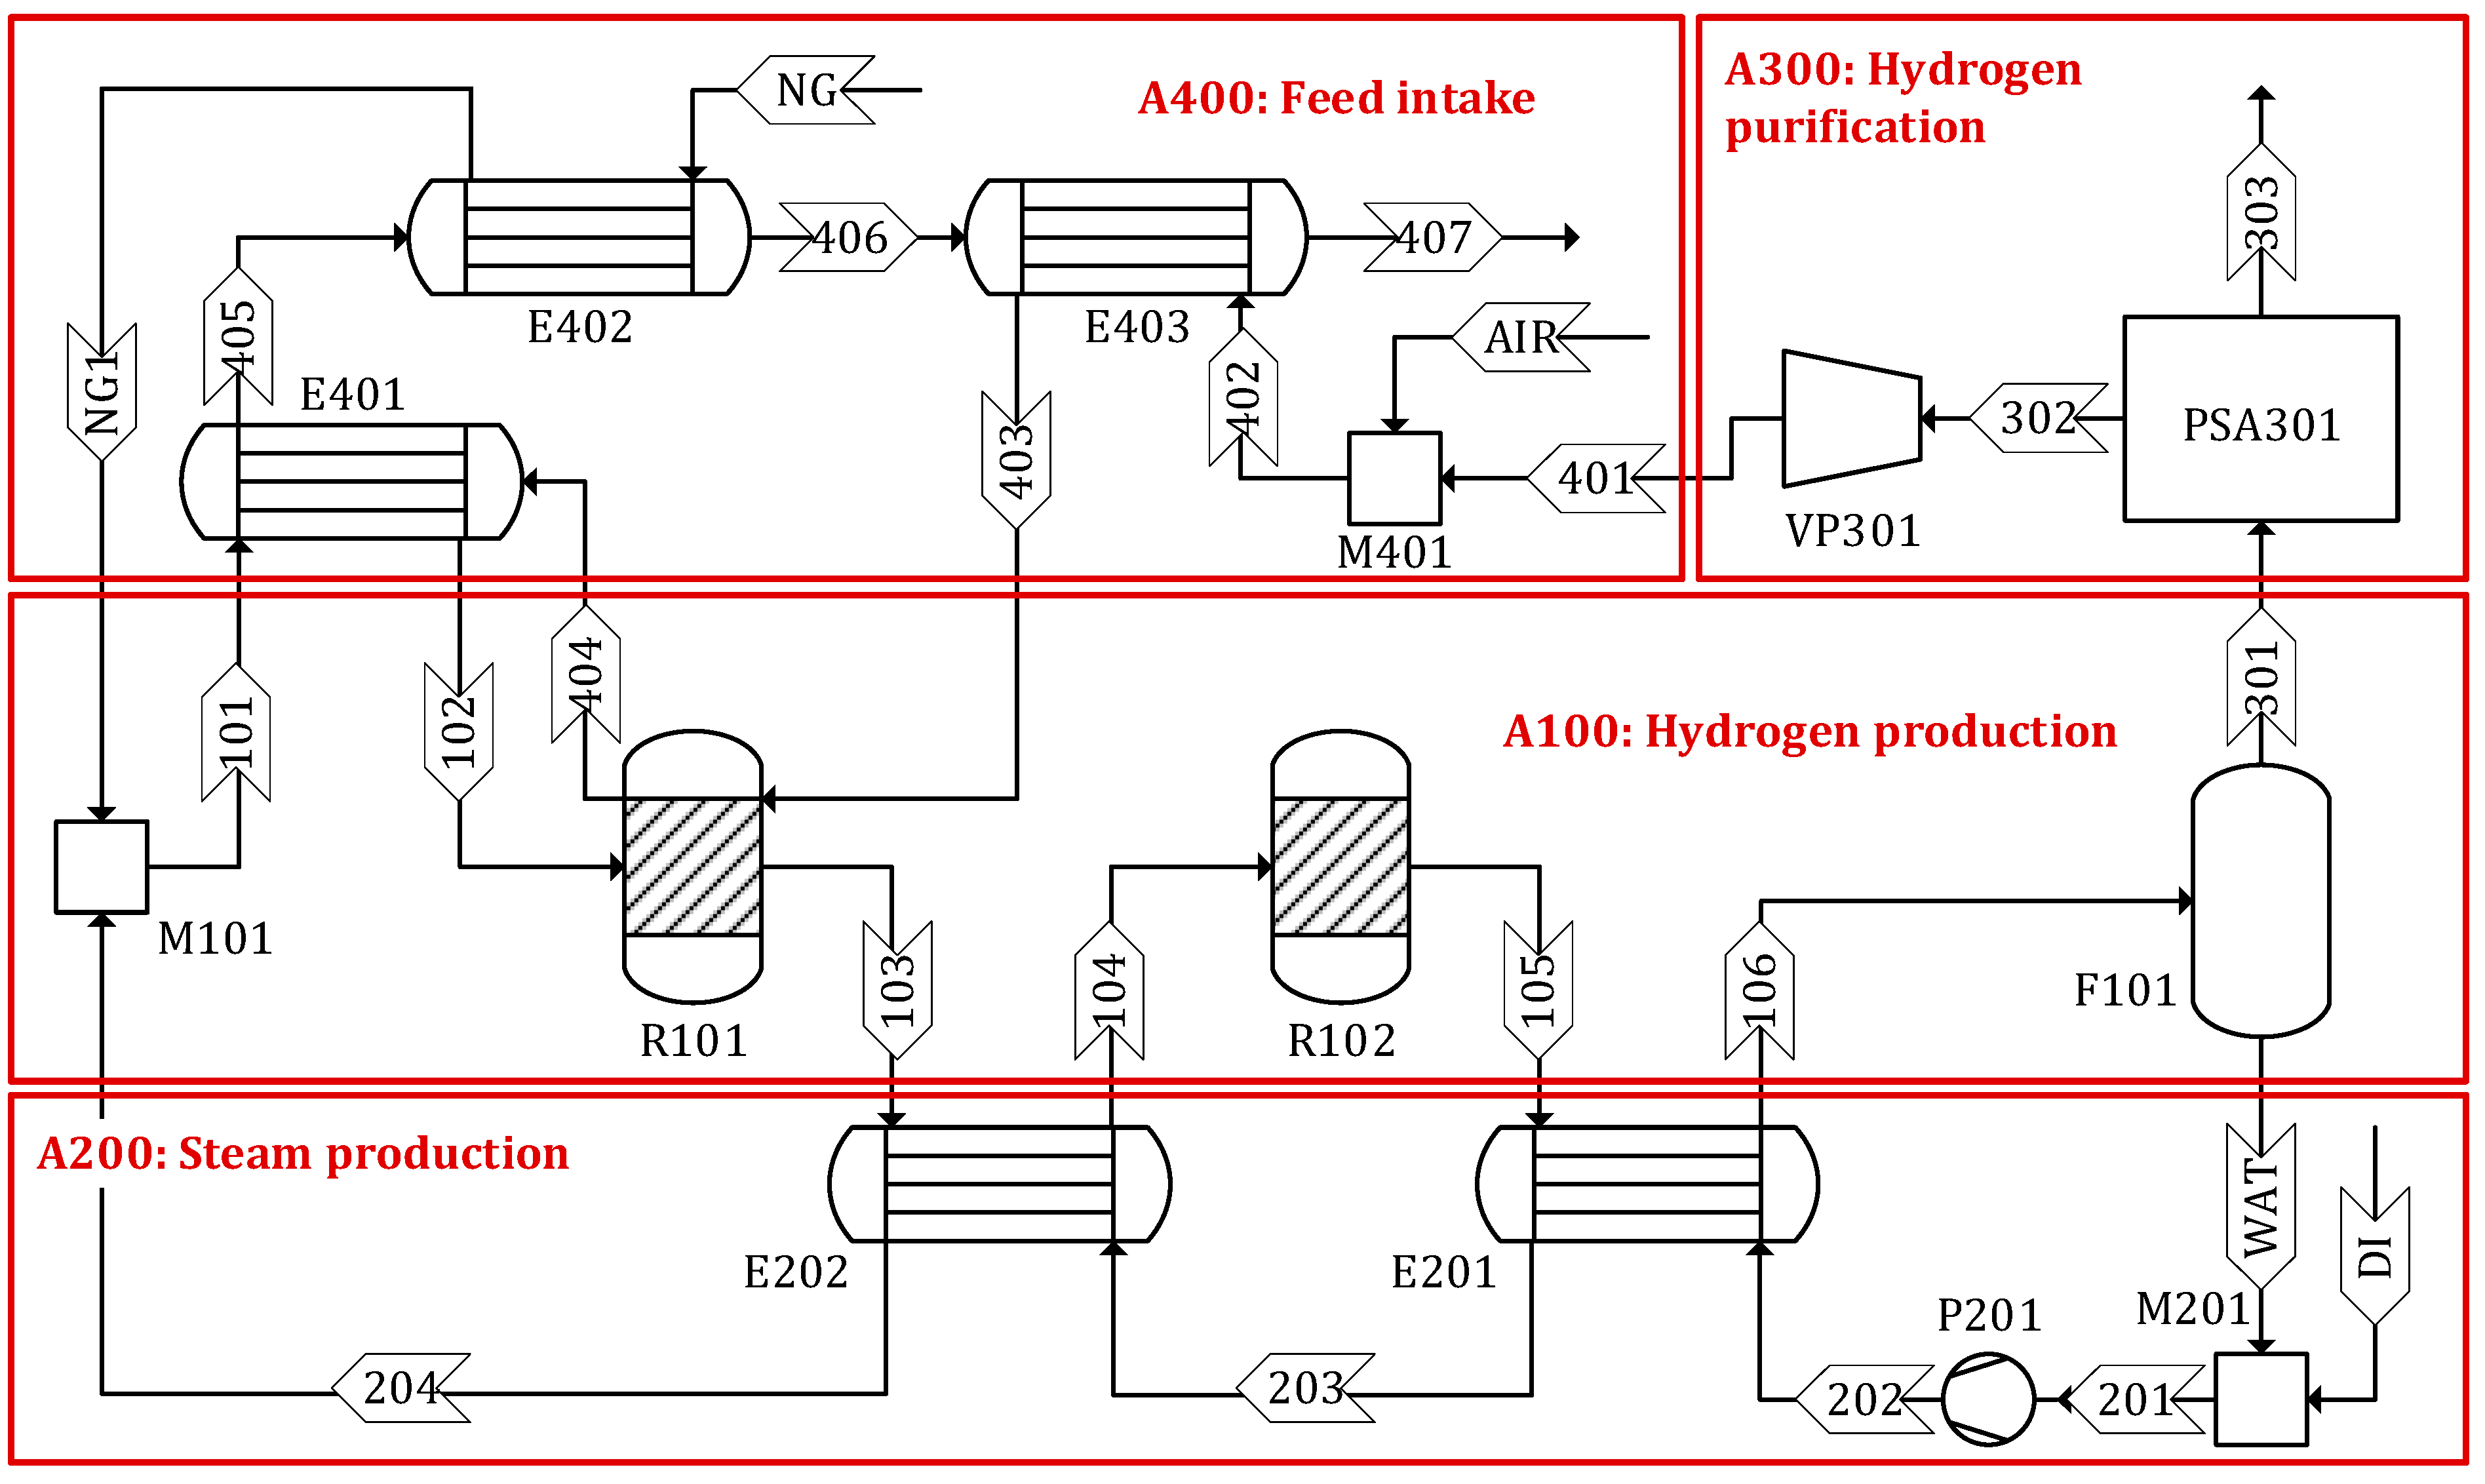
2.1. Process Description
An SMR process model was developed using a commercial simulator, Aspen Plus, based on the experimental data obtained from the literature. Figure 2 shows the detailed process flow diagram of the SMR process developed in this study (see Figures S1–S3 in the Supplementary Materials for the process flow diagrams for Sc 2–4, respectively). The process consists of four areas: (1) hydrogen production, (2) steam production, (3) hydrogen purification, and (4) feed intake. A detailed description of each process area is given below.
Figure 2.
Process flow diagram of steam methane reforming.
Area 100 Hydrogen production: The flow rate of CH4 is adjusted to produce H2 at 500 kg/d. Steam (stream 204) and CH4 (stream NG1) are combined and supplied to the steam methane reformer (R101) where CO and H2 are produced through a highly endothermic reaction, in the presence of a nickel-based catalyst (Ru–Ni/Al2O3) [24]. The steam to CH4 molar ratio is maintained at 3 to prevent coke deposition on the surface of the catalyst [25]. The heating requirement of the reformer is satisfied by the heat released from the combustion of the tail gas. The effluent from the reformer (stream 104) is then routed to the WGS reactor (R102) where CO and steam are converted to additional H2 and a coproduct of CO2. The WSG reaction occurs over a copper-promoted iron–chromium oxide catalyst (Cu/Fe3O4–Cr2O3) to increase the amount of H2 while decreasing the CO content [24]. In the flash (F101), the water is separated as the bottom product (stream WAT) and the gaseous mixture (stream 301) is discharged from the top and sent to the hydrogen purification area for further treatment.
Area 200 Steam production: Steam is produced from deionized water using two heat exchangers, E201 and E202. Approximately 46% of the demineralized water is supplied from recycled water (stream WAT) separated from the flash drum (F101) and the remaining 54% is replenished from external sources (stream DI). The steam produced in this area is used in reactors R101 and R102.
Area 300 Hydrogen purification: The gaseous product of F101 is a mixture of H2, H2O, CO2, CO, and CH4. To meet the specification of H2 as the final product, the mixture is purified using a pressure swing adsorption (PSA) process, as is often used in industrial practice [26,27,28,29]. H2 (stream 303) is produced with 99.99% purity and 75% recovery. The tail gas (stream 302) separated from the PSA process (PSA301) is sent to the feed intake area and used for heat generation [30].
Area 400 Feed intake: This area includes three heat exchangers (E402, E403, and E404) to preheat CH4, steam, and tail gas (streams NG, 101, and 402, respectively) using the heat released from the flue gas (stream 404). The preheated streams 102 and 403 are then sent to the reformer (R101).
See Tables S1–S4 in the Supplementary Materials for detailed process stream information for Sc 1–4, respectively. Table 1 summarizes the main design and operating conditions used in the four process areas of the proposed SMR process.
Table 1.
Design and operating conditions in each process area of the developed process.
2.2. Scenario Development
To investigate the effect of process design and operating conditions on process economics, we developed six scenarios as shown in Table 2. We consider five different conditions, namely reformer pressure, number of WGS reactors, WGS reactor temperature, CO2 emission allowances, and CO2 capture and sales.
Table 2.
Six scenarios of steam methane reforming process with different design and operating conditions.
In Sc 2, the temperature of the WGS reactor is 250 °C. The higher temperature of the WGS reactor increases the productivity of H2 but increases utility requirements at the same time, leading to an increase in operating costs.
In industrial SMR processes, two WGS reactors operating at different temperatures are usually introduced to increase the CO-to-H2 conversion rate. However, the additional reactor leads to an increase in capital cost. To investigate this effect, Sc 3 with two WGS reactors is considered.
In this study, reformer pressures of 100 kPa and 800 kPa are considered. As the reformer pressure decreases, the conversion rate of CH4 to H2 increases, while the amount of fuel gas required for the reformer increases because of the decrease in the amount of unreacted CH4, thus leading to a decrease in the energy content of the tail gas. Moreover, when the reformer pressure is 100 kPa (Sc 4), an additional compression step is required between the reformer and the PSA process.
The CO2 emission allowances is a cost to be paid and thus has a negative effect on the economics of the process. It is assumed that CO2 is released into the atmosphere without any restrictions when the CO2 emission allowances are not considered. In Sc 5, the CO2 emission allowances apply to 100% of the CO2 generated from the combustion of the tail gas.
Sc 6 involves the capture and the sale of CO2 as a byproduct. 90% of the CO2 produced from the combustion of the tail gas is captured and 10% of the remaining CO2 is applied to the CO2 emission allowances. There is a large global market for CO2 and the demand for CO2 continues to grow in various industrial sectors including refrigeration, food & beverages, oil & gas, pharmaceuticals, rubber, and firefighting [35]. CO2 can also be used in CCU [36] and CCF [37] technologies in cleaner ways. If SMR is combined with CCF, the system is clean because no CO2 is released into the atmosphere. Detailed analysis on the use of CO2 in CCU and CCF appeared to be beyond the scope of this work, therefore we left it for later analysis.
2.3. Economic Evaluation
Table 3 lists the economic parameters and assumptions used in this study. All equipment and material costs were adjusted to the common base year of 2015 using the Plant Cost Index [38]. Equipment costs were estimated using a scaling expression based on the equipment size and cost data provided in the National Renewable Energy Laboratory (NREL) report [39].
Table 3.
Major economic parameters and assumptions.
Total capital investment (TCI) is calculated as the sum of fixed capital investment, working capital, and land. The fixed capital investment consists of direct costs (the total installed equipment costs, warehouse, site development, and additional piping) and indirect costs (project contingency, construction fees, and field expenses) [40]. Total operating costs are calculated as the sum of variable operating costs including raw materials and fixed operating costs including labor, maintenance, and property insurance [40]. The labor cost including overhead was scaled based on the H2A model developed by NREL [39] while other overhead costs, namely maintenance and property insurance, were calculated based on the capital cost.
Calculations are performed using facilities of the Core Facility Center for Analysis of Optoelectronic Materials and Devices of the Korea Basic Science Institute (KBSI).
2.4. Sensitivity and Uncertainty Analysis
We conduct a single-point sensitivity analysis to identify the key economic and process parameters that most affect the H2 production cost. A total of nine parameters are investigated, including feedstock price, CO2 capture cost, and internal rate of return (IRR). Each parameter is varied by ±20% from their original values while the remaining parameters are maintained constant.
We can only identify the influence of a single parameter on process economics in sensitivity analysis, not the overall effect. Therefore, based on the three influential parameters (feedstock price, CO2 capture cost, and IRR) identified in the sensitivity analysis, uncertainty analysis is performed to quantify the risks and uncertainty associated with the proposed process under unpredictable circumstances, using the Monte-Carlo simulation method. We assume that the selected parameters follow a triangular distribution with equal variation ranges. Two economic parameters, feedstock cost and CO2 capture cost, are changed from ±10% to ±50% with a fixed IRR of 10%. Also, the IRR varies from 10% to 20% while the two economic parameters change by ±20%.
3. Results and Discussion
3.1. Capital and Operating Costs
Table 4 shows the capital and operating costs of the six scenarios (see Tables S5–S8 in the Supplementary Materials for the equipment costs calculated in Sc 1–4, respectively). The TCI and total operating cost in Sc 1 are the lowest of all scenarios, at $902,183 and $181,063/y, respectively (the TCI in Sc 1, 5, and 6 are calculated equally). This is due to the low overall conversion from natural gas to hydrogen, which decreases the capital costs of the hydrogen production and hydrogen purification process areas and the operating costs owing to the reduced consumption of deionized water. The low temperature of the WGS reaction causes a high equilibrium value, thus increasing the amount of H2 produced from CO. Therefore, the low temperature (250 °C) of the WGS reaction in Sc 2 leads to a larger reactor and a higher catalyst consumption, which in turn increases the TCI and total operating cost by 4.8% and 0.92%, respectively, compared to Sc 1. In Sc 3, two WGS reactors are employed, each operating at high (450 °C) and low (250 °C) temperatures. The TCI and total operating cost in Sc 3 increase by 19% and 1.5%, respectively, above those in Sc 1 because of the additional WGS reactor. The TCI and total operating costs of Sc 4 are 35% and 16% higher than those of Sc 1, respectively, owing to the installation of the additional compressor. In particular, the consumption of electricity and deionized water is significantly increased owing to the low vapor pressure of the additional compressor. Sc 5 and 6 consider CO2 emissions and CO2 capture, increasing the total operating costs.
Table 4.
Capital and operating costs in six scenarios.
In the six scenarios, the hydrogen production area accounts for the largest proportion of the TCI: 34.1%, 34.6%, 36.7%, and 23.6% in Sc 1, 2, 3, and 4, respectively. This is because multiple reactors are used, including the reformer and the WGS reactor, which accounts for 67.4% of the total installed equipment cost in Sc 1. The next largest contributor is the hydrogen purification area, owing to the high cost of the PSA unit. As for the operating cost, the feedstock cost is the most dominant cost contributor in the six scenarios, accounting for 67.4%, 66.7%, 65.6%, and 56.7% of the total operating cost in Sc 1, 2, 3, and 4, respectively.
From the capital and operating costs, it is observed that the SMR process is economically beneficial when the reformer pressure is 800 kPa and the temperature of the WGS reaction is 450 °C with one reactor. In the next section, we consider the costs associated with the emissions, capture, and sale of CO2 and investigate which scenario is the most economical.
3.2. Hydrogen Production Cost
Figure 3 shows the costs and revenues of the six scenarios. The H2 production cost, defined as the price of production at the breakeven point, is calculated using the discounted cash flow methodology presented in the NREL reports [37,38] (see Tables S9–S14 in the Supplementary Materials for detailed discounted cash flows for Sc 1–6, respectively). H2 production costs consist of feedstock costs, operating costs, capital depreciation, income taxes, and return on investment calculated by the formula [44]. Sc 5 includes CO2 emission allowances, and Sc 6 includes CO2 emission allowances, CO2 capture cost, and sales credit.
Figure 3.
H2 production cost comparison in six scenarios.
As discussed in Section 3.1, the cost of H2 production increases from Sc 1 to 2, 3, and 4 because of the use of a low-temperature WGS reactor, the addition of the low-temperature WGS reactor, and the low pressure in the reformer, respectively. In Sc 5, the CO2 emission allowances are applied to 100% of the CO2 generated from the burning of the tail gas, adding a cost of $0.25/kg-H2. In Sc 6, the CO2 emission allowances are applied to only 10% of CO2, increasing the cost by $0.025/kg-H2 because 90% of the generated CO2 is captured. Among the six scenarios, Sc 6 shows the lowest H2 production cost of $1.80/kg-H2 mainly due to the additional revenue from the sale of captured CO2, despite the additional production cost required for CO2 capture. Therefore, the SMR process configuration in Sc 6 is economically optimal with CO2 capture and sales.
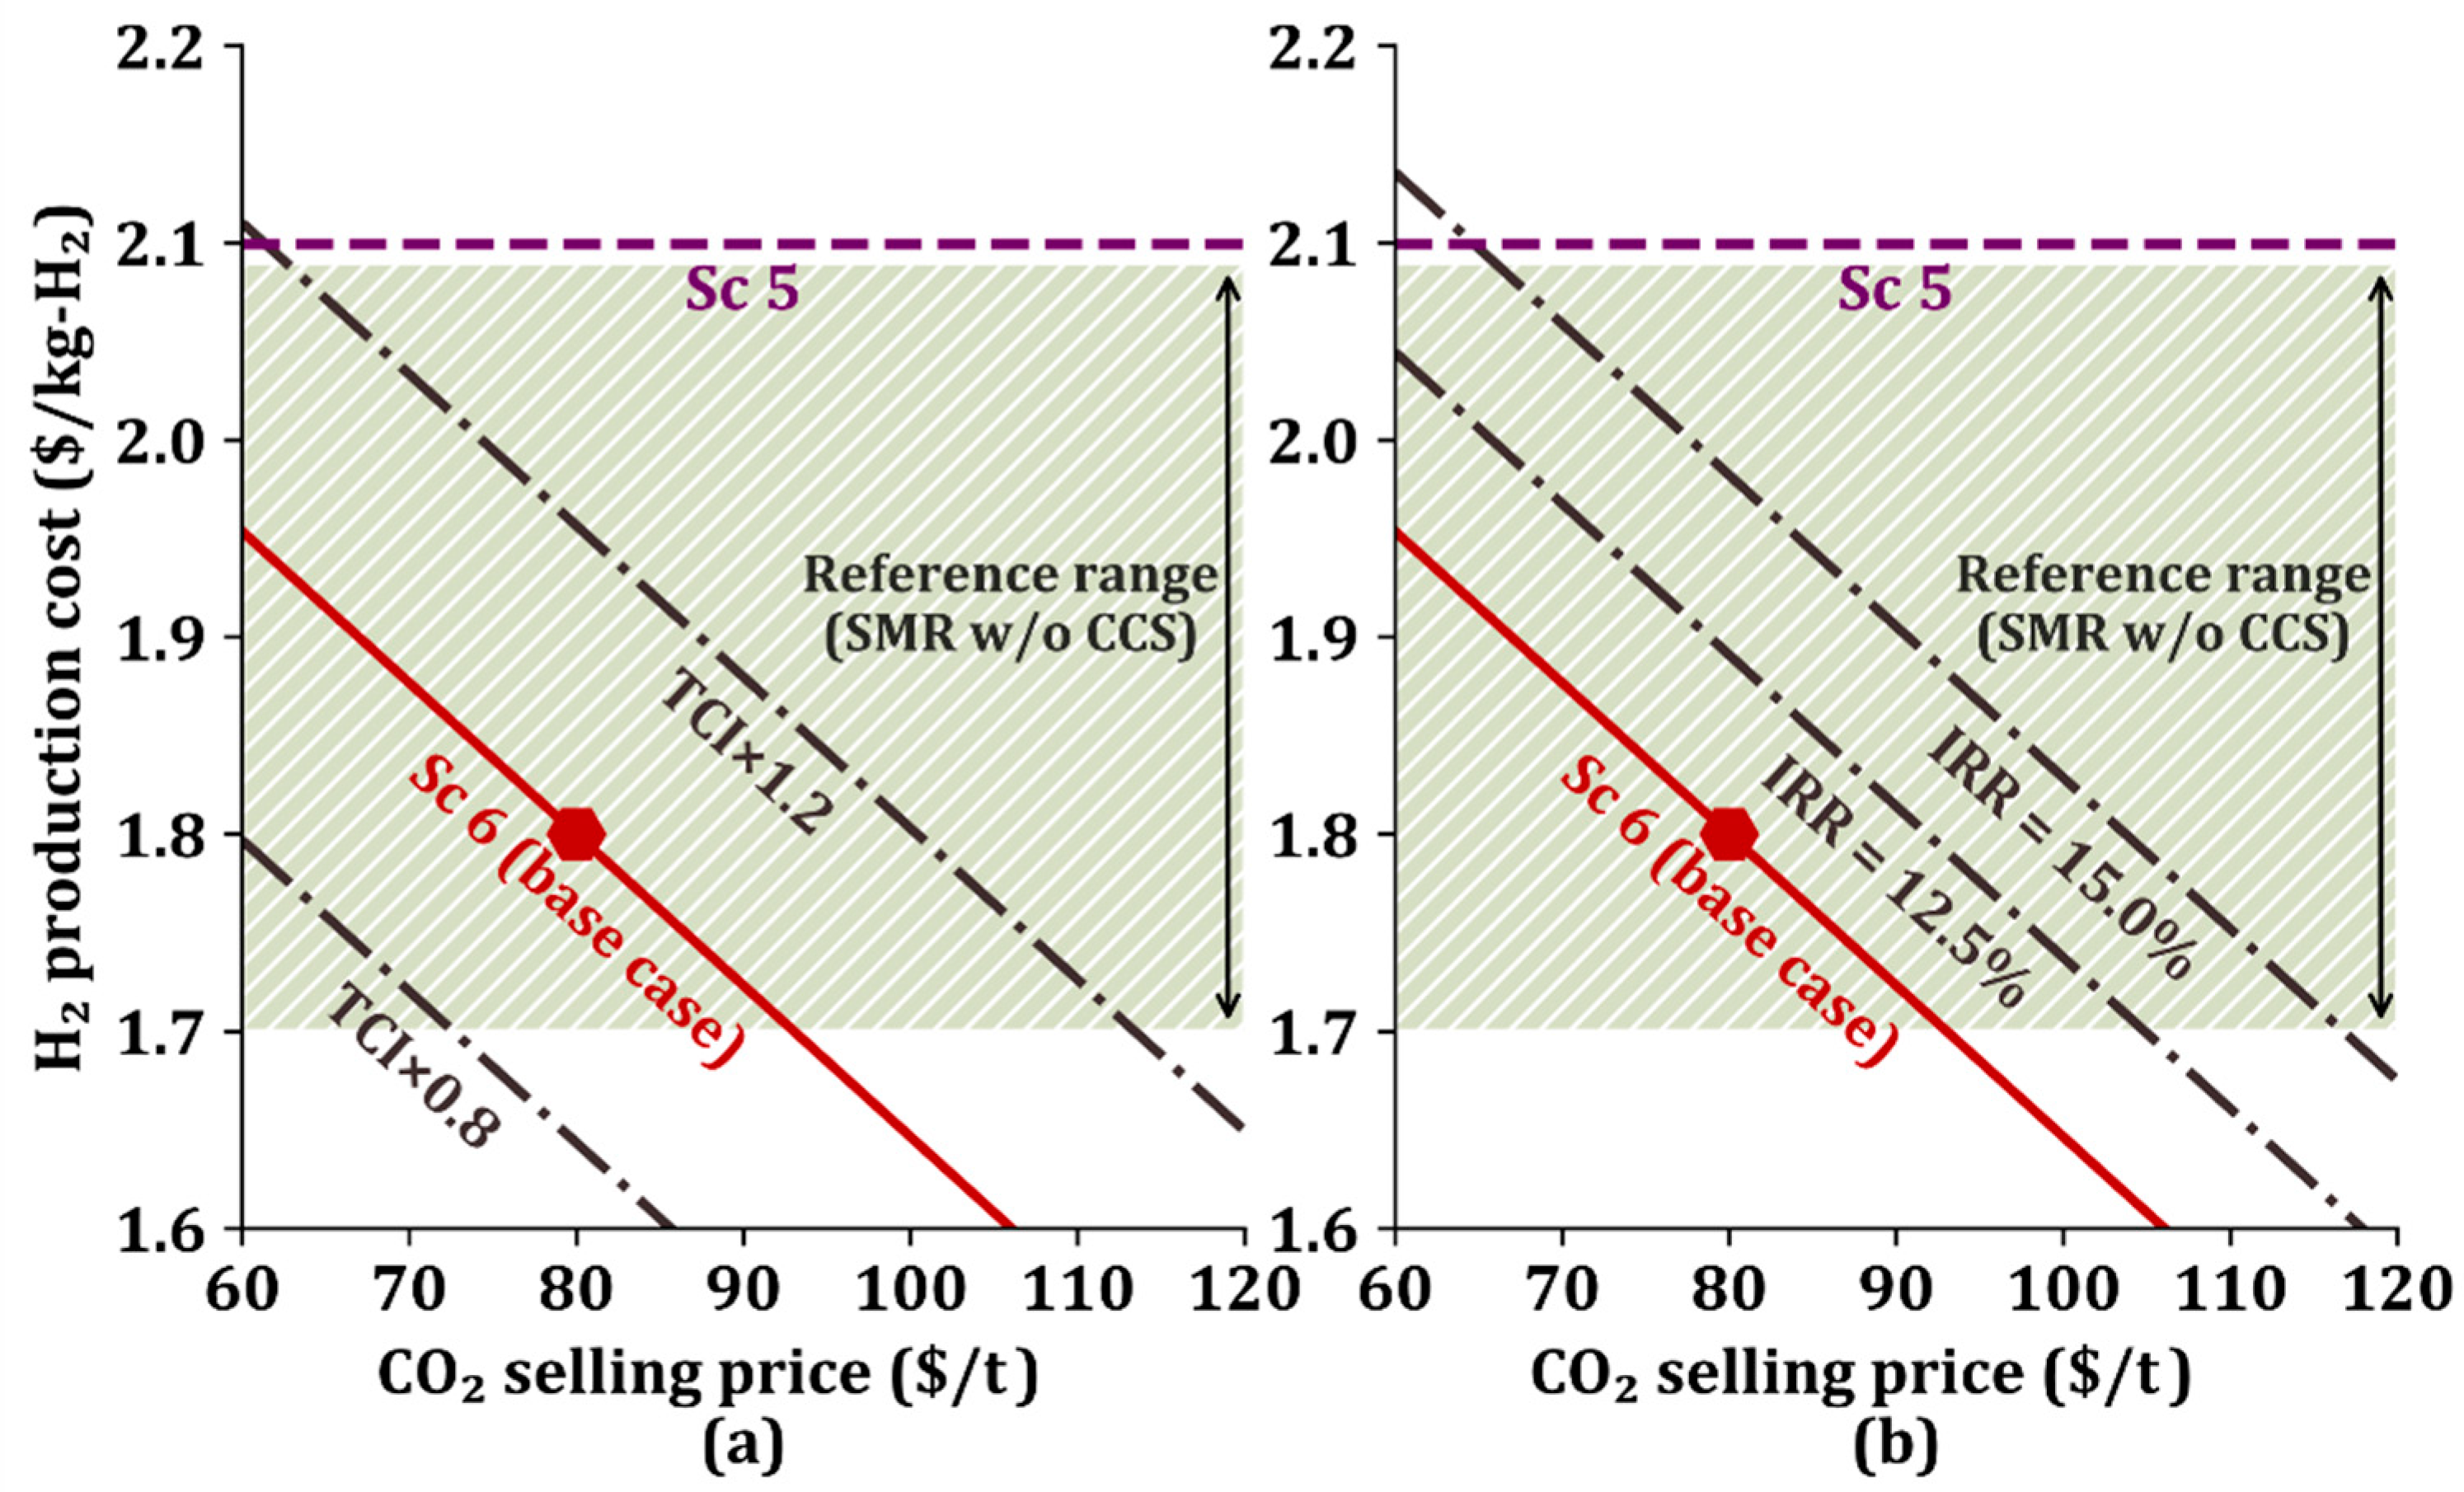
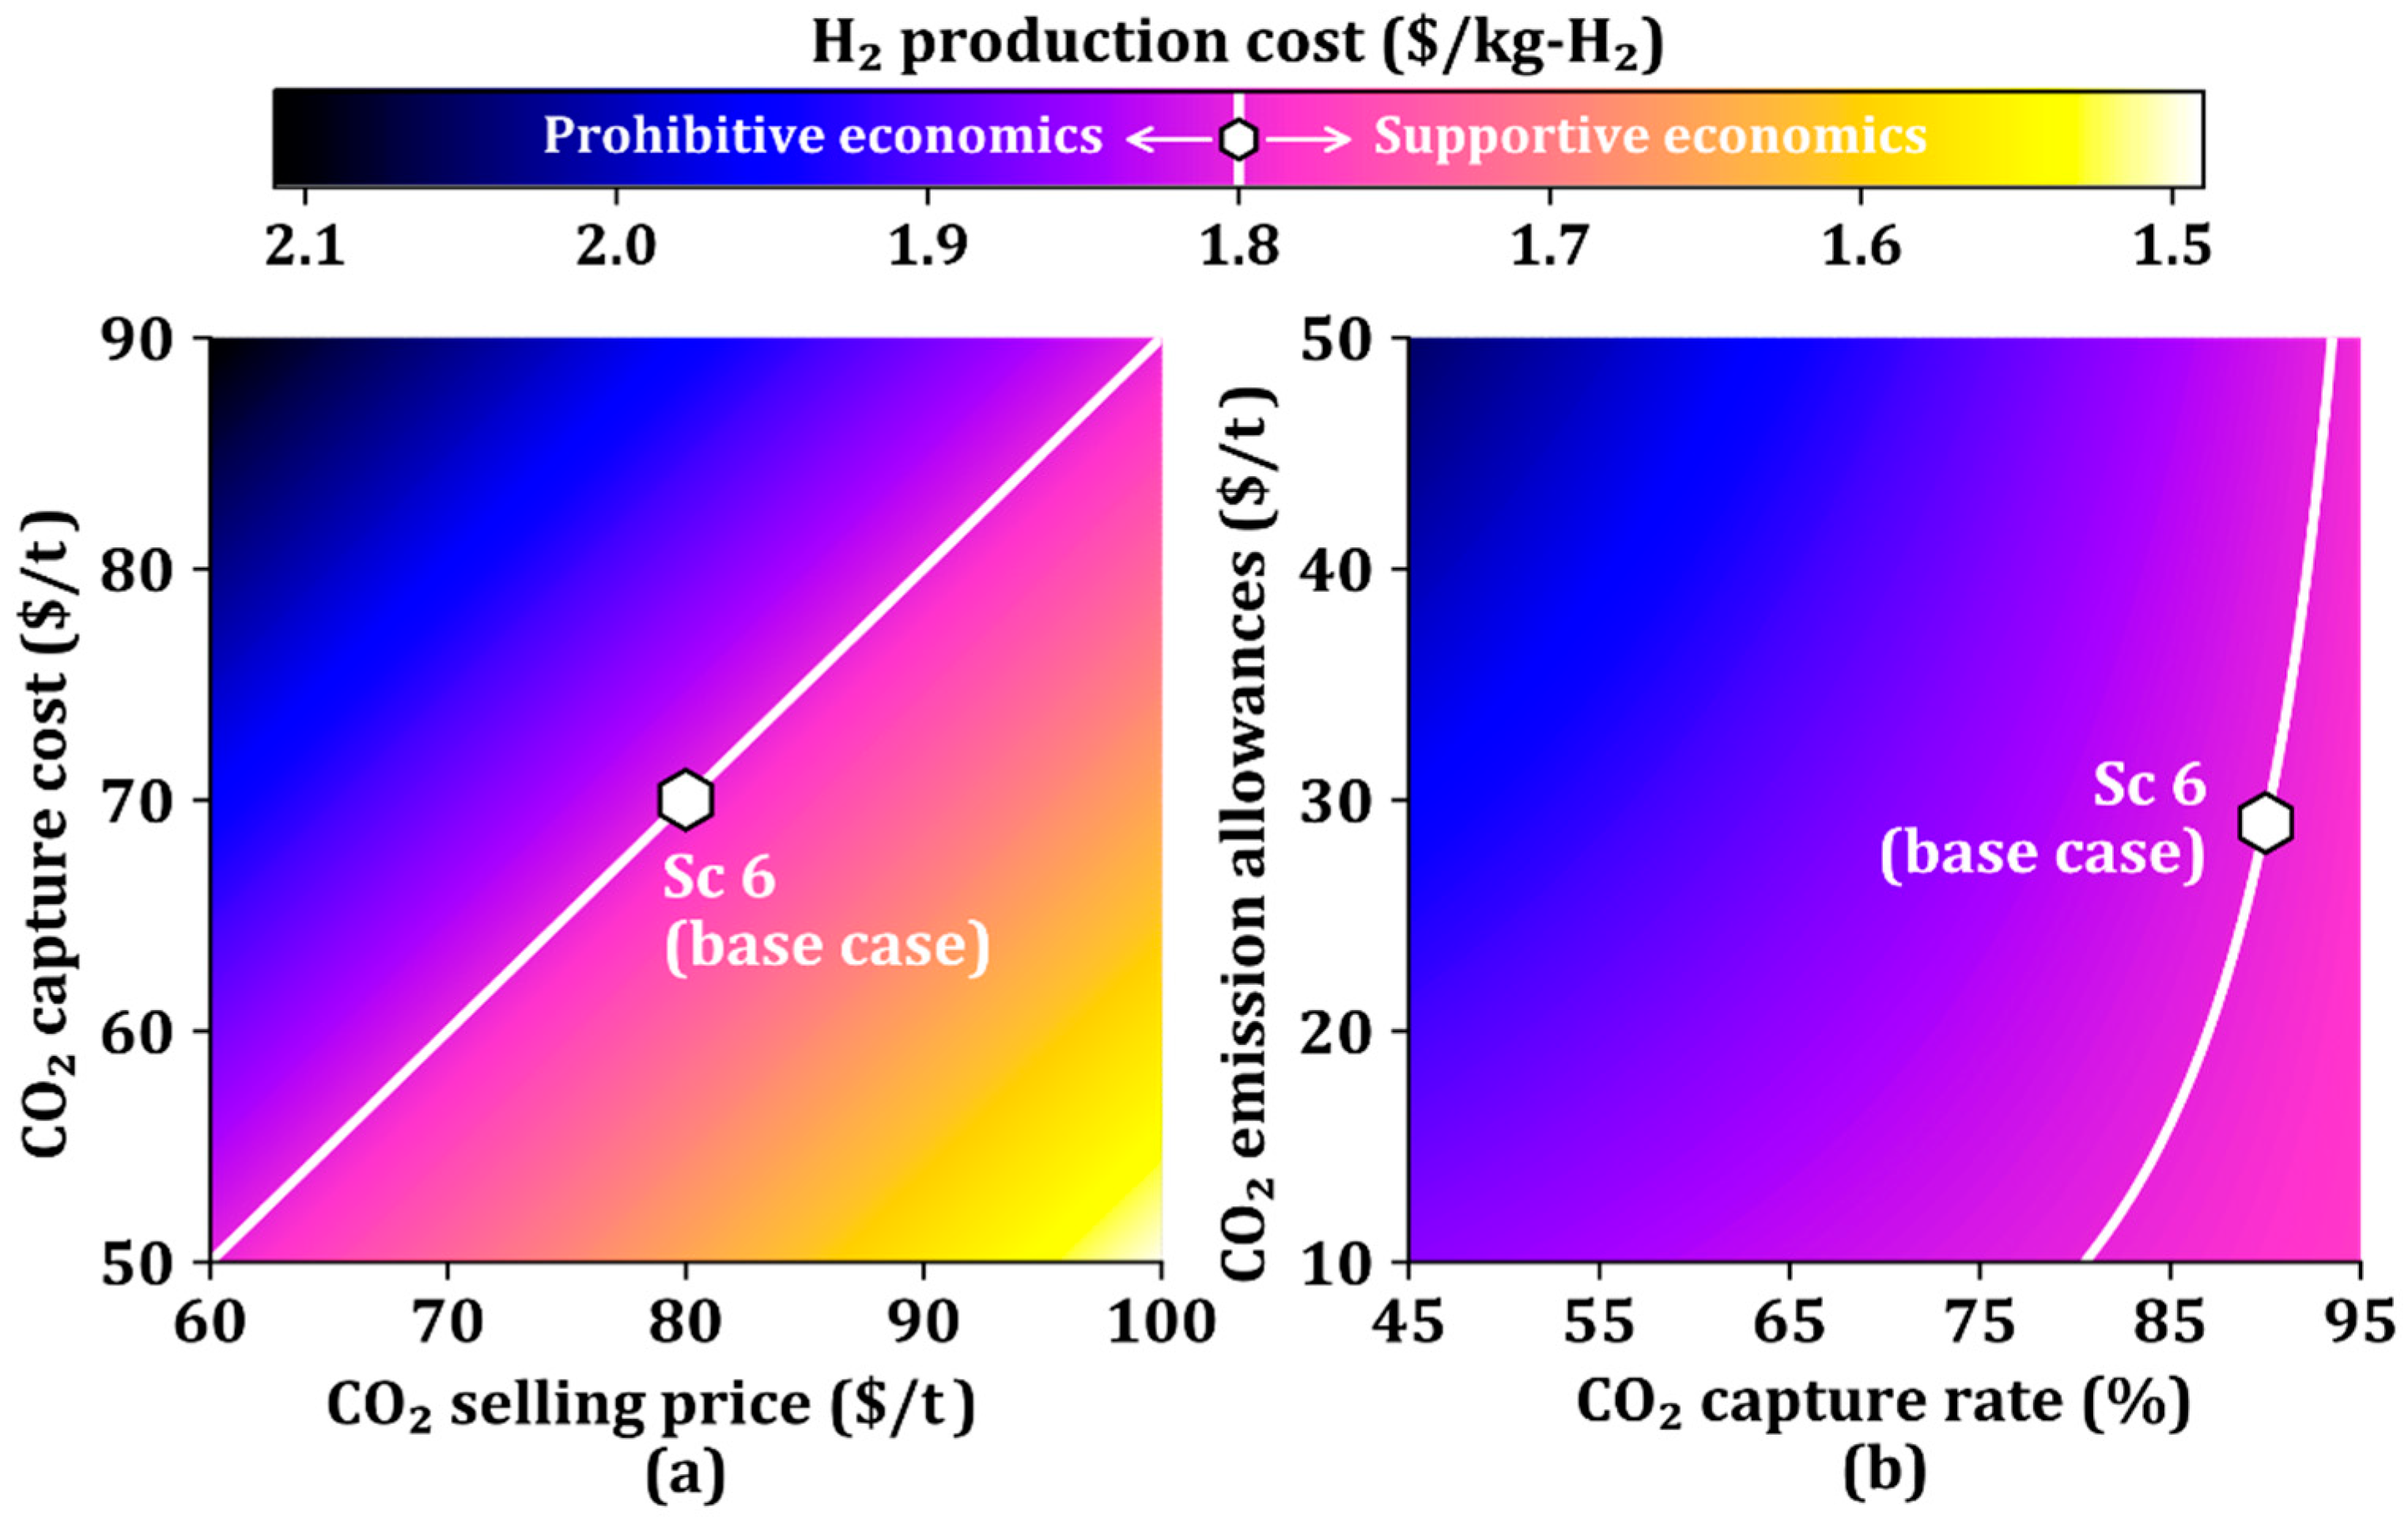
3.3. Sensitivity Analysis
We perform a sensitivity analysis of Sc 6 to investigate the influence of main parameters on the H2 production process, including CO2 capture, by varying key economic and process parameters by ±20% from the base conditions, as shown in Figure 4. Among the parameters, the feedstock cost is the most significant cost driver; a ±20% variation of it leads to a ±8.3% variation in the H2 production cost. The second most important cost driver is the CO2 capture cost; a ±20% variation of it leads to a ±6.1% change in the H2 production cost. The third factor is the IRR, leading to a ±3.9% change in the H2 production cost with a ±20% change. The next important cost drivers are the GHSV of the reformer, GHSV of the WGS reactor, and deionized water price, sequentially. Therefore, the economics of the SMR process can be further improved with the lower feedstock price, CO2 capture cost, and IRR.
Figure 4.
Sensitivity analysis of key economic parameters in Sc 6 using single-point tornado chart.
Figure 5 shows a viability envelope for Sc 6, which is used to investigate the effect of TCI and IRR on the H2 production cost according to the CO2 selling price. The general H2 production cost using SMR is between $1.70/kg-H2 and $2.09/kg-H2, as reported in the literature [45], and shown in Figure 5. Figure 5a shows the change in H2 production cost when the TCI in the base case is multiplied by a given multiplier (0.8 or 1.2), and the curves in Figure 5b represent the change in H2 production cost for a 12.5% IRR and 15.0% IRR [46].
Figure 5.
Viability envelope according to changes in (a) total capital investment (TCI) and (b) internal rate of return (IRR) in Sc 6. The reference range is between $1.7/kg-H2 and $2.09/kg-H2.
When there is no change in TCI and IRR values, Sc 6 is economically viable if the CO2 selling price is between $60/t and $92/t and economically attractive if the CO2 selling price is larger than $92/t because the H2 production cost is lower than the general production cost range.
When the TCI is decreased by 0.8 times and the CO2 selling price is higher than $72/t, then the H2 production cost is lower than the lowest H2 production cost of $1.70/kg-H2, and the proposed process becomes economically favorable. When the TCI increases by 1.2 times, Sc 6 becomes economically attractive if the CO2 sells for higher than $114/t.
Even if the IRR increases by 12.5% or 15.0%, the H2 production cost remains within the general H2 production cost range if CO2 sells for lower than $105/t or $118/t, respectively. In addition, it enters the cost preference area if CO2 sells for higher than $105/t or $118/t for a 12.5% or 15.0% IRR, respectively.
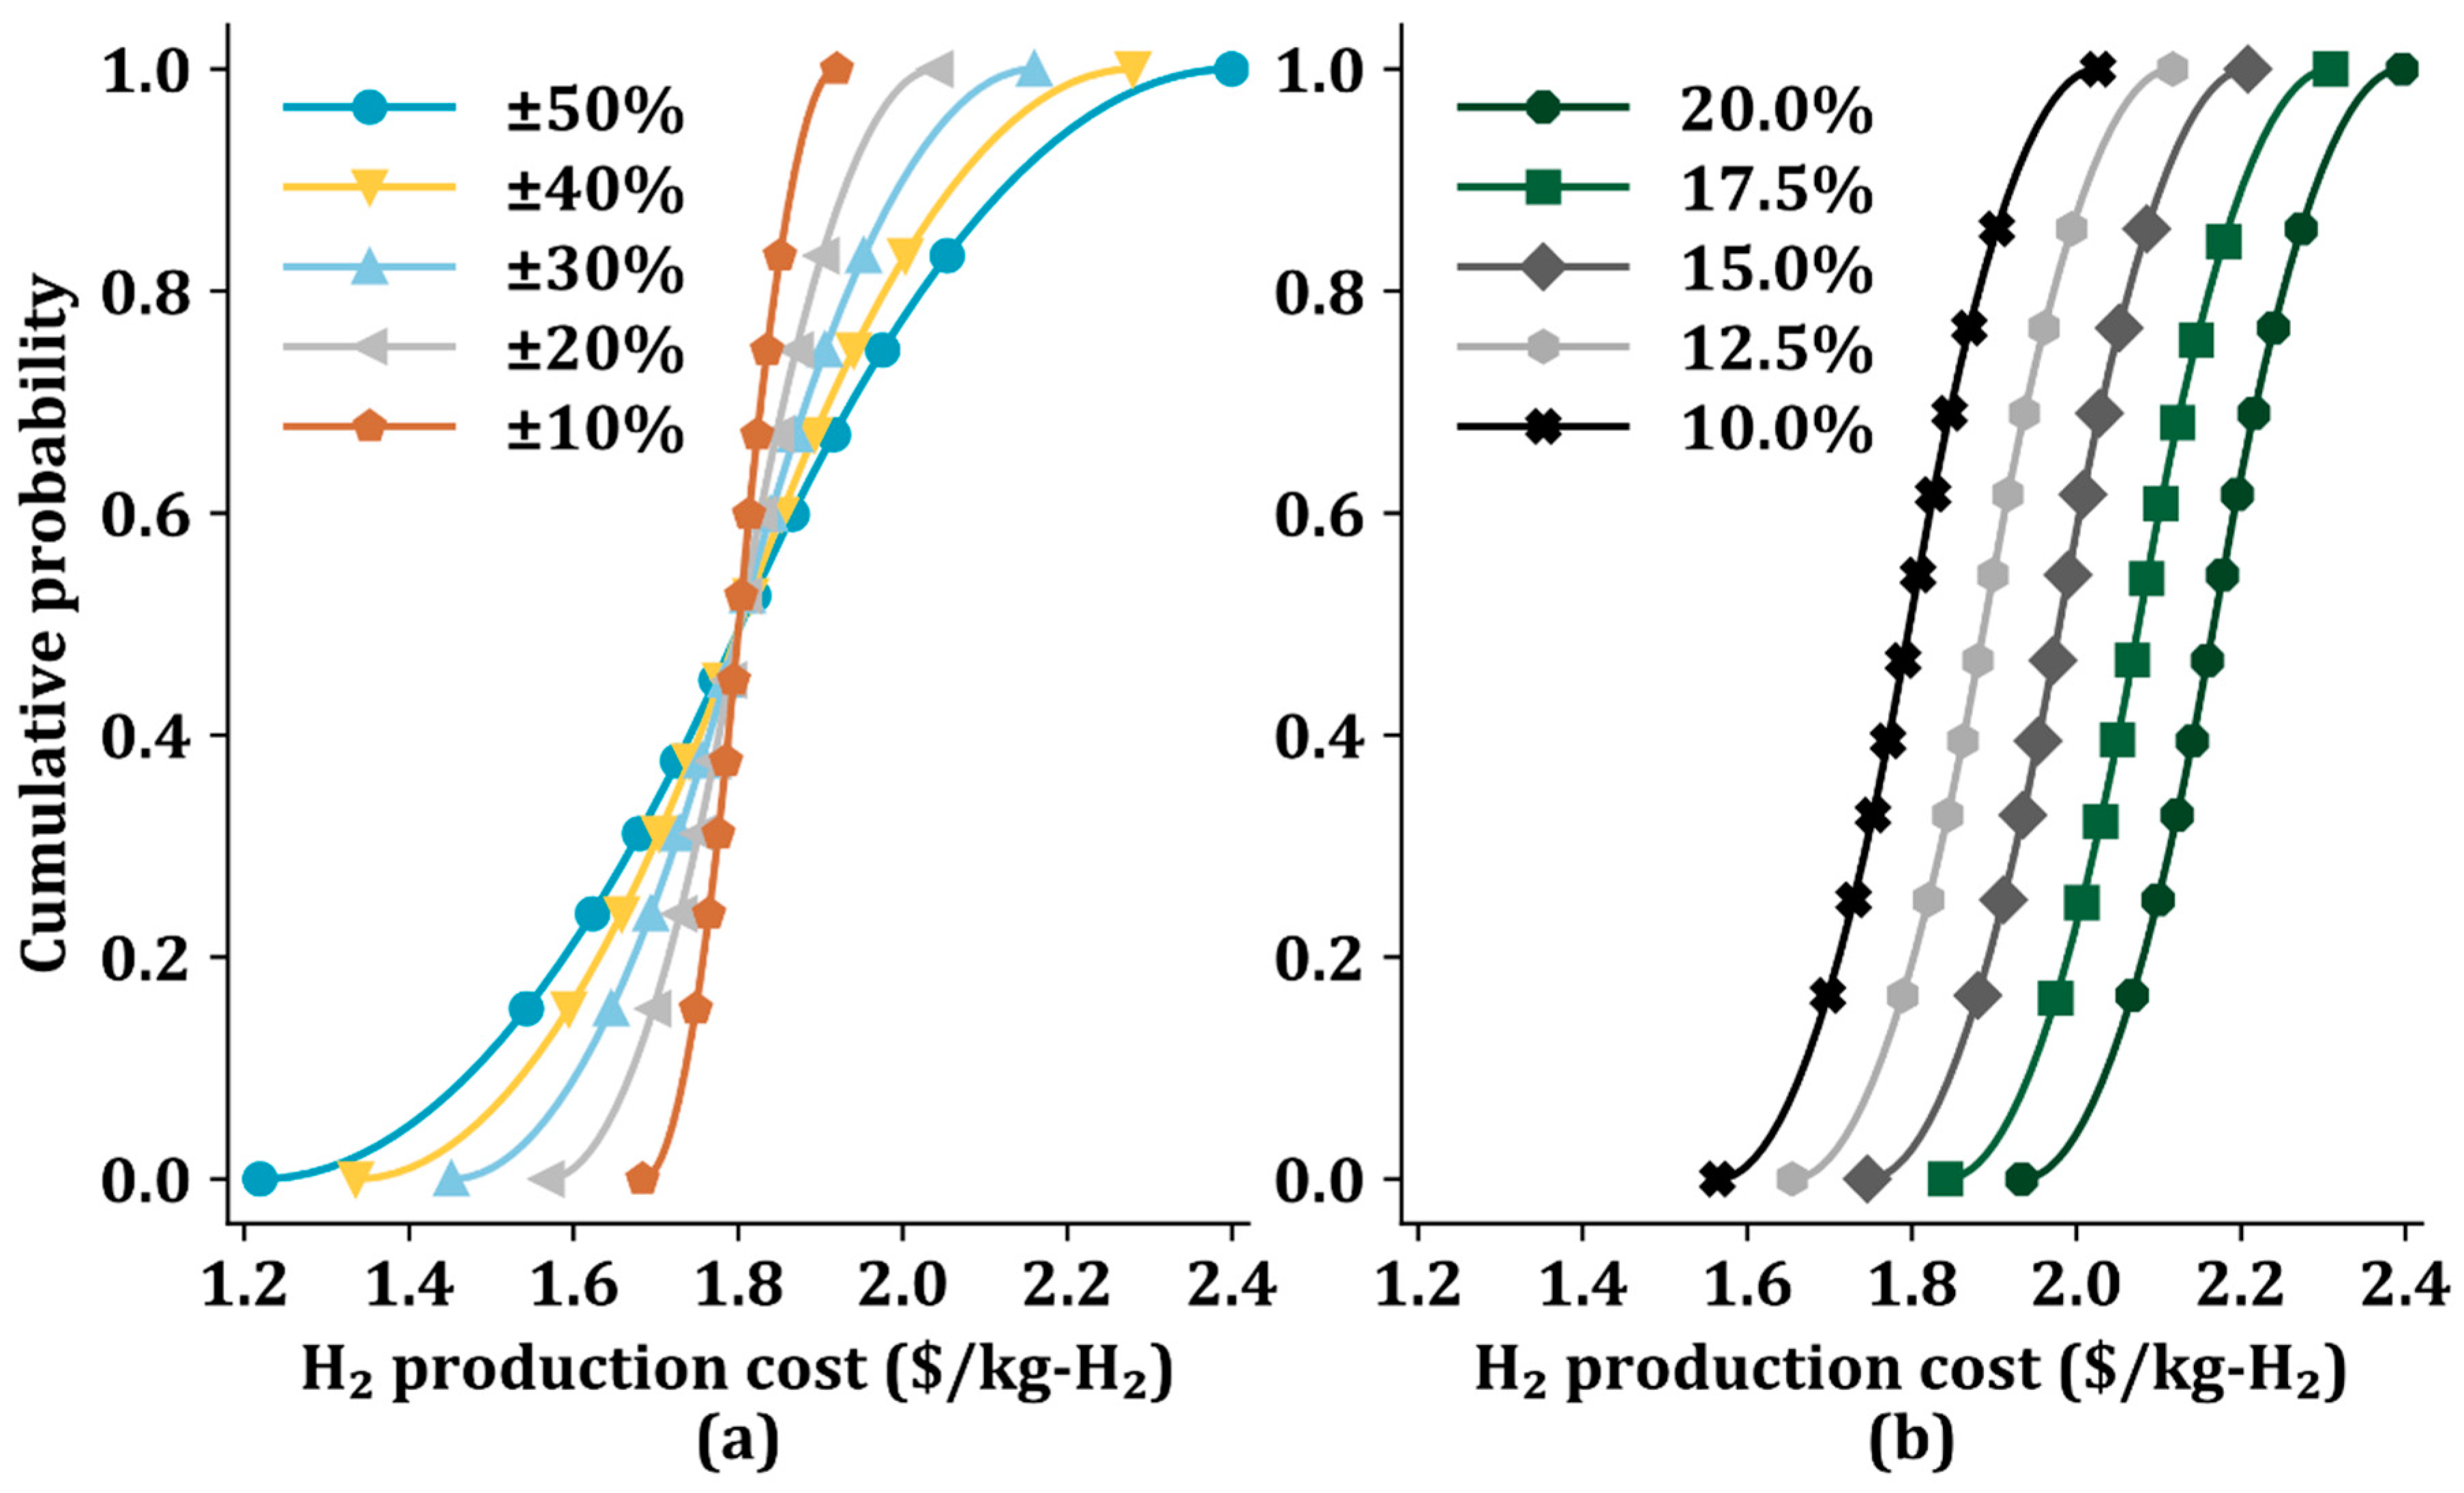
3.4. Uncertainty Analysis
From the results of the sensitivity analysis in the previous section, feedstock price, CO2 capture cost, and IRR are identified as critical parameters. We perform the Monte Carlo simulations (10,000 trials) for Sc 6 to quantify the uncertainty in the H2 production cost by randomly sampling from the triangular distribution of these three parameters [47].
Figure 6a shows the cumulative probability of H2 production cost with two economic parameters (feedstock cost and CO2 capture cost) ranging from ±10% to ±50% for a fixed IRR of 10%. The range of ±10% results in an increase in the H2 production cost from $1.68/kg-H2 to $1.92/kg-H2, while a range of ±50% results in a larger change in H2 production cost from $1.22/kg-H2 to $2.40/kg-H2. This implies that the fluctuations in the H2 production cost increase as the uncertainty of the two influential costs increases.
Figure 6.
Cumulative probability of H2 production cost in Sc 6 using the Monte Carlo method with (a) different influential economic parameters from ±10% to ±50% and a fixed internal rate of return of 10%, and (b) different internal rates of return from 10.0% to 20.0% and two key parameters (feedstock cost and CO2 capture cost) of ±20%.
The cumulative probability also varies with IRR difference (10.0–20.0%), as shown in Figure 6b. with the two key economic parameters (feedstock cost and CO2 capture cost) of ±20%. The cumulative probability curves indicate that as the IRR decreases, the probability of a low H2 production cost increase. When the IRR is 20.0%, the H2 production cost corresponding to a cumulative probability of 0.5 is $ 2.17/kg-H2; the lower bound (when the cumulative probability is 0) and the upper bound (when the cumulative probability is 1) are $1.93/kg-H2 and $2.40/kg-H2, respectively.
The CO2 capture cost and CO2 selling price affect the H2 production cost. Accordingly, we further study the attributes associated with CO2, including CO2 capture rate and CO2 emission allowances as well as CO2 capture cost and CO2 selling price, as shown in Figure 7. The white line is the production cost of the base case ($1.80/kg-H2). The upper left and lower right regions of the white line indicate unfavorable and favorable economics, respectively.
Figure 7.
H2 production cost as a function of (a) CO2 capture cost and CO2 selling price, and (b) CO2 capture rate and CO2 emission allowances.
Figure 7a shows the changes in the H2 production cost against the changes in the CO2 selling price and CO2 capture cost. The H2 production cost is determined by the ratio of CO2 capture cost to CO2 selling price, resulting in H2 production costs represented by the values in the straight line. The low CO2 selling price and high CO2 capture cost cause a prohibitive region of the H2 production cost, whereas the high CO2 selling price and low CO2 capture cost drive it into a favorable economic region.
Figure 7b shows the changes in the H2 production cost against the changes in the CO2 capture rate and CO2 emission allowances. The white line in Figure 7b is not straight because of the small effect of CO2 emission allowances on the H2 production cost when the CO2 capture rate is high and the large effect of CO2 emission allowances on the H2 production cost when the CO2 capture rate is low. As can be seen in Figure 7a,b, the CO2 selling price is a more dominant parameter in determining the H2 production cost than the CO2 emission allowances if the CO2 capture is considered.
4. Conclusions
Steam methane reforming (SMR) is a well-developed technology for the mass production of hydrogen. So far, research on SMR has focused on increasing the reaction yield of individual processes. In this study, we proposed an economically optimal process configuration to improve the economics of the SMR process from a process perspective. To this end, six scenarios were developed with different design conditions of the number of water–gas shift (WGS) reactors, CO2 capture, and CO2 emissions and operating conditions of the pressure of the reformer and temperature of the WGS reactor. As a result, it was found that the optimal SMR process had the lowest H2 production cost at $1.80/kg-H2. With a hydrogen production capacity of 500 kg/d, the optimal process configuration and operating conditions were proposed: a pressure of 800 kPa in the reformer, temperature of 450 °C in one WGS reactor, and CO2 capture and sales. It is also noted that the efficient utilization of CO2 will enable the mass production of hydrogen as a potential energy carrier.
Supplementary Materials
The following are available online at Available online: https://www.mdpi.com/article/10.3390/app11136021/s1 (accessed on 8 May 2012)., Figure S1: Process flow diagram of steam methane reforming process in scenario 2, Figure S2: Process flow diagram of steam methane reforming process in scenario 3, Figure S3: Process flow diagram of steam methane reforming process in scenario 4, Table S1: Process stream information for scenario 1, Table S2: Process stream information for scenario 2, Table S3: Process stream information for scenario 3, Table S4: Process stream information for scenario 4, Table S5: Equipment cost in scenario 1, Table S6: Equipment cost in scenario 2, Table S7: Equipment cost in scenario 3, Table S8: Equipment cost in scenario 4, Table S9: Discounted cash flow for scenario 1, Table S10: Discounted cash flow for scenario 2, Table S11: Discounted cash flow for scenario 3, Table S12: Discounted cash flow for scenario 4, Table S13: Discounted cash flow for scenario 5, Table S14: Discounted cash flow for scenario 6.
Author Contributions
Conceptualization, S.L. and H.S.K.; methodology, J.P.; software, J.P.; validation, B.M.K., C.-H.C., H.L., and W.W.; resources, B.M.K.; writing—original draft preparation, S.L., H.S.K., and J.P.; writing—review and editing, C.-H.C., H.L., and W.W.; visualization, B.M.K.; supervision, H.L. and W.W.; funding acquisition, H.L. and W.W. All authors have read and agreed to the published version of the manuscript.
Funding
This work was supported by a grant from Kyung Hee University in 2020 (KHU-20202303). H. Lim would like to acknowledge the financial support from the Hydrogen Energy Innovation Technology Development Program of the National Research Foundation of Korea (NRF) funded by the Korean government (Ministry of Science and ICT (MSIT)) (NRF-2019M3E6A1064290).
Institutional Review Board Statement
Not applicable.
Informed Consent Statement
Not applicable.
Conflicts of Interest
The authors declare no conflict of interest.
References
- Won, W.; Motagamwala, A.H.; Dumesic, J.A.; Maravelias, C.T. A co-solvent hydrolysis strategy for the production of biofuels: Process synthesis and technoeconomic analysis. React. Chem. Eng. 2017, 2, 397–405. [Google Scholar] [CrossRef]
- Kim, M.; Won, W.; Kim, J. Integration of carbon capture and sequestration and renewable resource technologies for sustainable energy supply in the transportation sector. Energy Convers. Manag. 2017, 143, 227–240. [Google Scholar] [CrossRef]
- Davis, S.J.; Lewis, N.S.; Shaner, M.; Aggarwal, S.; Arent, D.; Azevedo, I.L.; Benson, S.M.; Bradley, T.; Brouwer, J.; Chiang, Y.M.; et al. Net-zero emissions energy systems. Science 2018, 360, 6396. [Google Scholar] [CrossRef] [Green Version]
- Thonemann, N.; Pizzol, M. Consequential life cycle assessment of carbon capture and utilization technologies within the chemical industry. Energy Environ. Sci. 2019, 12, 2253–2263. [Google Scholar] [CrossRef] [Green Version]
- Huang, K.; Won, W.; Barnett, K.J.; Brentzel, Z.J.; Alonso, D.M.; Huber, G.W.; Dumesic, J.A.; Maravelias, C.T. Improving economics of lignocellulosic biofuels: An integrated strategy for coproducing 1,5-pentanediol and ethanol. Appl. Energy 2018, 213, 585–594. [Google Scholar] [CrossRef]
- Motagamwala, A.H.; Huang, K.; Maravelias, C.T.; Dumesic, J.A. Solvent system for effective near-term production of hydroxymethylfurfural (HMF) with potential for long-term process improvement. Energy Environ. Sci. 2019, 12, 2212–2222. [Google Scholar] [CrossRef]
- Urban, C.; Xu, J.; Sträuber, H.; dos Santos Dantas, T.R.; Mühlenberg, J.; Härtig, C.; Angenent, L.T.; Harnisch, F. Production of drop-in fuels from biomass at high selectivity by combined microbial and electrochemical conversion. Energy Environ. Sci. 2017, 10, 2231–2244. [Google Scholar] [CrossRef]
- Han, S.; Won, W.; Kim, J. Scenario-based approach for design and comparatively analysis of conventional and renewable energy systems. Energy 2017, 129, 86–100. [Google Scholar] [CrossRef]
- Heede, R.; Oreskes, N. Potential emissions of CO2 and methane from proved reserves of fossil fuels: An alternative analysis. Glob. Environ. Chang. 2016, 36, 12–20. [Google Scholar] [CrossRef] [Green Version]
- Won, W.; Kwon, H.; Han, J.-H.; Kim, J. Design and operation of renewable energy sources based hydrogen supply system: Technology integration and optimization. Renew. Energy 2017, 103, 226–238. [Google Scholar] [CrossRef]
- Lee, B.; Park, J.; Lee, H.; Byun, M.; Yoon, C.W.; Lim, H. Assessment of the economic potential: COx-free hydrogen production from renewables via ammonia decomposition for small-sized H2 refueling stations. Renew. Sustain. Energy Rev. 2019, 113, 109262. [Google Scholar] [CrossRef]
- Manoharan, Y.; Hosseini, S.E.; Butler, B.; Alzhahrani, H.; Senior, B.T.F.; Ashuri, T.; Krohn, J. Hydrogen fuel cell vehicles; current status and future prospect. Appl. Sci. 2019, 9, 2296. [Google Scholar] [CrossRef] [Green Version]
- Abdalla, A.M.; Hossain, S.; Nisfindy, O.B.; Azad, A.T.; Dawood, M.; Azad, A.K. Hydrogen production, storage, transportation and key challenges with applications: A review. Energy Convers. Manag. 2018, 165, 602–627. [Google Scholar] [CrossRef]
- Won, W.; Maravelias, C.T. Thermal fractionation and catalytic upgrading of lignocellulosic biomass to biofuels: Process synthesis and analysis. Renew. Energy 2017, 114, 357–366. [Google Scholar] [CrossRef]
- Ayodele, T.R.; Munda, J.L. Potential and economic viability of green hydrogen production by water electrolysis using wind energy resources in South Africa. Int. J. Hydrogen Energy 2019, 44, 17669–17687. [Google Scholar] [CrossRef]
- Nguyen, T.; Abdin, Z.; Holm, T.; Mérida, W. Grid-connected hydrogen production via large-scale water electrolysis. Energy Convers. Manag. 2019, 200, 112108. [Google Scholar] [CrossRef]
- Chen, J.; Han, J.; Xu, D. Efficient operation of autothermal microchannel reactors for the production of hydrogen by steam methane reforming. Int. J. Hydrogen Energy 2019, 44, 11546–11563. [Google Scholar] [CrossRef]
- Boyano, A.; Blanco-Marigorta, A.M.; Morosuk, T.; Tsatsaronis, G. Exergoenvironmental analysis of a steam methane reforming process for hydrogen production. Energy 2011, 36, 2202–2214. [Google Scholar] [CrossRef]
- Saeidi, S.; Fazlollahi, F.; Najari, S.; Iranshahi, D.; Klemeš, J.J.; Baxter, L.L. Hydrogen production: Perspectives, separation with special emphasis on kinetics of WGS reaction: A state-of-the-art review. J. Ind. Eng. Chem. 2017, 49, 1–25. [Google Scholar] [CrossRef]
- Lai, G.H.; Lak, J.H.; Tsai, D.H. Hydrogen production via low-temperature steam–methane reforming using Ni–CeO2–Al2O3 hybrid nanoparticle clusters as catalysts. ACS Appl. Energy Mater. 2019, 2, 7963–7971. [Google Scholar] [CrossRef]
- Jung, W.; Park, J.; Won, W.; Lee, K.S. Simulated moving bed adsorption process based on a polyethylenimine-silica sorbent for CO2 capture with sensible heat recovery. Energy 2018, 150, 950–964. [Google Scholar] [CrossRef]
- Son, Y.; Won, W.; Lee, T.; Lee, K.S. An intermittently moving bed adsorption process for carbon dioxide capture. Int. J. Greenh. Gas Control 2016, 49, 34–46. [Google Scholar] [CrossRef]
- Park, J.; Won, W.; Jung, W.; Lee, K.S. One-dimensional modeling of a turbulent fluidized bed for a sorbent-based CO2 capture process with solid-solid sensible heat exchange. Energy 2019, 168, 1168–1180. [Google Scholar] [CrossRef]
- Nexant Inc. Equipment Design and Cost Estimation for Small Modular Biomass Systems, Synthesis Gas Cleanup, and Oxygen Separation Equipment; National Renewable Energy Laboratory: Golden, CO, USA, 2006.
- Liu, K.; Song, C.; Subramani, V. Hydrogen and Syngas Production and Purification Technologies, 1st ed.; John Wiley & Sons: Hoboken, NJ, USA, 2010. [Google Scholar]
- Sharma, I.; Friedrich, D.; Golden, T.; Brandani, S. Exploring the opportunities for carbon capture in modular, small-scale steam methane reforming: An energetic perspective. Int. J. Hydrogen Energy 2019, 44, 14732–14743. [Google Scholar] [CrossRef]
- Sircar, S.; Golden, T.C. Purification of hydrogen by pressure swing adsorption. Sep. Sci. Technol. 2000, 35, 667–687. [Google Scholar] [CrossRef]
- Wagner, J.L. Selective Adsorption Process. U.S. Patent 3430418, 4 March 1969. [Google Scholar]
- Fuderer, A.; Rudelstorfer, E. Selective Adsorption Process. U.S. Patent 3986849, 19 October 1976. [Google Scholar]
- Kim, H.; Lee, S.; Lee, J.; Won, W. Simultaneous production of 1,6-hexanediol, furfural, and high-purity lignin from white birch: Process integration and techno-economic evaluation. Bioresour. Technol. 2021, 331, 125009. [Google Scholar] [CrossRef] [PubMed]
- Kim, H.; You, H.; Choi, K.S.; Han, S. A Study on Interconnecting to the power grid of new energy using the natural gas pressure. J. Electr. Eng. Technol. 2020, 15, 307–314. [Google Scholar] [CrossRef]
- Park, H.G.; Han, S.Y.; Jun, K.W.; Woo, Y.; Park, M.J.; Kim, S.K. Bench-scale steam reforming of methane for hydrogen production. Catalysts 2019, 9, 615. [Google Scholar] [CrossRef] [Green Version]
- Haryanto, A.; Fernando, S.D.; Filip To, S.D.; Steele, P.H.; Pordesimo, L.; Adhikari, S. High temperature water gas shift reaction over nickel catalysts for hydrogen production: Effect of supports, GHSV, metal loading, and dopant materials. J. Thermodyn. Catal. 2011, 2, 645–2153. [Google Scholar] [CrossRef] [Green Version]
- Jeong, D.W.; Potdar, H.S.; Roh, H.S. Comparative study on nano-sized 1 wt% Pt/Ce0.8Zr0.2O2 and 1 wt% Pt/Ce0.2Zr0.8O2 catalysts for a single stage water gas shift reaction. Catal. Lett. 2012, 142, 439–444. [Google Scholar] [CrossRef]
- Carbon Dioxide (CO2) Market Share, Size, Trends, & Industry Analysis Report, By Sources (Hydrogen, Ethyl Alcohol, Ethylene Oxide, Substitute Natural Gas), By Application (Food & Beverages, Oil & Gas, Medical, Rubber, Fire Fighting), By Regions: Segment Forecast, 2018–2026. Available online: https://www.polarismarketresearch.com/industry-analysis/carbon-dioxide-market (accessed on 8 June 2021).
- Zhang, Z.; Pan, S.Y.; Li, H.; Cai, J.; Olabi, A.G.; Anthony, E.J.; Manovic, V. Recent advances in carbon dioxide utilization. Renew. Sustain. Energy Rev. 2020, 125, 109799. [Google Scholar] [CrossRef]
- Liang, F.; Lindberg, P.; Lindblad, P. Engineering photoautotrophic carbon fixation for enhanced growth and productivity. Sustain. Energy Fuels 2018, 2, 2583–2600. [Google Scholar] [CrossRef] [Green Version]
- The Chemical Engineering Plant Cost Index. Available online: https://www.chemengonline.com/pci-home (accessed on 3 May 2021).
- Steward, D.; Ramsden, T.; Zuboy, J. H2A Central Hydrogen Production Model, Version 3 User Guide (DRAFT); National Renewable Energy Laboratory: Golden, CO, USA, 2012.
- Davis, R.E.; Grundl, N.J.; Tao, L.; Biddy, M.J.; Tan, E.C.D.; Beckham, G.T.; Humbird, D.; Thompson, D.N.; Roni, M.S. Process Design and Economics for the Conversion of Lignocellulosic Biomass to Hydrocarbon Fuels and Coproducts: 2018 Biochemical Design Case Update; National Renewable Energy Laboratory: Golden, CO, USA, 2018.
- Davis, R.; Tao, L.; Scarlata, C.; Tan, E.C.D.; Ross, J.; Lukas, J.; Sexton, D. Process Design and Economics for the Conversion of Lignocellulosic Biomass to Hydrocarbons: Dilute-Acid and Enzymatic Deconstruction of Biomass to Sugars and Catalytic Conversion of Sugars to Hydrocarbons; National Renewable Energy Laboratory: Golden, CO, USA, 2015.
- Turton, R.; Shaeiwitz, J.A.; Bhattacharyya, D.; Whiting, W.B. Analysis, Synthesis and Design of Chemical Processes, 5th ed.; Prentice Hall: Hoboken, NJ, USA, 2018. [Google Scholar]
- Mac Dowell, N.; Fennell, P.S.; Shah, N.; Maitland, G.C. The role of CO2 capture and utilization in mitigating climate change. Nat. Clim. Chang. 2017, 7, 243–249. [Google Scholar] [CrossRef] [Green Version]
- Farris, P.W.; Bendle, N.; Pfeifer, P.E.; Reibstein, D. Marketing Metrics: The Definitive Guide to Measuring Marketing Performance, 2nd ed.; Pearson Education: London, UK, 2010. [Google Scholar]
- Nikolaidis, P.; Poullikkas, A. A comparative overview of hydrogen production processes. Renew. Sustain. Energy Rev. 2017, 67, 597–611. [Google Scholar] [CrossRef]
- Choe, B.; Lee, S.; Won, W. Process integration and optimization for economical production of commodity chemicals from lignocellulosic biomass. Renew. Energy 2020, 162, 242–248. [Google Scholar] [CrossRef]
- Choe, B.; Lee, S.; Lee, H.; Lee, J.; Lim, H.; Won, W. Integrated strategy for coproducing bioethanol and adipic acid from lignocellulosic biomass. J. Clean. Prod. 2021, 311, 127849. [Google Scholar] [CrossRef]
Publisher’s Note: MDPI stays neutral with regard to jurisdictional claims in published maps and institutional affiliations. |
© 2021 by the authors. Licensee MDPI, Basel, Switzerland. This article is an open access article distributed under the terms and conditions of the Creative Commons Attribution (CC BY) license (https://creativecommons.org/licenses/by/4.0/).