Article

A Set of Single YOLO Modalities to Detect Occluded Entities via Viewpoint Conversion

Department of Electrical Engineering, Soonchunhyang University, Asan 31538, Korea
*
Author to whom correspondence should be addressed.
Appl. Sci. 2021, 11(13), 6016; https://doi.org/10.3390/app11136016
Submission received: 21 May 2021 / Revised: 9 June 2021 / Accepted: 25 June 2021 / Published: 29 June 2021
(This article belongs to the Section Computing and Artificial Intelligence)

Abstract

:
For autonomous vehicles, it is critical to be aware of the driving environment to avoid collisions and drive safely. The recent evolution of convolutional neural networks has contributed significantly to accelerating the development of object detection techniques that enable autonomous vehicles to handle rapid changes in various driving environments. However, collisions in an autonomous driving environment can still occur due to undetected obstacles and various perception problems, particularly occlusion. Thus, we propose a robust object detection algorithm for environments in which objects are truncated or occluded by employing RGB image and light detection and ranging (LiDAR) bird’s eye view (BEV) representations. This structure combines independent detection results obtained in parallel through “you only look once” networks using an RGB image and a height map converted from the BEV representations of LiDAR’s point cloud data (PCD). The region proposal of an object is determined via non-maximum suppression, which suppresses the bounding boxes of adjacent regions. A performance evaluation of the proposed scheme was performed using the KITTI vision benchmark suite dataset. The results demonstrate the detection accuracy in the case of integration of PCD BEV representations is superior to when only an RGB camera is used. In addition, robustness is improved by significantly enhancing detection accuracy even when the target objects are partially occluded when viewed from the front, which demonstrates that the proposed algorithm outperforms the conventional RGB-based model.

1. Introduction

According to a recent technical report from the National Highway Traffic Safety Administration (NHTSA), 94% of collision accidents on roads are caused by careless drivers, and efforts are being made to develop technologies to prevent such accidents, e.g., automated driving systems (ADS). Recently, with the development of artificial intelligence technology, a driving environment recognition algorithm that can determine lanes, obstacles, and roads using various sensors has been applied to improve ADS performance [1].
Most driving environment recognition algorithms that mimic artificial intelligence applied to ADS use convolutional neural networks (CNN), which are characterized by end-to-end learning that automatically extracts and learns features from image data [2]. CNNs are essential for perceiving the driving environment because they can easily understand the characteristics of an image by scanning the entire image through the convolution kernel [3]. In the process of detecting an object using a CNN, a process to classify a specific object class in an image and a regression process to predict a bounding box (representing the geometric information of an object) are performed simultaneously [4]. The detection accuracy of these algorithms has improved gradually with the availability of large amounts of labeled data through the ImageNet visual recognition challenge [5] and Pascal VOC challenge [6]. In addition, its commercial use is increasing with the accelerated learning and testing computation afforded by parallel GPU computation [7].
Object detection technology in ADS is used actively to detect various objects on the road, e.g., vehicles, pedestrians, and cyclists, and many safety-related studies have been conducted because defects in the detection system can have serious consequences. However, in an autonomous driving environment, collision accidents can still occur due to undetected obstacles and various recognition problems [8]. According to a California Department of Motor Vehicles autonomous vehicle accident report, Google-Waymo, which has driven the longest distance in autonomous driving mode, has an ADS system defect when detecting and responding to rear collisions [9]. Such system faults are caused by sensor inputs being influenced by weather conditions, e.g., rain and fog, or by environmental variables, e.g., occlusion or truncation of surrounding vehicles and pedestrians [10]. Thus, developing an ADS that can predict and respond to these situations accurately remains a challenge [11,12]. Occlusion occurs when an object to be detected is positioned behind a fixed element or other objects in the image, and truncation occurs when the camera cannot observe the entire object. Therefore, to develop an ADS that is more robust to environmental variables, algorithms that analyze and synthesize information from various areas using RGB cameras and light detection and ranging (LiDAR) to determine the situation have been proposed previously [13,14].
An RGB camera creates an image by combining the reflected visible light with the intensity values of the RGB color spectrum (0–255) for each of the three channels. Similar to human vision, the characteristics of the surface and appearance of objects in the detection area can be displayed in detail, thereby improving basic detection performance. RGB cameras are the most cost-effective among the various sensors used in ADS object detection; however, their performance can deteriorate when lighting is weak due to shadows, the object to be detected is blocked by obstacles, or poor weather conditions occur, e.g., snow, rain, and fog [15].
LiDAR emits a highly linear laser signal, and the reflected signal is represented by a large amount of point cloud data (PCD), which contain precise 3D geometric information and the reflectance of reflected objects expressed in Cartesian coordinates. Accordingly, the PCD are converted to a feature map based on horizontal disparity, height, and depth quantity through 3D geometric information, which is then used for object detection. Note that LiDAR is more robust in dark environments than RGB cameras because data are processed through signals derived from the sensor itself. However, both sensors can suffer from reduced recognition performance in severe weather conditions [16]. In addition, if voxelization is employed for 3D object detection, despite its ability to acquire rich 3D geometrical information, it has increased processing time due to its complicated system structure and operation [17].
RGB cameras and LiDAR systems have mutually complementary features; thus, when developing an ADS that integrates both of these technologies, the advantages of both sensors can be utilized effectively [18,19]. This can make the ADS robust against changes in the external environment. For example, the reliability of information acquired using an RGB camera may be low in dark and foggy conditions; therefore, a more secure ADS can be developed by relying more on information from LiDAR. Object detection algorithms in autonomous driving have been studied previously and demonstrate high detection accuracy. For example, 2D object detection performance is on average 15% more accurate than 3D object detection because not only the location of the object expressed in the pixel coordinate system and the object expressed in the world coordinate system should be detected accurately to predict a 3D bounding box [20,21].
Most 2D object detection studies that combine RGB images and PCD from LiDAR are using LiDAR front view (FV) representations. Here, the PCD are converted to an image map based on the LiDAR FV representations having the same bounding boxes as the RGB image in Figure 1a and are then combined together. Figure 1b,c shows maps created with the pixels of the distance and height of the PCD, respectively. LiDAR FV representations improve the performance of conventional RGB image-based object detection systems significantly because the lack of a camera, which can be affected by lighting conditions, can be compensated by the PCD acquired by the LiDAR system. Note that the system structure of this technique is relatively simple because the RGB camera and LiDAR have the same viewpoint. In a previous study [22], we proposed a method to detect objects by combining detections from RGB images, a depth map, and a reflectance map using LiDAR FV representations. We verified the detection performance of this method in night environments where objects are darkened by shadows or relatively limited lighting. However, this method is still susceptible to occluded objects due to the limitations of the viewpoint. Using the map based on the LiDAR’s bird’s eye view (BEV) representation in Figure 1d, we can assume that occluded/truncated objects can be detected easily. However, there is a lack of research on the development of object detection algorithms that combine the LiDAR BEV representation and RGB images [23,24].
Thus, in this paper, by employing RGB images and LiDAR BEV representations, we propose a 2D object detection algorithm that is robust to environments in which objects are truncated or occluded. The proposed algorithm maintains the high accuracy of the existing FV representation-based method and compensates for the weaknesses of occluded objects using the LiDAR BEV representations. This structure combines the independent detection results obtained in parallel using an RGB image and a 2D height map converted from the BEV representations of the LiDAR point clouds.
Here, the “you only look once” (YOLO) network is adopted for each single detection modality based on a camera and LiDAR, and the intermediate detection result obtained using the LiDAR BEV representations is converted to an FV representation using a multilayer perceptron (MLP). After all viewpoints are matched to the front, the final decision-making phase determines the object via synthesis of each detection result from the camera and LiDAR. As evident from the proposed system’s performance evaluation with the KITTI autonomous driving dataset [25], the detection accuracy in the case of information fusion from PCD BEV representations is better than when only an RGB camera was used. We confirm that robustness is improved by enhancing detection accuracy significantly in complex environments, e.g., parking lots and roads with many vehicles. We also found that robustness was improved in occlusion cases.
In summary, when using an image viewed from the front, objects are detected accurately; however, detection performance deteriorates if the objects are occasionally occluded by constraints that depend on the viewpoint. In such cases, using the PCD BEV representations, it is possible to obtain a top view of the object such that overlapped objects can be separated when viewed from the front, and the occluded object can be better predicted. Existing methods are primarily used for 2D conversion of PCD BEV representations through perspective projection for 3D object detection. In this study, the PCD BEV representations are converted to a 2D height map and learned through YOLO. Then, the predicted detection results are converted to an image viewed from the front through the MLP.

2. Related Works

2.1. Preliminaries on YOLO

CNNs first appeared in 2012, and they have demonstrated improved performance compared to existing machine learning methods. In addition, an end-to-end learning-based object detection algorithm was proposed to extract and learn features from an image. State-of-the-art object detection algorithms are divided into two-stage [26,27,28] and single-stage algorithms using an R-CNN according to the detection stage. YOLO is a representative single-stage detector that predicts the bounding box and exhibits reliability for multiple classes. The existing two-stage detector performs object detection in a region of interest generated by a CNN in which an object may exist. In contrast, YOLO performs object detection at once by scanning the entire image.
The first version of YOLO, i.e., YOLOv1 [29], divides the input image into S × S grid cells, and each cell predicts the object present at the center of the cell, where B bounding boxes and their confidence scores are estimated. YOLO process for object detection is illustrated in Figure 2. The confidence score, S conf , is defined as Pr Object × IOU pred truth , where Pr Object is the probability that the cell contains an object in the predicted bounding box as described in Table 1, and IOU pred truth is the intersection of union (IOU) of the predicted bounding box and the ground truth. A certain cell i in the bounding box also predicts the conditional class probabilities, Pr ( Class i | Object ) , for C objects to determine which class the object in the bounding box belongs to. Finally, by multiplying the confidence scores S conf , which represent the fitness between bounding boxes and objects predicted by each cell and the conditional class probabilities Pr ( Class i | Object ) , the class-specific confidence score, CS conf , for B bounding boxes is calculated in Equation (1). This simultaneously predicts the class-specific confidence score and bounding boxes of the objects in the image.
CS conf = Pr Object × IOU pred truth × Pr Class i | Object = Pr Class i × IOU pred truth
YOLOv1 detects objects faster than other models in real time at a rate of 45 frames per second (fps); however, detection performance deteriorates when the size of the objects is small or when objects overlap. YOLOv2 [30] and YOLOv3 [31] were proposed to overcome this limitation, and these methods employ several strategies, e.g., multiscale learning, dimensional clusters, and anchor boxes, and they implement convolutional layers to improve detection performance for small objects.

2.2. Detecting Partially Occluded Objects

Most studies that have attempted to detect occluded objects are limited to using only an RGB camera. Methods that integrate potential variables [32,33] or split an input image [34] have been proposed to correctly find objects when parts of the image are hidden. However, such methods are limited to a specific detection model because they attempt to solve the problem through additional learning of an image in which occlusion/truncation exists without explicit analysis of the occluded object. In the literature [35], pixels containing an object that is blocked from the line of sight are found in the input image, and the object is detected by subdividing the histogram of oriented gradients (HOG), which represents the direction of their edges with a histogram at various viewpoints. Another method [36] creates a new bounding box map through the pixels included in the bounding box of the area affected by occlusion, and the generated map is utilized through binarization of each pixel value (depending on the existence of an object). Note that these methods are more effective than existing object detection techniques because they redefine the characteristics of the pixels in the area occluded by other objects. However, there are limitations in predicting the exact size of a hidden object using only the occluded image. From a different perspective, a previous study [37] proposed a method to predict an occluded object by converting the coordinates of the RGB image viewed from the top to those viewed from the front using the MLP. However, this method also only uses an RGB camera; thus, the detection performance deteriorates when it is influenced by external environmental factors, e.g., weather and lighting conditions. Therefore, a new technique is required to effectively detect objects partially blocked from sight without using only an RGB camera.

3. Methodology

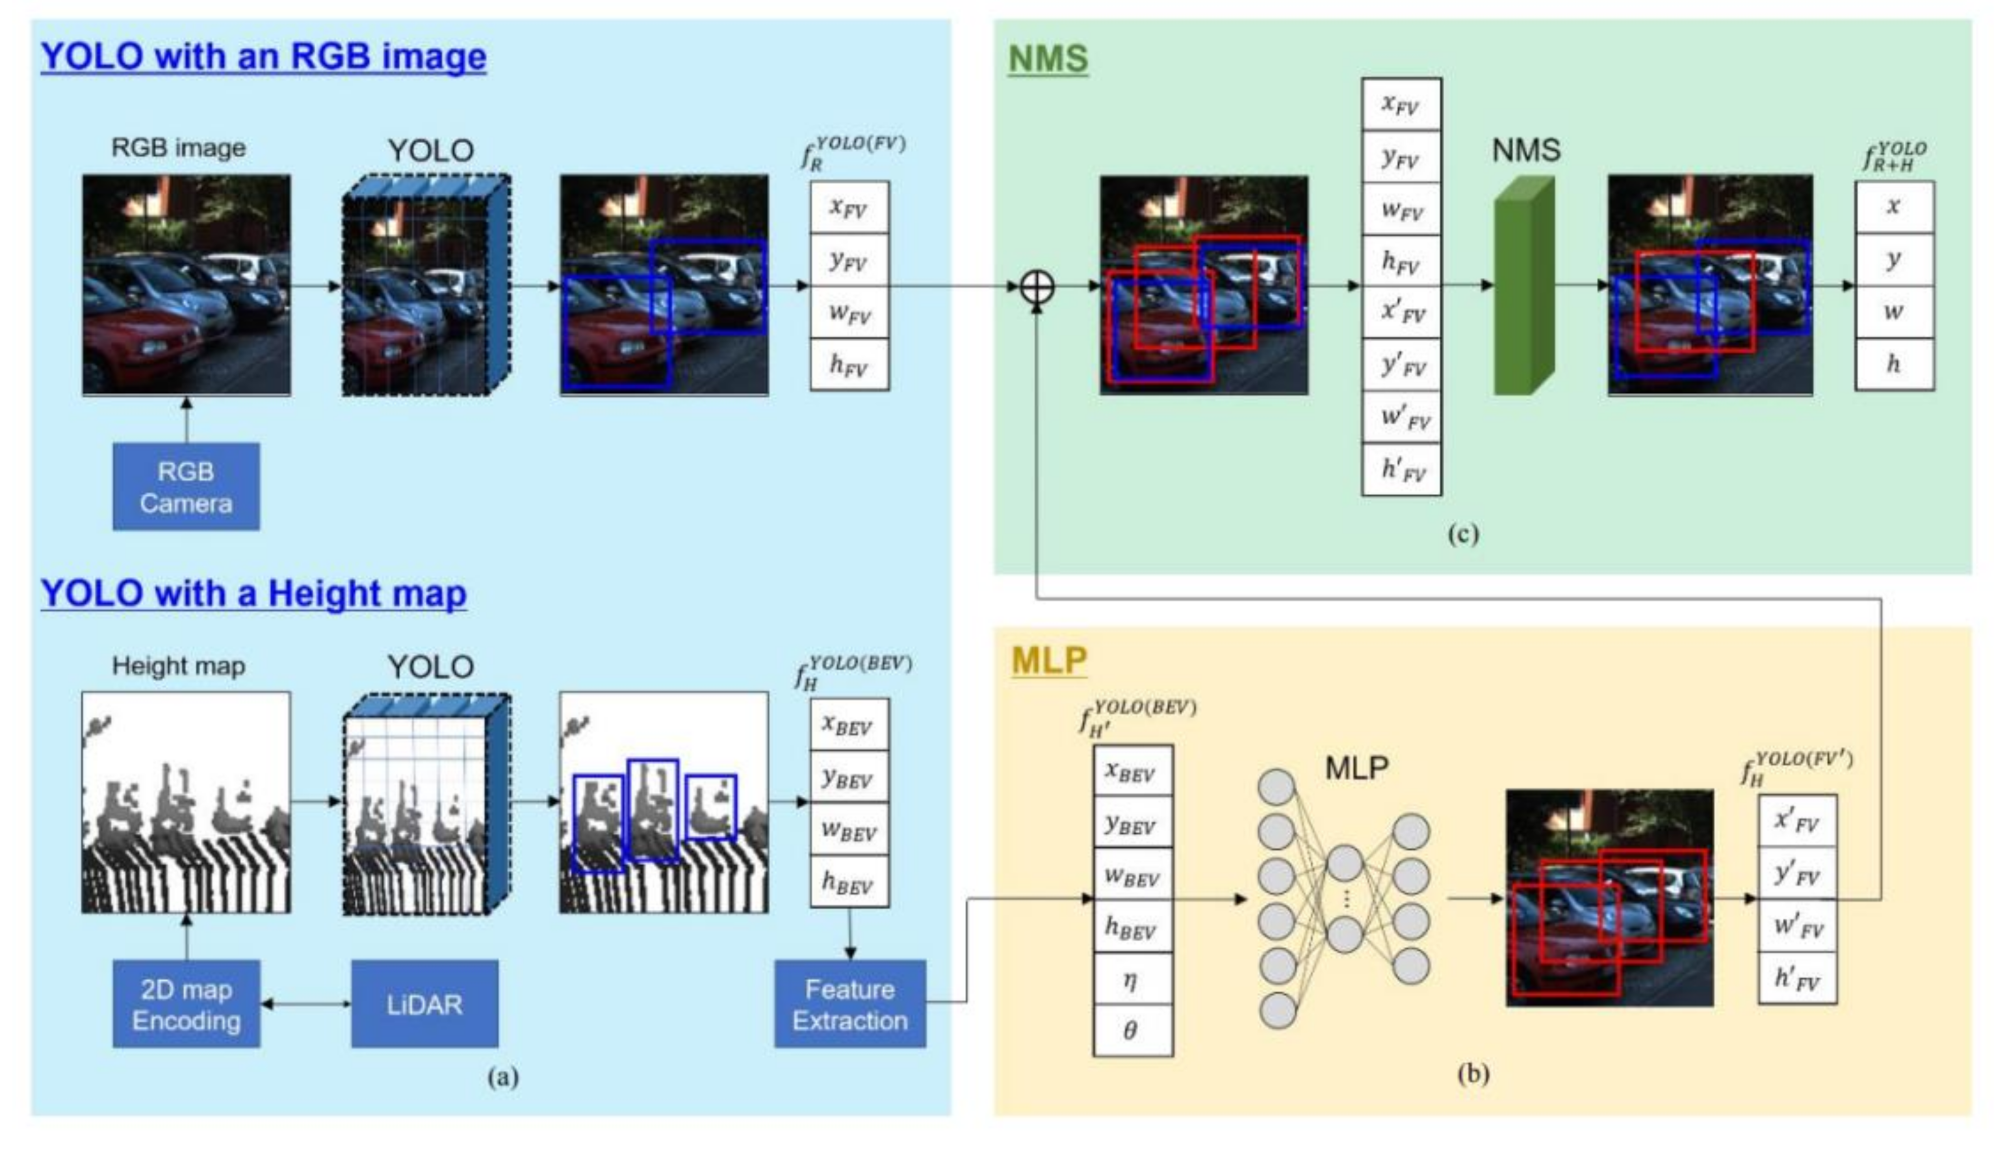
3.1. System Overview

The architecture of the proposed object detection system is shown in Figure 3. The proposed system comprises three modules for image data processing. As shown in Figure 3a, all objects in an image are detected in a parallel manner through the learned YOLOs based on the RGB image of FV and the PCD image of BEV, respectively. Here, each YOLO takes an FV RGB image and BEV LiDAR height map, which is encoded by height from the LiDAR PCD BEV representations and classified in terms of the viewpoint as input.
In Figure 3b, detections from the YOLO based on the PCD image of BEV are converted to FV through MLP. To convert the viewpoint of the bounding box obtained from YOLO through the height map to FV, additional features of the geometric information of the bounding box are applied to the MLP with f H YOLO BEV , which enables continuous convolution. The input of the MLP, i.e., f   H   YOLO BEV , comprises η ,   θ , which is the distance and angle between the LiDAR and the objects in the bounding box, and f H YOLO BEV , which is x BEV ,   y BEV ,   w BEV ,   h BEV , representing the predicted bounding box. The MLP is trained with the target of the bounding box in FV, and its output f H YOLO FV is the result of converting the viewpoint from BEV to FV represented as x FV ,   y FV ,   w FV ,   h FV .
Finally, as shown in Figure 3c, to optimize f R YOLO FV and f H YOLO FV , i.e., the predicted bounding boxes from multiviews of underlying entities, non-maximum suppression (NMS) is applied to concatenated bounding boxes to output f R + H YOLO , which is the final object detection result with reduced redundancy in terms of reliability. Here, ⊕ denotes an operation that stacks each detection comprising the geometric information x V ,   y V ,   w V ,   h V of a bounding box and its confidence score. Here, V refers to the viewpoint (either FV or BEV).

3.2. Object Detection Using YOLOs in Parallel

LiDAR represents the reflected laser signal as PCD with 3D position information according to the world coordinate system; therefore, it can be utilized at various points of view, unlike an RGB camera, which expresses an image only in FV. In particular, when PCD BEV representations are used, it is possible to detect nearly all objects that are not visible in FV due to occlusion, which enables the detection of objects at higher accuracy.
As shown in Figure 4a, LiDAR generates data in the form of a point cloud at the point where the laser signal is reflected in 3D space, and the data of the area included in the viewing angle of the RGB camera are separated and utilized as shown in Figure 4b. The extracted PCD are converted to a height map through pixelization based on the density of the xy-plane coordinates and encoding process based on the height value of the z-axis.
The world coordinate system of a 3D PCD is converted to a pixel coordinate system by dividing it into an m × n grid according to its density based on the xy-plane (Figure 4c). Here, to divide the data into a uniform grid, the area of the PCD is limited to 0 < x < 60   m and 30 < y < 30 m . The height value of the z-axis is encoded as intensity (0–255) of the pixel to the grid of xy-plane coordinates, as shown in Figure 4d,e. Finally, the PCD converted to the pixel coordinate system have the height of the corresponding grid as a pixel value, and the data are scaled to an m × n × 1 dimension according to its pixel value to generate the height map (Figure 4f).
The height map generated is applied to a single object detection model configured in parallel separately from the RGB image. The RGB image and height map are learned by targeting the FV and BEV bounding boxes in the pixel coordinate system, respectively, and the BEV bounding box is created by projecting the 3D bounding box of the world coordinate system to the pixel coordinate system of the height map. Here, each object detection model, i.e., a single YOLO, adjusts the parameters through a learning process that minimizes the IOU of the proposed and target bounding boxes in an area divided by an arbitrary grid. The original resolution of an RGB image is 1242 × 375 and the height map is scaled to a resolution of 416 × 416, depending on the viewpoint, and then divided into 13×13 grid cells. Here, each grid cell predicts the bounding box and its confidence score for an object whose center point is within the area of the cell. Each YOLO comprises 24 convolutional layers and two fully-connected layers, which output detection results, f R YOLO ( FV ) and f H YOLO BEV , respectively.

3.3. Conversion of Image Viewpoint Using MLP

To use the detection results of two different YOLOs together, a viewpoint transformation of the bounding box predicted from the YOLO based on the BEV height map is required. Thus, it is converted to FV through the MLP, and its output is defined as f MLP . Here, the MLP acts as a fitting function on the projection matrix to convert a BEV bounding box to an FV through nonlinear mapping. Generally, when using FV representations of PCD, the 3D world coordinate system of the PCD is converted to an RGB image coordinate via a perspective projection.
Therefore, it is necessary to convert f H YOLO BEV , i.e., the bounding box predicted by the YOLO with a height map, to an FV. Here, the MLP is trained with an input X BEV comprising the geometric features of the bounding box extracted with f H YOLO BEV and the FV bounding box, Y FV , as the target. X BEV and Y FV are defined in Equation (2), and [ x ,   y ,   w ,   h ] T represents the horizontal and vertical pixel coordinates, width, and height of the geometric center of the bounding box. Note that these parameters are normalized according to the image resolution.
X BEV   EVx BEV ,   y BEV ,   w BEV ,   h BEV ,   η ,   θ ] T Y FV = [ x FV ,   y FV ,   w FV ,   h FV ] T
Here, η and θ represent the distance and angle from the LiDAR to the bounding box, respectively, and these are features additionally extracted from its geometric center. Note that all of these parameters are normalized to a maximum value according to the image resolution, but exhibit different data distributions. Here, [ x ,   y ] T indicates the position of the center coordinate of the bounding box; thus its variance is greater than the variance of [ w ,   h ] T . In particular, when the bounding box is close to the lower left or upper right of the image plane, the deviation between x and y becomes quite large. Therefore, predicting [ x ,   y ] T indicating the center point of the bounding box among variables constituting Y FV is more difficult than [ w ,   h ] T , which indicates its size.
To solve this problem, f H YOLO BEV , i.e., the geometric information of the bounding box, and [ η ,   θ ] T , i.e., a feature that can express position information, are assigned to the input of the MLP such that a nonlinear mapping can be improved. It is used to help finely predict the position of the bounding box in the transformed FV. Here, the observation point is (0, 0.5) based on the image coordinates of f H YOLO , and [ η ,   θ ] T is defined as     η = ( x 0.5 ) 2 + y 2 , θ = tan a y x 0.5 . The MLP comprises a single hidden layer with 40 nodes and is trained using the Levenberg–Marquardt optimization scheme [38]. The network optimizes the connection parameter vector w ¯ R m × 1 in the direction of minimizing E w ¯ , which is the sum of the squares of the residual vector e ¯ w ¯ R n × 1 between the target t k and the network’s output, f MLP f H YOLO BEV , k , w ¯ .
E w ¯ = e ¯ ( w ¯ ) T e ¯ w ¯ = k = 1 n t k f MLP ( f H YOLO BEV , k , w ¯ ) 2
As a result, its update formula is expressed as follows.
Δ w ¯ = [ J r T w ¯ J r w ¯ + λ diag J r T w ¯ J r w ¯ ] ) J r T w ¯ e ¯ w ¯
Here, J r w ¯ is a Jacobian matrix defined by Equation (5), diag J r T w ¯ J r w ¯ is the diagonal term of the Hessian matrix and is a value representing curvature, and λ is a parameter to ensure the Hessian matrix is invertible.
J r w ¯ = e 1 w ¯ w 1 e 1 w ¯ w m e n w ¯ w 1 e n w ¯ w m
The Levenberg–Marquardt optimization method can solve the local minimum, which is a problem of gradient descent, by changing the attenuation constant λ according to the error reduction rate in the learning process. In addition, the network is optimized by reflecting the curvature in the process of updating the weights. In addition, through the product of λ and the diagonal terms of the Hessian matrix, an optimal solution can be found faster than the Levenberg learning algorithm, which slows convergence when λ increases [38].

3.4. Region Proposals through NMS

Region candidates are proposed based on the detections obtained from different sensors, i.e., f H YOLO FV and f R YOLO FV . Here, f R YOLO FV and f H YOLO FV are the detections obtained based on the data generated from different viewpoints; thus, their characteristics clearly differ. Therefore, an optimal bounding box is proposed using a late fusion structure that can exploit the advantages of FV and BEV. The region proposals estimated from the two sensors are applied to the NMS block, and the region of the object detected is finally determined according to Equation (6).
f R + H Y O L O = G N M S G Y O L O m a p R G M L P G Y O L O m a p H = G N M S [ ( f R Y O L O F V G M L P ( f H Y O L O B E V ) ) ] = G N M S [ f R Y O L O F V f H Y O L O ( F V ) ]
Here, G represents the input/output process in each model; m a p R and m a p H are color map and height map applied to a single object detection model, respectively; and refers to data concatenation.
This late fusion structure combines each decision output of detection models composed of multiple sensors. Thus, f YOLO + MLP is an optimized bounding box based on various proposals estimated from their respective single object detection models; f MLP is a region proposal that converts the object detection result with PCD BEV representations to FV. At this time, unlike the data acquired from an FV of the object, the height map can see the object to be detected from a top view, and thus, can separate all their bounding boxes. This enables the detection of obscured or partially occluded objects that are very difficult to detect in FV. Therefore, a late fusion structure of detection results of each single model can be both highly accurate in FV using an RGB camera, and robust to enable the detection of even occluded objects in a top view using a LiDAR.
The final region proposal is determined through NMS, which suppresses the bounding boxes of adjacent regions. The NMS sorts the detected bounding boxes in descending order according to their reliability, and then sequentially compares their IOUs to remove those having a value above a certain threshold. Therefore, if an object is detected multiple times in an adjacent area, all other bounding boxes are removed except the one having the highest confidence score. In the proposed system, the parameter for removing the bounding box of the adjacent area is set to 0.6.

4. Experimental Results

4.1. Assessment Details

An RGB camera image and PCD of the 64-channel Velodyne LiDAR in the KITTI dataset were used to train and evaluate the performance of the proposed system. Of the data containing 7481 image sequences, 45% were used for training, 15% for validation, and the remaining 40% for testing. The hardware used for learning included an Intel i7-8700 CPU, NVIDIA GTX 1080ti GPU (11 GB), and 32 GB of memory. The software environment comprised YOLOv3 (https://github.com/AlexeyAB/darknet (accessed on 15 May 2021)), Opencv 3.4.0, CUDA V10.1, and Cudnn v.7.6.4 on Ubuntu 16.04.5 (4.15.0–38 kernel). In addition, the average precision (AP), which is generally used as an object detection performance index, was used to evaluate the performance of the proposed system.
The labels in the KITTI dataset are divided into three difficulty levels, i.e., “Easy,” “Moderate,” and “Hard,” depending on the geometric size of the object to be detected and the degree to which a part of the object is occluded. The “Easy” level describes when all objects are fully visible and the pixel height is greater than 40. The “Moderate” level describes when only a part of the object is occluded and the pixel height is greater than 25, and the “Hard” level describes when the object is in higher occlusion state. The goal of the proposed strategy is to establish a robust system that can detect objects occluded by other objects while maintaining high detection performance based on RGB cameras. Therefore, the performance evaluation was performed according to the degree of difficulty. In addition, we examined whether the detection performance of invisible objects was enhanced using PCD.
To assess the proposed system’s overall level of object detection capability, a test evaluation was performed by changing the IOU threshold without classifying the difficulty level. In addition, to verify whether an occluded image could be detected, the detection ability in an environment where the object was occluded was evaluated by intentionally adding block noise to the FV image. According to the criteria of the KITTI evaluation metric [39], an evaluation based on vehicle detection difficulty was also performed by considering only the IOU of the final estimated bounding box and a ground truth of 0.7 or more. Here, the IOU values were changed to 0.3, 0.5, and 0.7 to evaluate the overall detection capability in the presence of block noise.

4.2. Evaluation Results

Based on the KITTI dataset, we compared f R YOLO FV , i.e., only an RGB camera, to f R + H YOLO , which is the proposed architecture, to evaluate the difficulty level. In addition, we conducted a comparative evaluation with existing detection systems with an RGB image and a LiDAR FV representation using YOLO [22,40]. To evaluate the difficulty level, we compared f R YOLO FV , i.e., only an RGB camera, to f R + H YOLO , which is the proposed design, using the KITTI dataset. In addition, we conducted a comparative evaluation with existing detection systems with an RGB image and a LiDAR FV representation using YOLO [22,40]. g R YOLO FV and h R YOLO FV are networks that use only RGB cameras, and g R + DR YOLO and h R + DR YOLO are networks that mix RGB images, and LiDAR depth and reflectance maps. Note that these systems are similar to the proposed detection scheme; however, the YOLO version differs. Nevertheless, YOLOv3 in the proposed framework has not been used in previous studies; thus, the existing methods [22,40] were used to estimate and compare the extent of performance improvement obtained by the proposed method compared to using only an RGB camera.
The results of the performance comparisons are summarized in Table 2. As can be seen, the proposed system, i.e., f R + H YOLO , demonstrates improved detection performance at all difficulty levels compared to f R YOLO FV . For each difficulty level, f R + H YOLO exhibited performance improvements of 0.05%, 1.89%, and 4.3%, compared to f R YOLO FV . In addition, g R + DR YOLO [40] and h R + DR YOLO [22] improved detection performance by ~2% for the “Hard” level compared to g R YOLO FV [40] and h R YOLO FV [22], which are intermediate results obtained using only an RGB camera. When comparing the improved detection rate of f R + H YOLO to g R + DR YOLO and h R + DR YOLO , we observe a difference of up to 4% (or greater). We found that as the difficulty level increased, f R + H YOLO enhanced performance by detecting objects that could not be detected with using only an RGB camera, i.e., f R YOLO FV and f H YOLO BEV are detections from different viewpoints that complement each other’s limitations to enhance detection performance.
Next, the object detection performance of f R YOLO FV and f R + H YOLO was compared using the entire KITTI dataset by changing the IOU threshold according to the Pascal VOC metric. To confirm the effectiveness of the proposed method based on the viewpoint conversion of LiDAR, comparisons with f R + DR YOLO , i.e., detections using a combination of f R YOLO FV and f DR YOLO FV , were conducted according to the literature [22]. Here, f DR YOLO FV is the estimated bounding box using the PCD FV representations, a distance and reflectance map represented as pixel values from LiDAR.
Following the test evaluation shown in Table 3, by changing the IOU threshold used for AP to 0.3, 0.5, and 0.7, f R + DR YOLO and f R + H YOLO , which also utilized LiDAR with the camera, outperformed f R YOLO FV regardless of the threshold value. In addition, f R + H YOLO with PCD BEV representations obtained the best performance. Accordingly, the method that utilizes PCD BEV representations when integrating an RGB camera and LiDAR can more effectively compensate for the shortcomings that occur when only RGB images are used, thereby effectively enhancing the detection performance of f R YOLO FV .
When the IOU was set to 0.7, the detection performance of f R + H YOLO was enhanced significantly compared to f R YOLO FV because objects that are difficult to detect from an FV were detected effectively with the help of the MLP. In the f R YOLO FV case, the confidence score of the estimated bounding box only increased when the objects were fully visible. However, when the objects were influenced by external environmental factors, their confidence score became low. Consequently, the IOUs between the ground truth and bounding box became relatively low. However, f H YOLO BEV can increase the reliability of the detected objects, which enhances the detection performance of f R + H YOLO . The results are shown in Figure 5, where Figure 5a,b shows the image in FV and height map in BEV with the bounding boxes at the two viewpoints detected through f R YOLO FV and f R + H YOLO , respectively. In the image in FV, blue represents the ground truth, and green represents the detected bounding box. In the height map in BEV, the PCD represent the objects, and the detected bounding boxes are shown in green. As shown in Figure 5b, when an object undetected by f R YOLO FV is complemented by the MLP and then detected, it is marked with a red bounding box.
Finally, to evaluate robustness to changes in the external environment, a test was performed by adding random block noises to the image. Here, the number of block noises was generated on a logarithmic scale of the number of bounding boxes detected in the corresponding image sequence, and the block size was set randomly in the range of the minimum and maximum values of the detected bounding boxes. On the image plane, the x-coordinate of the block, i.e., block x , was selected randomly in the range of the minimum and maximum values of the x-coordinates of the bounding boxes b . b x . The y-coordinate block y was set randomly in the range of the minimum value of the y-coordinate of the bounding boxes b . b y , divided in half and its maximum value to reflect a situation when the car was on the road; this is shown in Equation (7).
block x b . b x min ,   b . b y max   ,   block y [ b . b y min 2 ,   b . b y max ]
The evaluation results obtained with the block noises are shown in Figure 6, where the image attributes, i.e., the height map and bounding box, are the same as in Figure 5. We confirmed that detection is feasible with the help of PCD BEV representations even when the object to be detected is partly occluded when viewed from the front because it is very difficult to obtain complete information about an object in FV when it is partly occluded in a real environment. However, in BEV, there is a higher probability that all information about the object can be captured.

5. Conclusions

In this paper, we proposed a 2D object detection method to make autonomous driving more effective by integrating an RGB camera image and LiDAR PCD. The proposed system employs YOLO based on the FV image of the RGB camera and top view PCD of LiDAR for single object detection and then combines their respective results. The object detection model based on RGB images detects objects with images in FV and demonstrates superior detection performance; however, this technique is vulnerable to changes in external environment such as occlusions. Therefore, the proposed method performs an additional object detection process based on PCD in BEV using LiDAR to compensate for the weakness of the single RGB image-based object detection model.
The KITTI dataset was used to assess the extent to which the proposed system can detect objects, and a test evaluation was performed by varying the difficulty level and IOU threshold values. Additionally, the ability to detect objects in an occluded environment by intentionally adding block noise to the FV image was evaluated and compared to the existing single RGB-based object detection model. The results confirmed that object detection is feasible with the proposed method even when the target objects are partially occluded when viewed from the front, which demonstrates that the proposed method outperforms the conventional RGB-based model; in particular, it showed more than 4% higher object detection performance on “Hard” difficulty.
In the future, we plan to conduct research and experiments to supplement the detection performance of RGB cameras through BEV representation, even if low-resolution low-channel LiDAR is grafted into the FV representation system.

Author Contributions

Both authors took part in the discussion of the work described in this paper. All authors have read and agreed to the published version of the manuscript.

Funding

This work was supported by a National Research Foundation of Korea (NRF) grant funded by the Korea government (MOE) (No. 2018R1D1A3B07041729) and the Soonchunhyang University Research Fund.

Institutional Review Board Statement

Not applicable.

Informed Consent Statement

Not applicable.

Data Availability Statement

The data presented in this study are available on request from the corresponding author.

Acknowledgments

The authors thank the editor and anonymous reviewers for their helpful comments and valuable suggestions.

Conflicts of Interest

The authors declare that they have no competing interests.

References

  1. Yurtsever, E.; Lambert, J.; Carballo, A.; Takeda, K. A survey of autonomous driving: Common practices and emerging technologies. IEEE Access 2020, 8, 58443–58469. [Google Scholar] [CrossRef]
  2. Yang, Z.; Zhang, Y.; Yu, J.; Cai, J.; Luo, J. End-to-end multi-modal multi-task vehicle control for self-driving cars with visual perceptions. In Proceedings of the International Conference on Pattern Recognition (ICPR), Beijing, China, 20–24 August 2018; pp. 2289–2294. [Google Scholar]
  3. Bojarski, M.; Del Testa, D.; Dworakowski, D.; Firner, B.; Flepp, B.; Goyal, P.; Jackel, L.; Monfort, M.; Muller, U.; Zhang, X.; et al. End to end learning for self-driving cars. arXiv 2016, arXiv:1604.07316. [Google Scholar]
  4. Wu, X.; Sahoo, D.; Hoi, S.C. Recent advances in deep learning for object detection. Neurocomputing 2020, 396, 39–64. [Google Scholar] [CrossRef] [Green Version]
  5. Russakovsky, O.; Deng, J.; Su, H.; Krause, J.; Satheesh, S.; Ma, S.; Huang, Z.; Karpathy, A.; Khosla, A.; Bernstein, M.; et al. Imagenet large scale visual recognition challenge. Int. J. Comput. Vis. 2015, 115, 211–252. [Google Scholar] [CrossRef] [Green Version]
  6. Everingham, M.; Van Gool, L.; Williams, C.K.; Winn, J.; Zisserman, A. The pascal visual object classes (voc) challenge. Int. J. Comput. Vis. 2010, 88, 303–338. [Google Scholar] [CrossRef] [Green Version]
  7. Jackel, L.D.; Sharman, D.; Stenard, C.E.; Strom, B.I.; Zuckert, D. Optical character recognition for self-ervice Banking. ATT Tech. J. 1995, 74, 16–24. [Google Scholar] [CrossRef] [Green Version]
  8. Manghat, S.K.; El-Sharkawy, M. Forward Collision Prediction with Online Visual Tracking. In Proceedings of the IEEE International Conference on Vehicular Electronics and Safety (ICVES), Cairo, Egypt, 4–6 September 2019; pp. 1–5. [Google Scholar]
  9. Banerjee, S.S.; Jha, S.; Cyriac, J.; Kalbarczyk, Z.T.; Iyer, R.K. Hands off the wheel in autonomous vehicles?: A systems perspective on over a million miles of field data. In Proceedings of the Annual IEEE/IFIP International Conference on Dependable Systems and Networks (DSN), Luxembourg, 25–28 June 2018; pp. 586–597. [Google Scholar]
  10. Ren, L.; Yin, H.; Ge, W.; Meng, Q. Environment Influences on Uncertainty of Object Detection for Automated Driving Systems. In Proceedings of the 2019 12th International Congress on Image and Signal Processing, BioMedical Engineering and Informatics (CISP-BMEI), Huaqiao, China, 19–21 October 2019; pp. 1–5. [Google Scholar]
  11. Bagloee, S.A.; Tavana, M.; Asadi, M.; Oliver, T. Autonomous vehicles: Challenges, opportunities, and future implications for transportation policies. J. Mod. Transp. 2016, 24, 284–303. [Google Scholar] [CrossRef] [Green Version]
  12. Stocco, A.; Weiss, M.; Calzana, M.; Tonella, P. Misbehaviour prediction for autonomous driving systems. In Proceedings of the ACM/IEEE 42nd International Conference on Software Engineering, Seoul, Korea, 27 June–19 July 2020; pp. 359–371. [Google Scholar]
  13. Göhring, D.; Wang, M.; Schnürmacher, M.; Ganjineh, T. Radar/lidar sensor fusion for car-following on highways. In Proceedings of the International Conference on Automation, Robotics and Applications, Wellington, New Zealand, 6–8 December 2011; pp. 407–412. [Google Scholar]
  14. Liang, M.; Yang, B.; Wang, S.; Urtasun, R. Deep continuous fusion for multi-sensor 3d object detection. In Proceedings of the European Conference on Computer Vision (ECCV), Munich, Germany, 8–14 September 2018; pp. 641–656. [Google Scholar]
  15. Yoneda, K.; Suganuma, N.; Yanase, R.; Aldibaja, M. Automated driving recognition technologies for adverse weather conditions. IATSS Res. 2019, 43, 253–262. [Google Scholar] [CrossRef]
  16. Royo, S.; Ballesta-Garcia, M. An overview of lidar imaging systems for autonomous vehicles. Appl. Sci. 2019, 9, 4093. [Google Scholar] [CrossRef] [Green Version]
  17. Chen, X.; Ma, H.; Wan, J.; Li, B.; Xia, T. Multi-view 3d object detection network for autonomous driving. In Proceedings of the IEEE conference on Computer Vision and Pattern Recognition, Honolulu, HI, USA, 21–26 July 2017; pp. 1907–1915. [Google Scholar]
  18. Liang, M.; Yang, B.; Chen, Y.; Hu, R.; Urtasun, R. Multi-task multi-sensor fusion for 3d object detection. In Proceedings of the IEEE/CVF Conference on Computer Vision and Pattern Recognition, Long Beach, CA, USA, 16–20 June 2019; pp. 7345–7353. [Google Scholar]
  19. Kumar, G.A.; Lee, J.H.; Hwang, J.; Park, J.; Youn, S.H.; Kwon, S. LiDAR and camera fusion approach for object distance estimation in self-driving vehicles. Symmetry 2020, 12, 324. [Google Scholar] [CrossRef] [Green Version]
  20. Zhao, K.; Liu, L.; Meng, Y.; Gu, Q. Feature Deep Continuous Aggregation for 3D Vehicle Detection. Appl. Sci. 2019, 9, 5397. [Google Scholar] [CrossRef] [Green Version]
  21. Lingtao, Z.; Jiaojiao, F.; Guizhong, L. Object Viewpoint Classification Based 3D Bounding Box Estimation for Autonomous Vehicles. arXiv 2019, arXiv:1909.01025. [Google Scholar]
  22. Kim, J.; Cho, J. Exploring a multimodal mixture-of-YOLOs framework for advanced real-time object detection. Appl. Sci. 2020, 2, 612. [Google Scholar] [CrossRef] [Green Version]
  23. Felzenszwalb, P.F.; Girshick, R.B.; McAllester, D.; Ramanan, D. Object detection with discriminatively trained part-based models. IEEE Trans. Pattern Anal. Mach. Intell. 2009, 32, 1627–1645. [Google Scholar] [CrossRef] [PubMed] [Green Version]
  24. Dalal, N.; Triggs, B. Histograms of oriented gradients for human detection. In Proceedings of the IEEE Computer Society Conference on Computer Vision and Pattern Recognition (CVPR), San Diego, CA, USA, 20–16 June 2005; pp. 886–893. [Google Scholar]
  25. Geiger, A.; Lenz, P.; Stiller, C.; Urtasun, R. Vision meets robotics: The kitti dataset. Int. J. Robot. Res. 2013, 32, 1231–1237. [Google Scholar] [CrossRef] [Green Version]
  26. Girshick, R.; Donahue, J.; Darrell, T.; Malik, J. Rich feature hierarchies for accurate object detection and semantic segmentation. In Proceedings of the IEEE Conference on Computer Vision and Pattern Recognition, Columbus, OH, USA, 23–28 June 2014; pp. 580–587. [Google Scholar]
  27. Girshick, R. Fast r-cnn. In Proceedings of the IEEE International Conference on Computer Vision, Santiago, Chile, 7 December 2015; pp. 1440–1448. [Google Scholar]
  28. Ren, S.; He, K.; Girshick, R.; Sun, J. Faster R-CNN: Towards real-time object detection with region proposal networks. IEEE Trans. Pattern Anal. Mach. Intell. 2016, 39, 1137–1149. [Google Scholar] [CrossRef] [PubMed] [Green Version]
  29. Redmon, J.; Divvala, S.; Girshick, R.; Farhadi, A. You only look once: Unified, real-time object detection. In Proceedings of the IEEE Conference on Computer Vision and Pattern Recognition, Las Vegas, NV, USA, 27–30 June 2016; pp. 779–788. [Google Scholar]
  30. Redmon, J.; Farhadi, A. YOLO9000: Better, faster, stronger. In Proceedings of the IEEE Conference on Computer Vision and Pattern Recognition, Honolulu, HI, USA, 21–26 July 2017; pp. 7263–7271. [Google Scholar]
  31. Redmon, J.; Farhadi, A. Yolov3: An incremental improvement. arXiv 2018, arXiv:1804.02767. [Google Scholar]
  32. Vedaldi, A.; Zisserman, A. Structured output regression for detection with partial truncation. In Proceedings of the Advances in Neural Information Processing Systems, Vancouver, BC, Canada, 7–10 December 2009; pp. 1928–1936. [Google Scholar]
  33. Wang, X.; Han, T.X.; Yan, S. An HOG-LBP human detector with partial occlusion handling. In Proceedings of the IEEE International Conference on Computer Vision, Kyoto, Japan, 27 September–4 October 2009; pp. 32–39. [Google Scholar]
  34. Gao, T.; Packer, B.; Koller, D. A segmentation-aware object detection model with occlusion handling. In Proceedings of the IEEE Computer Society Conference on Computer Vision and Pattern Recognition (CVPR), Washington, DC, USA, 20–25 June 2011; pp. 1361–1368. [Google Scholar]
  35. Pepikj, B.; Stark, M.; Gehler, P.; Schiele, B. Occlusion patterns for object class detection. In Proceedings of the IEEE Conference on Computer Vision and Pattern Recognition, Washington, DC, USA, 23–28 June 2013; pp. 3286–3293. [Google Scholar]
  36. Kim, J.U.; Kwon, J.; Kim, H.G.; Lee, H.; Ro, Y.M. Object bounding box-critic networks for occlusion-robust object detection in road scene. In Proceedings of the IEEE International Conference on Image Processing (ICIP), Athens, Greece, 7–10 October 2018; pp. 1313–1317. [Google Scholar]
  37. Palazzi, A.; Borghi, G.; Abati, D.; Calderara, S.; Cucchiara, R. Learning to map vehicles into bird’s eye view. In Proceedings of the International Conference on Image Analysis and Processing, Catania, Italy, 11–15 September 2017; pp. 233–243. [Google Scholar]
  38. Chen, T.; Han, D.; Au, F.; Than, L. Acceleration of Levenberg-Marquadt training of neural networks with variable decay rate. IEEE Trans. Neural Netw. 2003, 3, 1873–1878. [Google Scholar]
  39. Geiger, A.; Lenz, P.; Urtasun, R. Are we ready for autonomous driving? the kitti vision benchmark suite. In Proceedings of the IEEE Conference on Computer Vision and Pattern Recognition, Washington, DC, USA, 18–20 June 2012; pp. 3354–3361. [Google Scholar]
  40. Asvadi, A.; Garrote, L.; Premebida, C.; Peixoto, P.; Nunes, U.J. Multimodal vehicle detection: Fusing 3D-LIDAR and color camera data. Pattern Recognit. Lett. 2018, 115, 20–29. [Google Scholar] [CrossRef]
Figure 1. RGB image and PCD map in FV and BEV: (a) RGB image, (b) LiDAR depth map in FV, (c) LiDAR height map in FV, (d) and LiDAR height map in BEV.
Applsci 11 06016 g001
Figure 2. YOLO process for object detection: (a) the image is divided into S × S grid cells, (b) predicted bounding boxes and their confidence scores, (c) probability map with class-specific confidence scores, and (d) detected objects and classifications.
Applsci 11 06016 g002
Figure 3. Architecture of proposed object detection system: (a) detect objects in parallel structure comprising a set of single YOLO modalities, (b) convert bounding boxes to the same viewpoint using MLP, and (c) converge detection results based on NMS.
Applsci 11 06016 g003
Figure 4. Process of conversion to height map: (a) 3D PCD, (b) PCD extraction from the RGB camera’s point of view, (c) pixelization, (d) single channel encoding, (e) scaling by height value, and (f) converted height map.
Applsci 11 06016 g004
Figure 5. Comparison of object detection performance under normal condition by (a) f R YOLO FV and (b) f R + H YOLO .
Applsci 11 06016 g005
Figure 6. Comparison of object detection performance when block noise is applied by (a) f R YOLO FV and (b) f R + H YOLO .
Applsci 11 06016 g006
Table 1. Confidence scores according to the probability of YOLO.
ProbabilityCaseConfidence Score
Pr Object = 0 If the bounding box is included in the background area S c o n f = 0
Pr Object = 1 If the bounding box is included in the area where the object exists S c o n f = I O U p r e d t r u t h
Table 2. Comparative evaluation according to difficulty level.
Detection
Model
YOLO
Version
Viewpoint2D AP (%)
Difficulty (IOU = 0.7)
EasyModerateHard
g R YOLO FV   [40]V2
V2
FV73.9361.6954.00
g R + DR   YOLO [40]FV75.1362.7455.10
h R YOLO FV   [22]V2FV88.7876.2050.77
h R + DR   YOLO [22]V2FV90.8981.6752.78
f R YOLO FV V3FV95.0187.5277.43
f R + H YOLO V3FV + BEV95.0689.4181.73
Table 3. Performance comparisons for entire KITTI dataset.
Detection
Model
YOLO
Version
Viewpoint2D AP (%)
IOU Threshold
0.30.50.7
f R YOLO FV V3FV87.6785.8972.56
f R + DR YOLO FV88.1786.4073.58
f R + H YOLO FV+BEV89.5988.0776.06
f R YOLO FV   (noise)FV86.4784.5269.90
f R + H YOLO   (noise)FV+BEV89.1187.4373.14
Publisher’s Note: MDPI stays neutral with regard to jurisdictional claims in published maps and institutional affiliations.

