Featured Application
Multi-channel ultrasound platform for research in volumetric imaging with matrix arrays.
Abstract
Volumetric ultrasound imaging is of great importance in many medical fields, especially in cardiology, but also in therapy monitoring applications. For development of new imaging technologies and scanning strategies, it is crucial to be able to use a hardware platform that is as free and flexible as possible and does not restrict the user in his research in any way. For this purpose, multi-channel ultrasound systems are particularly suitable, as they are able to control each individual element of a matrix array without the use of a multiplexer. We set out to develop a fully integrated, compact 1024-channel ultrasound system that provides full access to all transmission parameters and all digitized raw data of each transducer element. For this purpose, we synchronize four research scanners of our latest “DiPhAS” ultrasound research system generation, each with 256 parallel channels, all connected to a single PC on whose GPUs the entire signal processing is performed. All components of the system are housed in a compact, movable 19-inch rack. The system is designed as a general-purpose platform for research in volumetric imaging; however, the first-use case will be therapy monitoring by tracking radiation-sensitive ultrasound contrast agents.
1. Introduction
Ultrasound imaging has been established in medical diagnostics for many decades. Most ultrasound systems in use today still use 2D imaging techniques, which reconstruct a two-dimensional ultrasound image by acquiring multiple lines of a body region. Newer devices increasingly use 3D imaging methods that capture cross-sectional images of a ROI at many different angles. This technique is used in a variety of different diagnostic fields. In addition to obstetrics, gynecology and urology, 3D imaging has its main applications in cardiology, but also in ophthalmology, angiology and many more. The main advantages are that 3D ultrasound allows visualization of the entire structure of an organ, the user needs to be less experienced in its use, the repeatability of an ROI examination and the possibility of easy fusion with other imaging modalities [1].
Early technological solutions used freehand but tracked 2D imaging and subsequent volumetric reconstruction [2] or mechanically moved convex 2D imaging probes scanning a fixed region at low volumetric imaging rates [3]. In recent developments in the field of 3D ultrasound research, multi-channel systems are applied often in conjunction with matrix arrays. Using fully addressed matrix array transducers, this method represents the most flexible solution for the development of new beamforming algorithms through electronic sound beam control. Because each element of the ultrasound array can be controlled directly by the multi-channel electronics, without the use of a multiplexer, high-speed, real-time measurements and fast volumetric imaging with significantly reduced motion artifacts are possible. Although technologies such as micro-beamforming, using subgroups of elements [4,5], or row and column addressing of transducers [6,7] greatly reduce the complexity and cost of the electronics required in a final product, the development of new applications is most freely assured by the use of multi-channel system platforms with full access to all transducer elements. However, those systems are not only well suited for researching new 3D imaging techniques but also for characterizing multi-element array geometries. The knowledge gained from the research using fully addressed matrix arrays can subsequently be transferred to cost effective hardware concepts to be used in products.
Several 1024-channel multi-channel platforms have been presented in the past, which allow the use of a matrix array [8,9,10,11]. Often these systems are very complex using multiple linked ultrasound research systems that cannot be controlled by a single computer. This complicates the possibilities for programming and processing as well as performing clinical research regarding basic safety for patients and users using such an experimental setup.
For this reason, we developed a highly integrated multi-channel ultrasound platform with the focus on achieving the most compact design possible, including completely open access to the parameterization of the system and to all digitized data of the individual transducer elements. This system enables custom matrix array beamforming and processing research while focusing on medical safety principles to evaluate new technologies in clinical studies. Derived from our requirements and goals, we concluded the specification shown in Table 1.

Table 1.
Features of the 1024-channel DiPhAS 1.
The implementation of the 1024-channel platform is based on four in-house developed, synchronized multi-channel systems of the latest generation, called DiPhAS (Digital Phased Array System) [12], which have already been used successfully for many years in the field of medical technology, but also in industrial applications. The platform is comparable to other open ultrasound research systems [13], such as Vantage 256 (Verasonics Inc., Kirkland, WA, USA) [14] and ULA-OP 256 (University of Florence) [15].
Two different 1024-element matrix arrays are used for the evaluation, one developed in-house and one commercial from the manufacturer Vermon in France (also used by other researchers [9,10,14]).
The platform was developed as part of the EU Amphora project, which focuses on radiation therapy dosimetry. Here, volumetric imaging is used to monitor prostate cancer therapy by detecting the acoustic properties and distribution of radiation-sensitive ultrasound contrast agents in and around a tumor.
2. Materials and Methods
2.1. System Architecture
An ultrasound measurement hardware usually consists of three components: A transducer, which converts electrical signals into sound waves and vice versa. Electronics can be used to excite the piezoelectric elements of the transducer to oscillate and, conversely, to amplify, digitize and pre-process small received signals. Finally, the data are transferred to a PC, where the main data processing, image reconstruction, visualization and analysis takes place.
In order to realize the volumetric imaging, we used 1024-element matrix arrays, which can be controlled individually via the developed, fully integrated 1024-channel electronics. The transmit and receive beamforming was performed by a single PC, which was installed together with the four ultrasound electronics units into a single rack housing (Figure 1).
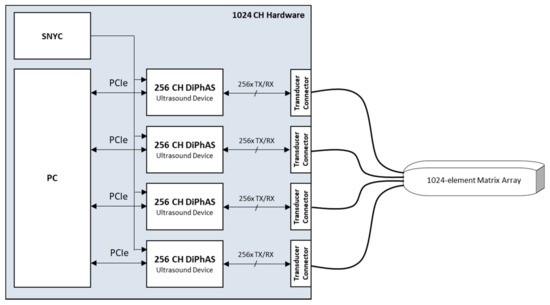
Figure 1.
Simplified system architecture of the overall 1024-channel platform.
The 1024-channel ultrasound electronics consist of four DiPhAS ultrasound research systems, each of which integrates 256 parallel transmitter and receiver elements. A dedicated timing circuit ensures high-precision synchronicity between the individual sub-systems for transmit signal generation and parallel echo detection. Each of the four systems is connected to the PC via a PCIe interface. To connect the ultrasound transducer there are four connectors of the type ITT Cannon DLM6-360. Transducers with other pin assignments or connectors can be adapted via pin-out converters.
2.2. Transducer
In view of a future use of the system not only as a general purpose ultrasound research platform but with special focus on prostate therapy monitoring by tracking of radiation-sensitive ultrasound contrast agents [16,17], in the context of the AMPHORA project, a transducer with optimized footprint for transperineal imaging was developed. This transducer was used for a first characterization of the multichannel electronics. Typical matrix transducers show small footprints to fulfill the λ/2 criterion for optimized beam-steering capability, which leads to low penetration depths. For the application of therapy monitoring through the perineal window, a high penetration and imaging depth is necessary while accepting smaller beam-steering angles.
Therefore, the perineal window and the number of available channels define the maximum rectangular footprint of the aperture. With the target dimension of 30 mm × 20 mm given by the planned perineal application and 1024 dedicated channels, a pitch of 770 µm, corresponding to 2λ at a center frequency of 4 MHz, results in 26 elements in the elevation direction and 39 elements in the lateral direction. Sound field simulations with our proprietary point source synthesis simulation software “SCALP” were performed to optimize the array geometry. For optimized oscillation modes, FEM simulations suggested a 3 × 3 sub dicing on each element. For further enhanced energy transfer, the acoustic stack was processed on a syntactic foam backing with flex printed circuits to connect through it. To get full advantage of multi-channel capabilities each transducer element is connected to an individual electronics channel via four separated 256-core micro coax cables. Two FEM optimized matching layers were applied for improved bandwidth and energy transfer, which is crucial in the foreseen therapy monitoring application.
Beyond the targeted clinical application, a commercial matrix array probe made by the French company Vermon with 32 × 32 elements was also used to characterize the volumetric ultrasound platform. The transducer has a center frequency of 2.8 MHz and a pitch of 300 µm. The aperture has a footprint size of 9.6 mm × 9.6 mm.
2.3. Multi-Channel Electronics
Each of the four 256 channel ultrasound systems is modular in design (Figure 2). They consist of 16 front-end boards, which integrate 16 transmit and receive channels each; a main board, which handles the entire control and data management of the sub-system; a transducer connector board, which collects the individual signal lines of the front-end boards and leads them to a transducer connector; as well as a power supply developed in-house.
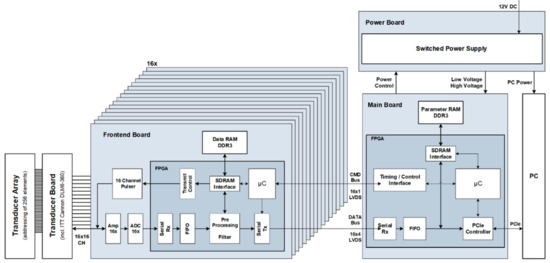
Figure 2.
System architecture of a single 256-channel unit.
2.3.1. Main Board
The main board is the central control unit of each 256-channel sub-system. It integrates a high-performance Virtex-6 FPGA with internal MircroBlaze soft processor, which is responsible for a wide range of tasks. The FPGA handles communication with the PC; receives, interprets, acknowledges and manages incoming commands; and parameterizes the transmit and receive circuits on the front-end boards accordingly.
In the receiving phase, the digitized data of all 16 front-end boards are parallelized in the FPGA of the main board, synchronized, buffered and then transferred to the PC at high transmission speeds. For this purpose, a PCIe interface of the 2nd generation with 8 lanes per sub-system was implemented, with which it is possible to realize transfer rates of up to 25 Gbit/s per 256-channel sub-system. In total, the data of the four sub-systems are connected with an overall bandwidth of 100 Gbit/s to a single PC, which computes the actual signal processing, reconstruction and visualization.
Parallel to the PCIe interface for general communication and data transfer, a bidirectional serial interface was also implemented, which can be optionally used for debugging or for service purposes for controlling a sub-system.
In order to be able to ensure communication between the individual front-end FPGAs and the main board FPGA, a custom bidirectional data bus with a special transmission format was developed. Each front-end FPGA is connected to the FPGA of the main board via a total of 5 LVDS line pairs. One of these line pairs serves as a so-called CMD bus, through which commands are transferred from the MicroBlaze (running at 100 MHz) of the main board to the FPGAs of the front-end boards. At the same time the bus is used to synchronize the transmit/receive phases, controlled by the main board FPGA. In the opposite direction, four LVDS line pairs per front-end board are used as a DATA bus, in order to be able to transport not only status information but also above all the digitized data of the 16 receive channels to the main board FPGA at high transfer rates.
Physically, a total of 16 slots are provided on the main board, into which the front-end boards are plugged via card-edge connection. When using 16-channel front-end boards, up to 256 parallel send and receive channels are addressed per sub-system.
In addition to the parameterization of the transmit and receive characteristics and the data management on the receive side, the main board is also responsible for the synchronization of the 256 parallel channels of the sub-system. A high-precision clock network was set up for this purpose. When digitizing ultrasound signals, the choice of a suitable clock is essential in order not to affect the performance of the receiver’s A/D converters. To ensure a high resolution, the applied clock must have only small phase variations. However, clocks generated by an FPGA are generally subject to comparatively high phase fluctuations. Therefore, two 14-channel clock generators of the type AD9523 from the manufacturer Analog Devices are used on the main board, which have an extremely low broadband jitter < 100 fs; i.e., they can generate very clean clocks. Each of the two clock generators integrates two PLLs and a clock distributor. To reduce phase noise and thus improve the signal-to-noise ratio at the A/D converter, an external, frequency-stable, voltage-controlled crystal oscillator (VCXO) is used to generate a clock of 80 MHz. A reference frequency of 20 MHz is applied to the input of the clock generators, which is generated by a VCO and fed via a clock distributor to the two clock generators and as a system clock to the FPGA of the main board. Both PLLs generate eight in-phase 80 MHz clocks each, synchronized to the input clock, which are routed via LVDS lines to the individual A/D converters on the front-end boards (Figure 3). In the layout, conscious care was taken to ensure that the signal line lengths to the individual front-end interfaces are practically identical.
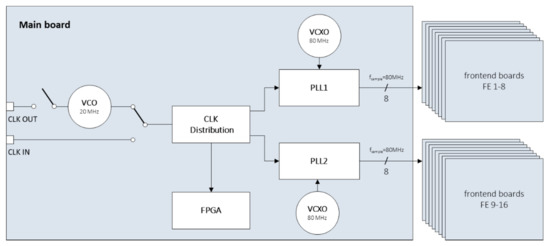
Figure 3.
Circuit for internal clock generation of each 256-channel sub-system.
The main board provides both input and output triggers. The input trigger allows the ultrasound system to be controlled by an external device. Thus, the ultrasound system starts a send/receive event or sequence only if a trigger signal is present. The input trigger is sampled with a frequency of 1 MHz. The output trigger works the other way around. Here, the ultrasound system generates a trigger signal (resolution of 120 MHz) for each send/receive event or sequence and thus controls an external device. Both input and output are decoupled via optocouplers and operate at +5 V TTL levels. Since the required pulse width may vary from application to application, it is possible to define the pulse width of the trigger by the firmware and software.
The logic contents of the FPGA are stored in a flash device, which is programmable via a JTAG interface. At the power-on moment, an initialization routine configures the main board FPGA. During this time, the FPGA has no function yet and an additional PLD was installed, which has its logic content directly after the supply voltage is switched on and already serves basic functionalities.
In order to be prepared for future tasks, the main board has two card edge connectors, which can be used to connect PCBs to the system that can perform additional functions. The add-on cards can be controlled by the main board FPGA via a 19-bit address and 16-bit data bus. In addition, a large number of other control signals as well as some connection lines to the PLD are connected to the interface.
2.3.2. Front-End Boards
The front-end board integrates the analog/digital interfaces for a total of 16 parallel transmit and receive circuits each. A Spartan-6 FPGA with integrated MicroBlaze soft processor (running at 50 MHz) is used for control and data processing. The front-end FPGA, synchronized and controlled by the main board FPGA, handles the entire timing of a scan, such as pulse-echo measurement. For this purpose, a corresponding state machine consisting of reset, initialization, transmit and receive phases (user configurable), as well as a wait state, was implemented.
The logic contents of the front-end FPGAs are stored centrally in a flash device on the main board, which is programmable via a JTAG interface. At the moment of switch-on, an initialization routine configures the front-end FPGAs in the way the main board does.
The parameterization of a scan is done via the programming and user interface of the PC software. Commands are generated for each channel based on the user’s input, describing the transmit and receive properties in detail. These commands are transmitted to the corresponding individual sub-systems via four PCIe interfaces. On each 256-channel sub-system, the commands are first managed by the main board FPGA and forwarded to the corresponding front-end FPGAs. There, the commands are interpreted by the integrated MicroBlaze soft processor and the sequence control characteristics and the transmit signals of each channel are programmed according to the user-defined settings.
To store the transmit patterns, a separate FPGA internal block RAM (16 × 2048 bit) is used for each channel. This has the advantage that during the transmission phase a signal can be read out individually from the memory for each channel at different times. Thus, it is possible to first count down the coarsely resolved delay values, which are stored in a separate internal block RAM (16 × 1024 bit) per channel, using a 60 MHz clock accuracy. After this, the actual transmit signal is read out from the transmit memory at a clock rate of 120 MHz and routed to the external pulser output stages via 4:1 serializers at a high clock rate of 480 MHz. To realize a high delay resolution, a specially developed sorting algorithm is used. In addition to the coarse delay already counted down, this algorithm shifts the transmit signal read from the memory by several 120 MHz clocks, depending on the delay set, before the signal is then clocked out at high resolution by the serializers at the I/O interfaces. Shift operators and an AND gate are used in the FPGA for this purpose. This principle allows a high delay resolution of 2 ns to be achieved. In total, transmit patterns with up to 32 µs signal length can be stored in the transmit memories per channel, together with a total of 1024 different delay values.
The pulser output stages are capable of generating rectangular tristate burst signals that can be programmed in frequency, amplitude, number of cycles and delays per channel. A total of eight MAX4940s from the manufacturer Maxim Integrated are used as pulser output stages per front end, each integrating four transmit channels per chip. Each transmit output stage consists of a transistor circuit that switches through either a positive or a negative DC high voltage, depending on the digital control of the Spartan-6 FPGA (Figure 4, Figure 5 upper part). The voltage level can be set up to +/−100 V for all channels together. To increase the output current per channel to a maximum of 4 A, two outputs are always connected together. This also allows a higher frequency excitation of the ultrasound transducer. In total, a front-end board integrates 16 parallel transmit channels.
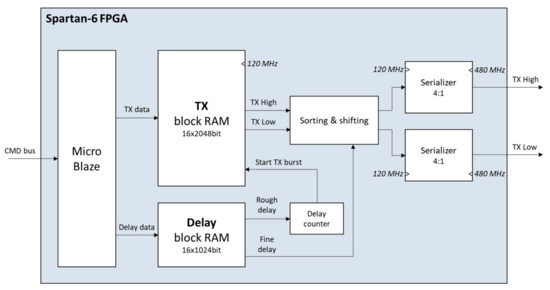
Figure 4.
Simplified design of the front-end TX firmware.
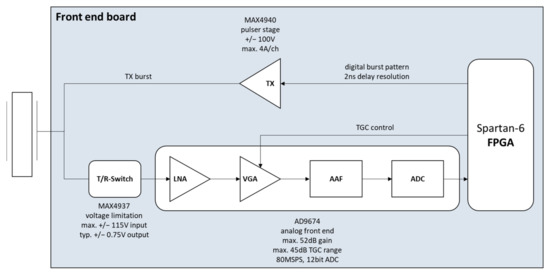
Figure 5.
Simplified TX/RX channel on the front-end board.
In the receive path (Figure 5, lower part), a T/R switch is used to protect the sensitive input circuits from too high voltages of the transmit power stages. Each front end uses two MAX4937s from Maxim Integrated, each integrating eight channels and designed for transmit voltages up to +/−115 V. The transmit voltages are limited by the integrated diode bridges in such a way that only +/−0.75 V is present at the output of the component, which is completely uncritical for the input amplifiers of the receiver. Followed behind the T/R switches are analog anti-aliasing filters that can be equipped with different values depending on the application. Then, two AD9674 devices from Analog Devices are used to process the analog receive signals. Each of them features eight receive channels, including a low-noise preamplifier, a voltage-controlled attenuator, a post-amplifier, programmable filters consisting of a high-pass/low-pass combination and an A/D converter.
The receiver gain can be set to a maximum of 52 dB. The voltage-controlled attenuator allows a Time Gain Control (TGC) to be implemented in a range of up to 45 dB. To realize this, the attenuators are controlled by a TGC curve defined using up to 1024 supporting values, which specifies how high the amplification factor should be at which time. The TGC curve is generated centrally by the FPGA on the main board and is routed differentially to the individual front-end boards via a 12-bit digital-to-analog converter and a high-frequency output driver.
The amplifiers are followed by a programmable high-pass/low-pass filter combination implementing a band-pass behavior. The maximum adjustable cut-off frequencies are mainly dependent on the sampling frequency of the following analog-to-digital converter. However, the device offers the additional option of bypassing the integrated high-pass filter. As a result, the lower cutoff frequency can be reduced to 300 kHz.
After filtering, the received signals are digitized. The analog-to-digital converter is operated with a sampling rate of 80 MSPS and 12-bit of resolution. The digitized data of the 16 channels are transmitted via LVDS lines to the Spartan-6 FPGA, parallelized for internal preprocessing, extended to a 16-bit data type, sorted and then buffered in 2 × 4 Gbit DDR3 RAMs (32 million samples per channel). Depending on the sampling rate requirements, an accumulation of the data with a factor of two or four is possible, reducing the resulting sampling rate while increasing the signal-to-noise ratio. After that, the data of all the front ends are transferred to the main board, where they are sorted again and then transferred via the PCIe interface to the PC using direct memory access (DMA).
2.3.3. Power Supply
A modular power supply, designed for a 12 V input source, guarantees a sufficient supply for the individual components of each sub-system. The power board integrates four different modules to generate all the voltages required for ongoing acquisition operation. In total, the power supplies of each of the four sub-units provide up to 250 W of power. In addition, there are modules that serve as a basic supply, providing only low currents, but are immediately available after the system is switched on (12 V at max. 2 A and 3.3 V at max. 3 A). A Lattice PLD and an Atmel microcontroller are responsible for control and voltage monitoring, especially during the power-up procedure. The individual voltage supply modules use voltage regulators from the manufacturer Texas Instruments with programmable properties. Thus, up to four different voltages can be generated per module. On two modules for the main supply of the ultrasound platform, the so-called LV modules (LV = low voltage), three different voltages are provided. The first module generates the voltages 1.2 V, 1.5 V and 2.5 V, the second one the voltages 1.0 V, 1.8 V and 3.3 V. All voltages are rated at 40 A each. However, 1.2 V and 1.8 V are double dimensioned due to higher loads. Other modules are responsible for supplying the integrated PC or for providing the positive and negative transmit voltages of +/−100 V.
2.3.4. Transducer Connector Board
In addition to some control lines and status LEDs, this PCB integrates the socket for connecting the ultrasound transducer. The connector chosen is the ITT Cannon ZIF DLM-360, which is widely used in medical technology and is specially designed for the high pin count of ultrasound arrays and for the high transmission voltages of up to +/−100 V. Transducers with other pin-outs can easily be connected to the system via adapters.
2.3.5. Synchronization Scheme
A clock network makes it possible to combine several systems in synchronous operation. Each sub-system is connected to the PC via its own PCIe interface (Figure 6).
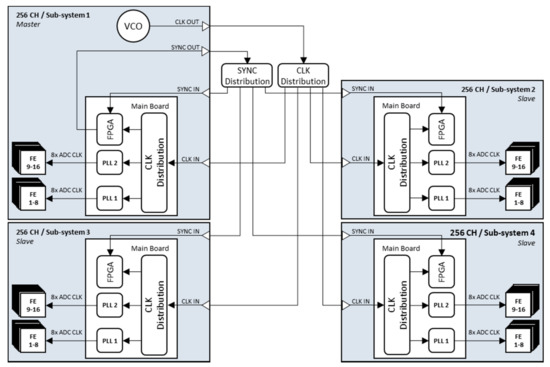
Figure 6.
Synchronization scheme with one master and three slave systems.
In this way, all 1024 elements of the matrix array can be addressed individually and in parallel without using a multiplexer. The synchronization of the four sub-systems is achieved by a separate synchronization circuit. Here, one system acts as the master and generates the 20 MHz master clock with which all systems are operated. In addition, the Virtex-6 FPGA of the master system generates a coded 1 MHz synchronization signal, which also serves as a trigger for an ultrasound measurement scan. The master clock and synchronization signal are passed on to the individual sub-systems via a distribution circuit. Compared to Figure 3 in Section 2.3.1, the on-board generated clock is no longer used to drive the PLLs. Instead, the external clock, which is distributed to the individual systems, is applied via the CLK IN input by selecting it with a switch. The master system itself also receives the two signals again as input to ensure phase equality with the other sub-systems in the sequence control. Other research groups, such as those around the platform ULA-OP, are also pursuing similar approaches [18]. While our method is based on synchronous distribution of clock and trigger signals with equal signal run lengths, ULA-OP’s synchronization circuit relies on PLLs with a programmable phase shift and on a trigger delay compensation to realize zero delay of the timing signals between the master and slave systems.
2.4. Software
The software architecture that controls the electronics and processes the measured data is based on our latest generation of DiPhAS software tools written in C# and C++. All user interface components, file handling and general logic were developed in C#; hardware device control with the PCI express hardware interface and the GPU-based programming were developed using C++.
The hardware operation mode is configured by the software with a set of parameters that are downloaded to the firmware before measurements are performed continuously. To minimize the motion artefacts by tissue or material movement that will lead to incoherent summation over subsequent pulse-echo measurements, sequences including multiple transmit-receive events can be grouped and measured with the fastest pulse repetition possible. The digitized data of each receive phase is collected in the front-end memory and can be transferred as a large block after the sequence is completed. This is crucial for ultrafast ultrasound imaging.
Even though the system consists of four synchronized electronics units, the software is implemented to control a “synchronized multi DiPhAS” unit that transparently handles the programming of all 1024 channels for the user. The software internally manages which delays to send to which system and combines the measurement data stored in multiple DMA memory blocks (Figure 7).
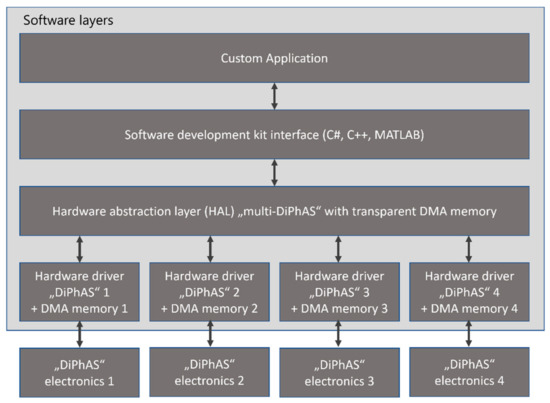
Figure 7.
Software layers for user-transparent programming of four synchronized units.
The ultrasound electronics firmware does not compute any preprocessing or beamforming reconstruction using the digitized data. The data are transferred to the PC for all processing in terms of a fully “software-defined” ultrasound system. This approach provides all flexibility needed to develop and test any new beamforming and other signal-processing technique in interchangeable software libraries. Depending on the target application and transducer used, this versatile research unit can easily be used by multiple researchers without requiring custom firmware changes to adapt the internal processing pipeline in-between.
As the system is designed to be used for real-time measurements and imaging, the data acquisition of the new digitized ultrafast sequence data and processing of previously transferred data is performed in parallel. Depending on the real-time processing used, the data acquisition needs to wait before performing the next measurements. This ensures a continuous streaming operation mode without recording limit while optimizing the resulting imaging frame rate.
For performant computations, we developed OpenCL-based kernels for signal conditioning, receive beamforming computation, signal post-processing and scan conversion. The implemented beamforming reconstruction includes classical delay and sum techniques and adaptive beamforming techniques, such as sign coherence beamforming [19] as well as standard deviation calculations [20]. Apart from these rather computationally fast adaptive beamforming implementations to be used in real time, we enabled more complex approaches that cannot be computed online to be reconstructed after the measurements are stored to disc.
An open source file format called “open research binary (ORB)” was developed and implemented for storing high-frequency ultrasound data from research devices. This is a modular and extendable file format, including all device-specific hardware parameters, transmit parameters for all sequences and the received single-element raw channel data. If any processing, including the receive beamforming reconstruction or volumetric scan conversion for image generation, is applied to the measured data during real-time operation, these data are also added to the file container to be saved. Based on existing import routines for C#, C++, MATLAB and Python, the processing pipeline can be applied again on the stored data sets and optimized processing and analysis steps can be performed in the future as well with new implementations. In the future, we will also include support for the “Ultrasound File Format” proposed by ultrasound beamforming researchers in 2018 [21].
The visualization of the measured data is shown in real time on the user interface. Plots are showing the A-Scans (received amplitude over time) of individual transducer element receive signals or a single reconstructed beam after beamforming. The unreconstructed single element channel data can be viewed as a wide B-Scan showing the brightness of the received echoes as a 2D image. After spatial reconstruction with the selected beamforming, the resulting volume data are visualized using a custom orthogonal slice display and direct volume rendering techniques. The orthogonal slice display shows three images that correspond to single slices of the volume in the XZ, YZ and XY orientation. These views are linked and can be navigated by the user to browse through the insights of the data set. Furthermore, a volumetric rendering of the whole data set is computed on the GPU using direct volume rendering techniques programmed in OpenCL. Using ultrasound imaging-specific visualization parameters, such as echogenicity-to-density mapping of the voxel data and multiple channels for (flow- or stiffness) overlay data on top of the B-Mode grey levels, this rendering technique is still able to compute in real time at more than 60 fps.
A cine loop buffer continuously stores incoming and processed ultrasound data during normal operation in the PC system RAM. As soon as the user pauses the acquisition process, the data from the cine loop can be played back and reprocessed by the processing pipeline.
The ultrasound device operating software includes these tools for live operation, including volume reconstruction and interactive imaging for predefined beamforming techniques, such as plane wave imaging and diverging waves with virtual point sources, and additional software tools for individual beamforming measurements using custom precomputed transmit delay sets and storage of the received single-element channel data. On top of these standard components, the unit can be programmed using multiple software development kits for the programming languages C#, C++, MATLAB and Python. As our main ultrasound system software core was developed in Microsoft .NET, the C# SDK uses these components directly. In the same way, the integration in MATLAB and Python (IronPython) uses our libraries using their own integrated common language interface (CLI) implementation directly. The often-used C++ SDK was implemented using a C++/CLI library that wraps the managed object of .NET to the native environment of C++. Both the MATLAB and C++ interfaces encapsulate the integration and usage of the .NET components without exposing these language-specific elements to the user.
2.5. System Integration
One goal in the development was to integrate the 1024-channel system into a standard 19-inch rack case (Figure 8) that can be used as a single ultrasound system even for clinical studies after normative testing regarding electrical safety and electromagnetic compatibility. The mobile rack system on wheels is equipped with telescopic levels in a way that the individual sub-systems and the PC can be easily accessed and maintained. Due to the movable concept, the system can be transported very comfortably from one room to another. In total, the cart has a height of 800 mm.
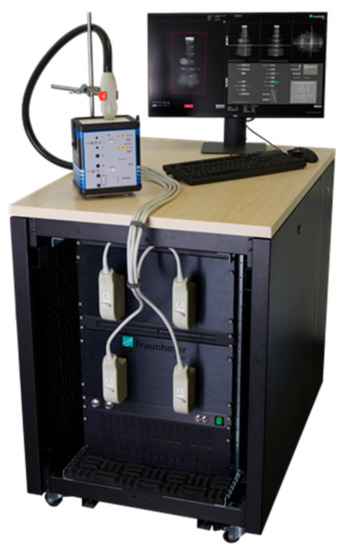
Figure 8.
Fully integrated 1024 CH system.
The housing is divided into 3 levels. The PC with a height of 4U is integrated in the lower third. The upper two levels contain the ultrasound electronics with the master and the three slave sub-systems. All necessary connections between the individual sub-systems, such as the PCIe interfaces and the synchronization circuitry, are routed in the case and do not have to be made externally. Only the interfaces relevant for the user are located in the front area of the system. These include the four ITT Cannon DLM6-360 ports for the transducer, two USB ports for connecting external peripherals to the PC, such as external data storages, and one trigger input and output each. The power button is also located on the front of the system.
The PC installed in the system contains a total of 10 PCIe interfaces (Supermicro X10DRG-O+-CPU, X9DRG-O-PCIE) and integrates a dual Intel Xeon processor (2x E5-2697AV4, 32 cores). In addition to the four PCIe interfaces of the 256-channel ultrasound sub-systems, further PCIe interfaces are used to connect four additional Nvidia graphics cards, which are intended for further signal processing on the GPUs [22]. In total, the system uses 128 Gbytes of DDR4 memory, which is used for the DMA transfer of the raw ultrasound data, allowing the user to access the single-element channel data of all 1024 channels in parallel.
The required total power of the four sub-systems as well as the integrated PC is ensured by two AC/DC power supplies. On the one hand, a 1000 W power supply with an output voltage of +12 V (DC) is used to supply the ultrasound systems, on the other hand, a 2000 W power supply provides the necessary power for the PC.
3. Results
Based on the targeted specifications and requirements, a research platform with 1024 parallel transmit and receive channels was developed, tested and evaluated on phantoms. In the following, we will take a closer look at the results of the system development, first at the electro technical characterization, and then at the beamforming with matrix arrays.
3.1. Electronics Characterization
Compared to our older “DiPhAS” ultrasound system generations [23,24], new receiver modules as well as transmitters with two short-circuited outputs were used in this system to increase the transmit and receive bandwidth. To be able to characterize the transmit bandwidth, the amplitudes of the transmit signal were analyzed in a frequency range between 0.3 and 40 MHz, with a signal length of 1 cycle. The transmitted signals were measured with an oscilloscope at the front-end output pins. It is shown that the pulsers can be operated up to a frequency of 25 MHz without significant amplitude decreases (Figure 9).
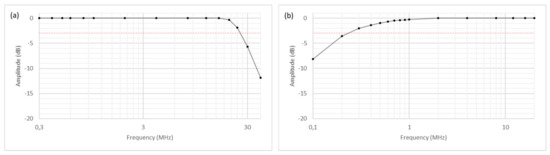
Figure 9.
Transmit bandwidth (a) and receive bandwidth (b).
To determine the receive bandwidth, the high-pass filter integrated in the receiver module was deactivated. Then, a sinusoidal signal, generated by an external signal generator, was fed into the transducer connector of the system. Whereas in older DiPhAS generations the signals were already significantly attenuated below 1 MHz, here the −3 dB limit is undercut below 300 kHz (Figure 9). Overall, the system can therefore be operated in a frequency range between 300 kHz and 25 MHz, provided that in the upper frequency range the sampling of 80 MS/s is still acceptable in the respective application.
Another innovation in the development of the 1024-channel electronics was the implementation of an FPGA-based transmit signal generation with a high delay and frequency resolution of 2.08 ns (using a clock of 480 MHz). This was verified by generating and analyzing two signals with the smallest possible phase shift at the output pins of a front-end board using an oscilloscope (Figure 10). In addition to the time shift of two transmit signals, the spectrum of the excitation frequency of the Vermon 32 × 32 element Matrix Array of 2.82 MHz was also recorded to demonstrate the frequency accuracy.
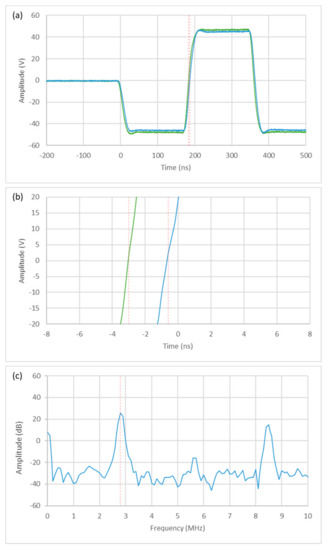
Figure 10.
Delay and frequency resolution of two 2.82 MHz transmit signals shifted by 2 ns in the time domain (different oscilloscope resolutions) (a,b) and the spectrum of the transmit signal (c).
Probably the most important feature of the parallel connection of four 256-channel systems to one 1024-channel ultrasound electronics is the guarantee of completely synchronous operation. The developed synchronization scheme has already been sufficiently described in Section 2. To analyze the synchronization of the four parallel sub-systems and to exclude any phase shift or jitter with a set zero-delay plane wave ultrasound beam, one transmit signal of a randomly selected channel was measured from each 256-channel system, which were then compared with each other in time (Figure 11).
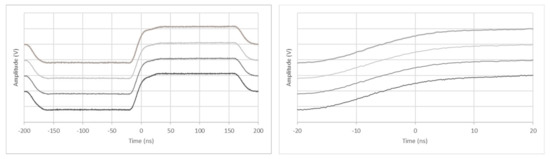
Figure 11.
Phase equality of a zero-delay signal on all four synchronized systems.
The trigger is released at the rising edge of the master system. The other signals are static to the triggered signal. No phase shift could be detected.
3.2. Transducer Characterization
The ability of the system for acquisition of the pre-beamformed channel data was used for characterization of the developed matrix array transducer. For an initial performance assessment of the 26 × 39 element matrix array transducer described above, pulse-echo measurements were performed against a steel reflector in a water tank. The system was programmed for generating 1014 transmit evens, in which only one channel was active, resulting in the excitation of all transducer elements individually with one single cycle square burst at a transmit frequency of 4 MHz. The received echoes are sampled at 80 MSa/s prior to any analog signal processing.
A total of nine elements (0.89%) were found to be inactive. The maximum signal amplitudes for each element of the aperture are color-coded in Figure 12a.
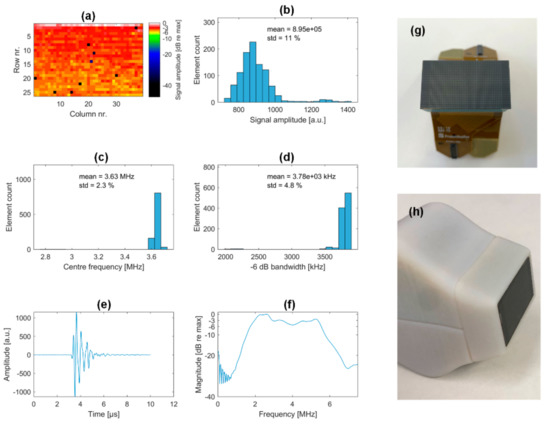
Figure 12.
Array statistics and integration. Array performance with color-coded element-wise signal amplitude (a) and the corresponding histogram (b). Center frequency and bandwidth statistics are given in (c,d). Single element response measured against the steel reflector (e) and average element transfer function (f). Acoustic block prior (g) and after housing integration (h).
The whole aperture shows a high signal amplitude homogeneity with a standard deviation of 11%. Bandwidth and center frequency were assessed based on the one-way spectrum, extrapolated from the acquired data by taking the square root of the amplitude spectrum. This was done because of a misleading high sensitivity peak at the lower frequency edge that disturbs the overall bandwidth behavior. The resulting average center frequency is 3.65 MHz with a very high uniformity over the aperture (2.3% standard deviation). The average 6 dB one-way bandwidth is 104%.
3.3. Signal Processing and Imaging Pipeline
The implemented signal processing and image generation pipeline is working in real-time (Figure 13) and the resulting frame rate of volume updates depends on the amount of measurements performed to combine each volume. Using a Biquad-based IIR filter with a lower frequency cutoff of 1 MHz and a Q value of 0.7 already filters out the DC offset of each digitized channel separately, with approx. −60 dB. In the same way, a high-pass filter is used to remove high-frequency RF noise at frequencies higher than 13 MHz. These filters are applied on the single element channel data before beamforming and again on radio-frequent data after beamforming to eliminate the accumulated offsets.
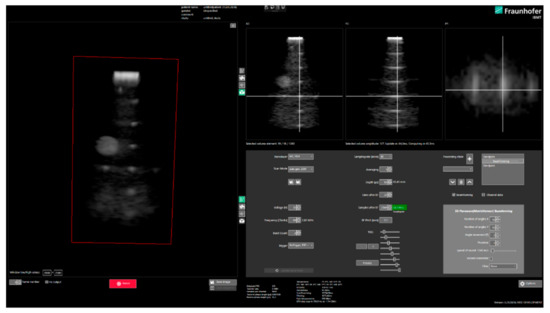
Figure 13.
Real-time volumetric imaging user interface “USPilot” with device parameterization, volumetric rendering and orthogonal slice display.
While this IIR filter-based signal conditioning and visualization can be computed without high computational load, the data transfer and beamforming reconstruction are the major bottlenecks regarding the resulting imaging rate. Using a volumetric plane wave compounding technique with 225 tilted plane wave events by using all possible permutations of 15 different transmit angles, in both lateral and elevational dimension (15 × 15 angles), the resulting amount of digitized data to be transferred can easily sum up to nearly 3 GByte per single volumetric scan (i.e., 225 events × 1024 channels × 6000 samples per channel ≈ 2.75 GByte). Due to the data transfer and software timing overhead, we are currently able to use 50 Gbit/s of the maximum PCI express bandwidth of 100 Gbit/s, which results in a pure data transfer repetition rate of approx. 2 volumes per second for this shown setup. In order to increase this volume rate, other beamforming schemes need to be tested in the future (multiple parallel transmit beams, other diverging wave setups with the need for less transmit-receive events) and the actual data transfer rate needs to be optimized to reach the hardware link possibilities.
While the data transfer rate is one factor limiting the imaging rate, the beamforming reconstruction does also affect it when a sophisticated receive beam reconstruction technique is used. For a fast preview only the orthogonal slices can be reconstructed in high resolution as those two (bi-plane: XZ, YZ) or three (tri-plane: XZ, YZ, XY) images represent considerably less reconstruction points compared to the full volume reconstruction used for direct volume rendering or volumetric analysis of the data. The GPU-based volumetric receive beamforming reconstruction pipeline computes about 500,000 single samples for any volume/slices dimension with 169 (13 × 13) input plane wave angle datasets per second using a NVidia GTX 1080 Ti GPU. This way the preview orthogonal slices can be reconstructed and rendered in real time and high resolution (i.e., 128 beams with 1536 samples each) without any additional overhead in parallel to the next data acquisition.
The system imaging performance was characterized using the point-spread function (PSF) analysis with different plane wave compounding experiments for both the Vermon 32 × 32 and our custom AMPHORA 26 × 39 element matrix array transducer described above. As both transducers do not have a square aperture (Vermon has three inactive rows in-between, resulting in a larger footprint in elevational direction), the PSFs were measured with a wire phantom in two orientations, 0° and 90°, with the wire being at a depth of 35 mm and orthogonal to the XZ in one and orthogonal to the YZ imaging plane in the other setup. After volumetric reconstruction of 1 × 1, 3 × 3, 5 × 5, 7 × 7, 9 × 9, 11 × 11, 13 × 13 and 15 × 15 transmit-receive events, with a plane wave increment of 1° per angle step and coherence receive beamforming, the analysis was performed in the XZ and YZ imaging planes (Figure 14).
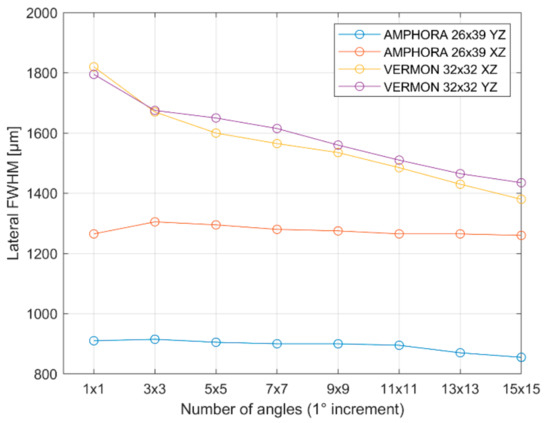
Figure 14.
Full-width half maximum of the PSF evaluated for both transducers in both directions as a function of the number of compounding angles.
As can be seen in Figure 14, the FWHM (−6 dB width of the PSF) is reduced with an increasing number of plane wave angles, especially in the case of the Vermon 32 × 32 transducer, while it remains almost constant in the case of the custom AMPHORA 26 × 39 transducer. This can be explained by the different element sizes, leading to a much smaller element opening angle in the case of the AMPHORA transducer. Consequently, angular compounding is much less efficient when it comes to the improvement of the PSF in this case. For the Vermon probe, having comparable aperture sizes in both directions, the PSF ranges between 1800 µm and 1400 µm for the 1 × 1 to 15 × 15 angles, respectively, independently of the orientation.
While the effects of the orientation is very limited on the FWHM, the inactive rows introduce a higher clutter background level around the wire target (Figure 15). On the other hand, the PSFs strongly differ for the AMPHORA probe, with approximately 900 µm and 1290 µm, respectively, for the YZ and XZ direction, with little influence of the number of angles as expected by the rectangular shape of the aperture and the limited element opening angle.
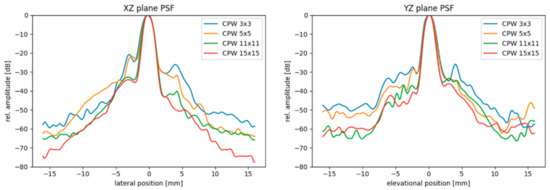
Figure 15.
Point spread function of the Vermon 32 × 32 element transducer in the XZ and YZ imaging plane after volumetric reconstruction using volumetric plane wave compounding with 9, 25, 121 and 225 angles.
To characterize the possible dynamic range and contrast of the imaging pipeline, we performed In Vivo measurements of the human bladder with both transducers with an imaging depth of 90 mm.
To acquire enough bladder volume, we used 13 × 13 volumetric plane wave compounding with an angle increment of 4°, resulting in an opening angle of 48° for the Vermon probe (Figure 16). Our custom large footprint transducer was used with the same amount of measurements using only an angle increment of 1°, resulting in an opening angle of 12°. The transducer compensates for this limitation in the maximum beam steering angle with its large footprint in parts (Figure 17).
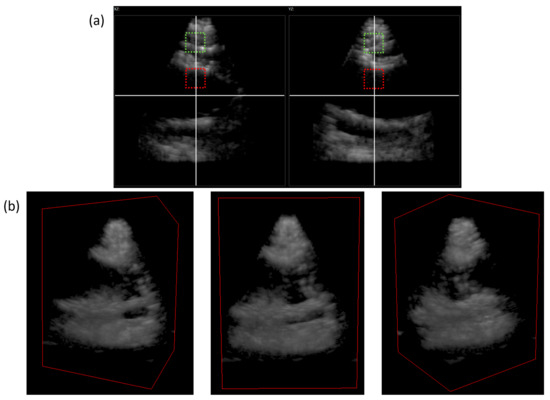
Figure 16.
Volumetric imaging of an In Vivo human bladder using the Vermon 32 × 32 matrix array: orthogonal XZ, YZ plane (a); volume rendering of the full volume at different angles (b).
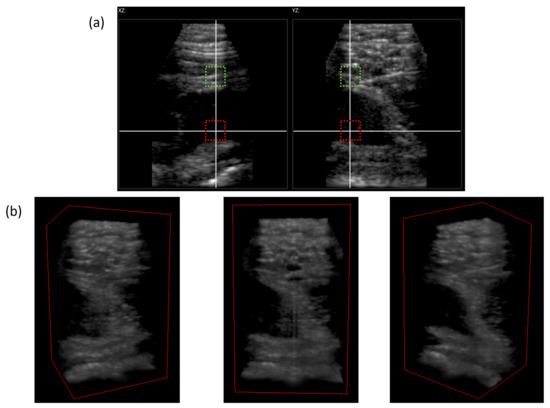
Figure 17.
Volumetric imaging of an In Vivo human bladder using our 26 × 39 matrix array: orthogonal XZ, YZ plane (a); volume rendering of the full volume at different angles (b).
In order to assess the dynamic range of the imaging, we analyzed the contrast of the echo-free volume inside the bladder (Figure 16 and Figure 17, red circle) in relation to a subvolume of the tissue before the bladder (Figure 16 and Figure 17, green circle). Using the Vermon 32 × 32 probe and sign coherence beamforming, we achieved a contrast of up to 49.1 dB while our custom large footprint 26 × 39 element transducer yielded a contrast of up to 40.3 dB.
4. Discussion
We developed a 1024-channel ultrasound electronic system for research based on four individual 256-channel systems and demonstrated that parallel and synchronous operation of the four 256-channel sub-systems can be achieved using our newly developed synchronization scheme. Having a fully addressable matrix array transducer is optimal for beamforming research in comparison to systems equipped with multiplexers to address all elements with multiple transmit-receive events. While the overall amount of digitized measurement data is not different, such a large channel count system has two advantages. One the one hand, the transmit beam steering benefits from the use of all transducer elements in terms of better waveform generation capabilities and increased acoustic amplitude generated by the full acoustic aperture. On the other hand, the measurement time is reduced by the multiplexing factor used by a system with fewer channels, since the entire 1024-element matrix array data are digitized in a single transmit-receive event, while a 256-channel ultrasound system with a 1:4 multiplexer requires four transmit-receive events, resulting in longer acquisition times. Regarding our target application of clinical volumetric ultrasound research, the shorter recording time is crucial to reduce motion artefacts resulting in blurred volumes; for example, in cardiac imaging and beamforming research caused by incoherent summation of the received echoes.
Accordingly, high channel count systems are the better choice for research in volumetric ultrasound. Although other 1024-channel research systems have been published in the past, there are some significant differences. For instance, the 1024-channel system [9] presented by Verasonics needs individual PCs to control each of the four 256-channel sub-system, while our approach is based on a single PC on whose GPUs most of the signal processing and the entire beamforming take place. The ULA-OP synchronized ultrasound system follows a similar principle by using only one PC but uses a different data interface (USB 3.0). In contrast, we chose a PC interface via the PCIe x8 Gen. 2 interfaces, with a data rate of 100 Gbit/s. This enables real-time streaming operation with unlimited measurement, processing and display in the interleaved mode (parallel acquisition and reconstruction).
While relying on the established DiPhAS system architecture, we managed to improve the performance of the integrated 1024-channel system, in particular the bandwidth, in comparison to previous DiPhAS generations. On the receive side, the −3 dB limit is below 300 kHz, compared to 1 MHz for previous generations. On the transmit side, the frequency range could be extended to over 25 MHz, thereby extending the range of possible applications. Thanks to a newly implemented transmit algorithm in the FPGA firmware, it is now possible to generate tri-state transmit signals with a total length of up to 32 µs in a 2 ns delay and frequency resolution. Previous generations of DiPhAS could only resolve at 8 ns or were limited to signal lengths of only 4 µs, leading to a smaller degree of freedom in the definition of arbitrary signal patterns; for instance, using pulse-width modulation (PWM) schemes.
In the first experiments with matrix array transducers, we demonstrated the system’s ability to acquire pre-beamformed channel data and successfully implemented a first GPU-based, real-time volumetric imaging modality based on plane wave compounding. The imaging performance was characterized on wire targets with different transducers, highlighting the impact of the number of compounding angles and of the probe geometry. Lateral resolutions (FWHM of the PSF) between 900 and 1800 µm were demonstrated and a contrast of 40 to 50 dB was shown on first in-vivo bladder data. Although only a plane wave compounding beamforming approach is implemented so far in the clinical-style user interface “USPilot”, arbitrary beamforming schemes can already be investigated in a more experimental system operation mode, where pre-computed transmit delays patterns can be loaded as tab-separated ASCII values in text files. The implementation of further reconstruction schemes, leading to improved contrast and resolution, is work in progress.
The flexible and open system and software architecture provide full access to the signal generation and receive-data processing pipeline. This is particularly valuable in the context of the first envisioned use in therapy monitoring, where custom algorithms for tracking and analysis of radiation-sensitive microbubbles need to be integrated into the signal-processing pipeline. Compared to other systems available on the market, software interfaces for C# and C++ can be provided in addition to a MATLAB interface.
In addition to the evaluation carried out so far, upcoming work will include the (real-time) implementation of further beamforming approaches, the optimization of the GPU reconstruction speed for the so-far implemented plane wave compounding and proof-of-concept of volumetric radiation-sensitive bubble tracking, which so far has only been carried out in 2D [16,17]. Finally, testing of the system for compliance with medical device standards, in particular IEC 60601-1 electrical safety and IEC 60601-1-2 electromagnetic compatibility, is scheduled—a unique feature compared to other ultrasound research systems available on the market. This has already been successfully realized for the 256-channel sub-units of the system. The availability of corresponding test protocols, certifying compliance with the relevant safety standards that can be handed over to ethics committees, will ease the use of the system in clinical studies and thereby foster the transfer of new 3D ultrasound imaging approaches into clinical practice.
Author Contributions
Conceptualization, S.T., H.H. and C.R.; methodology, H.H., C.R., H.F. and S.B.-H.; software, H.H. and S.W.; validation, H.H., M.F., C.R., H.F., S.B.-H., S.W. and D.S.; formal analysis, H.H., M.F., C.R., H.F., S.B.-H., S.W. and D.S.; investigation, H.H. and M.F.; resources, H.H. and M.F.; data curation, H.H. and M.F.; writing—original draft preparation, C.R.; writing—review and editing, H.H. and M.F.; visualization, H.H.; supervision, S.T. and M.F.; project administration, S.T. and M.F.; funding acquisition, S.T. and M.F. All authors have read and agreed to the published version of the manuscript.
Funding
This work is supported by the AMPHORA EU project (FET OPEN project no. 766456).
Institutional Review Board Statement
Not applicable.
Informed Consent Statement
Not applicable.
Data Availability Statement
Data of this study can be requested from the corresponding author.
Acknowledgments
We would like to thank the entire AMPHORA team, especially KU Leuven and the team by Jan D’hooge, for the excellent cooperation and support.
Conflicts of Interest
The authors declare no conflict of interest. The funders had no role in the design of the study; in the collection, analyses, or interpretation of data; in the writing of the manuscript, or in the decision to publish the results.
References
- Osipov, L.V.; Kulberg, N.S.; Leonov, D.V.; Morozov, S.P. 3D Ultrasound: Current State, Emerging Trends and Technologies. Biomed. Eng. 2018, 52, 199–203. [Google Scholar] [CrossRef]
- Mozaffari, M.H.; Lee, W.-S. Freehand 3-D Ultrasound Imaging: A Systematic Review. Ultrasound Med. Biol. 2017, 43, 2099–2124. [Google Scholar] [CrossRef] [PubMed] [Green Version]
- Huang, Q.; Zeng, Z. A Review on Real-Time 3D Ultrasound Imaging Technology. BioMed Res. Int. 2017, 2017, 1–20. [Google Scholar] [CrossRef] [PubMed] [Green Version]
- Yu, Z.; Blaak, S.; Chang, Z.-Y.; Yao, J.; Bosch, J.G.; Prins, C.; Lancée, C.T.; de Jong, N.; Pertijs, M.A.P.; Meijer, G.C.M. Front-end receiver electronics for a matrix transducer for 3-D transesophageal echocardiography. IEEE Trans. Ultrason. Ferroelectr. Freq. Control 2012, 59, 1500–1512. [Google Scholar] [PubMed]
- Chen, C.; Chen, Z.; Bera, D.; Noothout, E.; Chang, Z.-Y.; Tan, M.; Vos, H.J.; Bosch, J.G.; Verweij, M.D.; de Jong, N.; et al. A Pitch-Matched Front-End ASIC With Integrated Subarray Beamforming ADC for Miniature 3-D Ultrasound Probes. IEEE J. Solid State Circuits 2018, 53, 3050–3064. [Google Scholar] [CrossRef]
- Chen, K.; Lee, H.-S.; Sodini, C.G. A Column-Row-Parallel ASIC Architecture for 3-D Portable Medical Ultrasonic Imaging. IEEE J. Solid State Circuits 2016, 51, 738–751. [Google Scholar]
- Bouzari, H.; Engholm, M.; Christiansen, T.L.; Beers, C.; Lei, A.; Stuart, M.B.; Nikolov, S.I.; Thomsen, E.V.; Jensen, J.A. Volumetric synthetic aperture imaging with a piezoelectric 2D row-column probe. In Medical Imaging 2016: Ultrasonic Imaging and Tomography; International Society for Optics and Photonics: Bellingham, WA, USA, 2016; Volume 9790. [Google Scholar]
- Jensen, J.A.; Holten-Lund, H.; Nilsson, R.T.; Hansen, M.; Larsen, U.D.; Domsten, R.P.; Tomov, B.G.; Stuart, M.B.; Nikolov, S.I.; Pihl, M.J.; et al. SARUS: A Synthetic Aperture Real-Time Ultrasound System. IEEE Trans. Ultrason. Ferroelectr. Freq. Control 2013, 60, 1838–1852. [Google Scholar] [CrossRef] [PubMed] [Green Version]
- Petrusca, L.; Varray, F.; Souchon, R.; Bernard, A.; Chapelon, J.-Y.; Liebgott, H.; N’Djin, W.A.; Viallon, M. Fast Volumetric Ultrasound B-Mode and Doppler Imaging with a New High-Channels Density Platform for Advanced 4D Cardiac Imaging/Therapy. Appl. Sci. 2018, 8, 200. [Google Scholar] [CrossRef] [Green Version]
- Roux, E.; Varray, F.; Petrusca, L.; Cachard, C.; Tortoli, P.; Liebgott, H. Experimental 3-D Ultrasound Imaging with 2-D Sparse Arrays using Focused and Diverging Waves. Sci. Rep. 2018, 8, 9108. [Google Scholar] [CrossRef] [PubMed] [Green Version]
- Cai, X.; Foiret, J.; Roth, J.; Gazit, Z.; Pelled, G.; Gazit, D.; Ferrara, K.W. 3D monitoring and control of microbubble cavitation for gene delivery. In Proceedings of the IEEE International Ultrasonics Symposium (IUS) 2019, Glasgow, UK, 6–9 October 2019. [Google Scholar]
- Hewener, H.; Risser, C.; Barry-Hummel, S.; Fonfara, H.; Fournelle, M.; Tretbar, S. Integrated 1024 Channel Ultrasound Beamformer for Ultrasound Research. In Proceedings of the IEEE International Ultrasonics Symposium (IUS) 2020, Virtual, 6–11 September 2020. [Google Scholar]
- Boni, E.; Yu, A.C.H.; Freear, S.; Jensen, J.A.; Tortoli, P. Ultrasound Open Platforms for Next-Generation Imaging Technique Development. IEEE Trans. Ultrason. Ferroelectr. Freq. Control 2018, 65, 1078–1092. [Google Scholar] [CrossRef] [PubMed]
- Bernal, M.; Cunitz, B.; Rohrbach, D.; Daigle, R. High-frame-rate volume imaging using sparse-random-aperture compounding. Phys. Med. Biol. 2020, 65, 175002. [Google Scholar] [CrossRef] [PubMed]
- Boni, E.; Bassi, L.; Dallai, A.; Meacci, V.; Ramalli, A.; Scaringella, M.; Guidi, F.; Ricci, S.; Tortoli, P. Architecture of an Ultrasound System for Continuous Real-time High Frame Rate Imaging. IEEE Trans. Ultrason. Ferroelectr. Freq. Control 2017, 64, 1276–1284. [Google Scholar] [CrossRef] [PubMed]
- Carlier, B.; Heymans, S.V.; Nooijens, S.; Toumia, Y.; Ingram, M.; Paradossi, G.; D’Agostino, E.; Himmelreich, U.; D´hooge, J.; Van Den Abeele, K.; et al. Proton range verification with ultrasound imaging using injectable radiation sensitive nanodroplets: A feasibility study. Phys. Med. Biol. 2020, 65, 065013. [Google Scholar] [CrossRef] [PubMed]
- Heymans, S.V.; Carlier, B.; Toumia, Y.; Nooijens, S.; Ingram, M.; Giammanco, A.; D´Agostino, E.; Crijns, W.; Bertrand, A.; Paradossi, G.; et al. Modulating ultrasound contrast generation from injectable nanodroplets for proton range verification by varying the degree of superheat. Med. Phys. 2021, 48, 1983–1995. [Google Scholar] [CrossRef] [PubMed]
- Mazierli, D.; Ramalli, A.; Boni, E.; Guidi, F.; Tortoli, P. Architecture for an ultrasound advanced open platform with an arbitrary number of independent channels. IEEE Trans. Biomed. Circuits Syst. 2021, 1. [Google Scholar] [CrossRef] [PubMed]
- Camacho, J.; Parrilla, M.; Fritsch, C. Phase Coherence Imaging. IEEE Trans. Ultrason. Ferroelectr. Freq. Control 2009, 56, 958–974. [Google Scholar] [CrossRef] [PubMed]
- Fournelle, M.; Bost, W. Wave front analysis for enhanced time-domain beamforming of point-like targets in optoacoustic imaging using a linear array. Photoacoustics 2019, 14, 67–76. [Google Scholar] [CrossRef] [PubMed]
- Bernard, O.; Bradway, D.; Hansen, H.H.G.; Kruizinga, P.; Nair, A.; Perdios, D.; Ricci, S.; Rindal, O.M.H.; Rodriguez-Molares, A.; Stuart, M.B.; et al. The Ultrasound File Format (UFF). In Proceedings of the IEEE International Ultrasonics Symposium 2018, Kobe, Japan, 22–25 October 2018. [Google Scholar]
- So, H.; Chen, J.; Yiu, B.; Yu, A. Medical Ultrasound Imaging: To GPU or Not to GPU? IEEE Micro 2011, 31, 54–65. [Google Scholar] [CrossRef] [Green Version]
- Risser, C.; Welsch, H.-J.; Fonfara, H.; Hewener, H.; Tretbar, S. High Channel Count Ultrasound Beamformer System with External Multiplexer Support for Ultrafast 3D/4D Ultrasound. In Proceedings of the IEEE International Ultrasonics Symposium (IUS) 2016, Tours, France, 18–21 September 2016. [Google Scholar]
- Hewener, H.; Welsch, H.-J.; Fonfara, H.; Motzki, F.; Tretbar, S. Highly Scalable and Flexible FPGA Based Platform for Advanced Ultrasound Research. In Proceedings of the IEEE International Ultrasonics Symposium (IUS) 2012, Dresden, Germany, 7–10 October 2012. [Google Scholar]
Publisher’s Note: MDPI stays neutral with regard to jurisdictional claims in published maps and institutional affiliations. |
© 2021 by the authors. Licensee MDPI, Basel, Switzerland. This article is an open access article distributed under the terms and conditions of the Creative Commons Attribution (CC BY) license (https://creativecommons.org/licenses/by/4.0/).