Abstract
The scarcity of balanced and annotated datasets has been a recurring problem in medical image analysis. Several researchers have tried to fill this gap employing dataset synthesis with adversarial networks (GANs). Breast magnetic resonance imaging (MRI) provides complex, texture-rich medical images, with the same annotation shortage issues, for which, to the best of our knowledge, no previous work tried synthesizing data. Within this context, our work addresses the problem of synthesizing breast MRI images from corresponding annotations and evaluate the impact of this data augmentation strategy on a semantic segmentation task. We explored variations of image-to-image translation using conditional GANs, namely fitting the generator’s architecture with residual blocks and experimenting with cycle consistency approaches. We studied the impact of these changes on visual verisimilarity and how an U-Net segmentation model is affected by the usage of synthetic data. We achieved sufficiently realistic-looking breast MRI images and maintained a stable segmentation score even when completely replacing the dataset with the synthetic set. Our results were promising, especially when concerning to Pix2PixHD and Residual CycleGAN architectures.
1. Introduction
Coping with small and poorly annotated datasets has been a recurring problem for medical image analysis researchers, limiting their success in validating supervised learning algorithms for real-life use. The paucity of comprehensive and annotated medical data is due to several factors: acquiring medical images often involves expensive and invasive procedures, and annotating them is a time-consuming task that requires the labor of experienced specialists. Additionally, these datasets are often unbalanced and lack variability since abnormal exams are captured less frequently than normal ones, contributing to unsatisfying performances in classification tasks.
Images produced by traditional data augmentation techniques (e.g., rotation, translation, crop, shear) are often highly correlated with the already available ones, which makes this strategy insufficient to counteract the consequences of data scarcity. Furthermore, most of these alterations compromise the expected anatomy structure and positioning, producing unexpected or even distorted outcomes, which will be inadvertently and erroneously learnt. This, together with the data needs that accompanied the expansion of Deep Learning, served as motivations for the development of techniques to generate meaningful synthetic data and fast-forwarded research on this topic in recent years. One of the most promising approaches that emerged from that research is Generative Adversarial Networks (GANs) [1], which was already shown to be successful for the synthesis of natural images [2] and for super-resolution tasks [3].
The use of GANs to generate medical images is recent and, as such, to this date, only a limited set of imaging modalities and applications was explored. Still, important studies emerged over the past few years. Several works concerning the conversion across different parameter series or even whole imaging modalities have been proposed, such as from MRI to Computed Tomography (CT). Examples of MRI to CT conversion are classical GANs, trained with patches of images and applied in Auto-Context models [4,5], and the usage of the CycleGAN to deal with unregistered datasets [6]. The CycleGAN is also used for multi-contrast MRI synthesis (T1 to T2 weighted conversion and vice versa) [7]. Lastly, the conversion of T1 and T2 weighted MRI images into corresponding magnetic resonance angiography representations was explored through the application of the steerable GAN, a variant of the PatchGAN which applies a steerable filter loss [8]. Other relevant applications of GANs to medical images include the usage of deep convolutional GANs for the generation of fake tumors in liver CT [9] and in multi-sequence brain MRI [10]. A super resolution GAN variation was also proposed to increase the resolution of brain MRI images [11]. Finally, MEDGAN [12], a cascade of U-Net blocks poses further material to be inspired from.
Furthermore, of note is the image-to-image translation conditional GAN [13], known as Pix2Pix, which has been applied for conversion between annotations and medical images. This framework was used for the synthesis of abnormal brain MRI images from annotations with a tumor label [14], and for the generation of retinal images from vessel masks [15]. A more recent work based on Contrastive Learning [16] has tried to both improve and generalize the image synthesis approach by disregarding the bijective assumption implicit in works using cycle-consistency and still avoid tailoring a loss function to the setup.
In this work, we explore how some generative adversarial networks can be used for the synthesis of breast magnetic resonance images from corresponding annotations, for data augmentation purposes. Additionally, we contribute to the answering of the following questions:
- Generator architecture: what generator architecture can enable the synthesis of more realistic images?
- Synthetic data effect: what amount and level of generative quality is enough for an effective learning by a segmentation network?
For this synthesis task, we proposed two approaches with near equivalent outcomes: a variant of the Pix2Pix framework that employs a generator with residual learning blocks, on a forward-backward loop, as in a CycleGAN, and the use of a more complex, but forward-only, approach named Pix2PixHD [17]. We have selected a U-Net architecture for the semantic segmentation task. Both generative models seem to produce images with quality comparable to the original. As the images are inherently fake, the concept of realism falls under the confines of the overall physicality of the objects contained, namely the shape, size and positioning of the anatomical structures, and the proximity to real MRI’s intensities and textures. We evaluate the visual quality of the results with the Fréchet Inception Distance [18] (FID), for texture, and the Structure Similarity Index (SSIM) [19] metrics, for the remaining aspects. The usefulness of the synthetic images on an augmentation setup is measured with the area focused Sørensen–Dice coefficient. The amount of synthetic data necessary is evaluated by introducing fake images and ablating the real ones on the segmentation training set, while the minimum level of quality required is obtained by the use of differently performing synthsets.
2. Methods
Our work focuses on converting from the annotations’ domain, with anatomical structures’ area, to single-channel, breast MRI slices. The specific variation of generator architecture employed, though, is altered during the course of the experiments. Performance is evaluated both at the end of the generative task, measuring its verisimilitude, and at the end of the segmentation process.
2.1. Segmenter U-Net
The U-Net [20] is a relatively ubiquitous segmentation architecture, as it focuses on individual pixel contribution to a class-label instead of providing only a generalised class for the image, as its contemporary networks. It consists of progressively contracting image resolution steps, using pooling or down-convolutional layers (an encoder of sorts). It may compensate that reduction by increasing the number of filter representations. When the smallest representation is reached the complementary process is applied until the original resolution is obtained (the decoder). The U-Net also has the particularity of employing skip connections, that link each encoder layer’s output to the same level decoder input, concatenating both components. The network’s output can either be a complete image of the output domain or a set of logits or probabilities of each pixel belonging to a particular class.
The version adopted in this work ends in a logit normalization step that rescales the label probability to a sum total of 1. After these probability maps are obtained, the softDICE loss is calculated.
2.2. Adversarial Generator
The base of our generator follows the Pix2Pix [13] framework, which is an embodiment of a Conditional Generative Adversarial Network that aims at domain translation. It presents a Conditional Generator Network (G) that produces fake images and a Discriminator network (D) that tries to discern which images are fake and real from a set. Both improve over time in a counterfeiter versus police fashion.
The Pix2Pix’s Generator used is of a U-Net architecture. Fakes are created by the G and it learns via an adversarial loss ( the current accuracy of the D) and a more direct loss such as L1 or L2. The D is a PatchGAN—a patch-wise, convolutional classifier that averages over all individual patches their real or fake decisions. This setup somewhat enforces a “form of texture/style loss”, which deals with high frequency components, not tackled by L1 or L2.
2.2.1. Residual Block Pix2Pix Variation (ResGAN)
We did some changes to the generator architecture of the base Pix2Pix framework, namely removing the U-Net skip connections and including a sequence of residual learning blocks (as those in [21]) between the encoder and the decoder portions, as shown in Figure 1. Considering the following notation:

Figure 1.
ResGAN architecture generator.
- Ck: Convolution—Batch/Instance Normalization—ReLU with k filters;
- TCk: Transposed Convolution—Batch/Instance Normalization—ReLU, with k filters;
- Rk: Residual block consisting in Convolution—Batch/Instance Normalization—ReLU—Convolution, with k filters for the input and output of all convolutions.
- Y×Bk: Block Bk repeated Y times, in series.
The generator architecture is the following:
C64-C128-C256-9 × R256-TC128-TC64-C1
For C64 and C1 modules, the convolutions have a kernel size of 7 × 7, a stride of 1 and padding of 3, while all other convolutions have a kernel size of 3 × 3, a stride of 2 and a padding of 1. For C1, no batch normalization is used and the activation function applied is the hyperbolic tangent.
Throughout the rest of this article, we will refer to this model as ResGAN.
2.2.2. CycleGAN
The CycleGAN [22] is yet another iteration on the original Pix2Pix architecture, especially suited for datasets with unpaired domain samples. Knowing that the most common situation with MRI datasets is not having the respective annotations, we experimented with the cycle-consistency loss and framework to approach our task. The framework boils down to a GAN design, similar to the one presented in ResGAN (Figure 1), with the added complexity of duplicating the structure: two generators ( & ) and two discriminators ( & ).
The concept behind it is to avoid having paired data by training a Conditional GAN ( & ) to translate the input X to the output domain Y, while a second, similar GAN ( & ) converts that output Y back to the original domain X (Figure 2). By providing this closed loop processing scheme, one can add, to the classic loss, a cycle-consistency loss. This is done by comparing the original input to its reconstruction using a L1 distance:
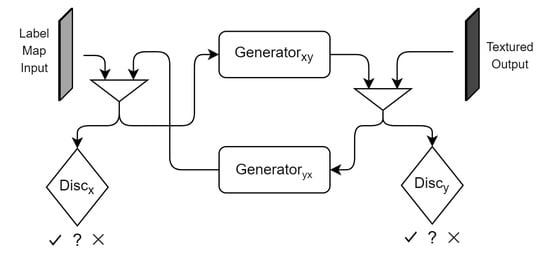
Figure 2.
CycleGAN architecture diagram.
The authors of the CycleGAN also introduced the idea of identity loss—n autoencoding loss component for the generator—with the goal of color correction.
The cycle consistency term is controlled by , while the identity term is factored by , giving the full loss function present in Equation (2).
2.2.3. Pix2PixHD
Another approach towards better resolution generative setups came in the form of Pix2PixHD [17]. This architecture with no cycle-consistency employed a more complex generator of residual blocks and a multi-scale discriminator.
Figure 3 shows the generator architecture of Pix2PixHD. The generator network can be divided into the global generator (G1) and the local enhancer (G2). The G1 follows the pipeline of ResGAN (Figure 1), only differing by receiving a 2 times downsampled version of the input and returning an image at that same decimated resolution.

Figure 3.
Coarse-to-fine generator of pix2pixHD.
The local enhancer, however receives the original input and reduces the resolution to the same size of the decimated image using a C32-C64 front-end network. This other partial output is summed element-wise with the last feature map from G1 (before the image output), and fed to the G2 back-end network. This back-end processes the input with another series of residual blocks (3×R64 in our case) and finally outputs a generated image after the transposed convolution, complementary to those of the G2 front-end (C32-C1).
The discrimination component of the network is composed of 3 PatchGAN models, in a pyramidal scheme (D1, D2 and D3). Each operates at a different resolution level, dealing with data at the input scale (D1) and with downsampled versions of factors 2 (D2) and 4 (D3). Both real and synthetic images suffer this discrimination and the results are combined to get a single adversarial loss.
This strategy was devised to avoid using a unique discriminator with a large receptive field, which would be necessary for the intended image resolution. The usage of a deeper architecture or larger convolutional kernels would translate to a larger model and induce overfitting. It was also shown that the multi-scale discriminators avoid pattern repetition over the images [17].
The reported Pix2PixHD loss function includes two additional terms, focusing on feature matching and perceptual loss.
For the feature matching component, each intermediate feature map () along each discriminator scale () is obtained for an image. The loss consists of computing the L1 distance between the feature maps for a real image and a synthetic one. This loss is shown in Equation (3).
Here, T is the total number of layers, and is the number of elements of the ith layer.
The perceptual loss enforces a similar logic to that of the feature matching, however, it makes use of the layer responses of the pre-trained VGG network [23]. The calculation is done through Equation (4), where represents the ith layer with elements on the VGG network.
The complete loss function is present in Equation (5).
2.2.4. Other Experiments with Losses
Several experiments were also conducted using FID and SSIM as alternative partial losses of the generative training but found no particular enhancement. In fact, visual fidelity tended to decrease, especially with the FID loss. Due to hardware limitations we were not able to use both as partial losses simultaneously. As such, the usage of these metrics was restricted to validation and testing tasks.
2.3. Evaluation Metrics
This work encompasses two stages: generation and segmentation. Thus, we employ different metrics for evaluating the performance according to the stage. For the generation we use two metrics that measure slightly different aspects, the Fréchet Inception Distance (FID) and the Structure Similarity Index Measure (SSIM). These have been applied in works of similar context [3,7,11,12,16,18,24,25,26]. For semantic segmentation purposes we opt for the DICE score.
We also experimented using Peak Signal to Noise Ratio [19]; however, throughout the experiments we found it highly correlated with SSIM and, thus, we opted to ignore it for brevity.
2.3.1. FID and SSIM
The FID [18] evaluates the generator’s performance by measuring the Fréchet distance between two multivariate Gaussians, modeled by the 2048-dimensional activations of the Inception-v3 pool3 layer for real and synthetic images. Equation (6) details the FID calculation, where and refer, respectively, to the activations of the pooling layer mentioned above for real and fake images.
The FID has a lower bound of 0 but has no upper bound. A lower FID value will indicate higher similarity between the real image and the corresponding synthetic one and, therefore, a better synthesis quality. In [18], it is shown that FID is more robust to noise and blurring than the Inception Score [27], besides also being more sensitive to mode collapse and capable of evaluating intra-class variability. However, this metric depends of the capabilities of the Inception network, it assumes that Gaussian distributions correctly model the feature maps extracted and only takes into consideration the first two order moments of the distributions, which may not be suitable approximations [28].
The SSIM [19] is a three-aspect metric that looks at the luminance distortion (l), contrast distortion (c) and loss of structural correlation (s). Image distortions are less noticeable on bright or textured regions. In turn, this drove the usage of luminance and contrast distortion, respectively. The concept of close neighbouring pixels having high interdependence is leveraged for estimating the structural aspect of objects.
For measuring the distance between two images (f and g), each of the three aspects is calculated as shown in Equation (7).
Here, and refer to mean intensity values, and to the respective standard deviation, to the co-variance matrix, and to to arbitrary constants. Equation (8) presents how to calculate the composite metric:
SSIM’s values range between −1 and 1, where 0 reports no correlation between the images, 1 means equal images and −1 indicates that the structure is inverted.
2.3.2. Metrics Analysis
The particularity of FID not having an upper bound and the fact of values being domain specific, motivated further study. To do so, we performed an analysis of the metrics’ outcomes when applied between a reference image and that same image tampered with specific artifacts. We seized the opportunity to also evaluate which types of artifacts influenced the SSIM the most. Concretely, we transformed one image, from our breast MRI dataset, using an array of processing algorithms. The tamperings chosen reflect some of the issues that may be found in artificial images, which are the following:
- T1—horizontal flip;
- T2—horizontal translation (20 pixels);
- T3—zoom (140%) and crop;
- T4—rotation (10°);
- T5—gamma correction (), resulting in a lower intensity distribution;
- T6—gamma correction (), resulting in a higher intensity distribution;
- T7—median blur (size );
- T8—downsampling ( factor) with aliasing, and resize, resulting in a blurry image;
- T9—Gaussian blur (, kernel );
- T10—salt and pepper noise.
Figure 4 show the reference and tampered MRI images. Respective FID and SSIM values are presented in Table 1.
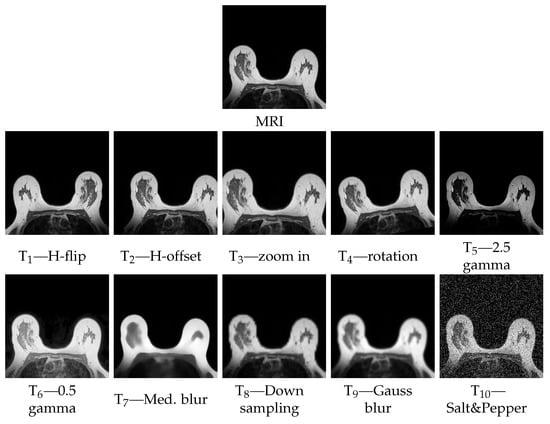
Figure 4.
Reference and tampered MRI images.

Table 1.
Reference metrics values for transformations: T1—H-flip, T2—H-offset, T3—zoom in, T4—rotation, T5—2.5 gamma, T6—0.5 gamma, T7—Med. blur, T8—Down sampling, T9—Gauss blur, T10—Salt&Pepper.
Table 1 shows FID scores between a range of 49 to 370, approximately. Against the MRI reference, the horizontal flip (T1), horizontal translation (T2) and zoom (T3) transformations produce FID values under 100, which we find low considering the observable FID range. On the other hand, the SSIM for the same transformation resulted in values below 0.65. This is not surprising as SSIM is sensitive to the structure of the data and performing flipping, translation, cropping or rescaling affects the co-variance matrix, and thus, those properties. In fact, the 10% slight rotation (T4) also strongly influences SSIM (0.582) while the increase in FID does not seem that substantial (129.4).
The gamma corrections (T5 and T6), that homogeneously alter the full image, have considerably less of an impact on the SSIM than the previous affine changes (T1 to T4). This may result from the fact that SSIM tries to normalize for overall image luminance, focusing on the impact of localized distortions. Conversely, FID is slightly worse, as the squashing or expansion of the pixel intensities changes more considerably than SSIM. However, this T5–T6 impact on FID is comparable to the rotation test (T4), which leads to believe that both SSIM and FID may not be rotation invariant.
We can also observe that the best SSIM values (T7 to T9) also correspond to higher, and among the worst, FID scores. These different kinds of blur effects change very little the structure of the data, hence also do not affect as much on the SSIM. Conversely, the FID shows significant alterations (over 4 times the lowest FID) for this blurring sub-set.
Among the transformations tested, the one that both FID and SSIM clearly “agree” that provokes significant changes is the Salt & Pepper noise addition (T10), where both metrics scored worst.
In summary, SSIM can be safely used to focus on the correct structuring and placement of the anatomy, while FID can complement SSIM on the measurement of the sharpness of an image, looking at the high-frequency domain.
2.3.3. Pipeline DICE
A fairly common segmentation metric is the Sørensen–Dice coefficient which leverages the intersection over union. DICE has many variations, namely on how to present a single value when dealing with multiple labels, leaning more towards FP or FN (Tversky loss [29]). There is a differentiable, and less penalizing option that deals with belonging probabilities, rather than with label counts. We employ this softDICE [30] for evaluating the overall performance of this multi-label segmentation task, both as a validation score and as a training loss (1-score).
Even though we are aware of the issue softDICE presents as a learning loss [31], we were forced to consider it, as certain labels are severely under-represented, both on the frequency of occurrence within a patient’s volume and as the total area occupied. Previous experiments using cross-entropy loss or regular DICE were found to be largely fruitless, rendering segmentation outcomes that simply ignored those labels.
The segmentation network produces logits for each class/channel instead of probabilities. To help the learning and inference process, we normalize () these logits across each pixel label logits, creating true label probabilities that are later fed to softDICE.
3. Experiments and Results
3.1. Experimental Setup
We trained the models on a GeForce RTX 2080 Ti with 11 GB, until no significant qualitative differences were observed between the results of consecutive training iterations. All code was developed in Python (3.6.9) using PyTorch (1.5.1), Torchvision (0.6.1) and SciPy (1.5.1). The code is publicly available at INESC TEC’s public repository [32].
3.2. Dataset
The dataset used was provided by the BCCT.plan project (BCCT.plan—3D tool for planning breast cancer conservative treatment - NORTE-01-0247-FEDER-017688) and consists of 27 T1-weighted thoracic MRI exams from breast cancer patients, obtained with a Philips Ingenia 3.0T MRI scanner. Each exam comprises 60 gray-scale axial image slices, with a 3 mm thickness and a resolution between 550 and 750 pixels, squared (0.3–0.5 mm/pixel).
All exams have corresponding annotations consisting of label masks of the sternum, clavicle, nipple, pectoral muscle and breasts, all drawn manually by experts. Additionally, we automatically generated a label for the area occupied by the thoracic cavity between the rightmost and leftmost limits of the breasts label, to which we called Pleura, for convenience. Without this extra label, despite having very different intensity distributions, the entire thoracic cavity region and the background would have the same label, which would induce artifacts in the synthetic images. Naturally, this is not an extensive anatomical annotation as other potentially relevant structures are not finely marked, such as fibro-glandular tissue, vascular networks, the heart, ribs or intercostal muscles. Figure 5 shows some examples of the dataset for slices at the middle and the top of the torso.
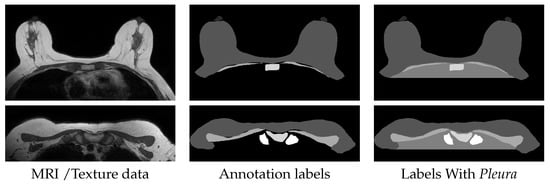
Figure 5.
Examples from the Dataset, with background cropped for reader convenience.
Of the 27 available exams, 21 were assigned for the training set, 3 for the validation set and 3 for test set. All images were cropped and padded into a square shape, excluding most of the background area, and resized to 256 × 256 pixels.
The generated synthetic magnetic resonance images have also 256 ×256 pixels. For brevity, we will be calling these datasets of fake data by synthetic sets or synthsets.
3.3. Experiments
3.3.1. MRI Generation
The main experiments focused on analyzing the generative capabilities of ResGAN, CycleGAN and Pix2PixHD for our dataset. Apart from the initial hyper-parameter empirical setting, we experiment with the variation of batch sizes (BS) and the inclusion of Experience Replay [22].
Experience Replay consists of keeping an image buffer that desynchronizes the images that the Discriminator (D) and the Generator (G) receive on a given iteration. Most importantly, this enables D to occasionally review images of older iterations in an effort to keep it from overfitting to the current state of G. Batch size tests were done for G with values 4, 8, 16, except for the CycleGAN architecture that had to be limited to one image per batch. Experience replay tests were done with a pool of 32 images, however, for similar hardware reasons, this test could not be performed coupled to Pix2PixHD.
All models were trained for 300 epochs, using a learning rate of 0.0002 for both the generator and the discriminator. The learning rate stayed constant for the first 150 epochs and was linearly decayed to 0 for the remainder epochs.
Of the experiments run, batch size 8 presented the best, or similar results to those of BS 16. Table 2 presents the metrics for these best models, per architecture, while Figure 6 shows visual results.

Table 2.
Generation test results (170 images). Presents the minimum (⊥), mean (), standard deviation () and maximum (⊤) values of SSIM and the FID results for each network, with respective batch sizes (BS).
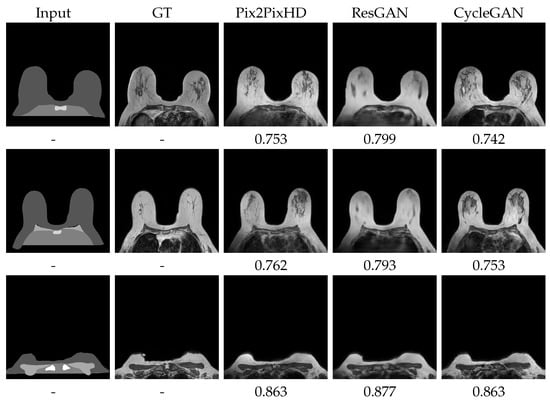
Figure 6.
Best visual test set generation results and respective SSIM. ResGAN and Pix2PixHD with BS8. CycleGAN with BS1 and Experience Replay. More results on Appendix A Figure A1 and Figure A2.
Although the objective of this work is to assess the effect of the synthetic images on the segmentation task, we tried to push forward those generative results that were visually closest to the original dataset. We largely assumed that a more faithful image set would induce a more reliable segmentation model.
Among the first experiments, was the usage of the original Pix2Pix architecture and its subsequent upgrading to a double GAN, cycle-consistent approach. The results for both versions were unimpressive at best. The generated images consisted of intensity blurred versions of the annotation-like input data, with no minimal texture similarity to that of the target MRI. The D losses always managed to quickly go to zero, which signaled its inability to properly enter an adversarial competition. We concluded that the U-Net skip connections did more harm than good and the common loss functions used were not enough to sway this architectural auto-correlatory bias. Here, the smaller scale nature of the residual blocks, present in other of the Pix2Pix variants used, and the absence of those encoder-decoder arching skip connections managed to produce more visually appealing results.
We noticed that, for all the Pix2Pix based models used, the channel concatenation of between the G input and the synthetic output was passed to the D’s input. We viewed this scheme with the rationale of the discriminator not only distinguishing if the received image is real or fake, but also as a task of verifying if that image is also truly matched with the G original input. However, for our dataset, we did not find a particular decrement when removing this feature. In fact, although, naturally the training loss increased with its removal, as the constant half of the target was no more, the inference visual and quantitative results remained similar.
In order to improve further the models, we started to employ several of the known tricks for improving GAN training. Apart from the experience replay previously presented (Section 3.3.1), we also examined the effects of label flipping, label smoothing and the addition of gaussian noise to the discriminator input with subsequent decay during training. We did not found their influence particularly relevant.
Finally, due to the nipple label being rather small and infrequent we also wanted to gauge the effect of consider it the same label as breasts. We found that the generated appearance was quite similar overall.
3.3.2. Semantic Segmentation
The segmentation part of the pipeline was performed over the original dataset, augmented with the synthetic images alternatively coming from each of the generative models. A factor of augmentation (p) was varied, ranging from just the original set (), to a set with as much real as synthetic data (). A more in-depth study regarding the effects of p is presented in Section 4.3.
Every model was trained for 75 epochs, using a learning rate of 0.0001. Like with the generative models, the learning rate stayed constant for the first half of the epochs and was linearly decayed to 0 for the remainder epochs.

Table 3.
Global segmentation test scores. Presents the minimum (⊥), mean (), standard deviation () and maximum (⊤) values of SSIM for the U-Net trained with the best synthset of each respective generator. The best no augmentation baseline (No Aug) is also shown.

Table 4.
Class-wise segmentation test scores. Presents the best DICE mean () and standard deviation () results for the labels: Background, Breast, Pleura, Pectoral Muscle, Sternum and Clavicules, respectively, for the augmentation experimental setups of each generator. The no augmentation baseline (No Aug) is also shown.
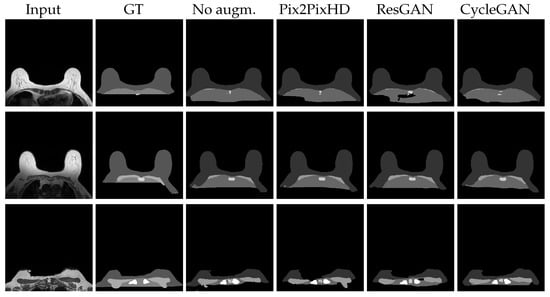
Figure 7.
Best visual test results for the segmentation U-Net, trained with the respective synthsets ResGAN and Pix2PixHD with BS8. CycleGAN with BS1 and Experience Replay. Further results on Appendix A Figure A3 and Figure A4.
The original code from the U-Net used [33] employed a cross-entropy loss function. We found that, due to the natural label imbalance of MRI volumes, cross-entropy loss, along with the single channel multi-label approach was not reaching sufficient results. We experimented briefly with cross-entropy loss coupled to a multi-channel output (a channel per label) setup, but results were also lackluster. After that, we promptly changed to DICE loss that yielded better results, and later to softDICE with the logit normalization trick (Section 2.3), to enhance training nuances and enable quicker learning and more accurate outcomes. Following this trajectory, and still somewhat concerned with balancing issues during training, we looked into replacing the DICE with, the related, Tversky Loss [29] (Section 2.3), tilting the overall metric towards False Negative reduction. With this we aimed to compensate the less frequently appearing labels (≈10%). We found that, in our setup, the Tversky loss did not provide significant change to results, and thus, we opted to continue with softDICE.
An additional experiment coupled the DICE loss with a relevance map, in which we weight differently regions of the label masks. We noticed that after the inclusion of the DICE loss some, fairly obvious, breast label portions started to be classified as background. Some holes started to appear in the middle of that label. On the other hand, the posterior regions that also included breast and pleura labels were correctly being predicted, even though the available labels did not include those portions. The model was correctly propagating the concept. We wanted to reward this behaviour and punish the middle of breast hole misclassification. To do so, we developed a relevance map, reducing the relative weight of the posterior portions of background label, starting from the most posterior pleura pixels. However, the visual outcomes did not provide obvious enhancements as this tradeoff improved some cases but worsened others. We opted to discard this concept on other experiments.
4. Discussion
Noticeably, the versions of the models we report in Section 2 generally contain less layers and use inputs of lower resolutions than in the original papers. In part, this is related with the lower native resolution of our data. On the other hand, the equipment listed in Section 3.1 limited the total number of parameters a model can leverage. These limitations, as it turns out, happen to not hamper substantially and still enable to conduct this study.
4.1. Generation Results
We can observe that the overall SSIM values are quite similar along the multiple case distribution. This seems to suggest that the structure and overall distortion nature is fairly similar across the results. FID, however, tells another story. FID clearly sets apart the highly complex Pix2PixHD and CycleGAN from the ResGAN experiments, which have a distance increment of around 50. This suggests that the properties in which FID differs from SSIM are those that change significantly between the approaches. Indeed, as Figure 6 confirms, the images of the single ResGAN generator present much more blurry content than the others. In fact, among the methods tested, ResGAN presented a D training loss that converged to zero. This suggests that the model by itself, with the available loss function, was not able to maintain the adversarial nature, while G was also not able to keep up with the D learning.
Concerning visual outputs, several additional details stand out. One of which is the prediction of Pleura and Breast portions, missing from the label map at the posterior chest zone. This produces a generated image very similar to the corresponding original MRI. In fact, on the generated images, the more than occasional presence of the completely unlabeled Latissumus Dorsi muscle can be observed on the bottom left and right image portions. The Pleura regions typically present patterns similar to those appearing on the training set, and, evidently, not replicating the respective original MRI image. However, these extrapolations seem fairly natural, even sometimes presenting the small “whitish” contours of the heart, at the center, on middle slices. The, also unlabeled, vascular network and fibro-glandular regions, at the center of each breast, show intricate patterns of the correct intensity levels, often mimicking the anatomy. On a final note, the generated images also sometimes replicate the overarching intensity distortions that frequently occur. Some of the most posterior portions present darker intensities, especially noticeable over the breast contours, as the pictures in Figure 6 display on the bottom left corners.
4.2. Segmentation Results
The global segmentation results in Table 3 suggest that the augmentation produces stable outcomes. In fact, all experiments with synthsets maintained their metrics to a surprising degree, as all average scores are well within a standard deviation of each other. Even the most changed scores—the minimum values—still have not changed significantly from the no augmentation outcomes.
The class-wise results of Table 4 and the image outcomes in Figure 7 shed a light on the focus of the network. It is immediately clear that the Background and Breast labels are mostly well segmented, with DICE’s over 94% on all sets. The central small Sternum area seems to be fairly well detected, or better put, when correctly identified, most of its area is accurately found, with DICE around 78% and a bit higher standard deviation (). Sometimes a central portion of the higher intensity Breast is confused for the also relatively bright Sternum label. This can be seen on all results on Figure 7’s bottom images. Pectoral muscle has slightly worse results. Though Pectoral muscle has visually appealing detections, the model is prone to produce long and thin objects, where there should be none, on slices under those that bear muscle (top images on Figure 7). It is also prone to under-segment this muscle if it is particularly permeated with fat, as in the middle images of Figure 7. Pleura’s metrics in Table 4 are in a tier similar to Pectoral muscle (≈65%), but visual results point out at general over-segmentation as the labels provided commonly are not extended to the bottom of the images. This, in our opinion, does not imply poor performance from the model. On the other hand, in some cases across the augmented set outcomes, the Pleura presents clustered regions that are classified as Background. An example of these “holes” is shown on the first row ResGAN image, in Figure 7. This misclassification coupled with the expected extrapolation explains the numeric results. Finally, the under-represented Clavicule label has, not surprisingly, the lower DICE values (≈50%). These results tend to occur due to a homogeneous mix of failure to accurately detect the object, spurious detections on incorrect places and confusion of other anatomical structures as Clavicule. Example of this is the sometimes “spreading detection”, where the correct object is erroneously propagated to an adjacent structure with similar textures and intensities. The general delineation, however, is often very accurate.
4.3. Model and Augmentation Stability
To understand the significance of the DICE metric differences within and between models, we thought of analyzing the stability of the segmenter outcomes using multiple random generation seeds. We aggregated the DICE values over 6 experiments, each with its own seed, and along a specific augmented set. The sets presented correspond to the pipeline that produced the best DICE scores for each generative model. Figure 8 shows how the DICE varied according to both generative architecture change and seed change.
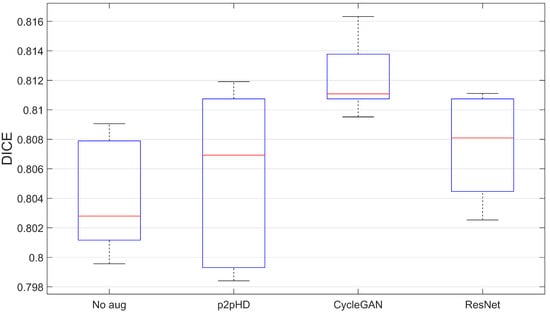
Figure 8.
Segmentation model stability results—seed variation.
The results seem to indicate that the proposition of this kind of augmentation manages to maintain the quality of results. While largely not hindering the generalisation process, the case of CycleGAN stands out as consistently positive, even if only by a 1% improvement.
4.4. Effects of Synthetic Data
Since the main focus of this work is to evaluate the effects of data augmentation on the training of the segmentation models, we perform a specific test: linearly increasing the percentage of synthetic set that is included along with the real data. After this inclusion peaks () and the synthset becomes the same size as the real one, we freeze the synthset and start reducing the amount of real data. This progresses until the real set is completely removed and only synthetic data remains ().
Figure 9 shows how this procedure affects the segmenter model’s DICE score. The study was performed for the synthsets provided by the two visually best architectures: the Pix2PixHD and CycleGAN.
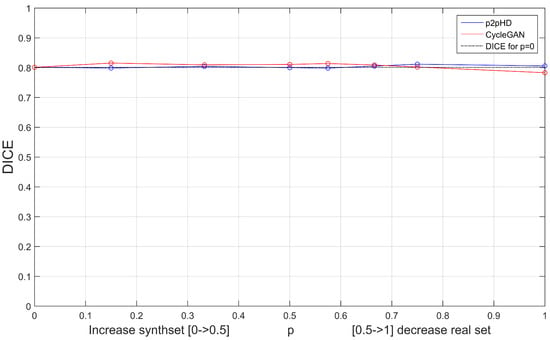
Figure 9.
Effects of augmentation () and removal of real data ().
The progression of p tells an interesting story. Both augmentation sets seem to produce fairly consistent outcomes, despite the fact that we are progressively reducing the contribution of the original set. By the mark, the CycleGAN enhanced U-Net was completely trained on synthetic data and only dropped under 3% from the original value (). The Pix2PixHD even managed to improve a little. This is particularly interesting as it suggests that, at least for this segmentation model, the generative properties passed onto the synthset were enough for the segmentation model to be adequately trained.
4.5. Region Error Profiles
Due to the different anatomy and structure distributions present among the image slices one could expect a similarly differential magnitude of errors along the slices. To answer this claim, we provide a study of error distributions by slice height on the torso (Figure 10). Slice 1 neighbours the limit between the abdominal and pulmonary regions, while slice 60 corresponds to the end of upper torso, nearing the top of the clavicles and the jugular notch.
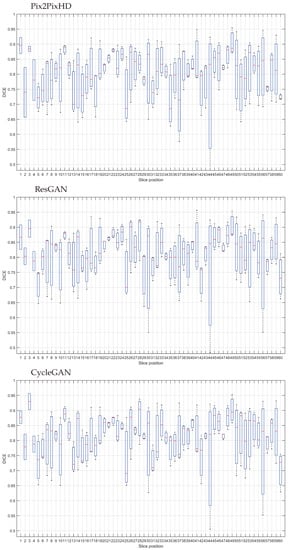
Figure 10.
Segmentation test set DICE results by slice position.
The results across the models are of approximate levels between the whole volume. It seems that the usage of DICE Loss for training the segmentation model managed to keep the balance between the different labels.
5. Conclusions
The availability of annotated datasets is a transversal problem in data science, in particular when concerning medical related exams. Some works have already tried to tackle this issue by approaching domain transfer tasks, employing generative adversarial networks. This work presents an application of some of these GANs to obtain synthetic MRI from label maps so to provide an augmentation dataset for segmentation purposes. We study some particularities of these generative architectures, their outcomes and the effects of these synthetic sets on the learning of a U-Net semantic segmentation network. We found that Pix2PixHD and CycleGAN show promising results on replicating the complexities of this MRI data, even with several degrees of freedom still remaining on the input label maps. We found that the cycle-consistency nature of the CycleGAN, although a useful setup, is not able to improve certain networks, such as the original U-Net based Pix2Pix. We also observed that the high frequency detail was not determinant for the successful segmentation of the label maps available and that Pix2PixHD and CycleGAN synthsets managed to maintain the discrimination capability of the U-Net, even after training was performed without the original set. The contributions made in this work are of practical nature. We aim to more precisely expand our theoretical understanding in the future. For future work we intend on introduce small manipulations of the existing annotation label maps to obtain different pairs and enhance the diversity of the augmented dataset, also leveraging a larger synthetic portion without removing the original data. An additional path to follow involves the annotation and use of more detailed label maps, with finer labels to assist to control the generation such as fibro-glandular tissue, vascular networks, the heart, ribs or intercostal muscles. After this, we plan on further training the segmentation network only on synthsets with larger sizes and evaluate its performance.
Author Contributions
Conceptualization, J.F.T., M.D., L.F.T. and H.P.O.; methodology, J.F.T.; software, J.F.T.; validation, J.F.T.; formal analysis, J.F.T., M.D.; investigation, J.F.T.; resources, E.B., J.C., L.F.T. and H.P.O.; data curation, J.F.T., M.D., E.B. and J.C.; writing—original draft preparation, J.F.T.; writing—review and editing, J.F.T., L.F.T. and H.P.O.; visualization, J.F.T.; supervision, J.F.T., L.F.T. and H.P.O.; project administration, J.F.T. and H.P.O.; funding acquisition, J.F.T. and H.P.O. All authors have read and agreed to the published version of the manuscript.
Funding
This research was funded by Fundação para a Ciência e a Tecnologia (FCT) grant within PhD grant number SFRH/BD/135834/2018.
Institutional Review Board Statement
The study was conducted according to the guidelines of the Declaration of Helsinki, and approved by the Ethics Committee of Champalimaud Clinical Centre, Champalimaud Foundation, protocol code BCCT.plan, 7 March 2017.
Informed Consent Statement
Informed consent was obtained from all subjects involved in the study.
Conflicts of Interest
The authors declare no conflict of interest. The funders had no role in the design of the study; in the collection, analyses, or interpretation of data; in the writing of the manuscript, or in the decision to publish the results.
Abbreviations
The following abbreviations are used in this manuscript:
| CT | Computed Tomography |
| GAN | Generative Adversarial Network |
| FID | Fréchet Inception Distance |
| MRI | Magnetic Resonance Imaging |
| SSIM | Structure Similarity Index Measure |
Appendix A
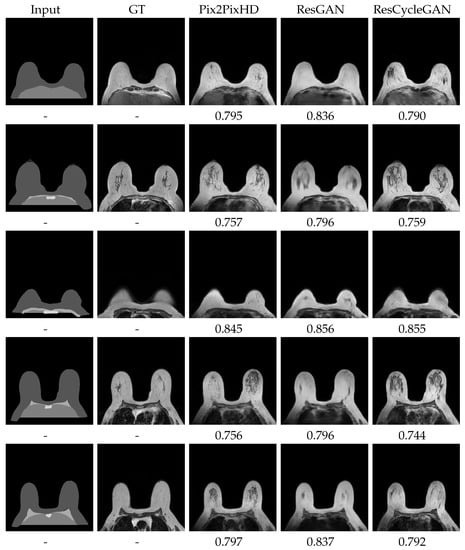
Figure A1.
Further best visual test set generation results and respective SSIM. ResGAN and Pix2PixHD with BS8. CycleGAN with BS1 and Experience Replay. Part 1.
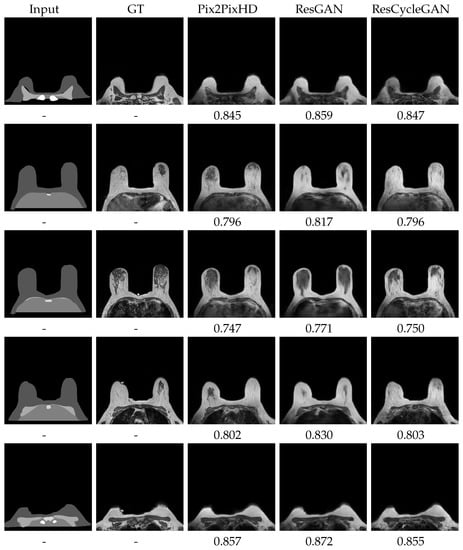
Figure A2.
Further best visual test set generation results and respective SSIM. ResGAN and Pix2Pix-HD with BS8. CycleGAN with BS1 and Experience Replay. Part 2.
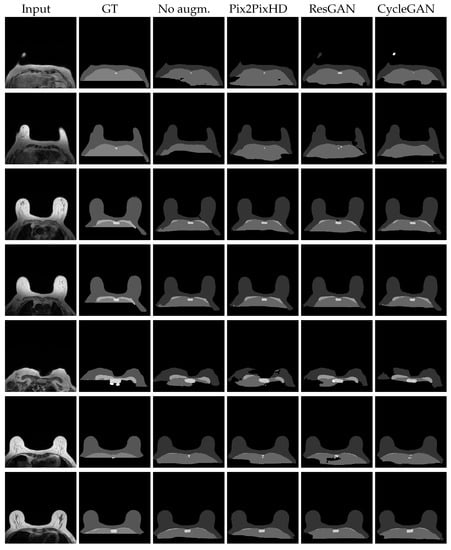
Figure A3.
Further best visual test results for the segmentation U-Net, trained with the respective synthsets ResGAN and Pix2PixHD with BS8. CycleGAN with BS1 and Experience Replay. Part 1.
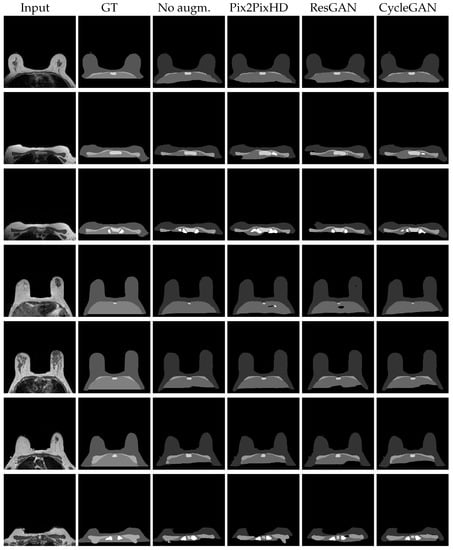
Figure A4.
Further best visual test results for the segmentation U-Net, trained with the respective synthsets ResGAN and Pix2PixHD with BS8. CycleGAN with BS1 and Experience Replay. Part 2.
References
- Goodfellow, I.; Pouget-Abadie, J.; Mirza, M.; Xu, B.; Warde-Farley, D.; Ozair, S.; Courville, A.; Bengio, Y. Generative Adversarial Nets. In Advances in Neural Information Processing Systems 27 (NIPS2014); MIT Press: Cambridge, MA, USA, 2014; pp. 2672–2680. [Google Scholar]
- Radford, A.; Metz, L.; Chintala, S. Unsupervised Representation Learning with Deep Convolutional Generative Adversarial Networks. In Proceedings of the 4th International Conference on Learning Representations, San Juan, Puerto Rico, 2–4 May 2016. [Google Scholar]
- Ledig, C.; Theis, L.; Huszár, F.; Caballero, J.; Cunningham, A.; Acosta, A.; Aitken, A.; Tejani, A.; Totz, J.; Wang, Z.; et al. Photo-Realistic Single Image Super-Resolution Using a Generative Adversarial Network. In Proceedings of the 2017 IEEE Conference on Computer Vision and Pattern Recognition (CVPR), Honolulu, HI, USA, 21–26 July 2017; pp. 105–114. [Google Scholar] [CrossRef]
- Nie, D.; Trullo, R.; Lian, J.; Wang, L.; Petitjean, C.; Ruan, S.; Wang, Q.; Shen, D. Medical Image Synthesis with Deep Convolutional Adversarial Networks. IEEE Trans. Biomed. Eng. 2018, 65, 2720–2730. [Google Scholar] [CrossRef] [PubMed]
- Kaiser, B.; Albarqouni, S. MRI to CT Translation with GANs. arXiv 2019, arXiv:1901.05259. [Google Scholar]
- Wolterink, J.; Dinkla, A.; Savenije, M.; Seevinck, P.; van den Berg, C.; Išgum, I. Deep MR to CT Synthesis Using Unpaired Data. In Simulation and Synthesis in Medical Imaging; Tsaftaris, S.A., Gooya, A., Frangi, A.F., Prince, J.L., Eds.; Springer: Québec City, QC, Canada, 2017; pp. 14–23. [Google Scholar]
- Dar, S.U.; Yurt, M.; Karacan, L.; Erdem, A.; Erdem, E.; Çukur, T. Image Synthesis in Multi-Contrast MRI with Conditional Generative Adversarial Networks. IEEE Trans. Med. Imaging 2019, 38, 2375–2388. [Google Scholar] [CrossRef] [PubMed]
- Olut, S.; Sahin, Y.; Demir, U.; Unal, G. Generative Adversarial Training for MRA Image Synthesis Using Multi-contrast MRI. In Predictive Intelligence in MEdicine (PRIME2018); Rekik, I., Unal, G., Adeli, E., Park, S.H., Eds.; Springer: Cham, Switzerland, 2018; pp. 147–154. [Google Scholar]
- Frid-Adar, M.; Diamant, I.; Klang, E.; Amitai, M.; Goldberger, J.; Greenspan, H. GAN-based synthetic medical image augmentation for increased CNN performance in liver lesion classification. Neurocomputing 2018, 321, 321–331. [Google Scholar] [CrossRef]
- Han, C.; Hayashi, H.; Rundo, L.; Araki, R.; Shimoda, W.; Muramatsu, S.; Furukawa, Y.; Mauri, G.; Nakayama, H. GAN-based synthetic brain MR image generation. In Proceedings of the 2018 IEEE 15th International Symposium on Biomedical Imaging (ISBI 2018), Washington, DC, USA, 4–7 April 2018; pp. 734–738. [Google Scholar] [CrossRef]
- Sanchez, I.; Vilaplana, V. Brain MRI super-resolution using 3D generative adversarial networks. arXiv 2018, arXiv:1812.11440. [Google Scholar]
- Armanious, K.; Jiang, C.; Fischer, M.; Küstner, T.; Hepp, T.; Nikolaou, K.; Gatidis, S.; Yang, B. MedGAN: Medical image translation using GANs. Comput. Med. Imaging Graph. 2020, 79, 101684. [Google Scholar] [CrossRef] [PubMed]
- Isola, P.; Zhu, J.; Zhou, T.; Efros, A.A. Image-to-Image Translation with Conditional Adversarial Networks. In Proceedings of the 2017 IEEE Conference on Computer Vision and Pattern Recognition (CVPR), Honolulu, HI, USA, 21–26 July 2017; pp. 5967–5976. [Google Scholar] [CrossRef]
- Shin, H.C.; Tenenholtz, N.A.; Rogers, J.K.; Schwarz, C.G.; Senjem, M.L.; Gunter, J.L.; Andriole, K.P.; Michalski, M. Medical Image Synthesis for Data Augmentation and Anonymization Using Generative Adversarial Networks. In Simulation and Synthesis in Medical Imaging; Springer: Cham, Switzerland, 2018; pp. 1–11. [Google Scholar]
- Costa, P.; Galdran, A.; Meyer, M.I.; Niemeijer, M.; Abràmoff, M.; Mendonça, A.M.; Campilho, A. End-to-End Adversarial Retinal Image Synthesis. IEEE Trans. Med. Imaging 2018, 37, 781–791. [Google Scholar] [CrossRef] [PubMed]
- Park, T.; Efros, A.A.; Zhang, R.; Zhu, J.Y. Contrastive Learning for Unpaired Image-to-Image Translation. In Computer Vision—ECCV 2020; Vedaldi, A., Bischof, H., Brox, T., Frahm, J.M., Eds.; Springer: Cham, Switzerland, 2020; pp. 319–345. [Google Scholar]
- Wang, T.C.; Liu, M.Y.; Zhu, J.Y.; Tao, A.; Kautz, J.; Catanzaro, B. High-resolution image synthesis and semantic manipulation with conditional gans. In Proceedings of the IEEE Conference on Computer Vision and Pattern Recognition, Salt Lake City, UT, USA, 23 June 2018; pp. 8798–8807. [Google Scholar]
- Heusel, M.; Ramsauer, H.; Unterthiner, T.; Nessler, B.; Hochreiter, S. GANs Trained by a Two Time-Scale Update Rule Converge to a Local Nash Equilibrium. In Proceedings of the 31st International Conference on Neural Information Processing Systems, Long Beach, CA, USA, 4–9 December 2017; Curran Associates Inc.: Red Hook, NY, USA, 2017; pp. 6629–6640. [Google Scholar]
- Wang, Z.; Simoncelli, E.P.; Bovik, A.C. Multiscale structural similarity for image quality assessment. In Proceedings of the Thirty-Seventh Asilomar Conference on Signals, Systems and Computers, Pacific Grove, CA, USA, 9–12 November 2003; Volume 2, pp. 1398–1402. [Google Scholar] [CrossRef]
- Ronneberger, O.; Fischer, P.; Brox, T. U-Net: Convolutional Networks for Biomedical Image Segmentation. In Medical Image Computing and Computer-Assisted Intervention—MICCAI 2015; Navab, N., Hornegger, J., Wells, W., Frangi, A., Eds.; Springer: Cham, Switzerland, 2015; pp. 234–241. [Google Scholar] [CrossRef]
- He, K.; Zhang, X.; Ren, S.; Sun, J. Deep Residual Learning for Image Recognition. In Proceedings of the 2016 IEEE Conference on Computer Vision and Pattern Recognition (CVPR), Las Vegas, NV, USA, 27–30 June 2016; pp. 770–778. [Google Scholar] [CrossRef]
- Zhu, J.; Park, T.; Isola, P.; Efros, A. Unpaired Image-to-Image Translation Using Cycle-Consistent Adversarial Networks. In Proceedings of the 2017 IEEE International Conference on Computer Vision (ICCV), Venice, Italy, 22–29 October 2017; pp. 2242–2251. [Google Scholar] [CrossRef]
- Simonyan, K.; Zisserman, A. Very Deep Convolutional Networks for Large-Scale Image Recognition. In Proceedings of the 3rd International Conference on Learning Representations, San Diego, CA, USA, 7–9 May 2015. [Google Scholar]
- Mardani, M.; Gong, E.; Cheng, J.Y.; Vasanawala, S.; Zaharchuk, G.; Xing, L.; Pauly, J. Deep Generative Adversarial Neural Networks for Compressive Sensing MRI. IEEE Trans. Med. Imaging 2019, 38, 167–179. [Google Scholar] [CrossRef] [PubMed]
- Chartsias, A.; Joyce, T.; Giuffrida, M.; Tsaftaris, S. Multimodal MR Synthesis via Modality-Invariant Latent Representation. IEEE Trans. Med. Imaging 2018, 37, 803–814. [Google Scholar] [CrossRef] [PubMed]
- Karras, T.; Aila, T.; Laine, S.; Lehtinen, J. Progressive growing of GANs for improved quality, stability and variation. In Proceedings of the 6th International Conference on Learning Representations (ICLR2018), Vancouver, BC, Canada, 30 April 2018; pp. 1–26. [Google Scholar]
- Salimans, T.; Goodfellow, I.; Zaremba, W.; Cheung, V.; Radford, A.; Chen, X. Improved Techniques for Training GANs. In Proceedings of the 30th International Conference on Neural Information Processing Systems, Barcelona, Spain, 4–9 December 2016; Curran Associates Inc.: Red Hook, NY, USA, 2016; pp. 2234–2242. [Google Scholar]
- Borji, A. Pros and cons of GAN evaluation measures. Comput. Vis. Image Underst. 2019, 179, 41–65. [Google Scholar] [CrossRef]
- Salehi, S.; Erdogmus, D.; Gholipour, A. Tversky Loss Function for Image Segmentation Using 3D Fully Convolutional Deep Networks. In Machine Learning in Medical Imaging; Wang, Q., Shi, Y., Suk, H.I., Suzuki, K., Eds.; Springer: Cham, Switzerland, 2017; pp. 379–387. [Google Scholar]
- Sudre, C.; Li, W.; Vercauteren, T.; Ourselin, S.; Cardoso, M. Generalised Dice Overlap as a Deep Learning Loss Function for Highly Unbalanced Segmentations. In Deep Learning in Medical Image Analysis and Multimodal Learning for Clinical Decision Support; Cardoso, M., Arbel, T., Carneiro, G., Syeda-Mahmood, T., Tavares, J., Moradi, M., Bradley, A., Greenspan, H., Papa, J., Madabhushi, A., et al., Eds.; Springer: Cham, Switzerland, 2017; pp. 240–248. [Google Scholar] [CrossRef]
- Bertels, J.; Robben, D.; Vandermeulen, D.; Suetens, P. Optimization with Soft Dice Can Lead to a Volumetric Bias. In Brainlesion: Glioma, Multiple Sclerosis, Stroke and Traumatic Brain Injuries; Crimi, A., Bakas, S., Eds.; Springer: Cham, Switzerland, 2020; pp. 89–97. [Google Scholar]
- Teixeira, J.F. Anatomical Label Maps to Breast MRI-Repository. Available online: https://gitlab.inesctec.pt/ippr-pub/labels2breastmri (accessed on 15 May 2021).
- Alexandre, M. UNet: Semantic Segmentation with PyTorch-Repository. Available online: https://github.com/milesial/Pytorch-U-Net (accessed on 3 November 2020).
Publisher’s Note: MDPI stays neutral with regard to jurisdictional claims in published maps and institutional affiliations. |
© 2021 by the authors. Licensee MDPI, Basel, Switzerland. This article is an open access article distributed under the terms and conditions of the Creative Commons Attribution (CC BY) license (https://creativecommons.org/licenses/by/4.0/).