Initiation and Propagation Processes of Internal Fatigue Cracks in β Titanium Alloy Based on Fractographic Analysis


Abstract
1. Introduction
2. Fatigue Test Conditions and Results
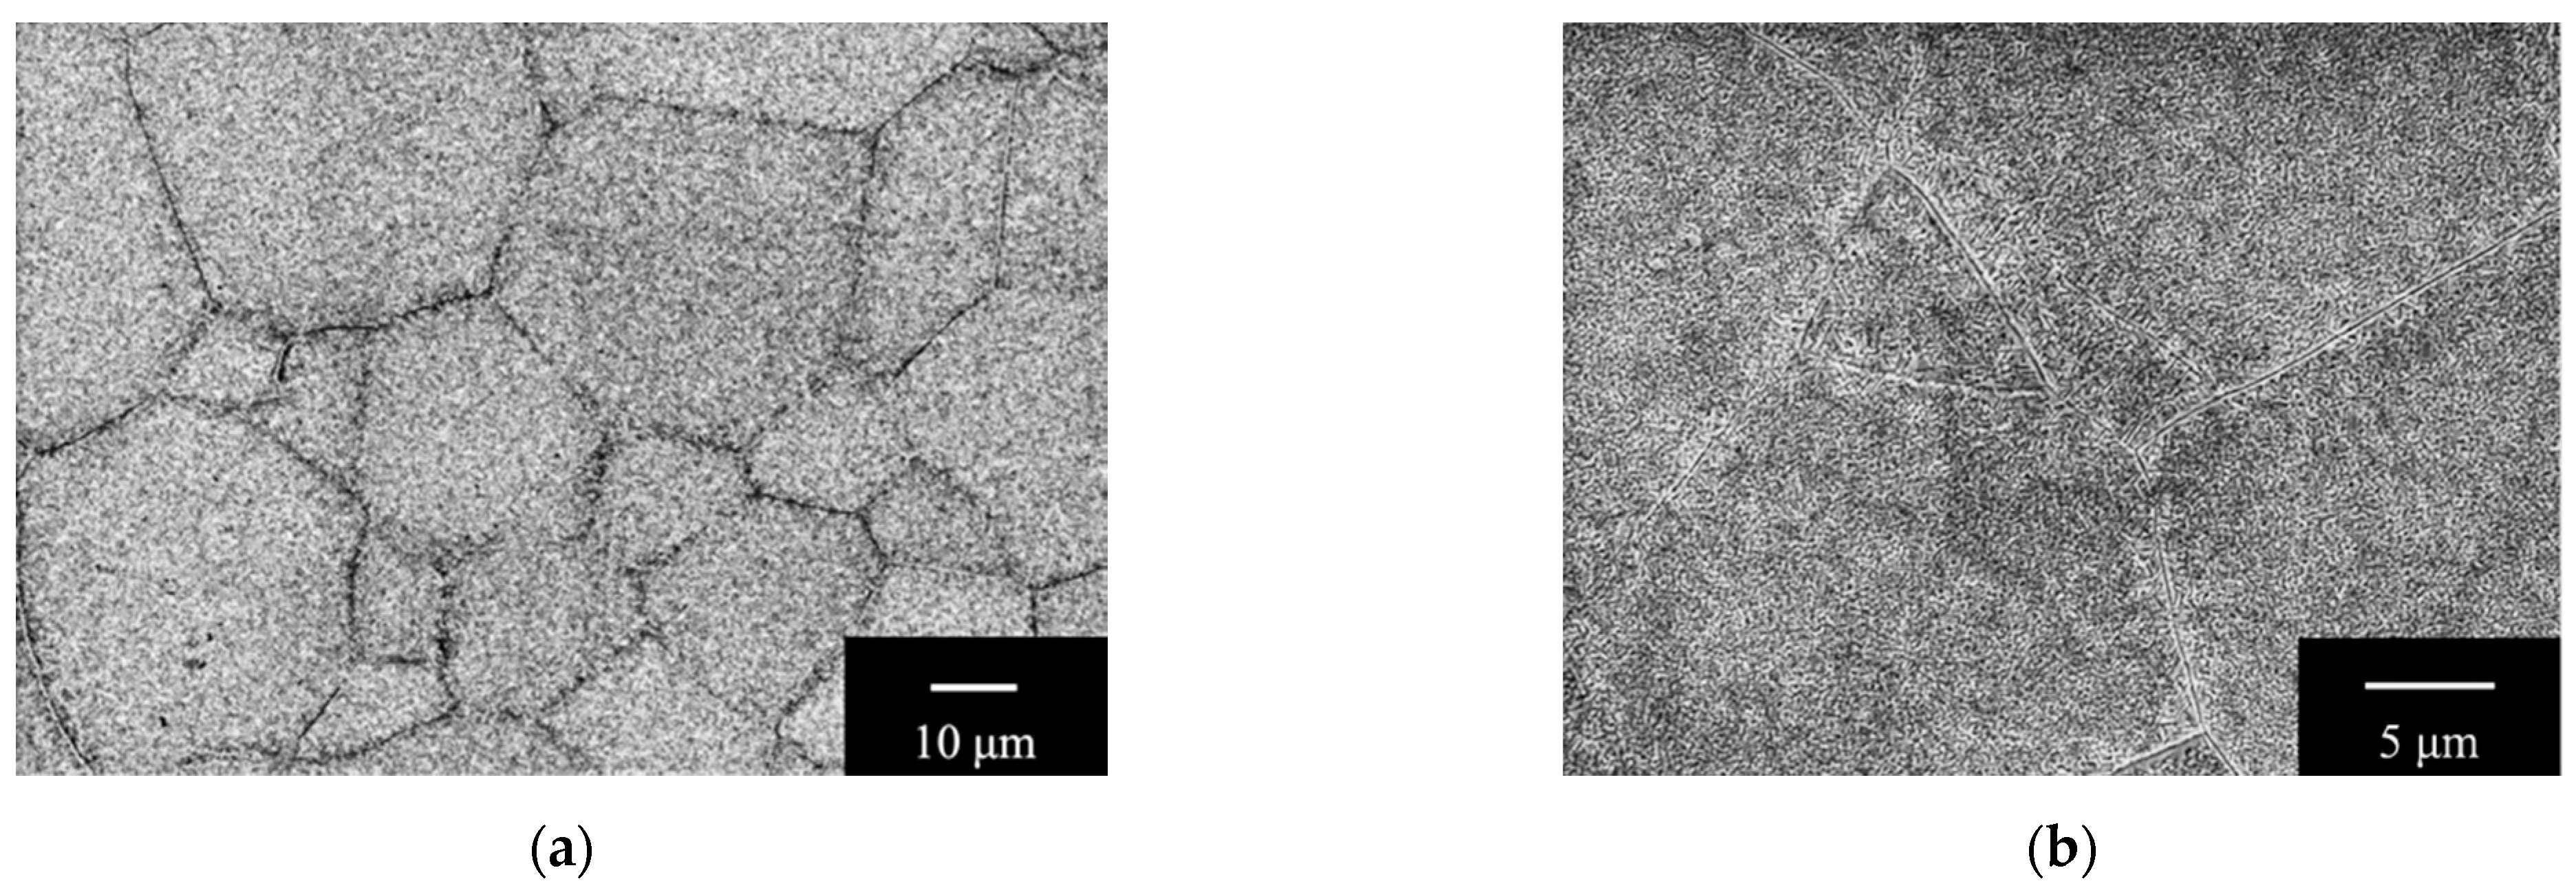
2.1. Test Material and Fatigue Test Conditions
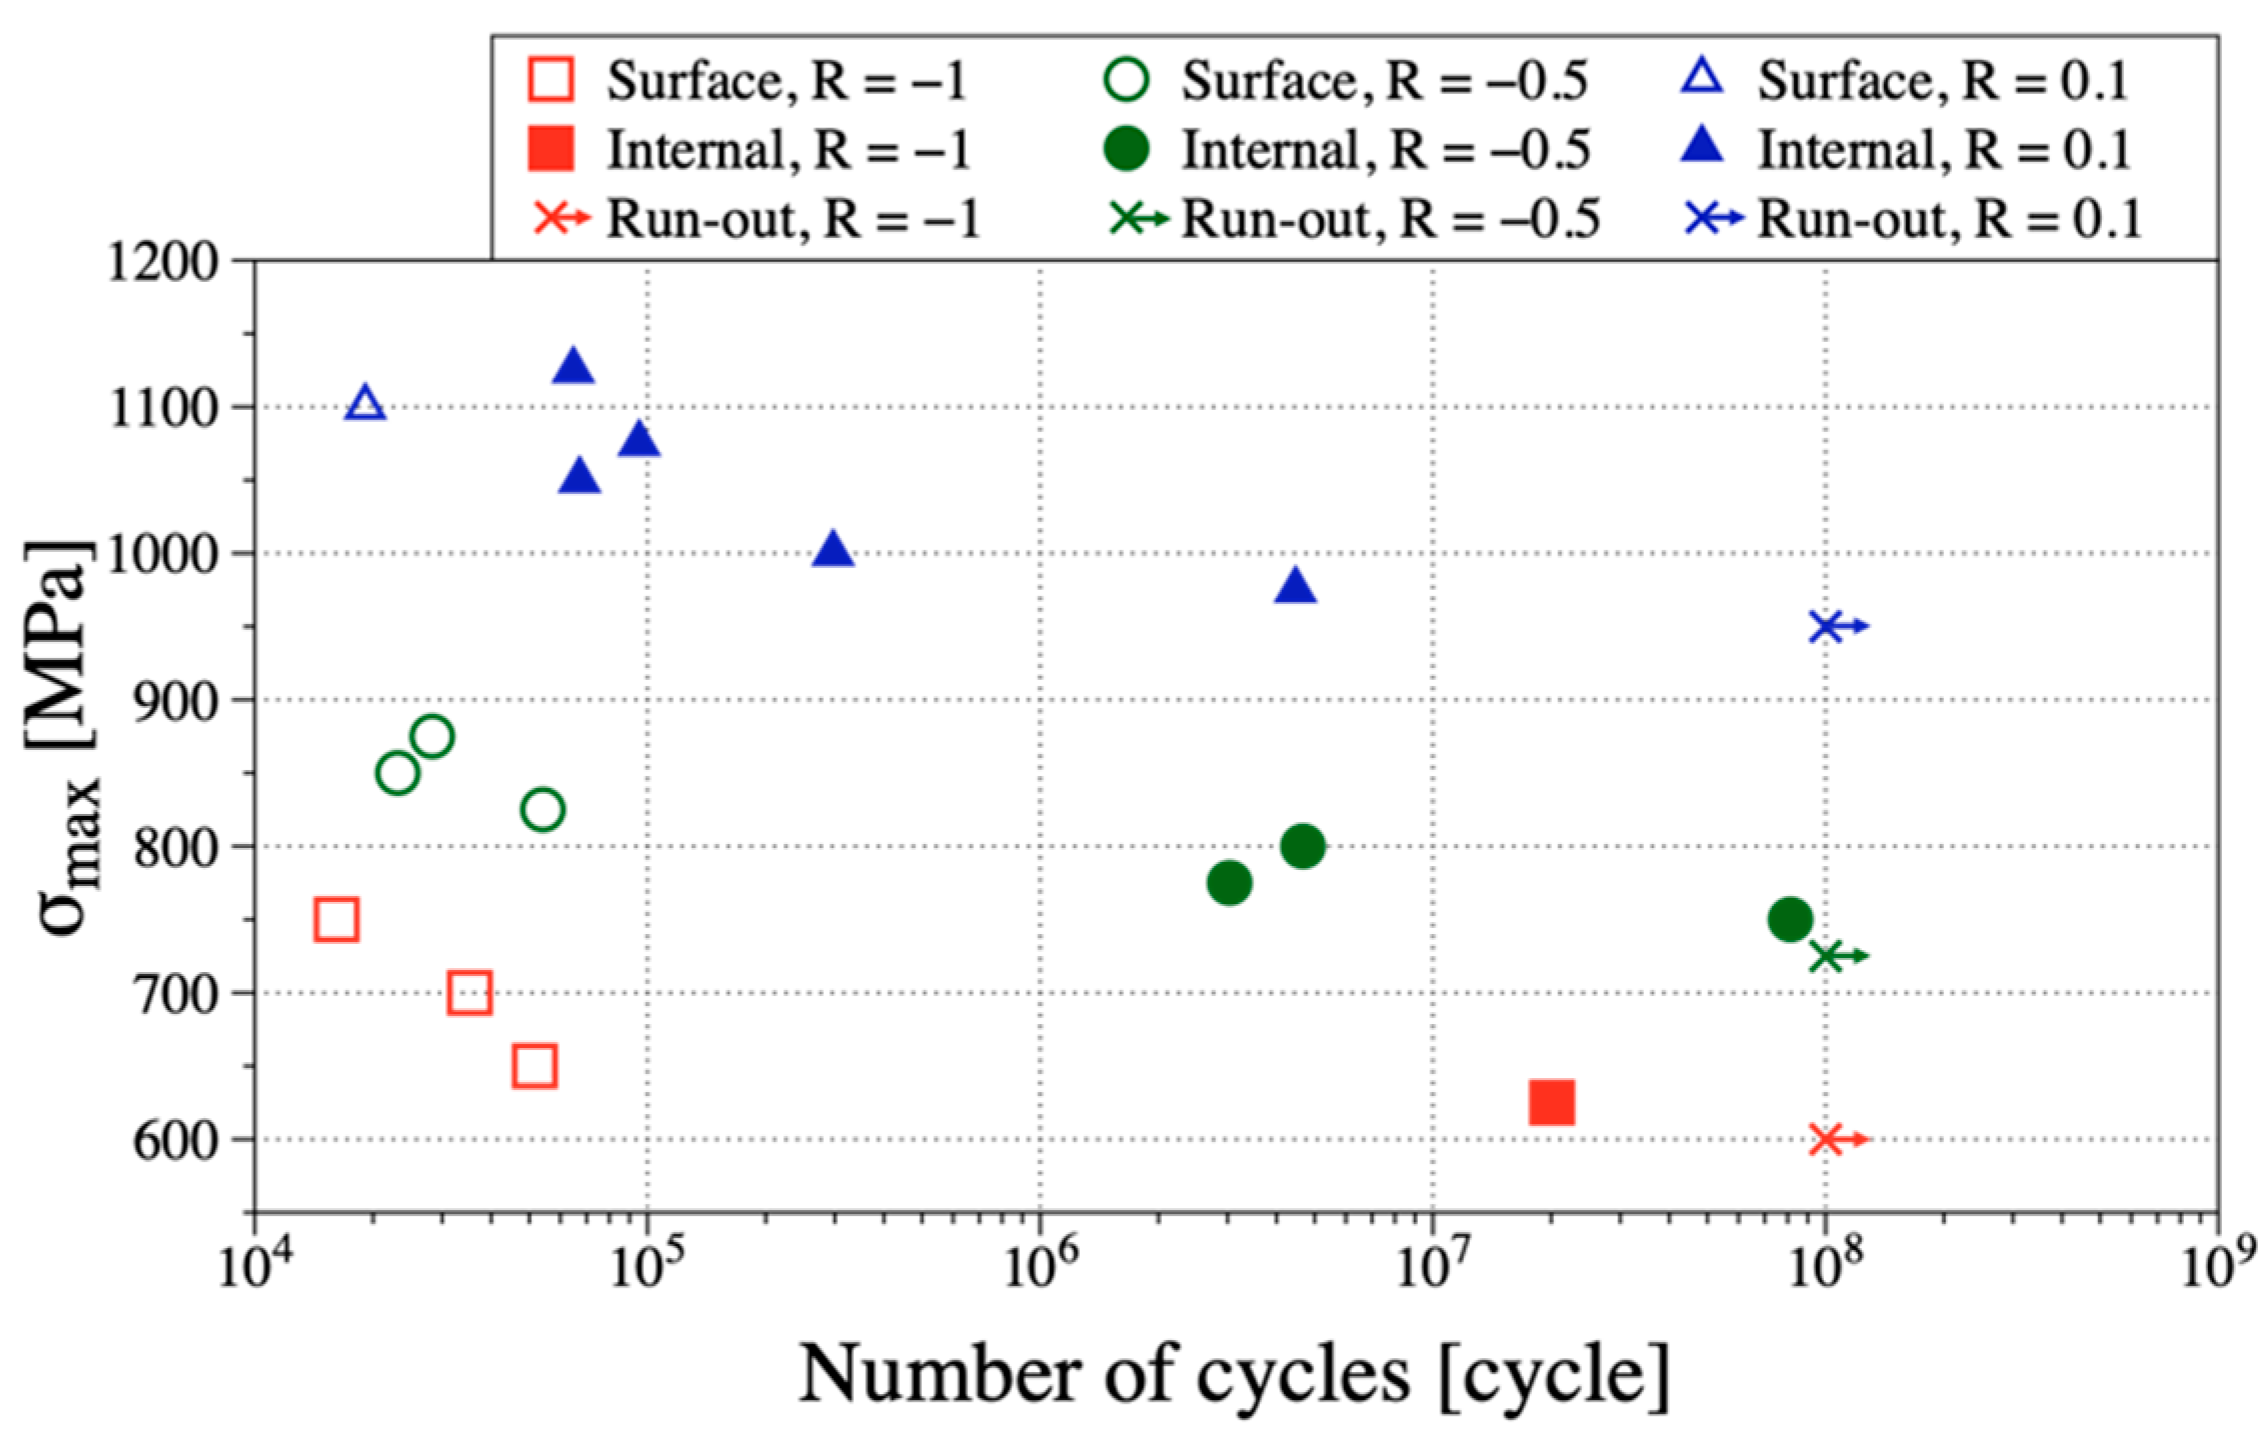
2.2. Fatigue Test Results
3. Fractography
3.1. Condition of Fracture Surface Observation
3.2. Fracture Surface Characteristics
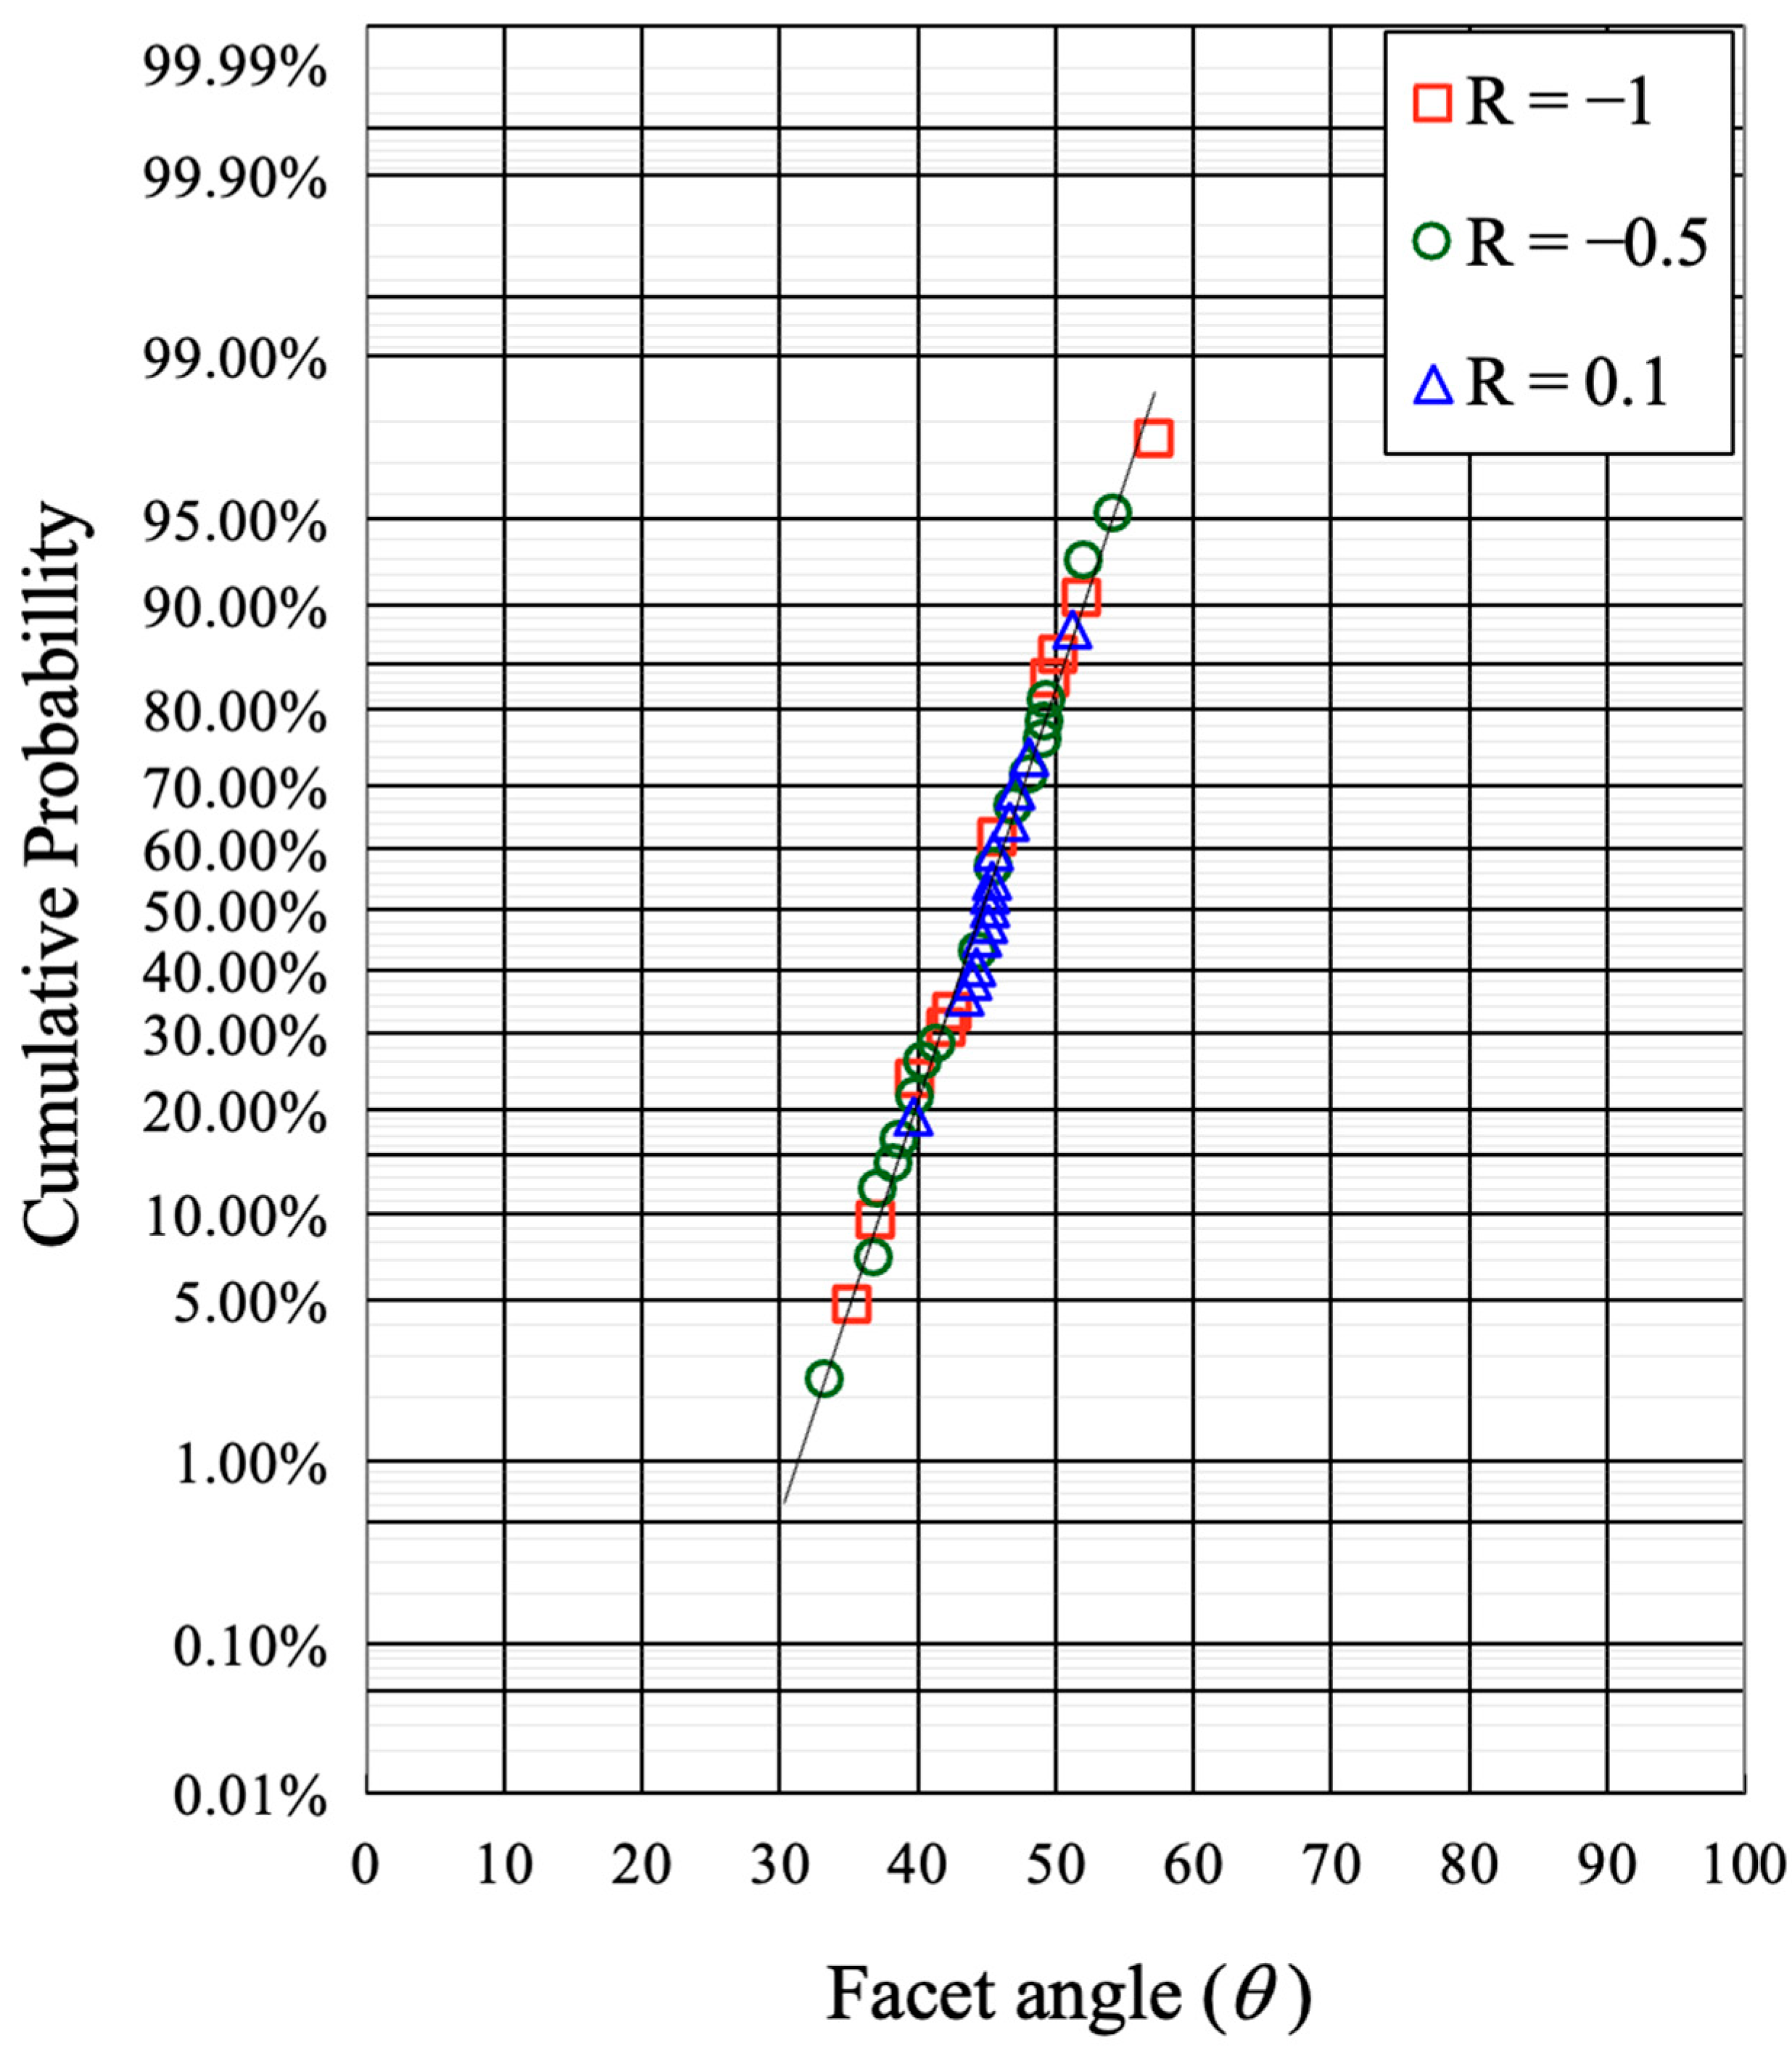
3.3. Facet Angle Statistics
3.4. Facet Surface Features of the Internal Fracture
3.4.1. Positive Stress Ratio
3.4.2. Negative Stress Ratios
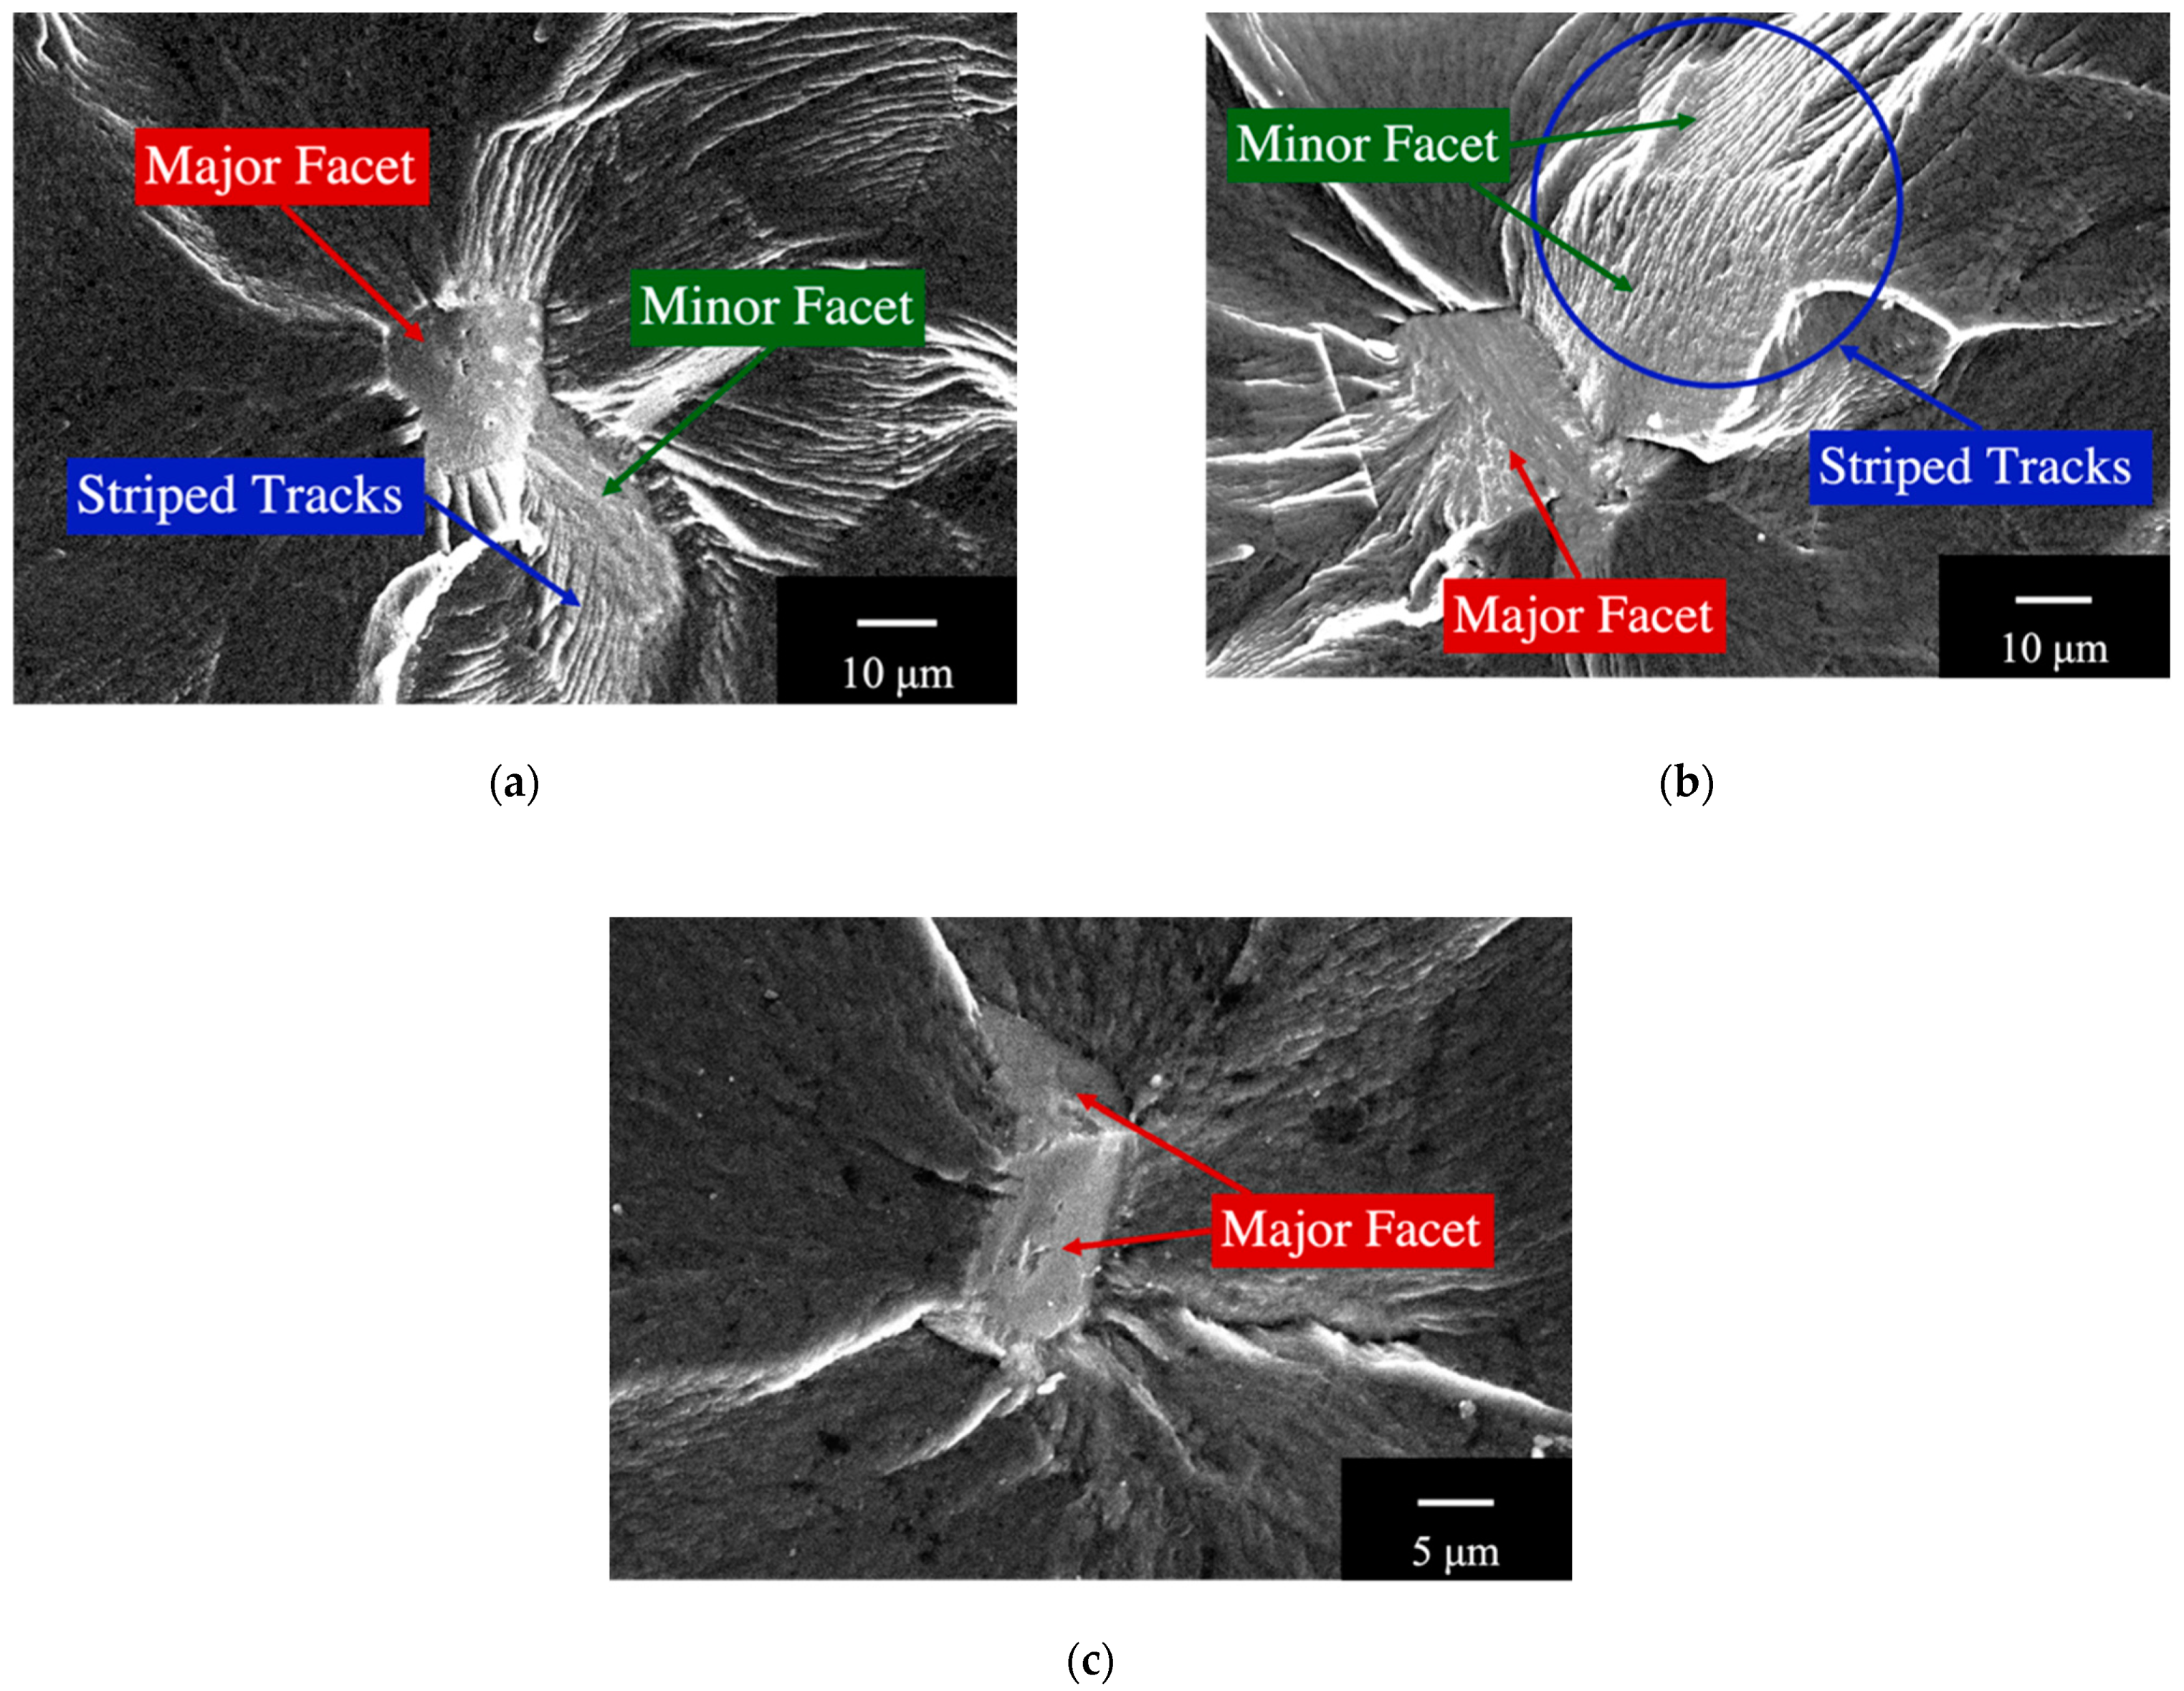
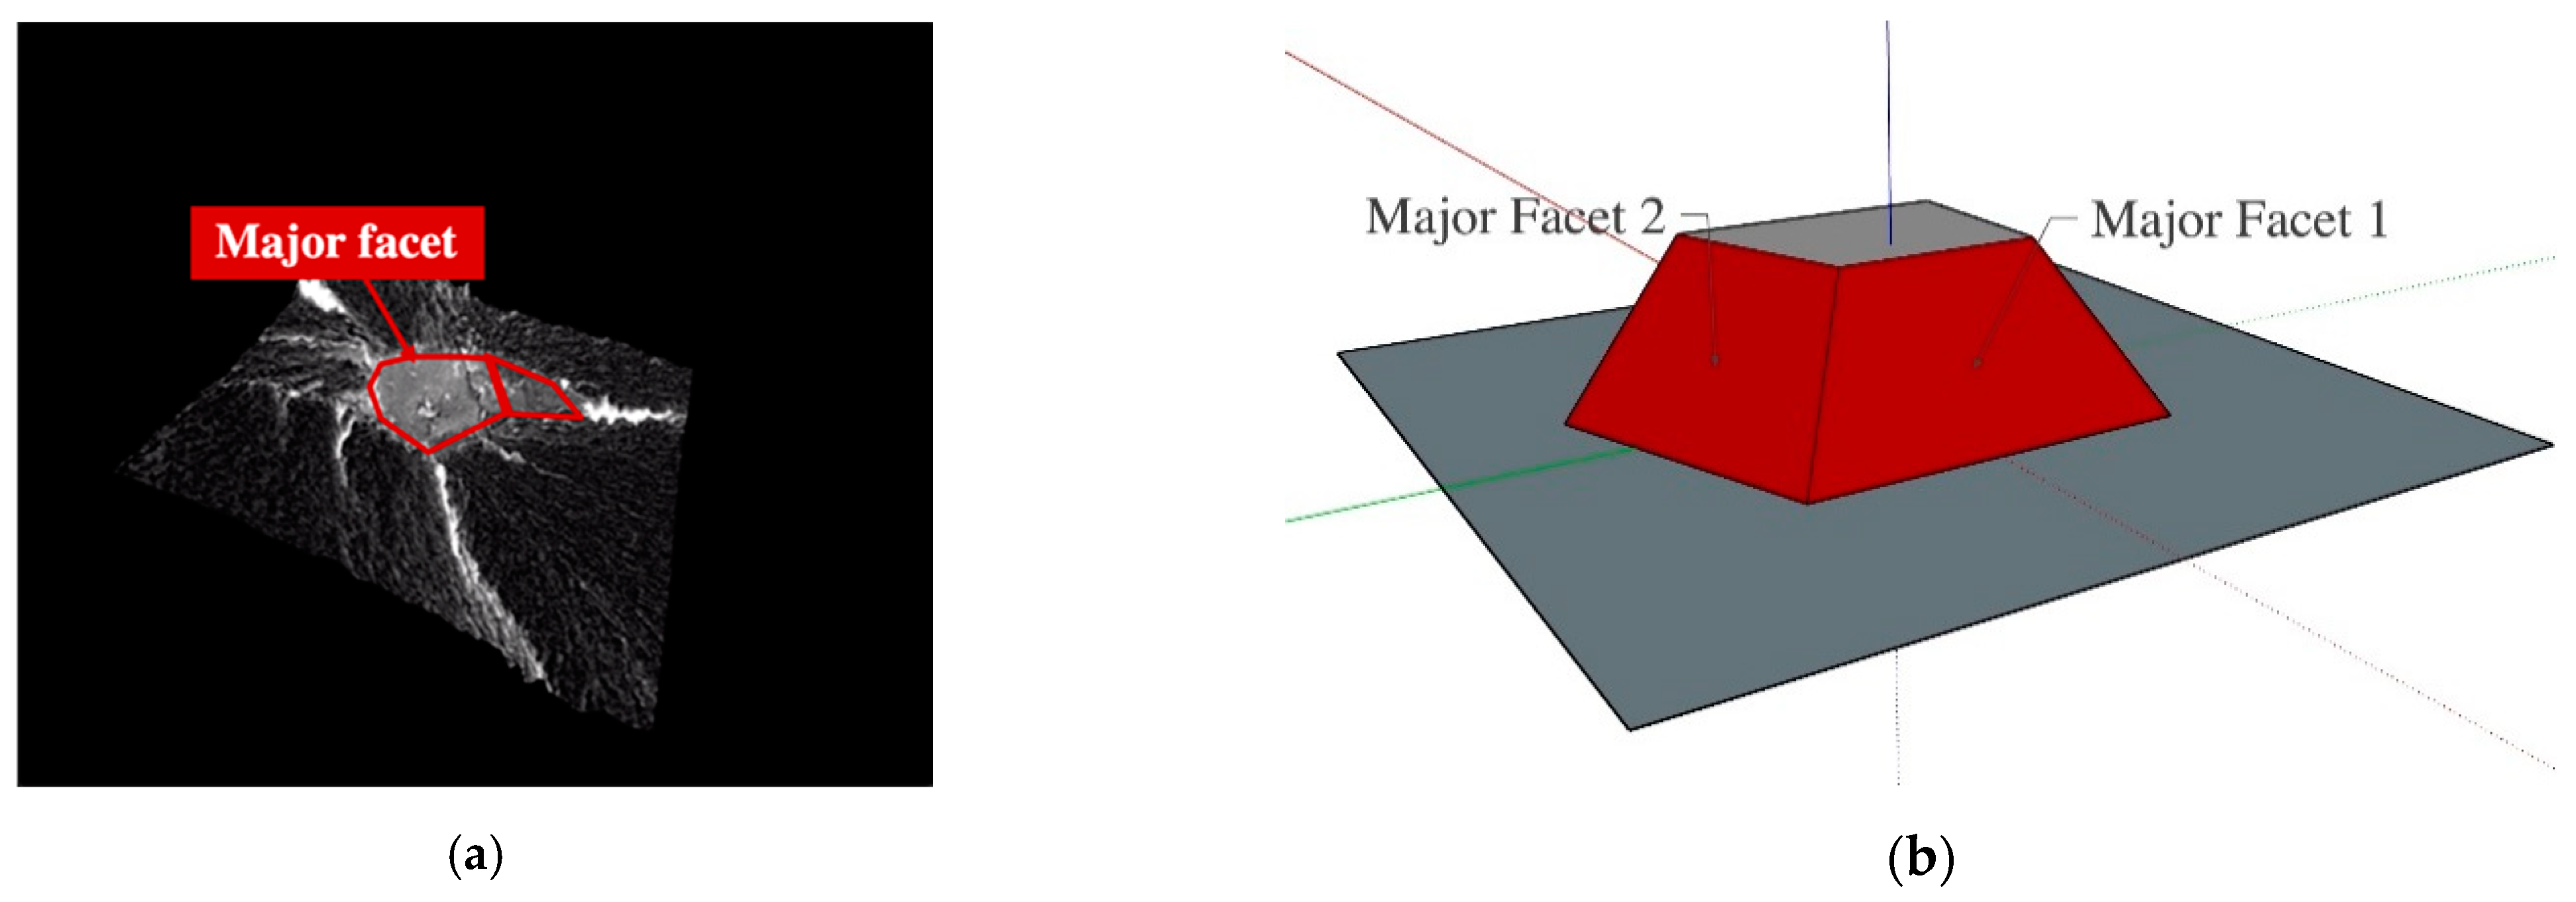
3.5. Facet Bonding Patterns
3.5.1. Slope Type
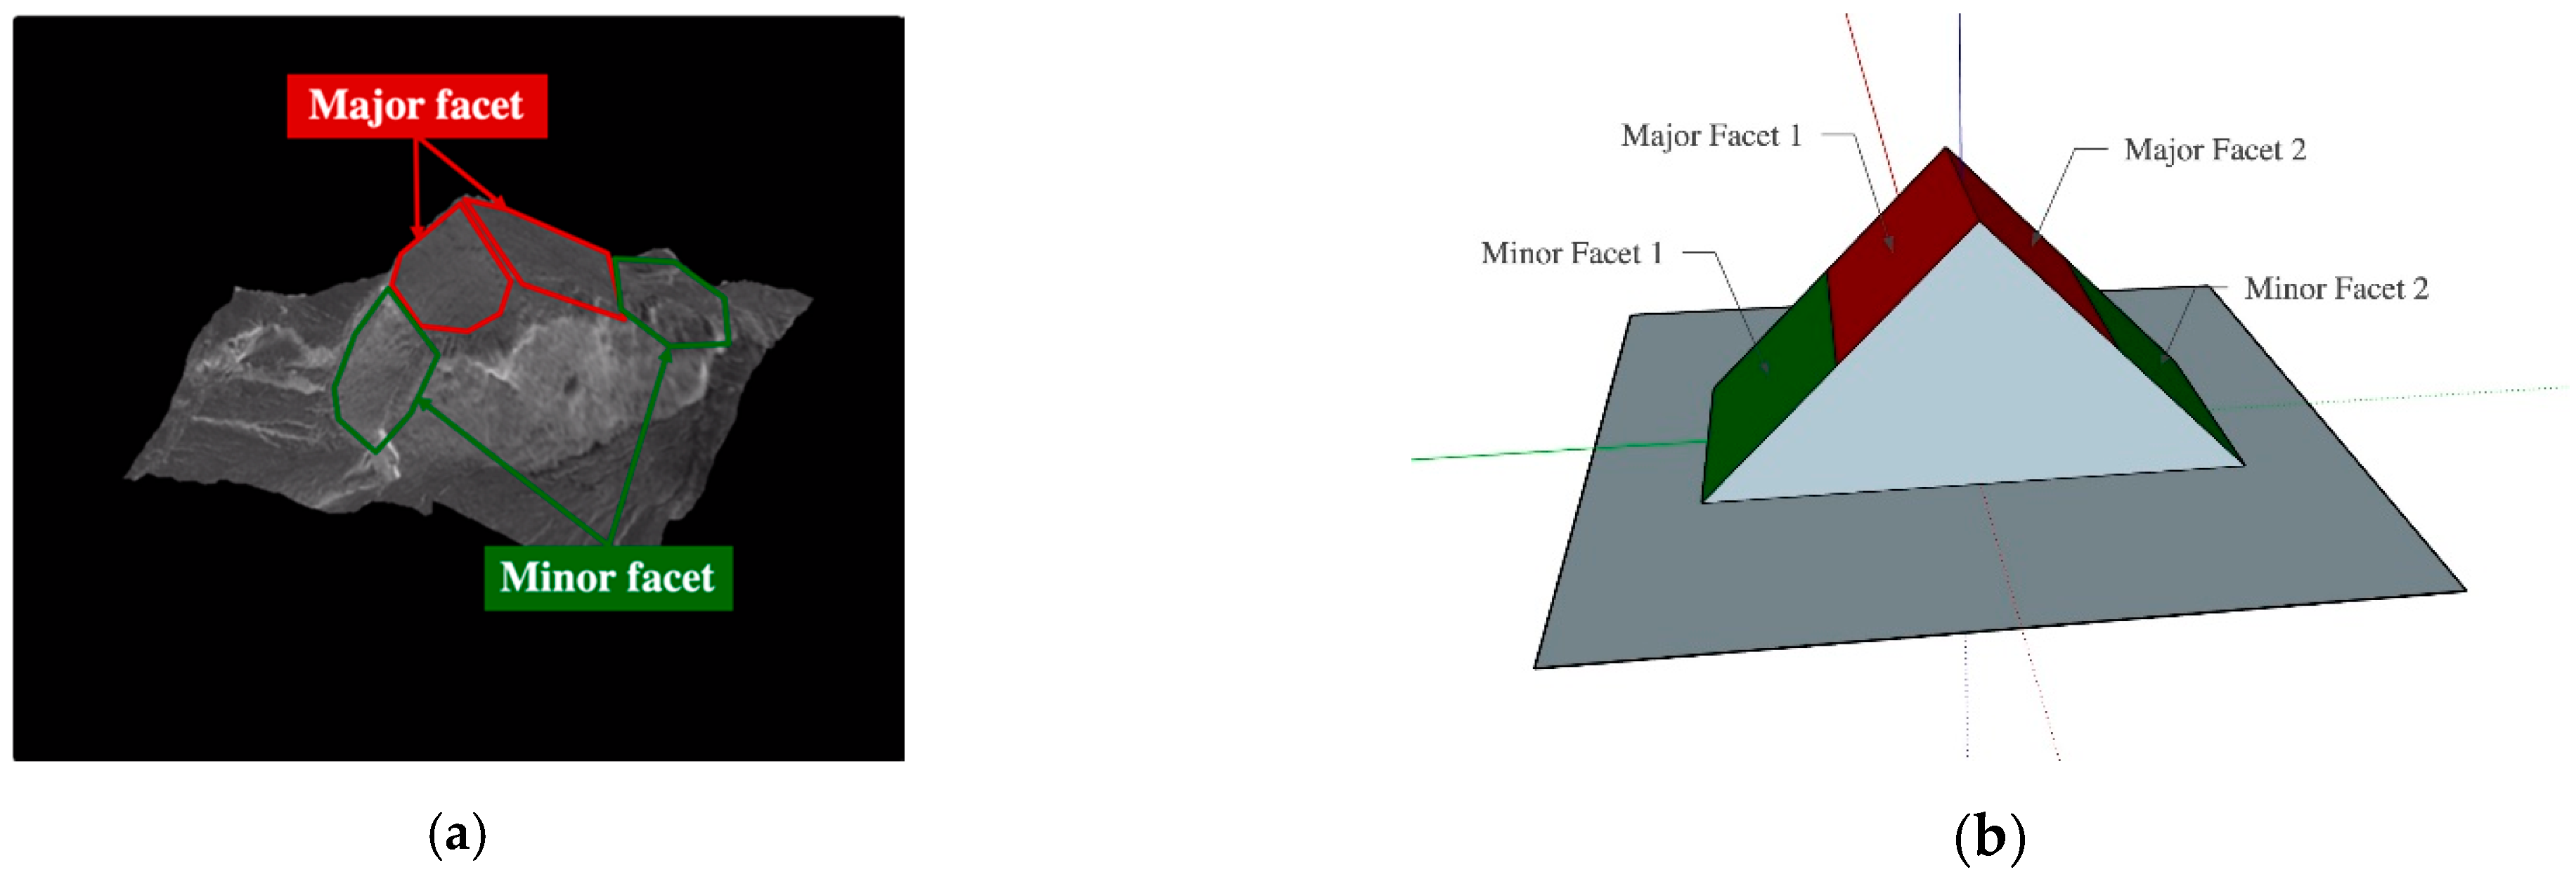
3.5.2. Peak Type
3.5.3. Combination Type
4. Discussion
4.1. Derivation of the Material Constants in Paris Law Based on the Tanaka-Akiniwa Model
4.2. Fatigue Life Prediction
4.3. Effect of the Crack Initiation Life and Facet Formation Life on the Derivation Process of the Material Constants
5. Conclusions
- The S-N curves under negative stress ratios exhibit a step-wise shape with a fatigue limit of the surface fracture. However, under a positive stress ratio, the fatigue limit of the surface fracture becomes less remarkable, and the S-N curve exhibited an asymptote shape.
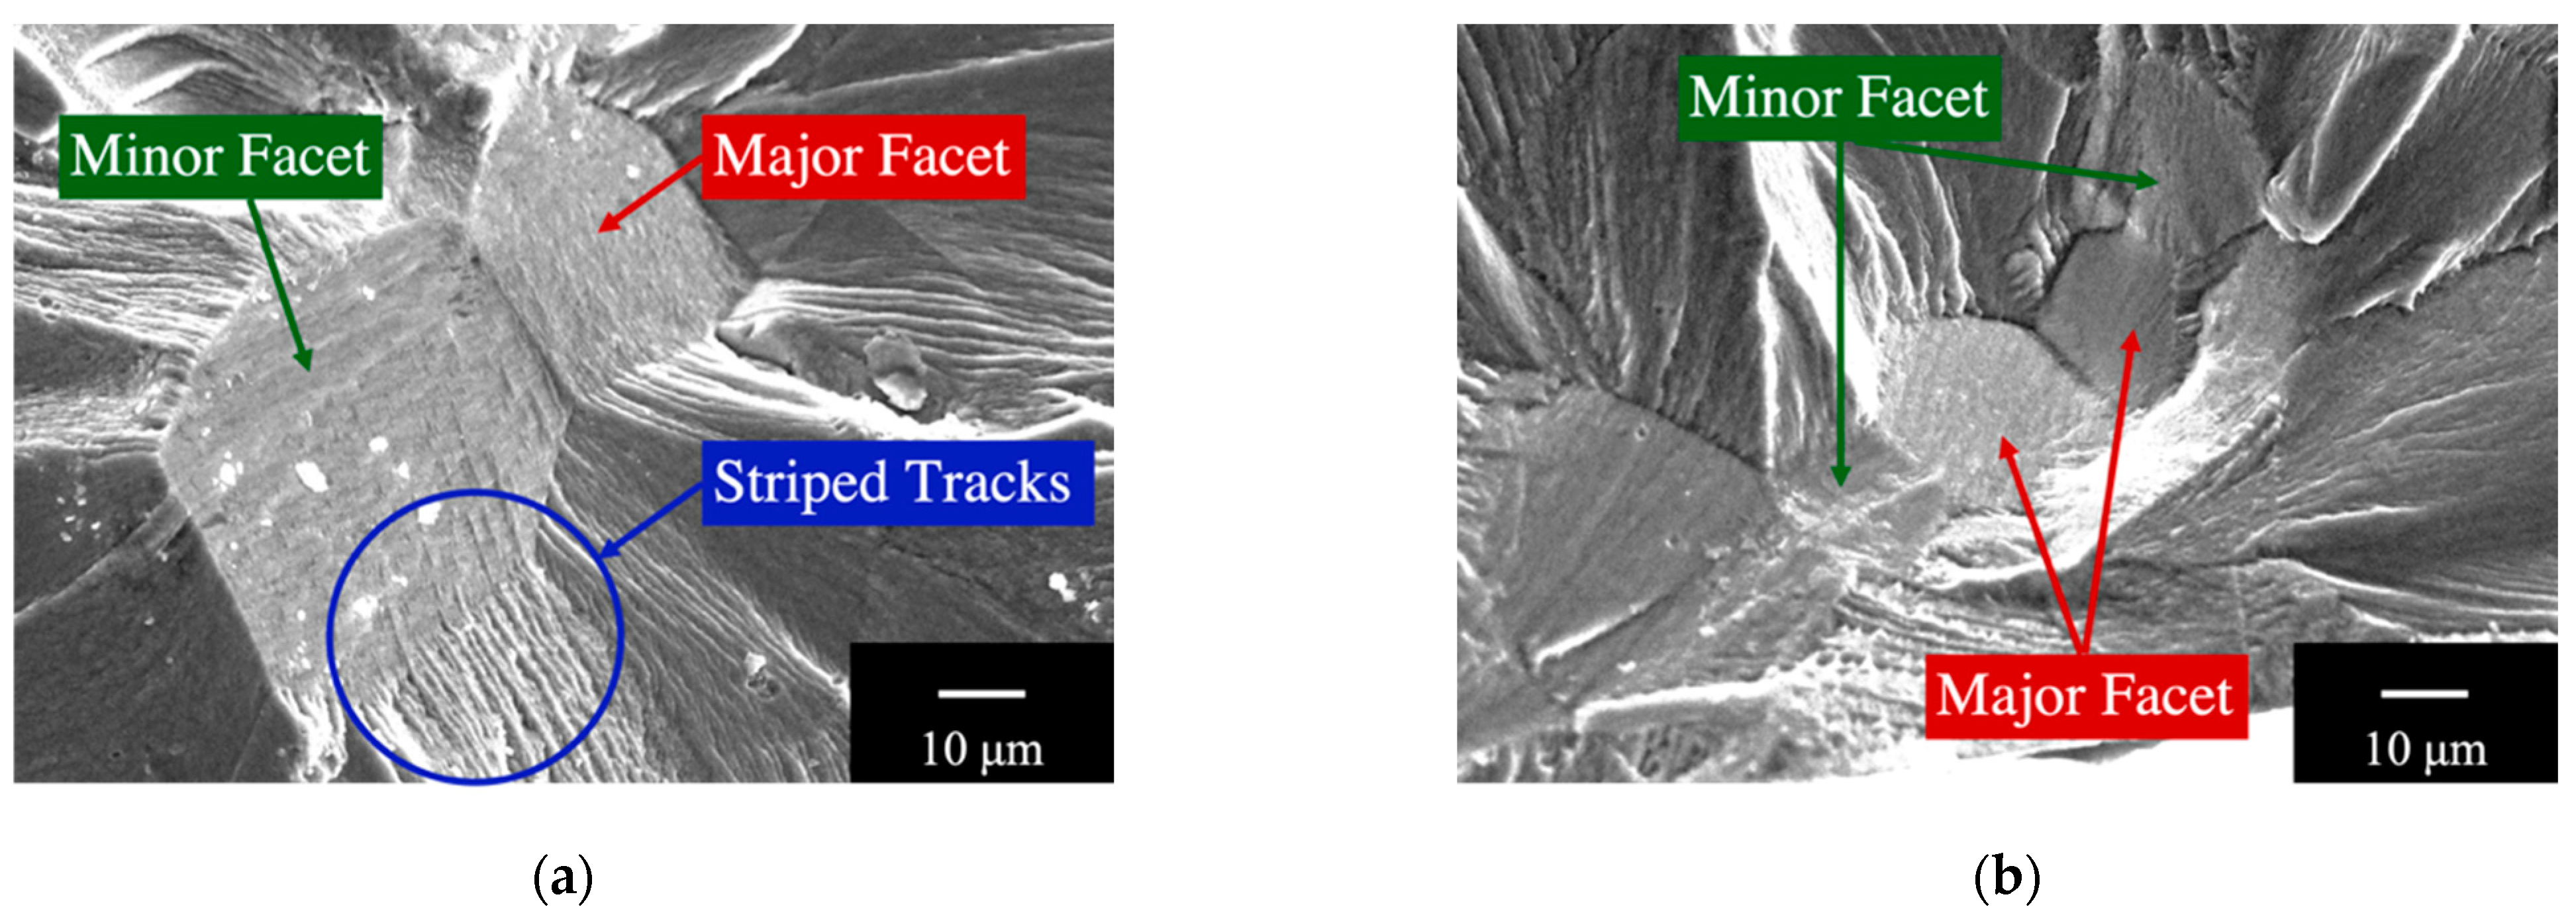
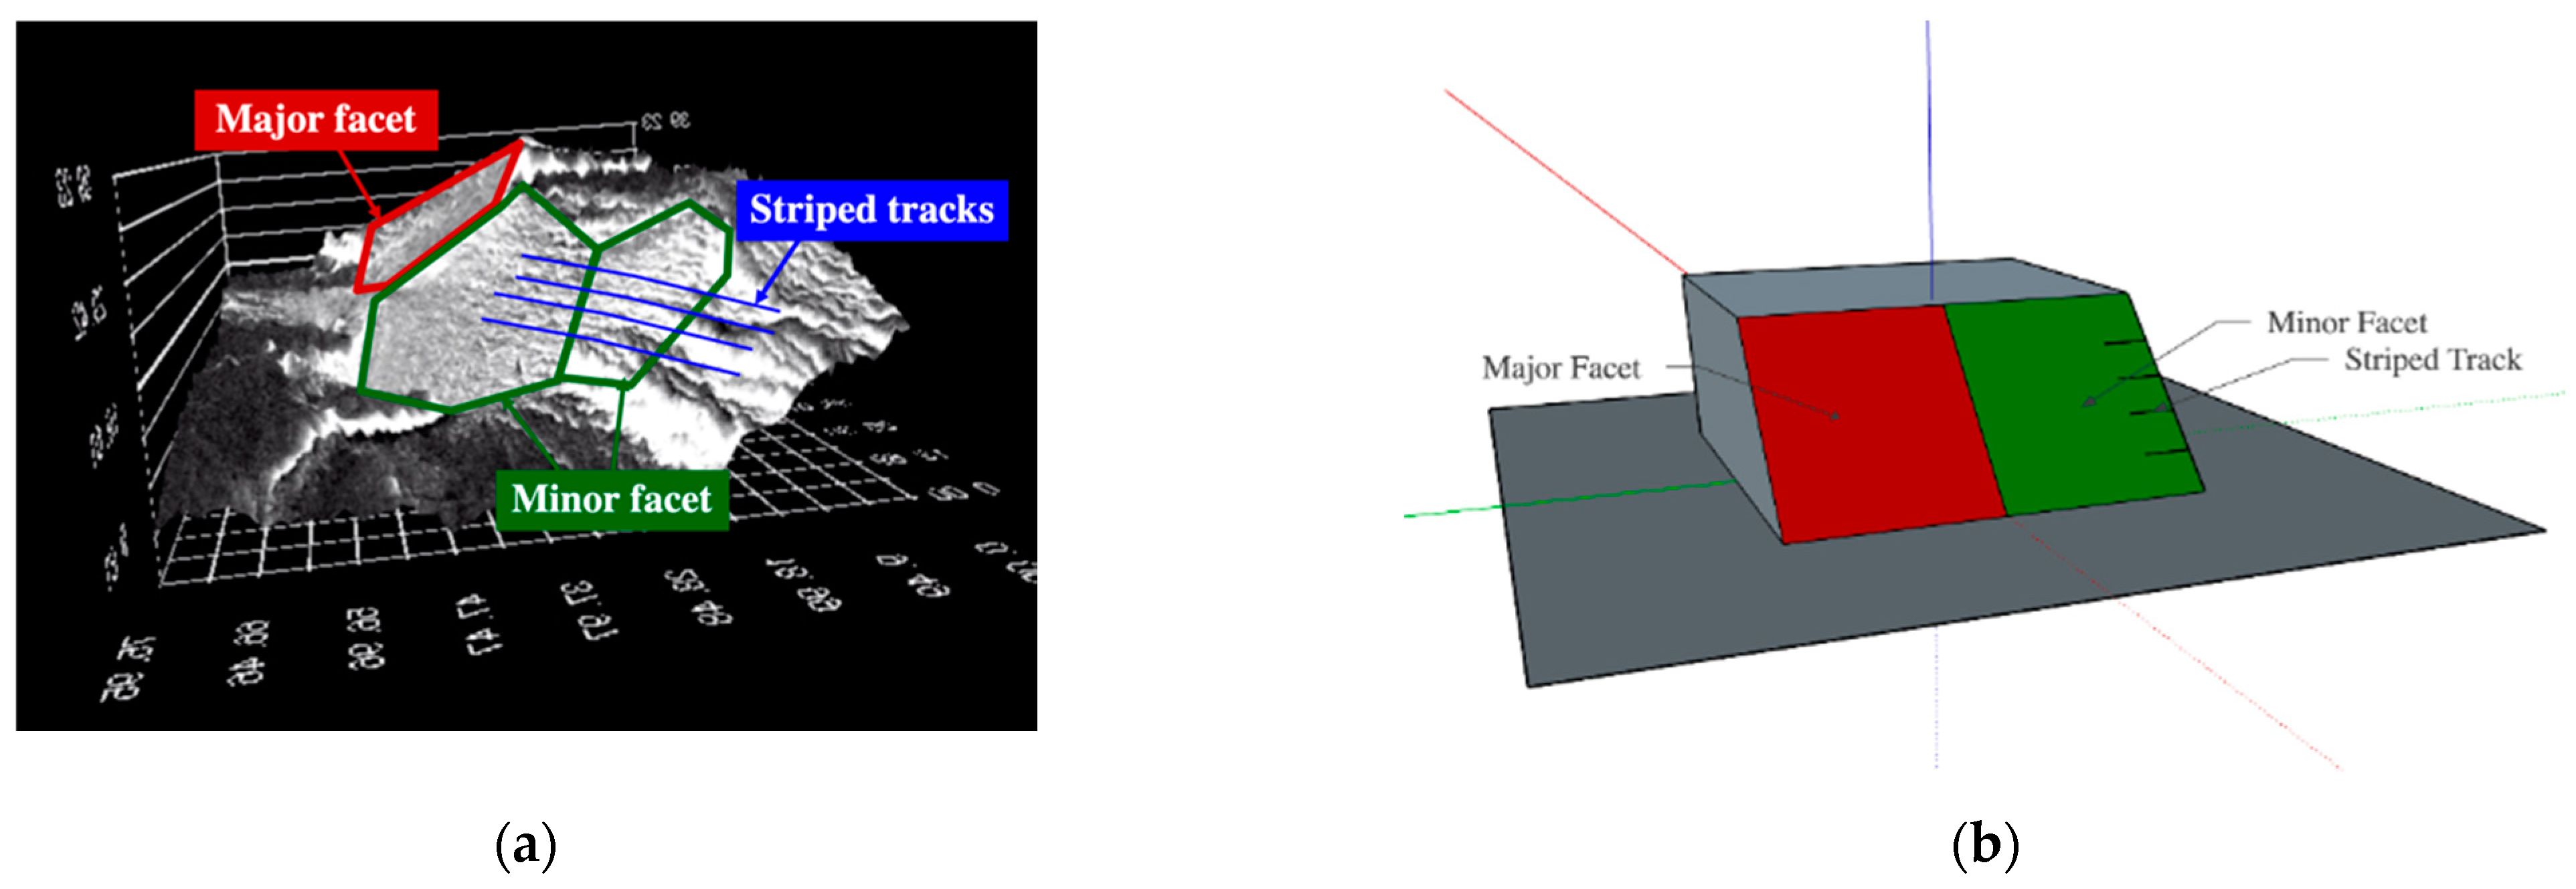
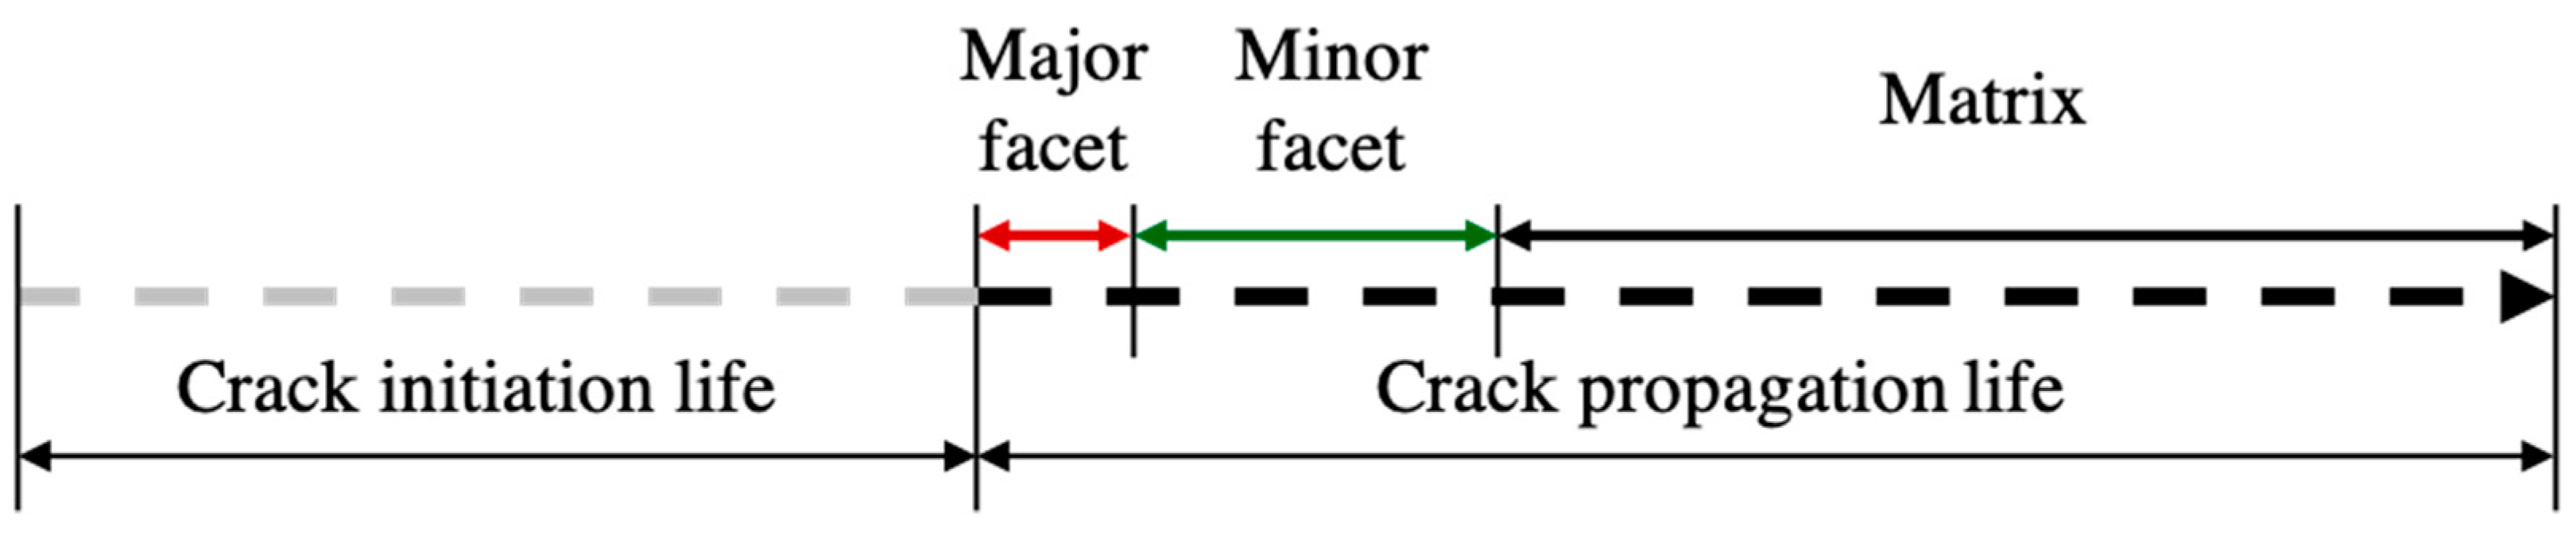
- The concepts of major and minor facet(s) and the classification of the facet bonding patterns were established to differentiate the various characteristics of the multiple facets and to describe their distinct growth behaviors. Both the major and minor facet(s) exhibited a 45° facet angle to the fracture surfaces, indicating that they were presumably formed by slip dislocation.
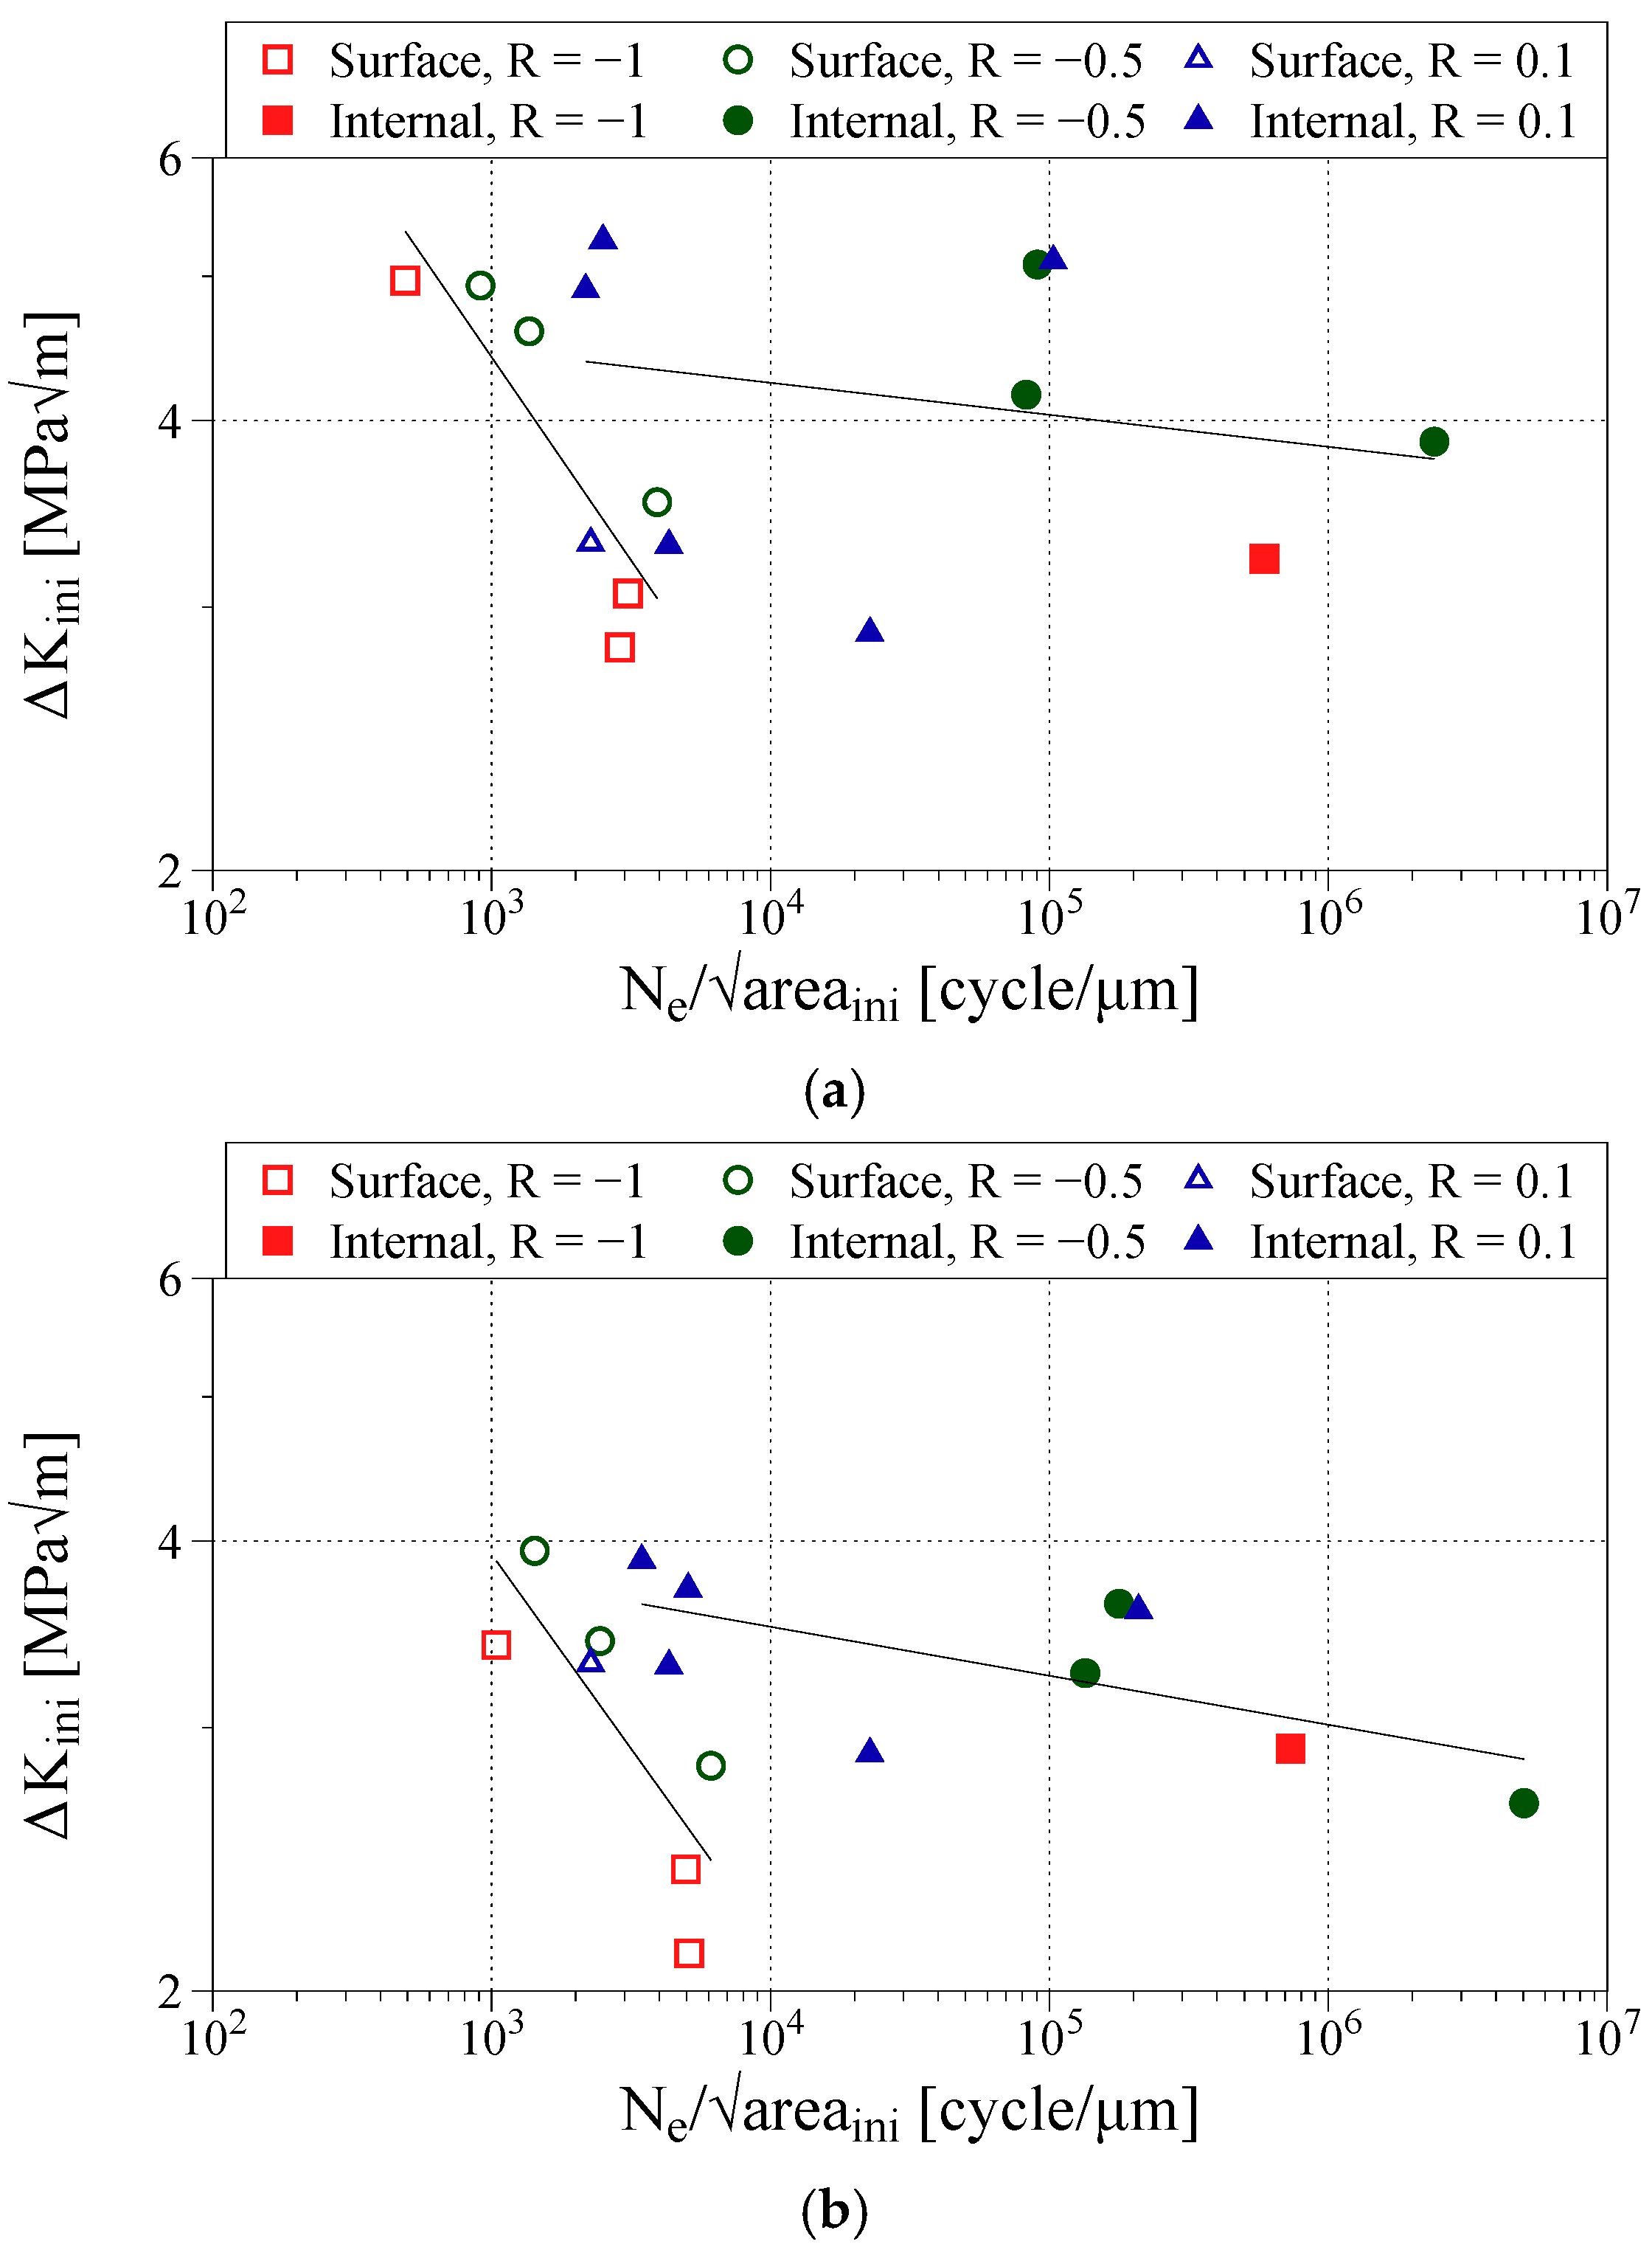
- The total facet area and major facet area are applied to the diagram and fatigue life prediction. The effect of stress ratios mentioned in conclusion 1 was diminished by substituting the range of the applied stress. In the internal fracture regime, when the major facet area was used, the diagram showed a better linear relationship. In addition, there was a lower deviation in the predicted fatigue life when the major facet area was used than when the total facet area was used. These results confirm the reliability of two-step facet growth behaviors of the internal fractures. In addition, the results of the surface cracks obtained by the total facet area and major facet(s) area were all reliable, suggesting that the surface fracture was easily propagated owing to its high propagation rate regardless of the microstructural effect.
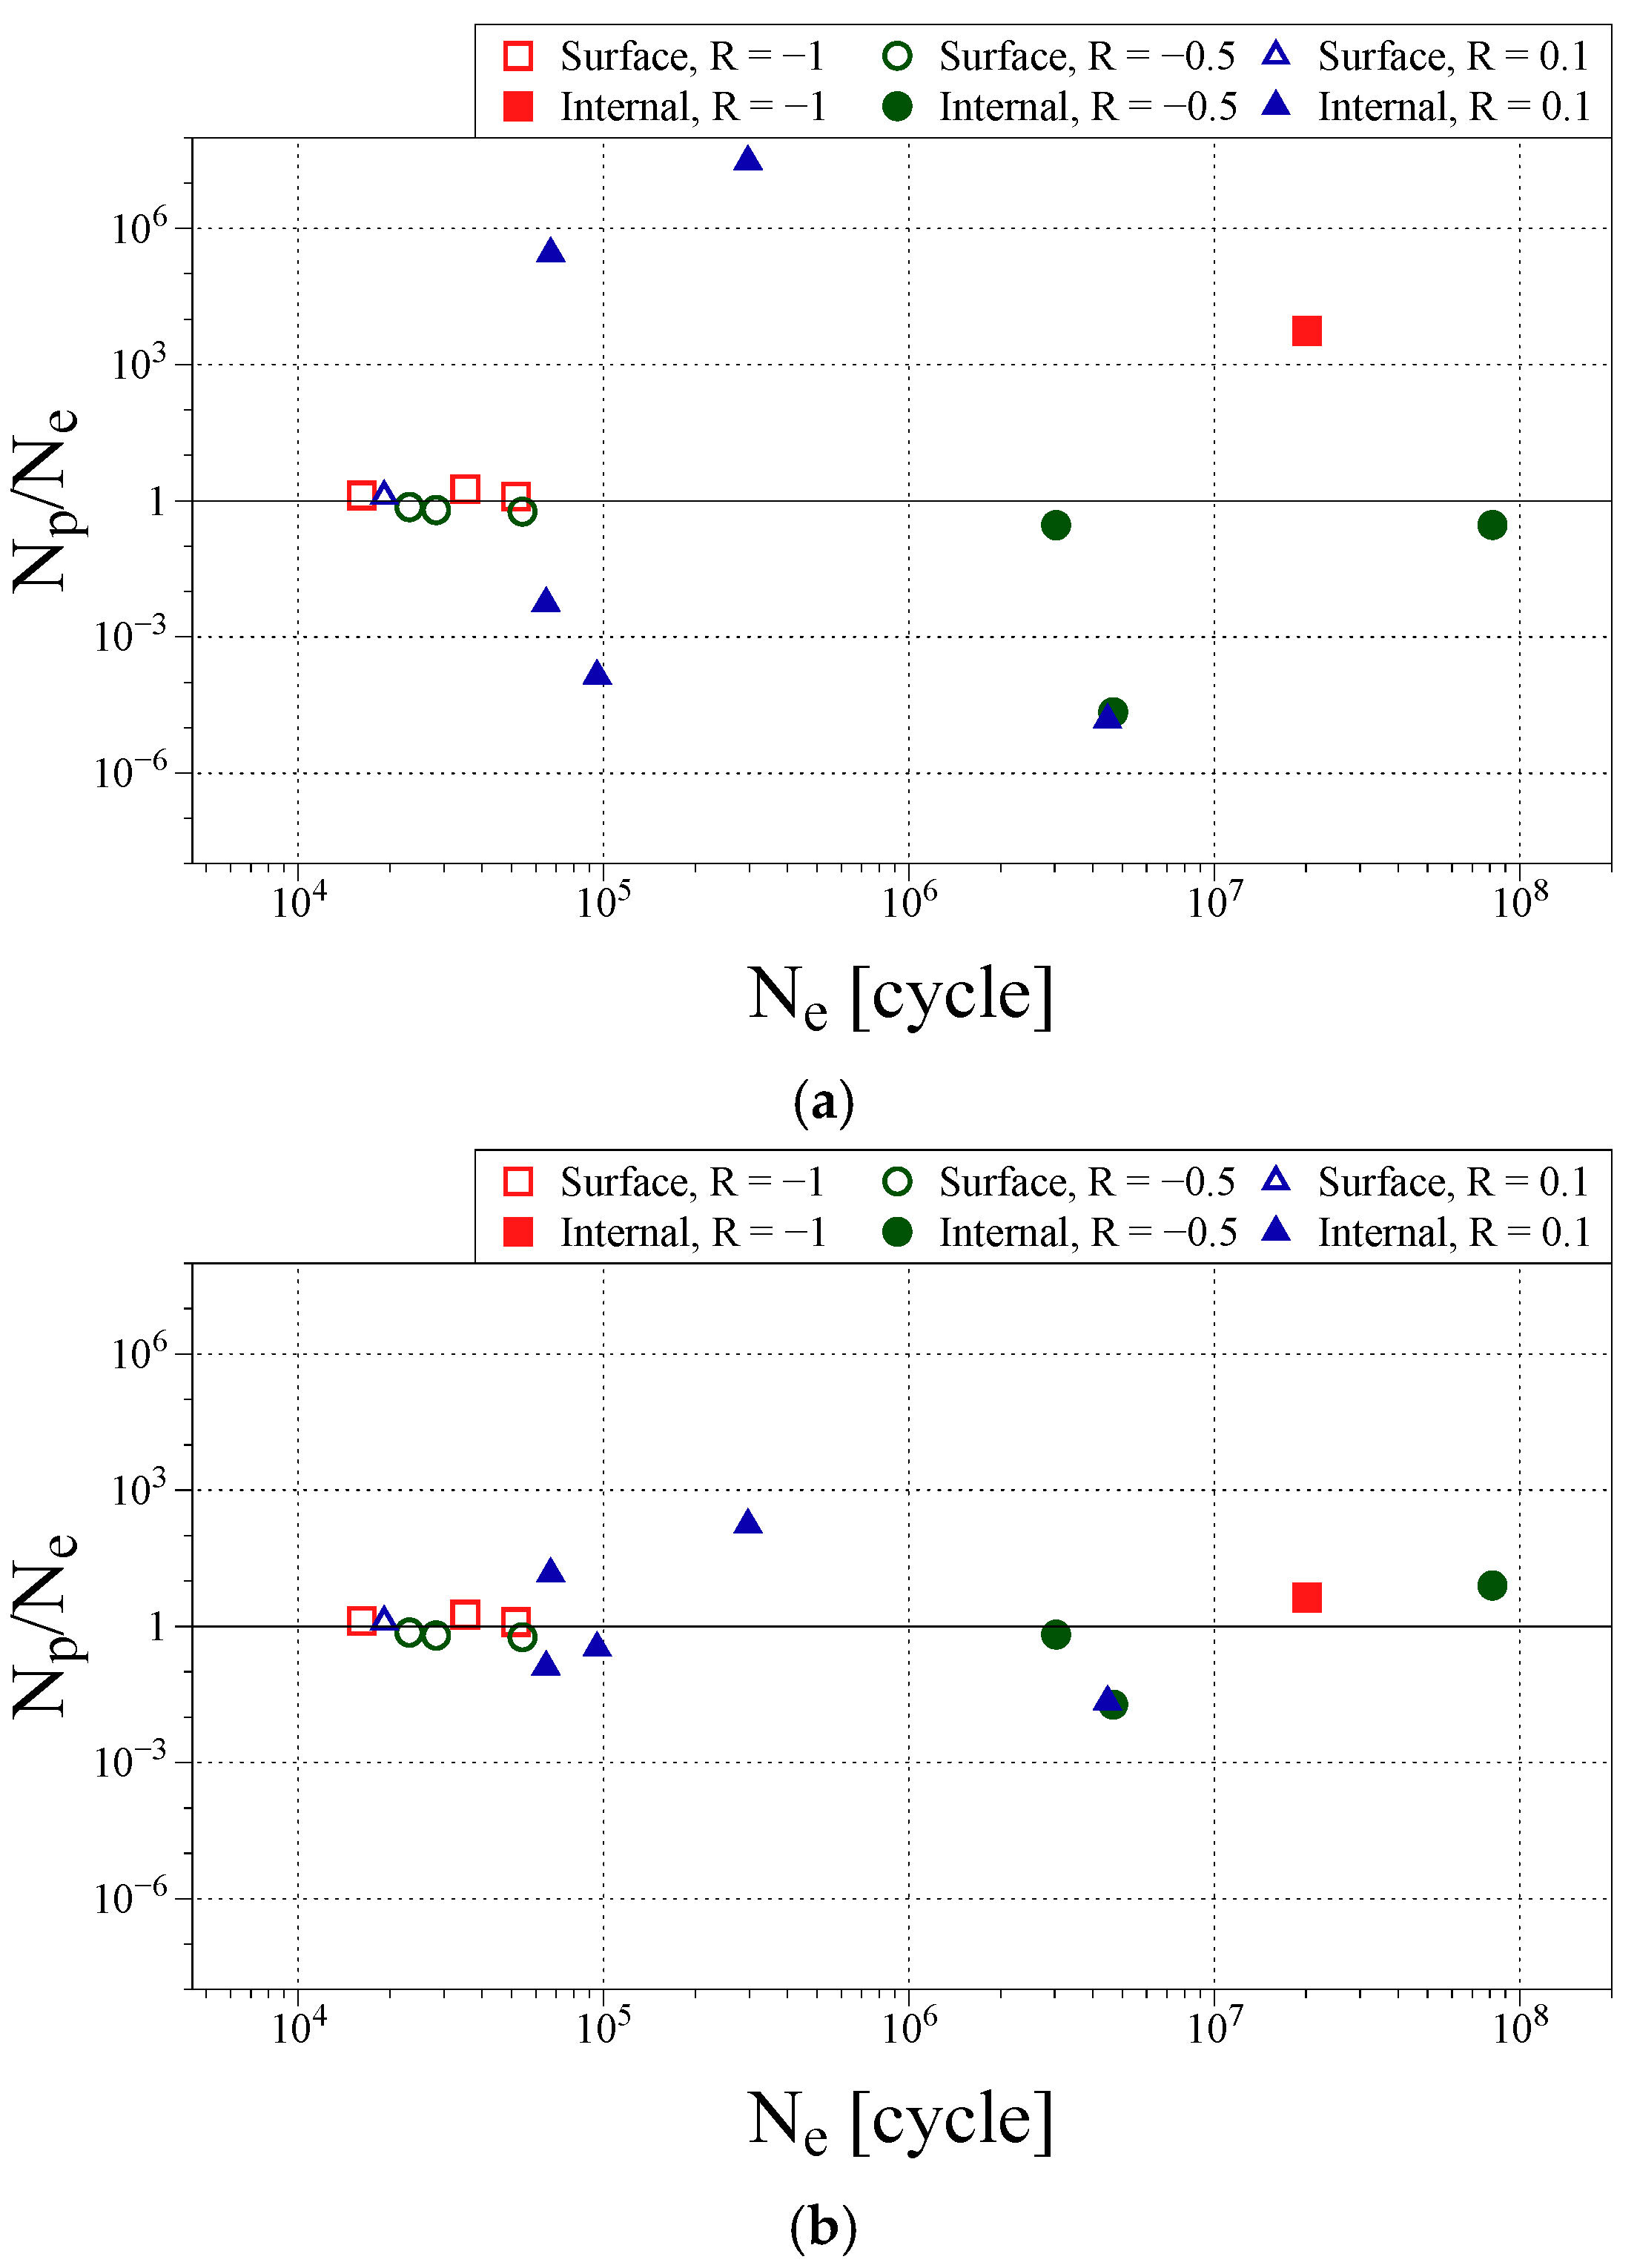
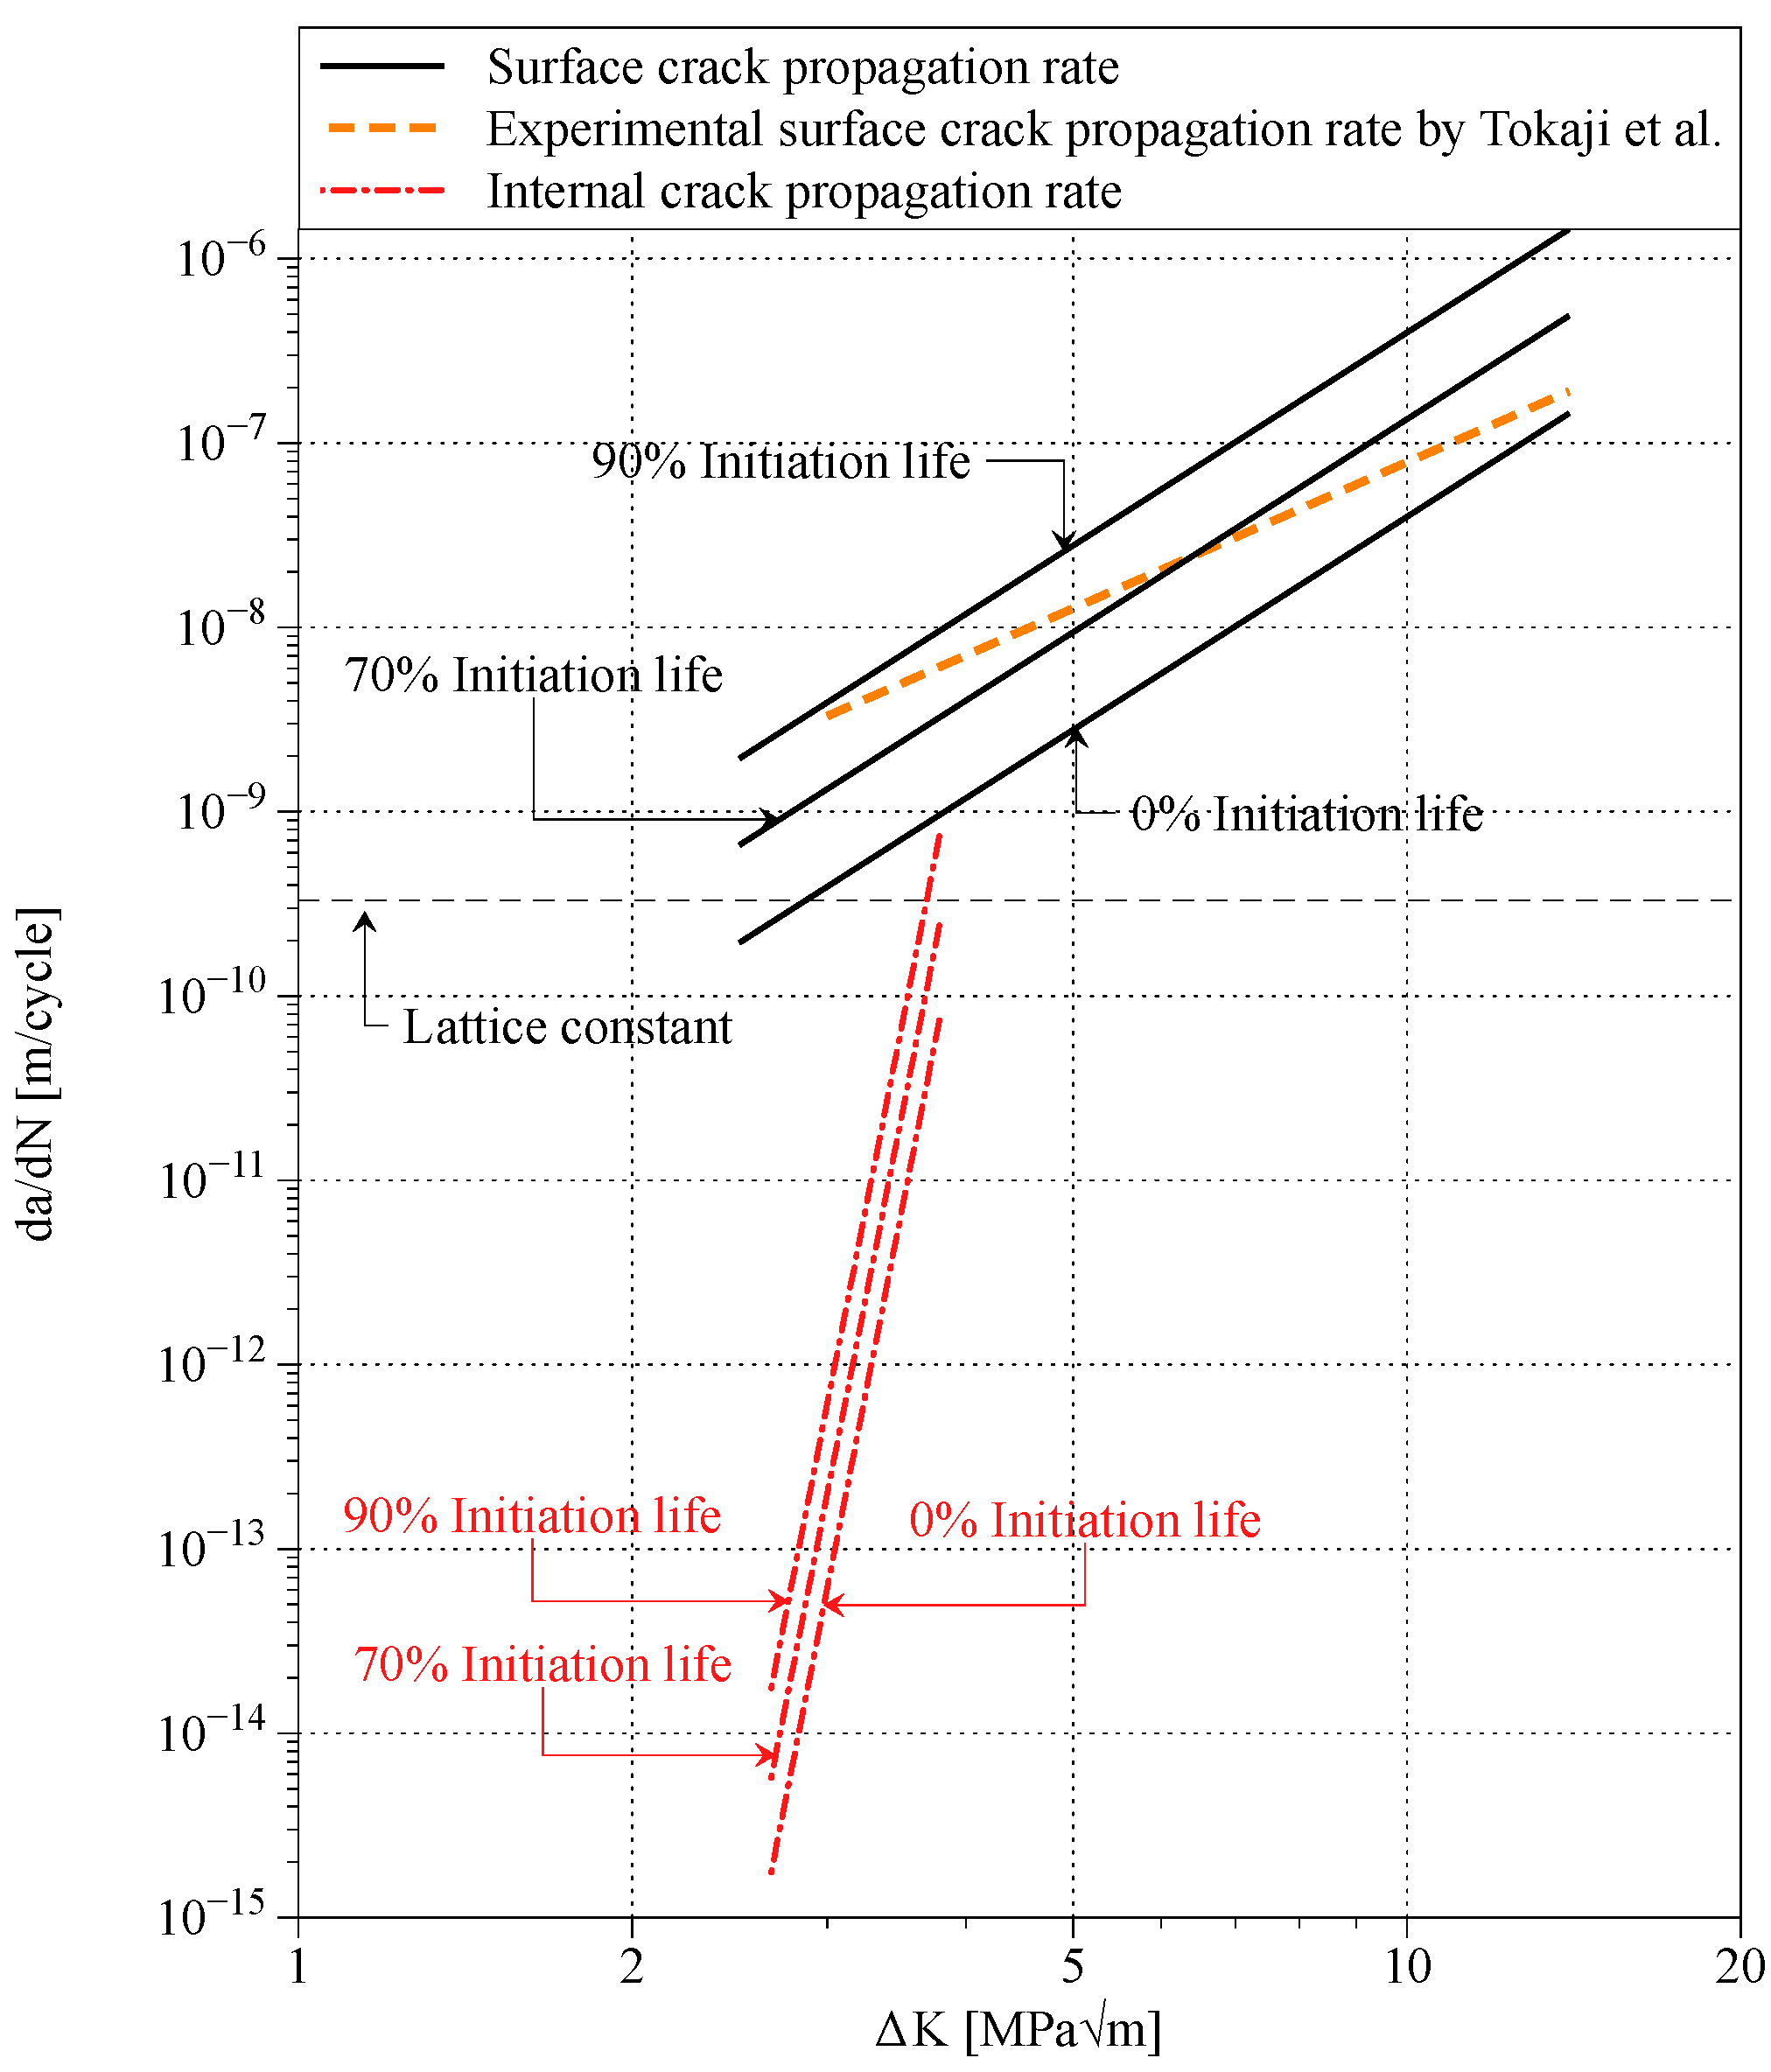
- Facet formation life can be omitted in both the surface and internal fracture regimes. However, the crack initiation life can only be considered negligible in the internal fracture regime, and not in the surface fracture regime, which can be attributed to the larger exponential material constant, , of the internal fracture.
Author Contributions
Funding
Acknowledgments
Conflicts of Interest
References
- Kolli, R.; Devaraj, A. A review of metastable beta titanium alloys. Metals 2018, 8, 506. [Google Scholar] [CrossRef]
- Cotton, J.D.; Briggs, R.D.; Boyer, R.R.; Tamirisakandala, S.; Russo, R. State of the art in beta titanium alloys for airframe applications. J. Miner. Mater. Mater. Soc. JOM 2015, 67, 1281–1303. [Google Scholar] [CrossRef]
- Boyer, R.R.; Briggs, R.D. The use of β titanium alloys in the aerospace industry. J. Mater. Eng. Perform. 2005, 14, 681–685. [Google Scholar] [CrossRef]
- Ivasishin, O.M.; Markovsky, P.E.; Matviychuk, Y.V.; Semiatin, S.L.; Ward, C.H.; Fox, S. A comparative study of the mechanical properties of high-strength beta-titanium alloys. J. Alloys Comp. 2008, 457, 296–309. [Google Scholar] [CrossRef]
- Marines, I.; Bin, X.; Bathias, C. An understanding of very high cycle fatigue of metals. Int. J. Fatigue 2003, 25, 1101–1107. [Google Scholar] [CrossRef]
- Pyttel, B.; Schwerdt, D.; Berger, C. Very high cycle fatigue—Is there a fatigue limit? Int. J. Fatigue 2011, 33, 49–58. [Google Scholar] [CrossRef]
- Tokaji, K.; Karita, H. Mean stress dependence of fatigue strength and subsurface crack initiation Ti-15Mo-5Zr-3Al alloy. Mater. Sci. Eng. A 2000, 281, 268–274. [Google Scholar] [CrossRef]
- Tokaji, K.; Takafuji, S.; Ohya, K.; Kato, Y.; Mori, K. Fatigue behaviour of beta Ti-22V-4Al alloy subjected to surface-microstructural modification. J. Mater. Sci. 2003, 38, 1153–1159. [Google Scholar] [CrossRef]
- Campanelli, L.C.; da Silva, P.S.C.P.; Bolfarini, C. High cycle fatigue and fracture behavior of Ti-5Al-5Mo-5V-3Cr alloy with BASCA and double aging treatments. Mater. Sci. Eng. A 2016, 658, 203–209. [Google Scholar] [CrossRef]
- Kocan, M.; Wagner, L.; Rack, H.J. Fatigue performance of metastable β titanium alloys: Effects of microstructure and surface finish. J. Mater. Eng. Perform. 2005, 14, 765–772. [Google Scholar] [CrossRef]
- Huang, C.; Zhao, Y.; Xin, S.; Tan, C.; Zhou, W.; Li, Q.; Zeng, W. Effect of microstructure on high cycle fatigue behavior of Ti–5Al–5Mo–5V–3Cr–1Zr titanium alloy. Int. J. Fatigue 2017, 94, 30–40. [Google Scholar] [CrossRef]
- Tanaka, K.; Akiniwa, Y. Fatigue crack propagation behaviour derived from S–N data in very high cycle regime. Fatigue Fract. Eng. Mater. Struct. 2002, 25, 775–784. [Google Scholar] [CrossRef]
- Furuya, Y. Small internal fatigue crack growth rate measured by beach marks. Mater. Sci. Eng. A 2016, 678, 260–266. [Google Scholar] [CrossRef]
- Furuya, Y. A new model for predicting the gigacycle fatigue strength of high-strength steels. Mater. Sci. Eng. A 2019, 743, 445–452. [Google Scholar] [CrossRef]
- Shiozawa, K.; Kuroda, Y.; Nishino, S. Effect of stress ratio on subsurface fatigue crack initiation behavior of beta-type titanium alloy. Trans. Jpn. Soc. Mech. Eng. Ser. A 1998, 64, 2528–2535. [Google Scholar] [CrossRef][Green Version]
- Pan, X.; Su, H.; Sun, C.; Hong, Y. The behavior of crack initiation and early growth in high-cycle and very-high-cycle fatigue regimes for a titanium alloy. Int. J. Fatigue 2018, 115, 67–78. [Google Scholar] [CrossRef]
- Liu, X.; Sun, C.; Hong, Y. Faceted crack initiation characteristics for high-cycle and very-high-cycle fatigue of a titanium alloy under different stress ratios. Int. J. Fatigue 2016, 92, 434–441. [Google Scholar] [CrossRef]
- Daido Steel Co., Ltd. DAT51 (High Strength β-Titanium Alloy) with Improved Press Workability. Available online: https://www.daido.co.jp/en/products/titanium/strength/index.html (accessed on 19 December 2020).
- Fukui, S.; Ohtakara, Y.; Suzuki, A. Properties of a beta type new titanium alloy Ti-22V-4Al. DENKI-SEIKO 1986, 57, 303–317. (In Japanese) [Google Scholar] [CrossRef]
- Schneider, C.A.; Rasband, W.S.; Eliceiri, K.W. NIH image to ImageJ: 25 years of image analysis. Nat. Methods 2012, 9, 671–675. [Google Scholar] [CrossRef]
- Santhosh, R.; Geetha, M.; Saxena, V.K.; Rao, M.N. Effect of duplex aging on microstructure and mechanical behavior of beta titanium alloy Ti–15V–3Cr–3Al–3Sn under unidirectional and cyclic loading conditions. Int. J. Fatigue 2015, 73, 88–97. [Google Scholar] [CrossRef]
- Uematsu, Y.; Kakiuchi, T.; Hattori, K. EBSD-assisted fractography of sub-surface fatigue crack initiation mechanism in the ultrasonic-shot-peened βeta-type titanium alloy. Fatigue Fract. Eng. Mater. Struct. 2018, 41, 2239–2248. [Google Scholar] [CrossRef]
- Jha, S.K.; Szczepanski, C.J.; Golden, P.J.; Porter, W.J., III; John, R. Characterization of fatigue crack-initiation facets in relation to lifetime variability in Ti–6Al–4V. Int. J. Fatigue 2012, 42, 248–257. [Google Scholar] [CrossRef]
- Oguma, H.; Nakamura, T. Fatigue crack propagation properties of Ti–6Al–4V in vacuum environments. Int. J. Fatigue 2013, 50, 89–93. [Google Scholar] [CrossRef]
- Tokaji, K.; Ohya, K.; Kariya, H. Effect of grain size on fatigue strength and subsurface crack initiation in beta Ti-22V-4Al alloy. J. Soc. Mater. Sci. Jpn. 2000, 49, 994–1001. [Google Scholar] [CrossRef]
- Tokaji, K.; Ohya, K.; Kariya, H. Effects of grain size and aging conditions on fatigue crack propagation behavior in beta Ti-22V-4Al alloy. Tetsu-to-Hagane 2000, 86, 769–776. [Google Scholar] [CrossRef][Green Version]
- Tanaka, K.; Akiniwa, Y.; Nakai, Y.; Wei, R.P. Modelling of small fatigue crack growth interacting with grain boundary. Eng. Fract. Mech. 1986, 24, 803–819. [Google Scholar] [CrossRef]
- Lankford, J. The growth of small fatigue cracks in 7075–T6 aluminum. Fatigue Fract. Eng. Mater. Struct. 1982, 5, 233–248. [Google Scholar] [CrossRef]
- Zhai, T.; Wilkinson, A.J.; Martin, J.W. A crystallographic mechanism for fatigue crack propagation through grain boundaries. Acta Mater. 2000, 48, 4917–4927. [Google Scholar] [CrossRef]
- Paris, P.; Erdogan, F. A critical analysis of crack propagation laws. J. Basic Eng. 1963, 85, 528–533. [Google Scholar] [CrossRef]
- Omata, S. Evaluation of fatigue properties in the ultra-high-cycle regime of steels for crankshafts based on crack propagation characteristics. In Proceedings of the Third International Conference on Very High Cycle Fatigue (VHCF-3), Kyoto, Japan, 16–19 September 2004; The Society of Materials Science: Kyoto, Japan, 2004; p. 306. [Google Scholar]
- Murakami, Y.; Kodama, S.; Konuma, S. Quantitative evaluation of effects of non- metallic inclusions on fatigue strength of high strength steels. I: Basic fatigue mechanism and evaluation of correlation between the fatigue fracture stress and the size and location of non-metallic inclusions. Int. J. Fatigue 1989, 11, 291–298. [Google Scholar] [CrossRef]
- Yoshinaka, F.; Nakamura, T.; Takaku, K.; Shiozawa, D.; Nakai, Y.; Uesugi, K. Observation of the initial process of internal fracture in very high cycle fatigue in Ti-6Al-4V by synchrotron radiation μCT imaging. Trans. JSME 2017, 83, 1700104. (In Japanese) [Google Scholar]
- Stanzl-Tschegg, S.; Schönbauer, B. Near-threshold fatigue crack propagation and internal cracks in steel. Procedia Eng. 2010, 2, 1547–1555. [Google Scholar] [CrossRef]
- Hong, Y.; Lei, Z.; Sun, C.; Zhao, A. Propensities of crack interior initiation and early growth for very-high-cycle fatigue of high strength steels. Int. J. Fatigue 2014, 58, 144–151. [Google Scholar] [CrossRef]
- Yoshinaka, F.; Nakamura, T.; Nakayama, S.; Shiozawa, D.; Nakai, Y.; Uesugi, K. Non-destructive observation of internal fatigue crack growth in Ti-6Al-4V by using synchrotron radiation μCT imaging. Int. J. Fatigue 2016, 93, 397–405. [Google Scholar] [CrossRef]
- Yoshinaka, F.; Nakamura, T.; Takeuchi, A.; Uesugi, M.; Uesugi, K. Initiation and growth behavior of small internal fatigue cracks in Ti-6Al-4V via synchrotron radiation microcomputed tomography. Fatigue Fract. Eng. Mater. Struct. 2019, 42, 2093–2105. [Google Scholar] [CrossRef]


| Al | V | Fe | C | O | N | H | Ti |
|---|---|---|---|---|---|---|---|
| 4.15 | 21.17 | 0.15 | 0.013 | 0.14 | 0.012 | 0.0124 | Bal. |
| 0.2% Proof Stress [MPa] | Tensile Strength [MPa] | Elongation [%] | Reduction of Area [%] |
|---|---|---|---|
| 1154 | 1235 | 9.3 | 21.9 |
| Surface Feature | Boundary | Distribution in Every Specimen | |
|---|---|---|---|
| The major facet | Smooth | Clear | At least one |
| The minor facet | Striped Tracks; Less pronounced in negative stress ratios. | Unclear | Random |
Publisher’s Note: MDPI stays neutral with regard to jurisdictional claims in published maps and institutional affiliations. |
© 2020 by the authors. Licensee MDPI, Basel, Switzerland. This article is an open access article distributed under the terms and conditions of the Creative Commons Attribution (CC BY) license (http://creativecommons.org/licenses/by/4.0/).
Share and Cite
Xue, G.; Nakamura, T.; Fujimura, N.; Takahashi, K.; Oguma, H. Initiation and Propagation Processes of Internal Fatigue Cracks in β Titanium Alloy Based on Fractographic Analysis. Appl. Sci. 2021, 11, 131. https://doi.org/10.3390/app11010131
Xue G, Nakamura T, Fujimura N, Takahashi K, Oguma H. Initiation and Propagation Processes of Internal Fatigue Cracks in β Titanium Alloy Based on Fractographic Analysis. Applied Sciences. 2021; 11(1):131. https://doi.org/10.3390/app11010131
Chicago/Turabian StyleXue, Gaoge, Takashi Nakamura, Nao Fujimura, Kosuke Takahashi, and Hiroyuki Oguma. 2021. "Initiation and Propagation Processes of Internal Fatigue Cracks in β Titanium Alloy Based on Fractographic Analysis" Applied Sciences 11, no. 1: 131. https://doi.org/10.3390/app11010131
APA StyleXue, G., Nakamura, T., Fujimura, N., Takahashi, K., & Oguma, H. (2021). Initiation and Propagation Processes of Internal Fatigue Cracks in β Titanium Alloy Based on Fractographic Analysis. Applied Sciences, 11(1), 131. https://doi.org/10.3390/app11010131