Optical Design of a Miniaturized Airborne Push-Broom Spectrometer


Abstract
1. Introduction
2. System Specification
2.1. Specifications of the Spectrometer
2.2. Optical System Parameters
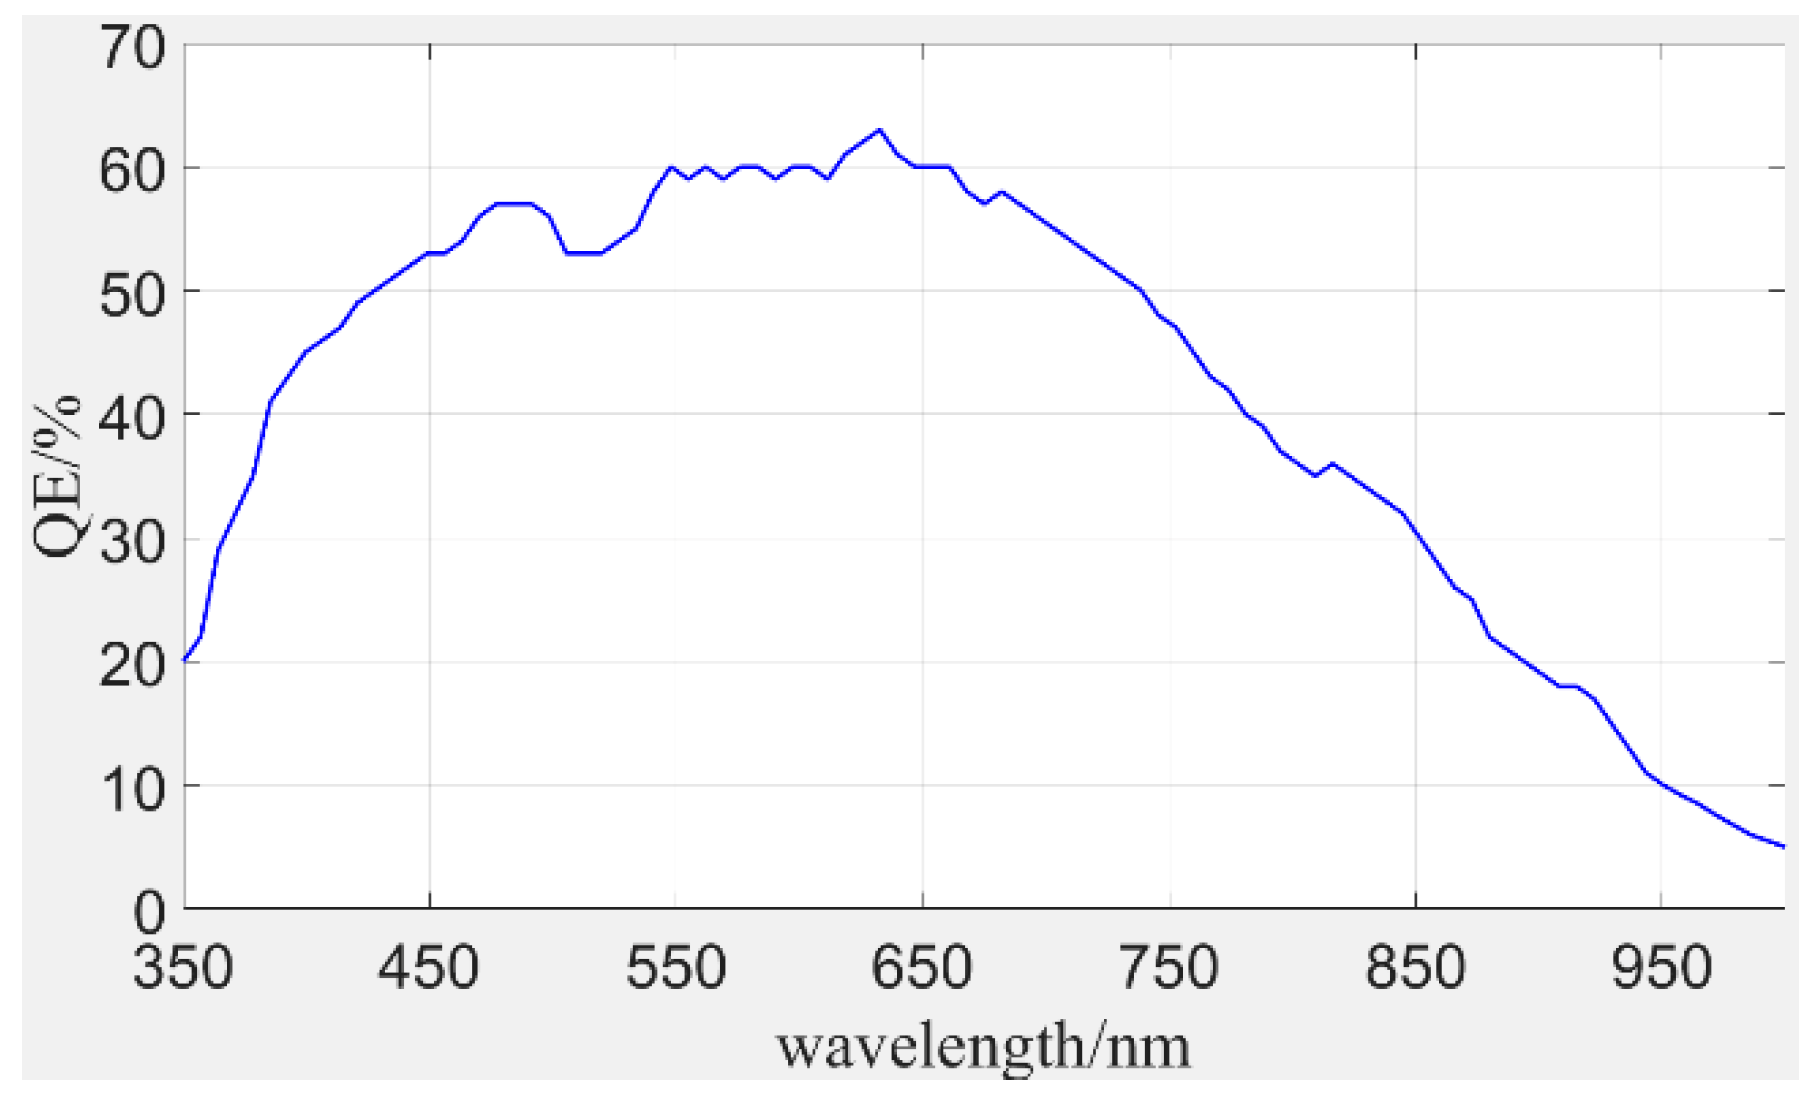
2.2.1. Sensor Selection and Frame Rate
2.2.2. Focal Length
2.2.3. Relative Aperture
2.2.4. Dispersion Width of the Slit
3. SNR Calculation
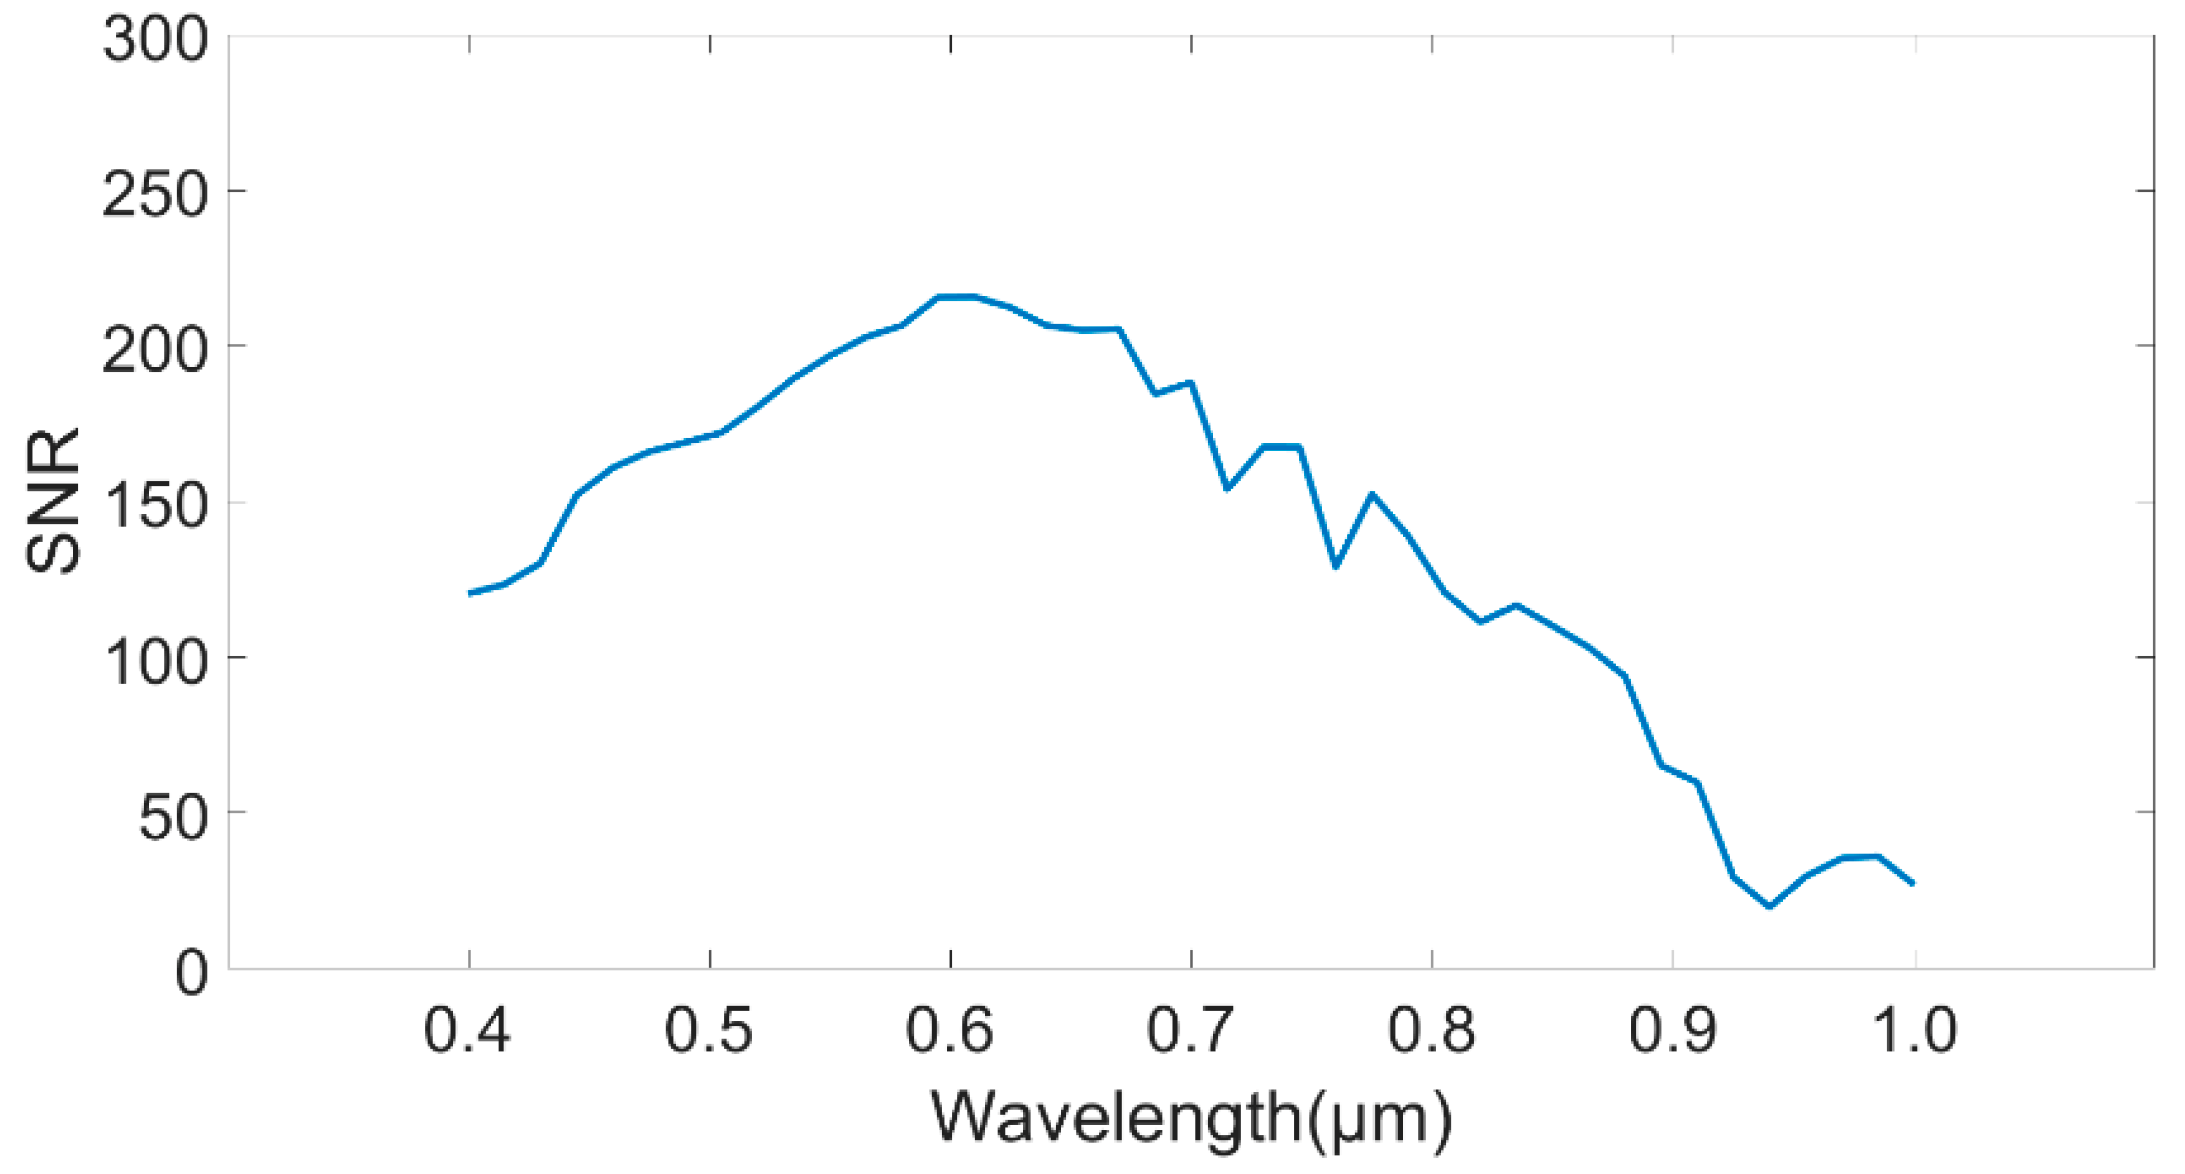
3.1. SNR
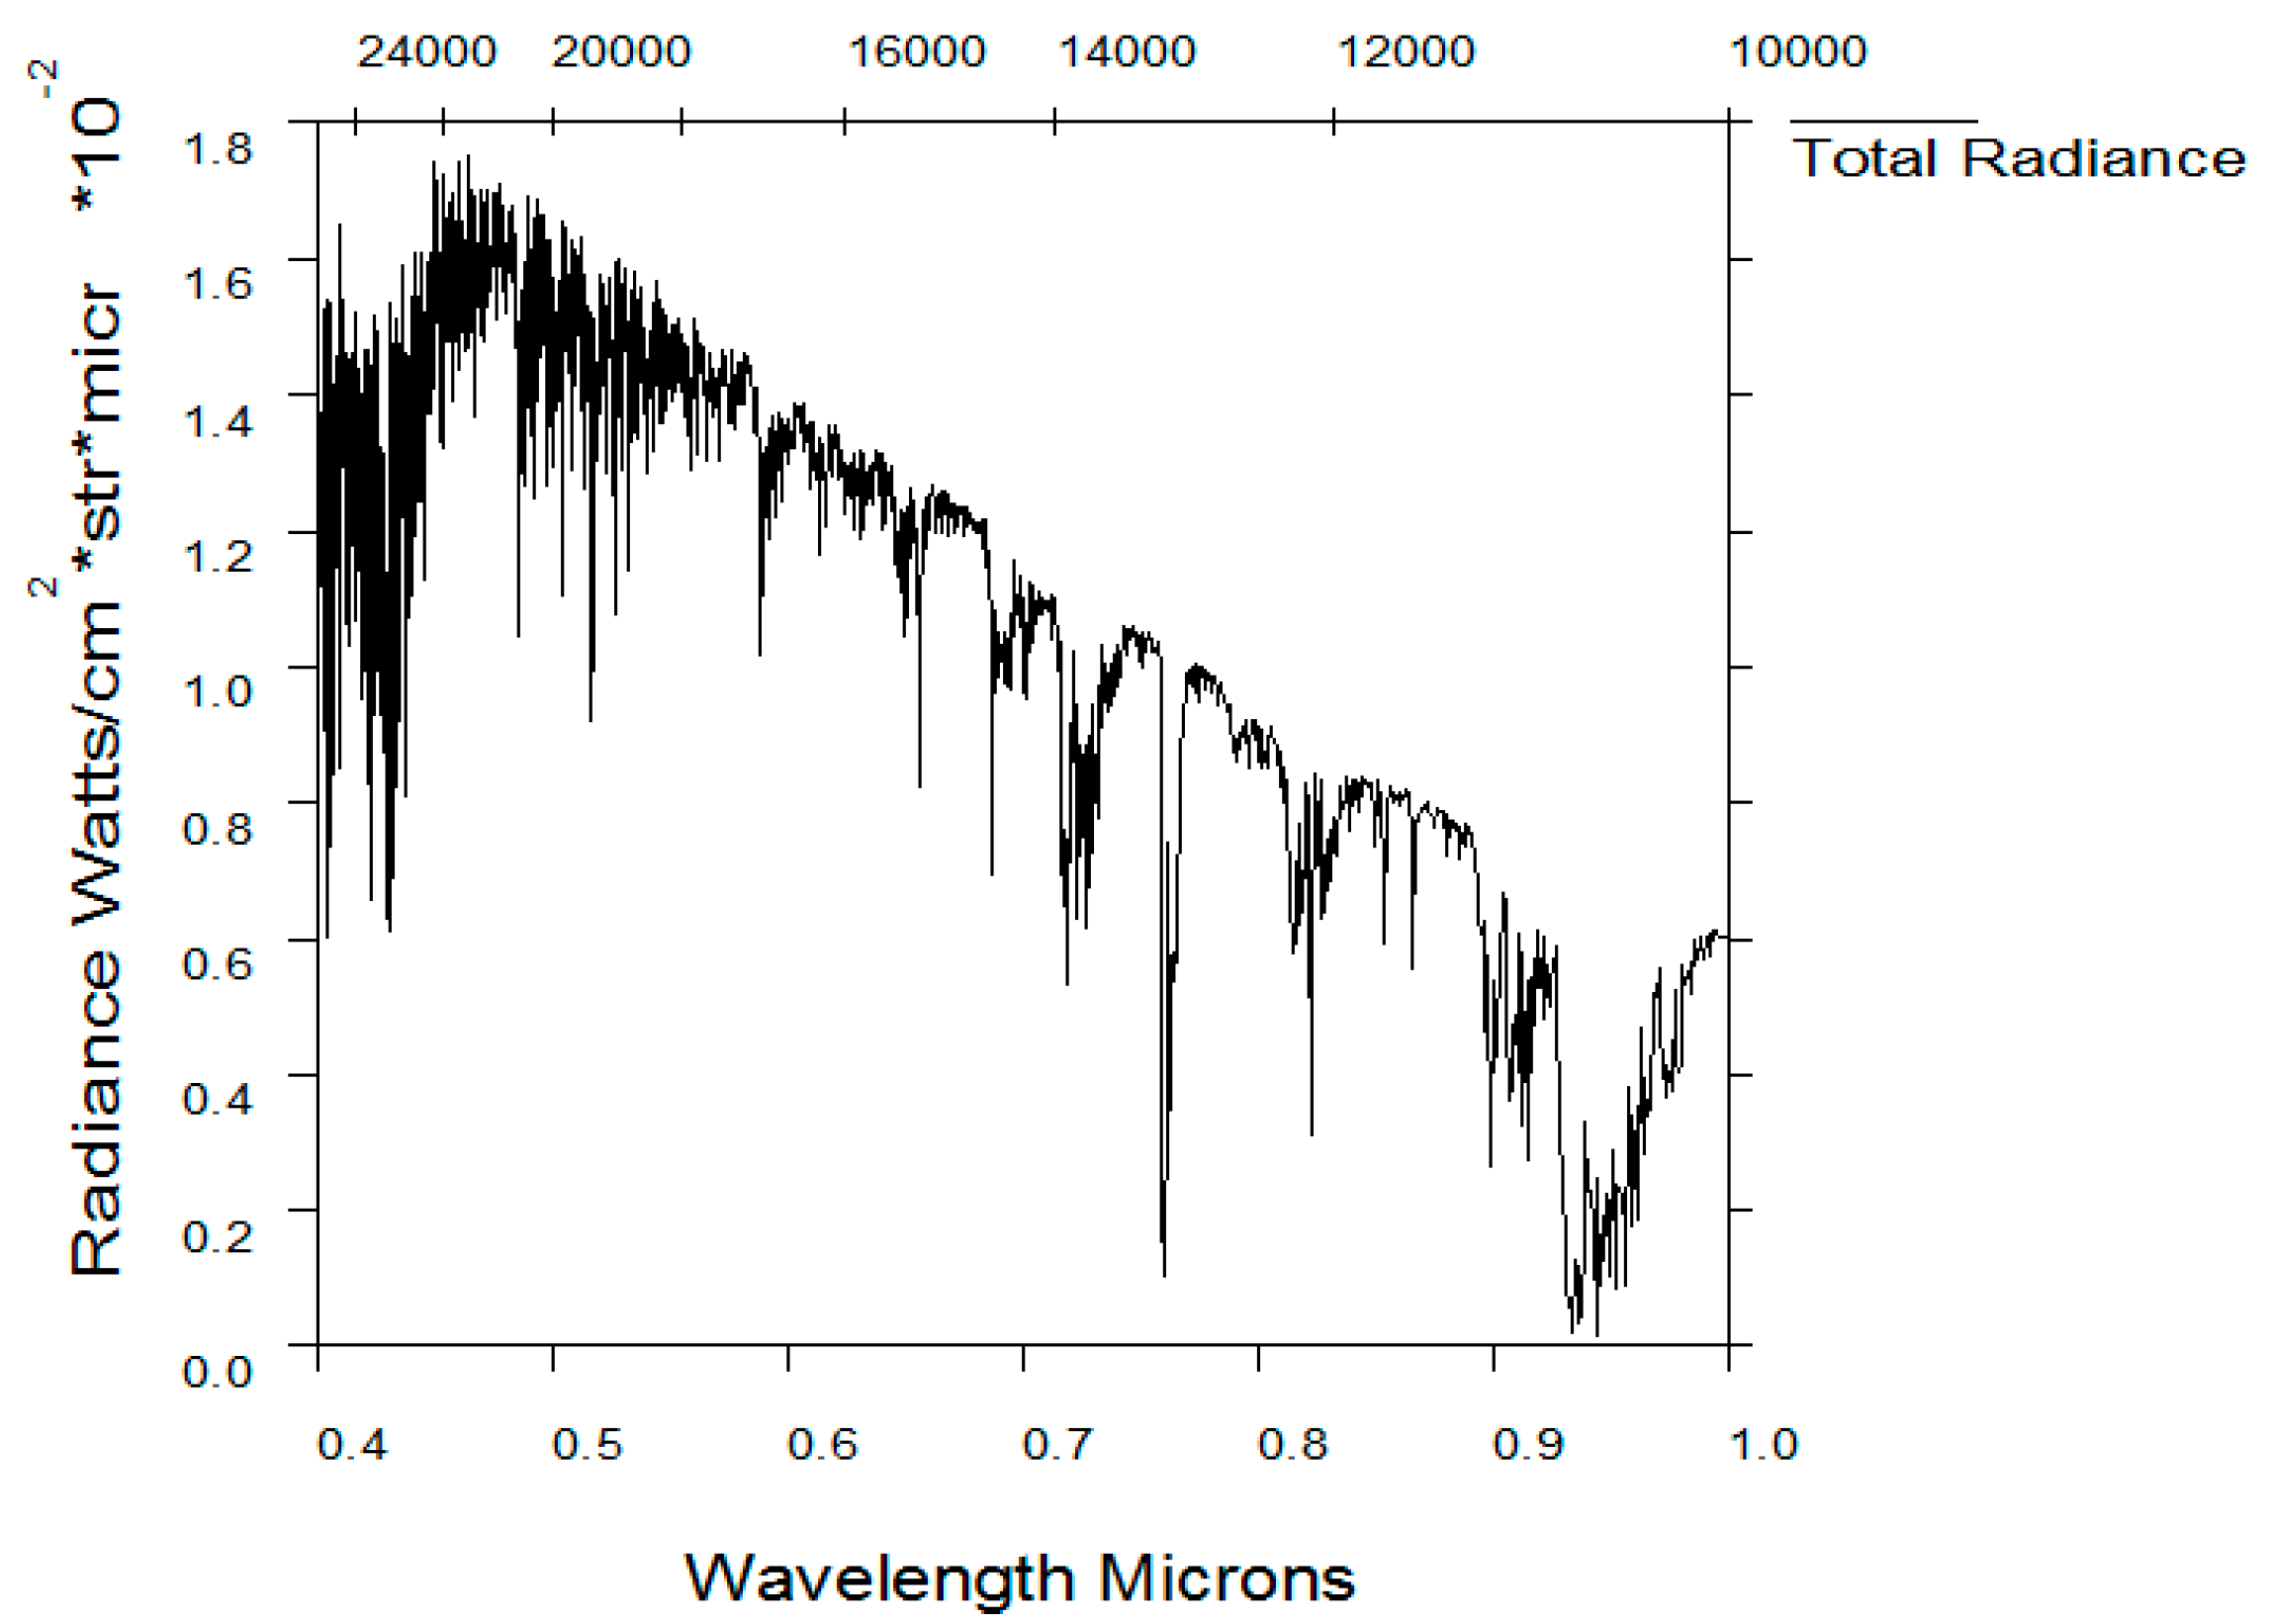
3.2. Signal Electron Number
- Altitude: 1 km;
- Solar zenith angle: 30°;
- Ground albedo: 30% (a commonly used remote sensing condition);
- Atmospheric model: Mid-latitude summer;
- Boundary temperature (T): 300 K; and
- Aerosol model: Rural aerosol, visibility 23 km.
3.3. Calculation Results
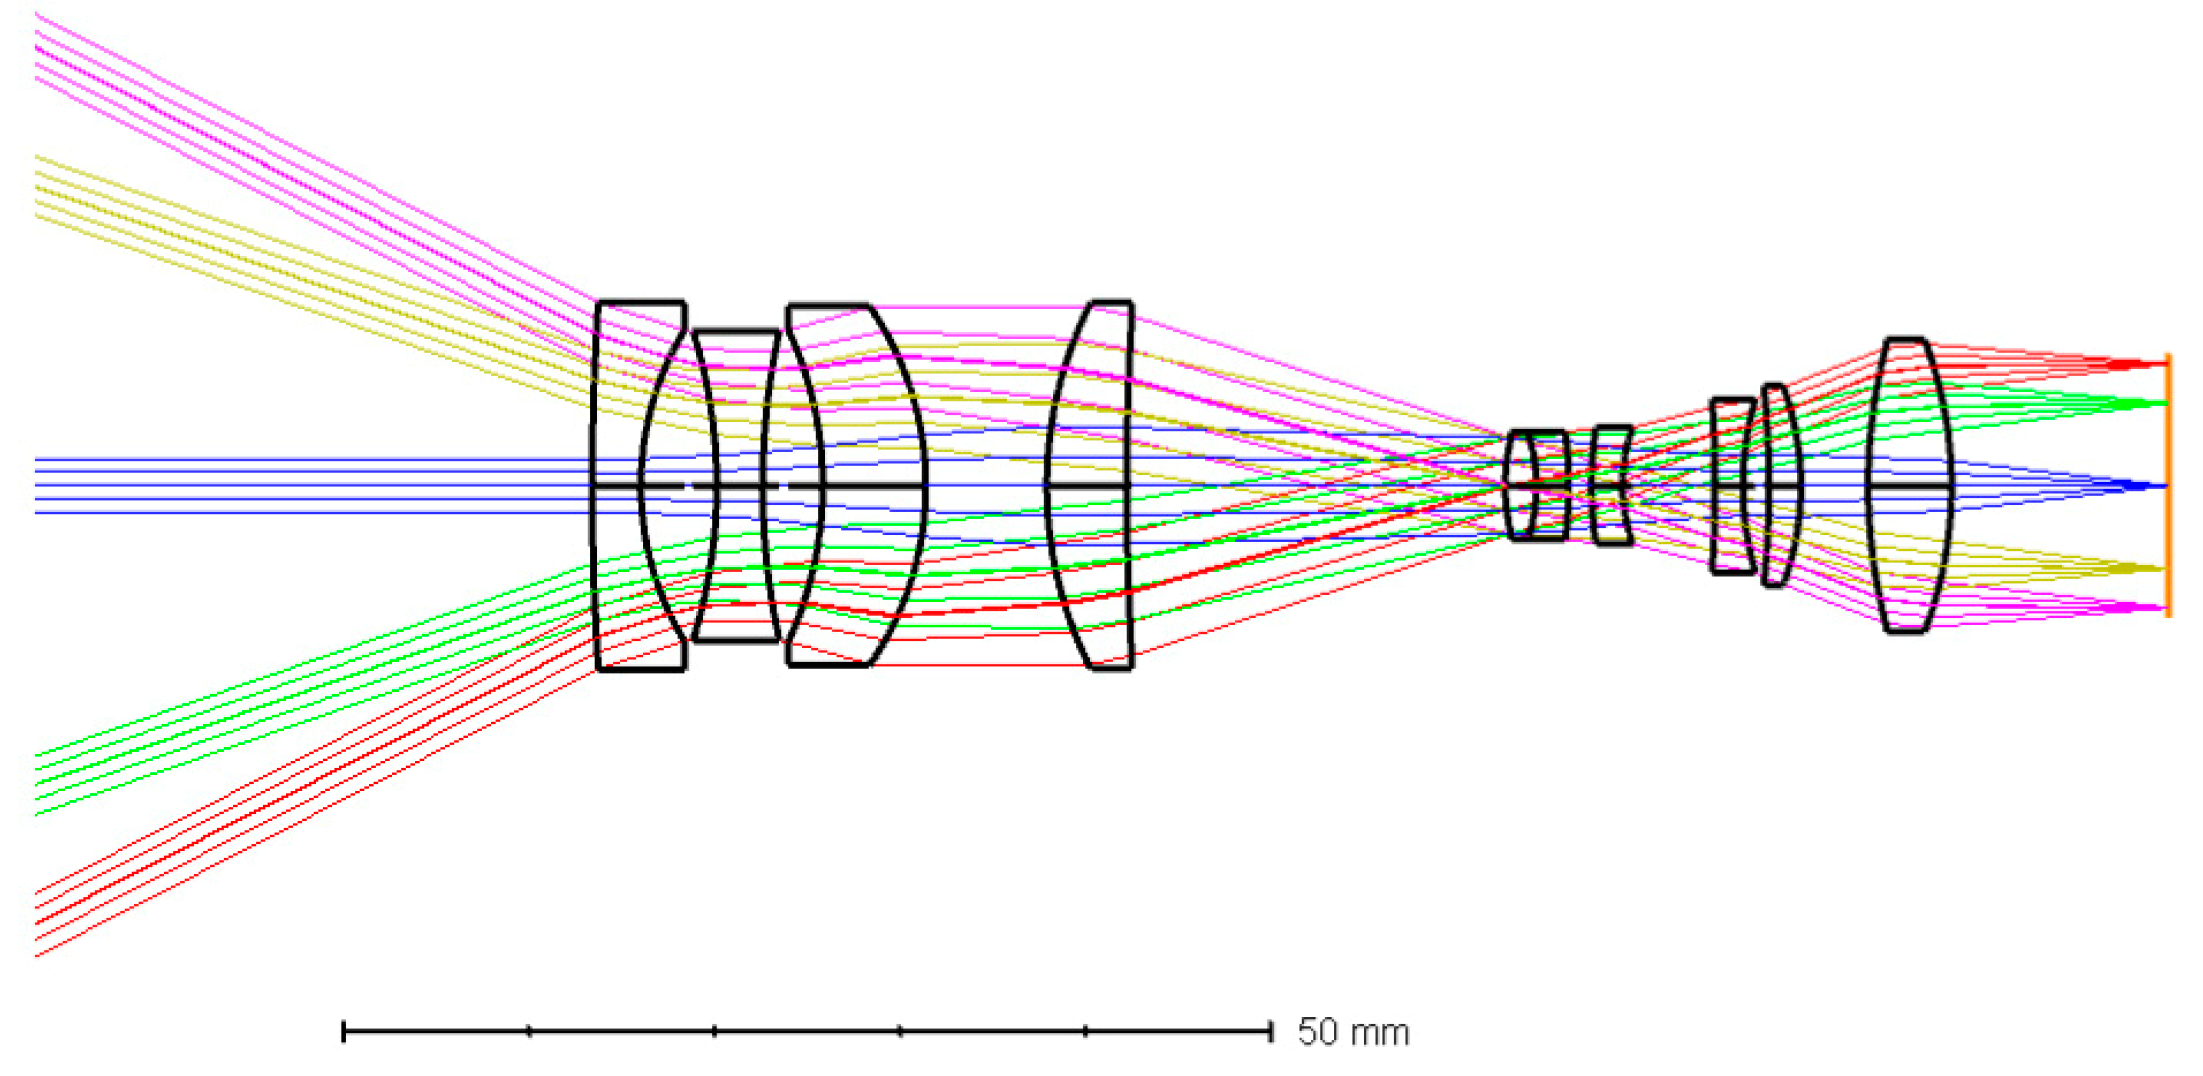
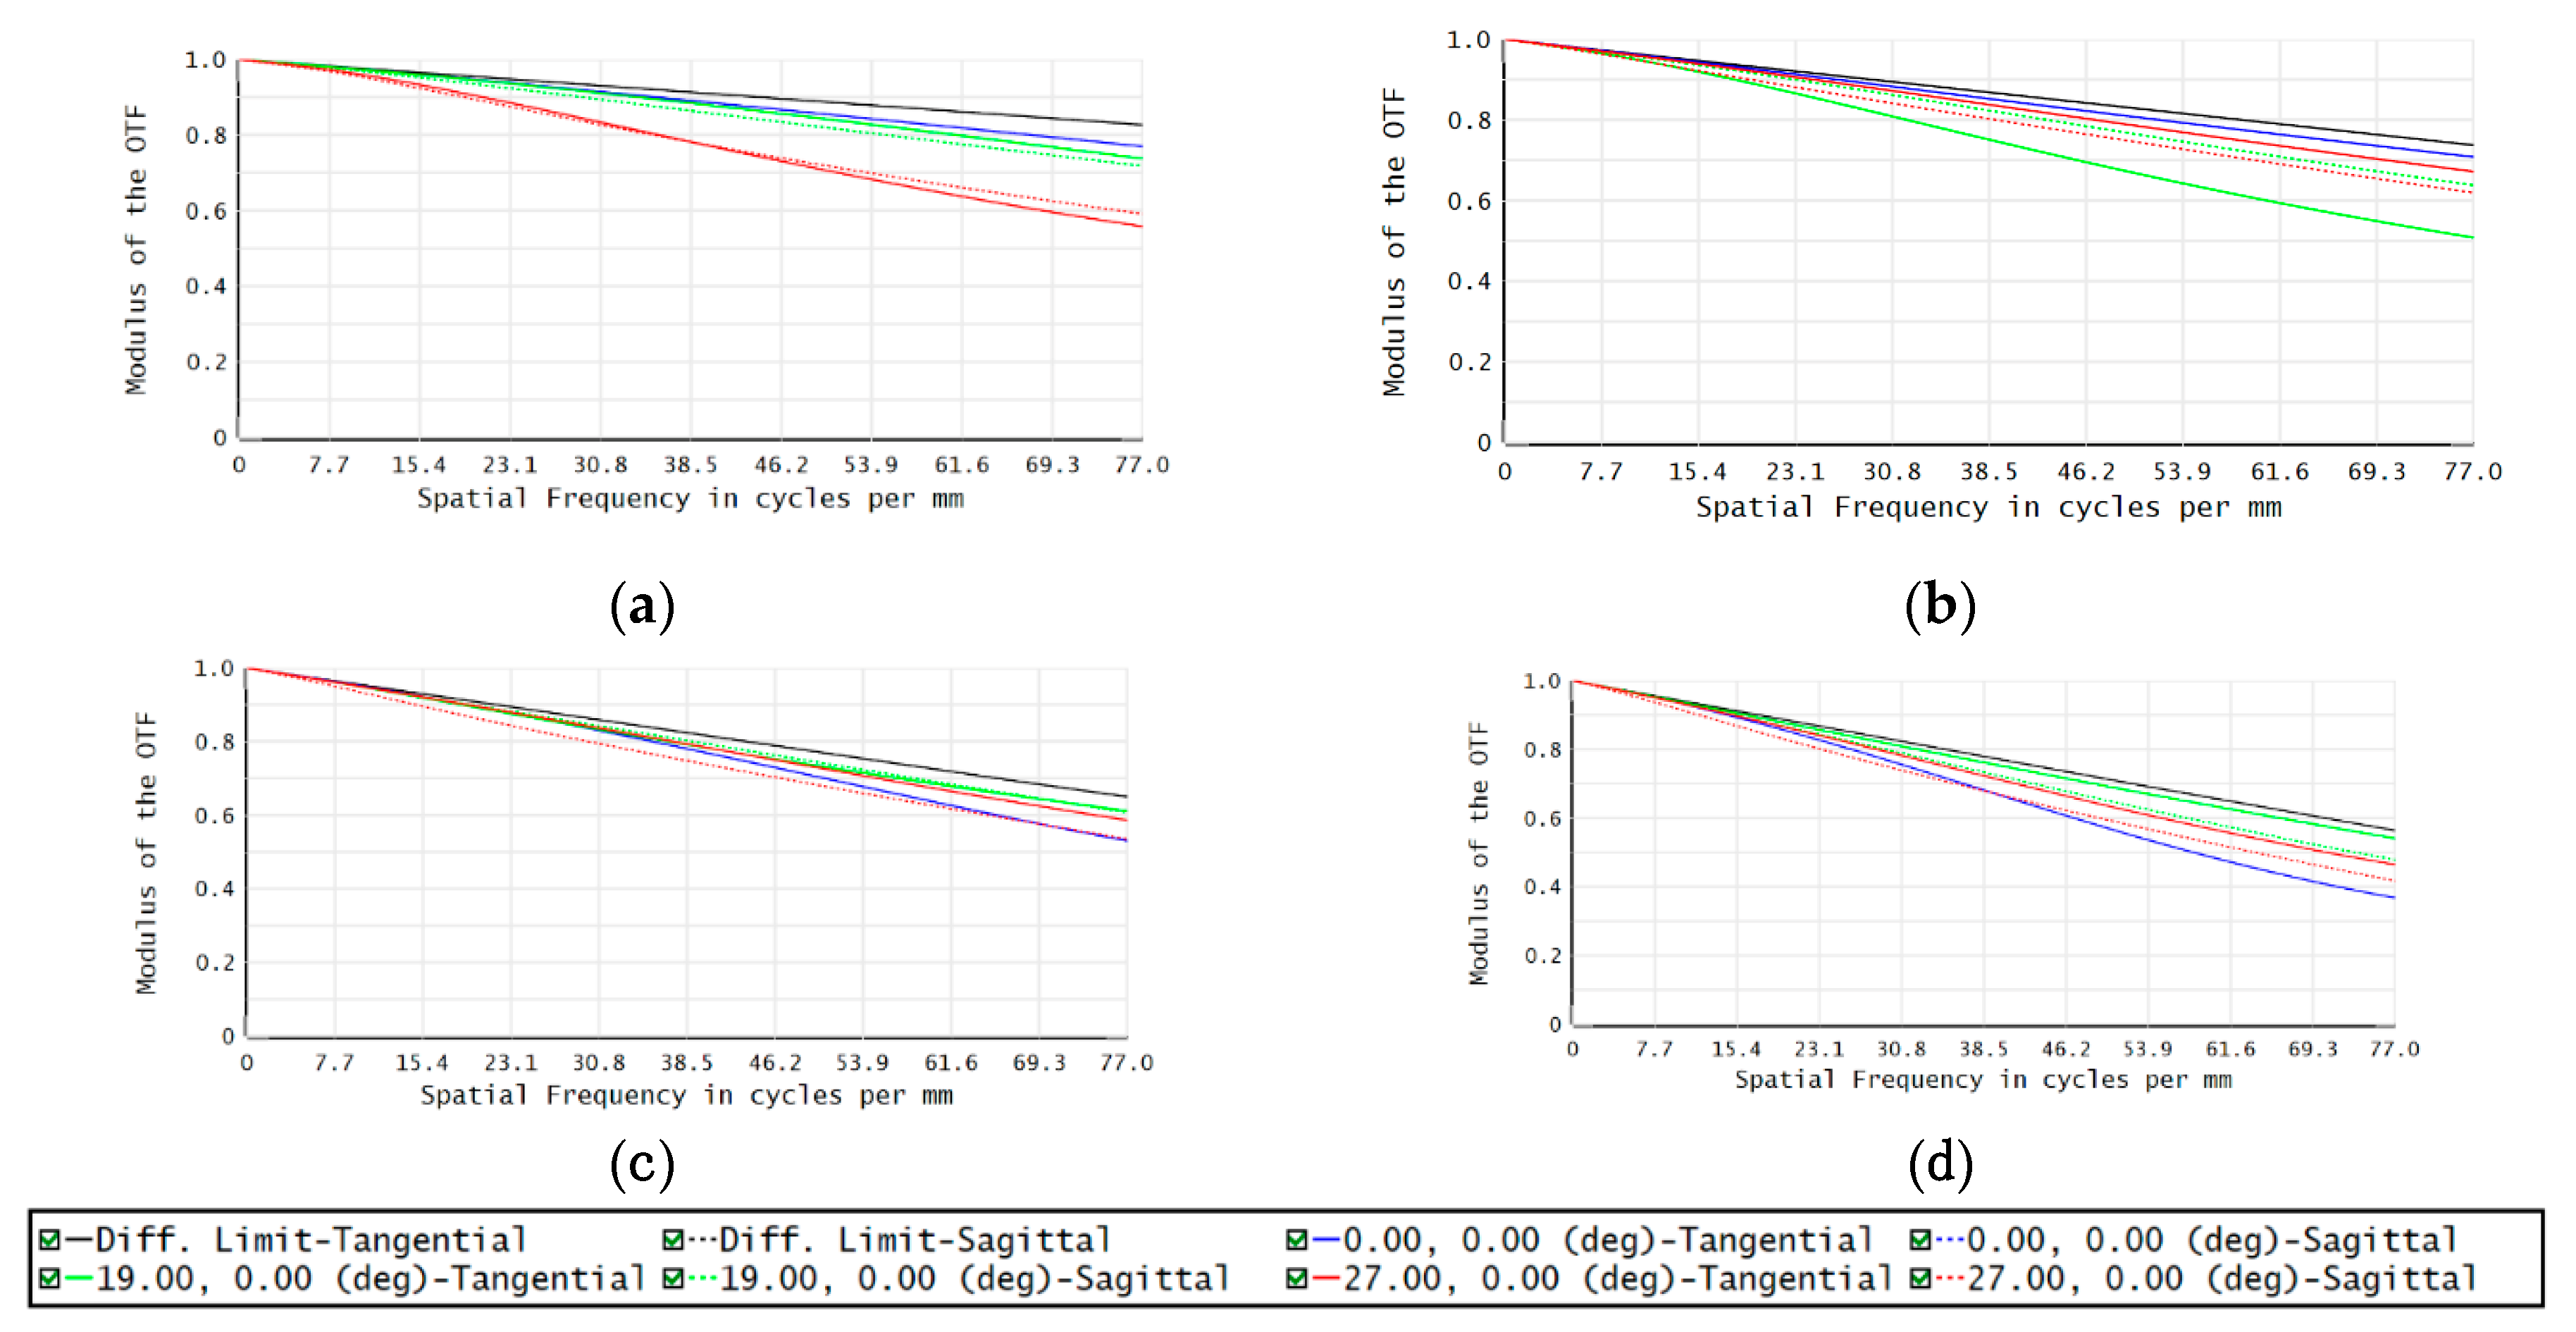
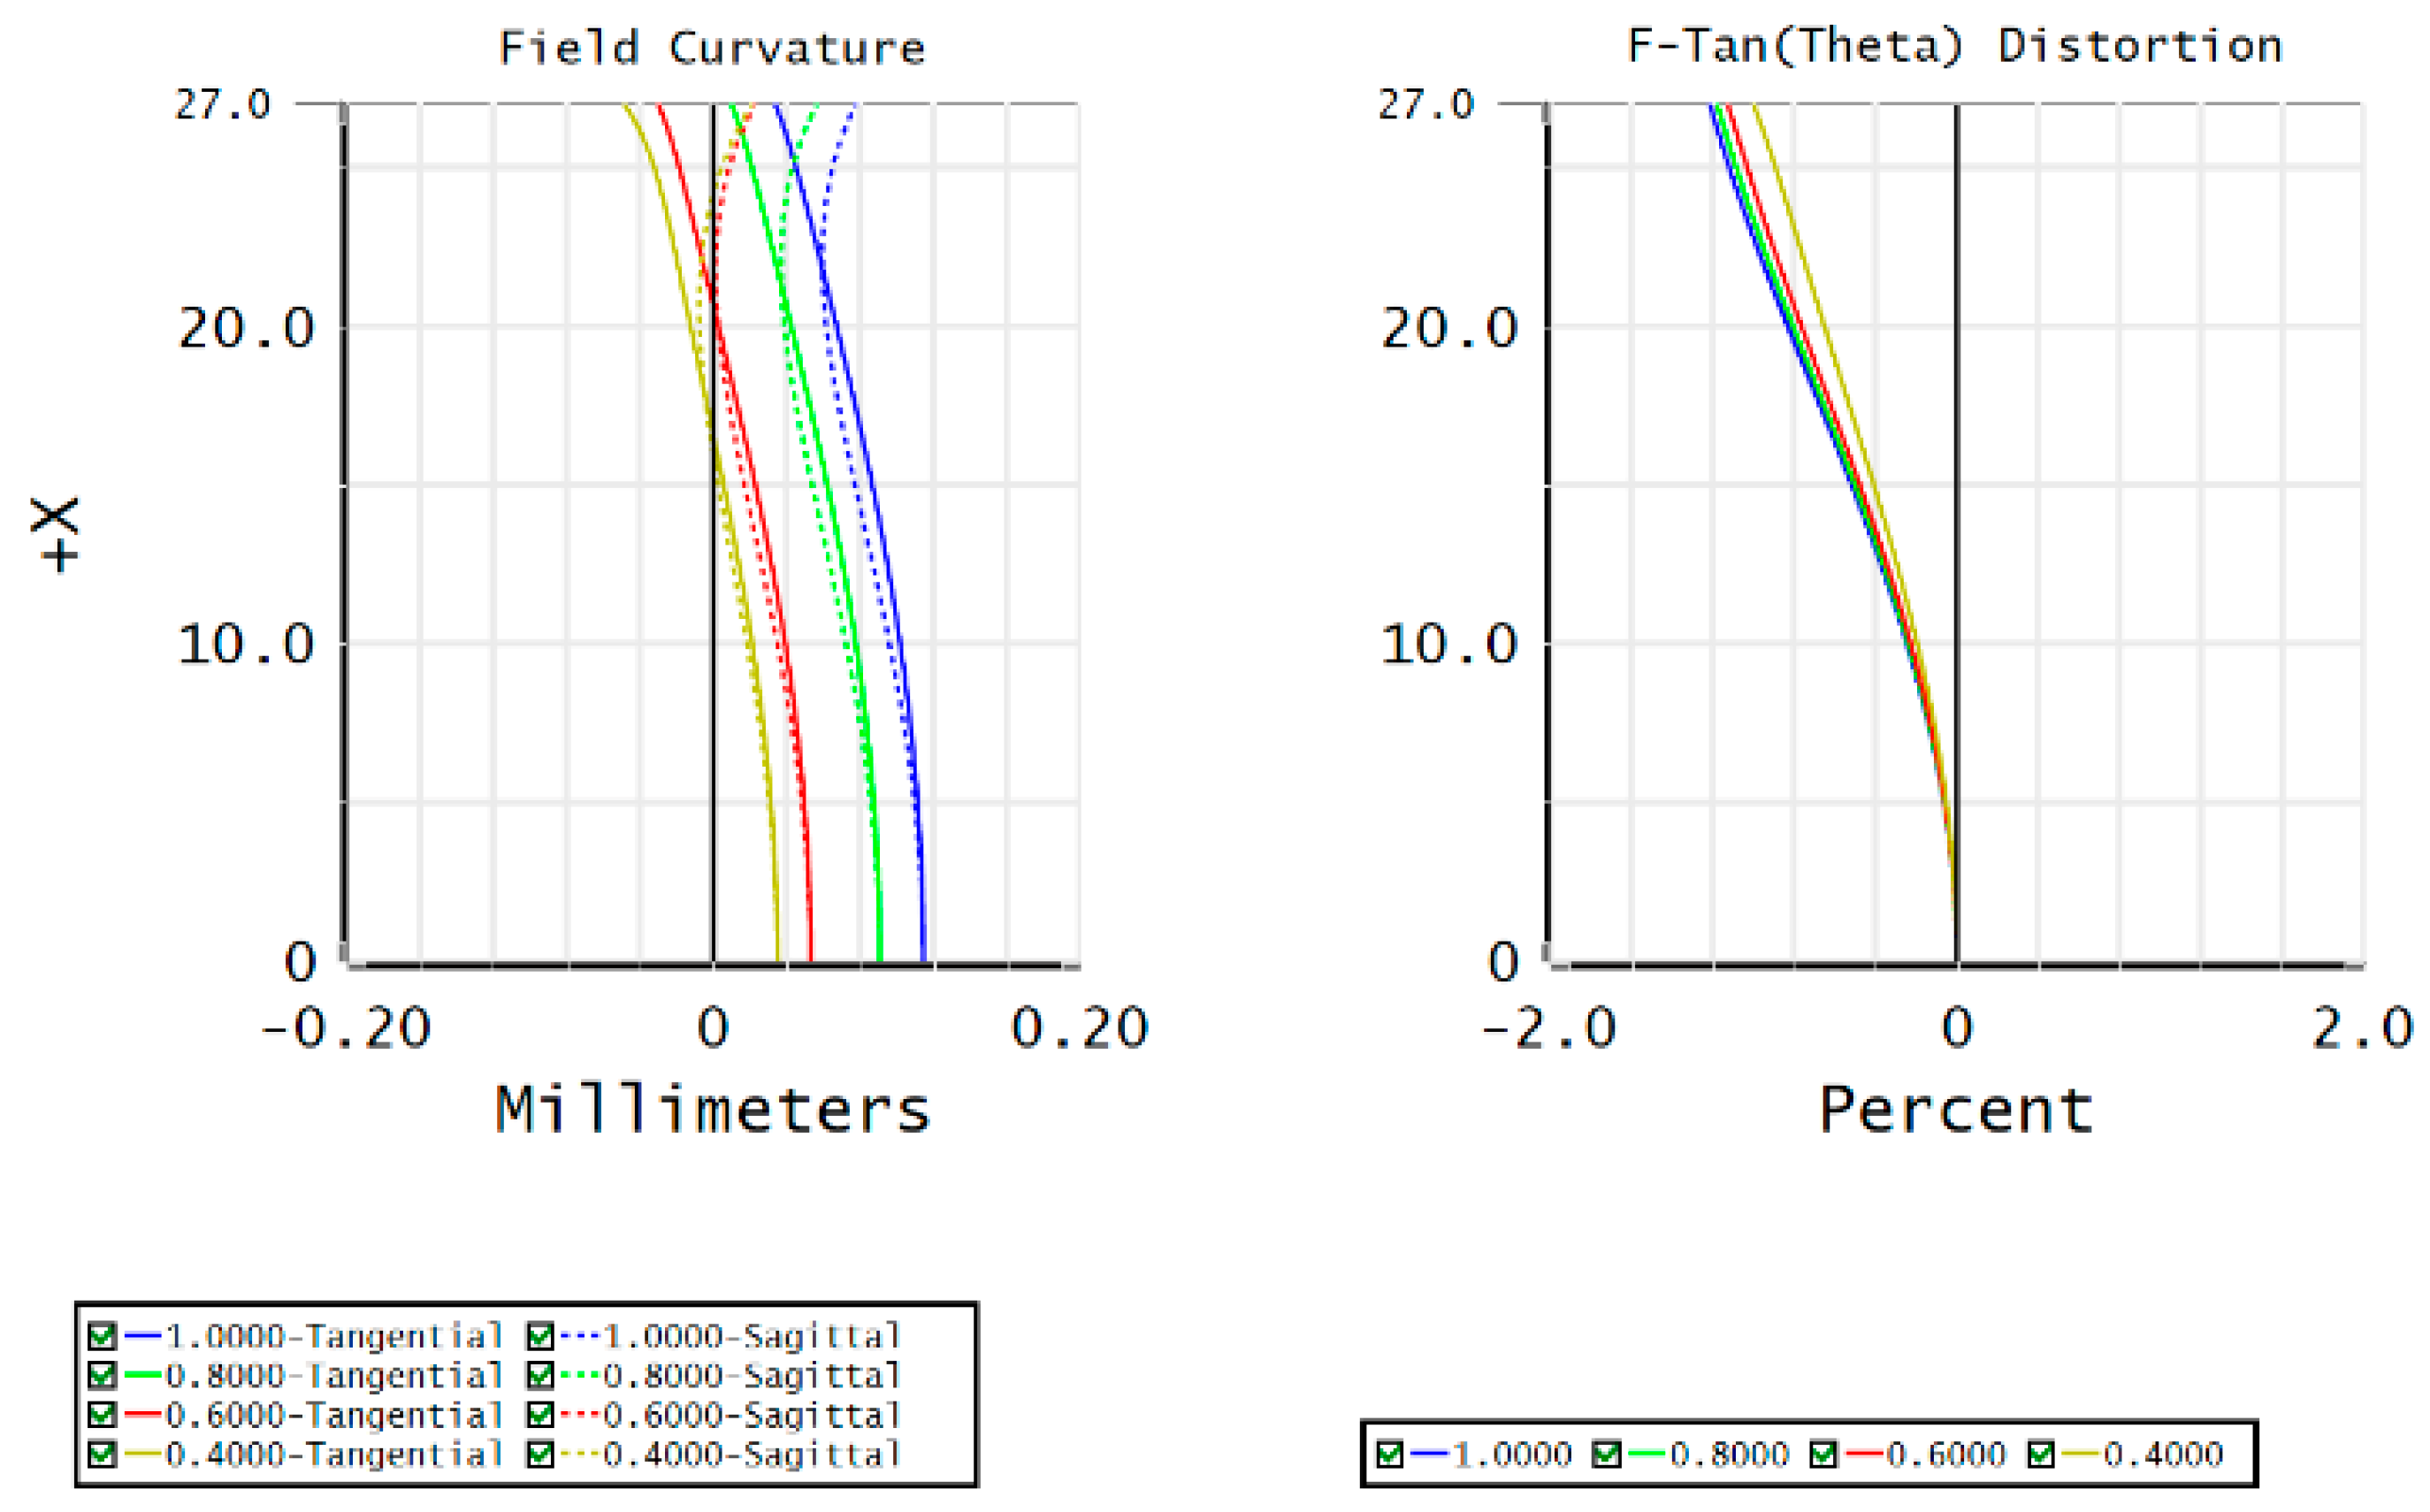
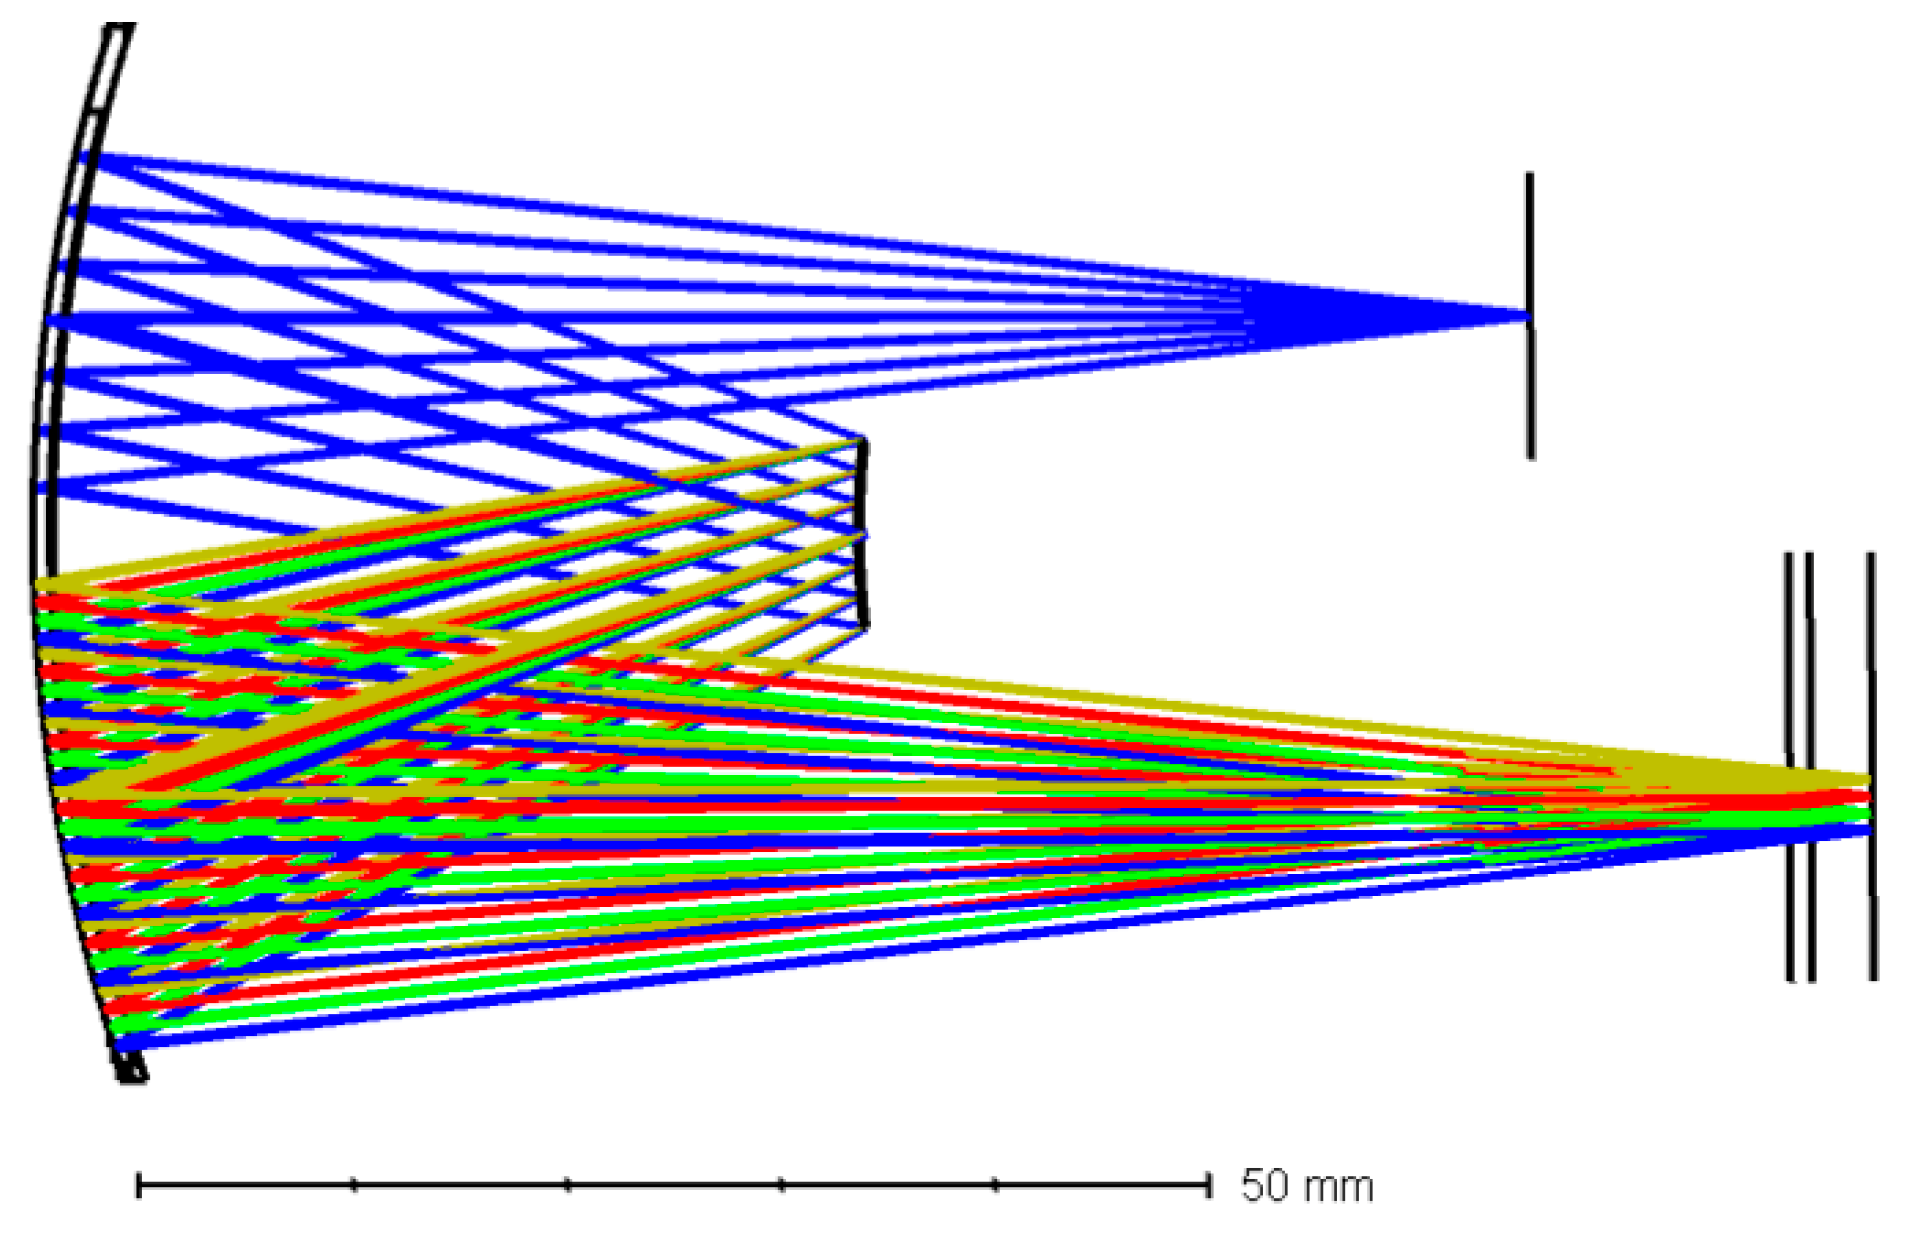
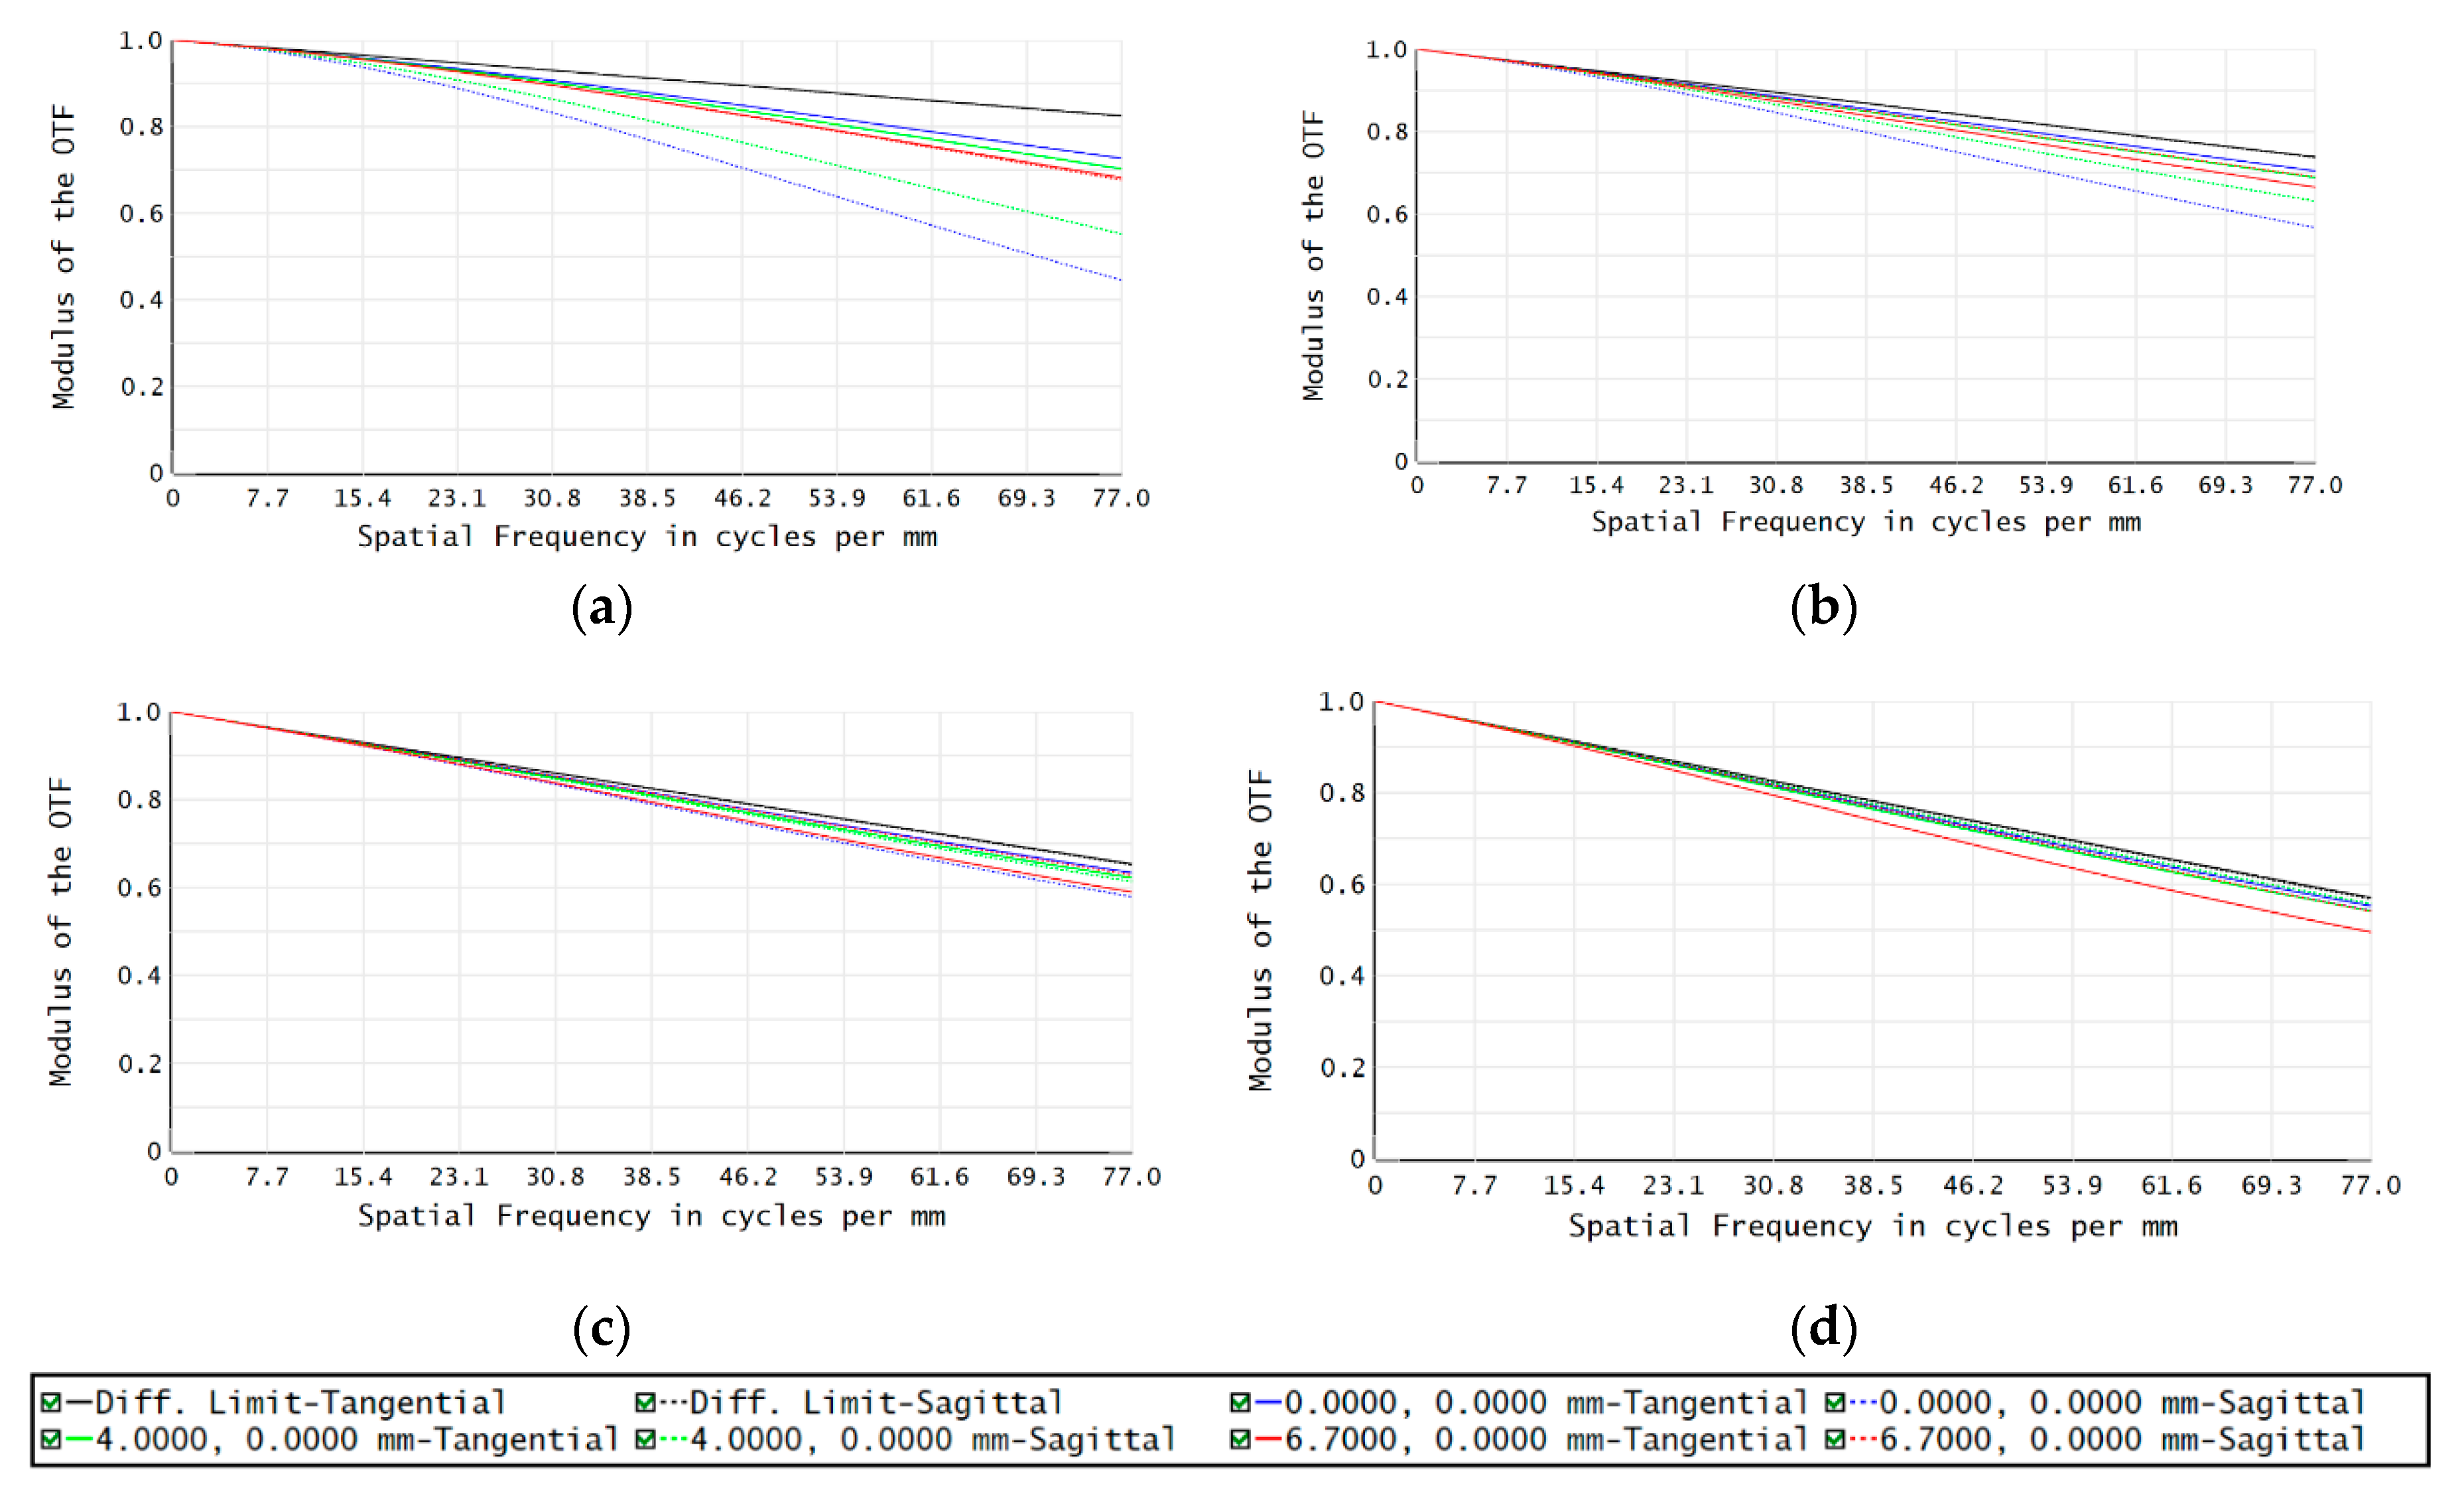
4. Objective Lens Design
5. Design of the Offner Spectrometer
6. Integrated System and Image Quality Evaluation
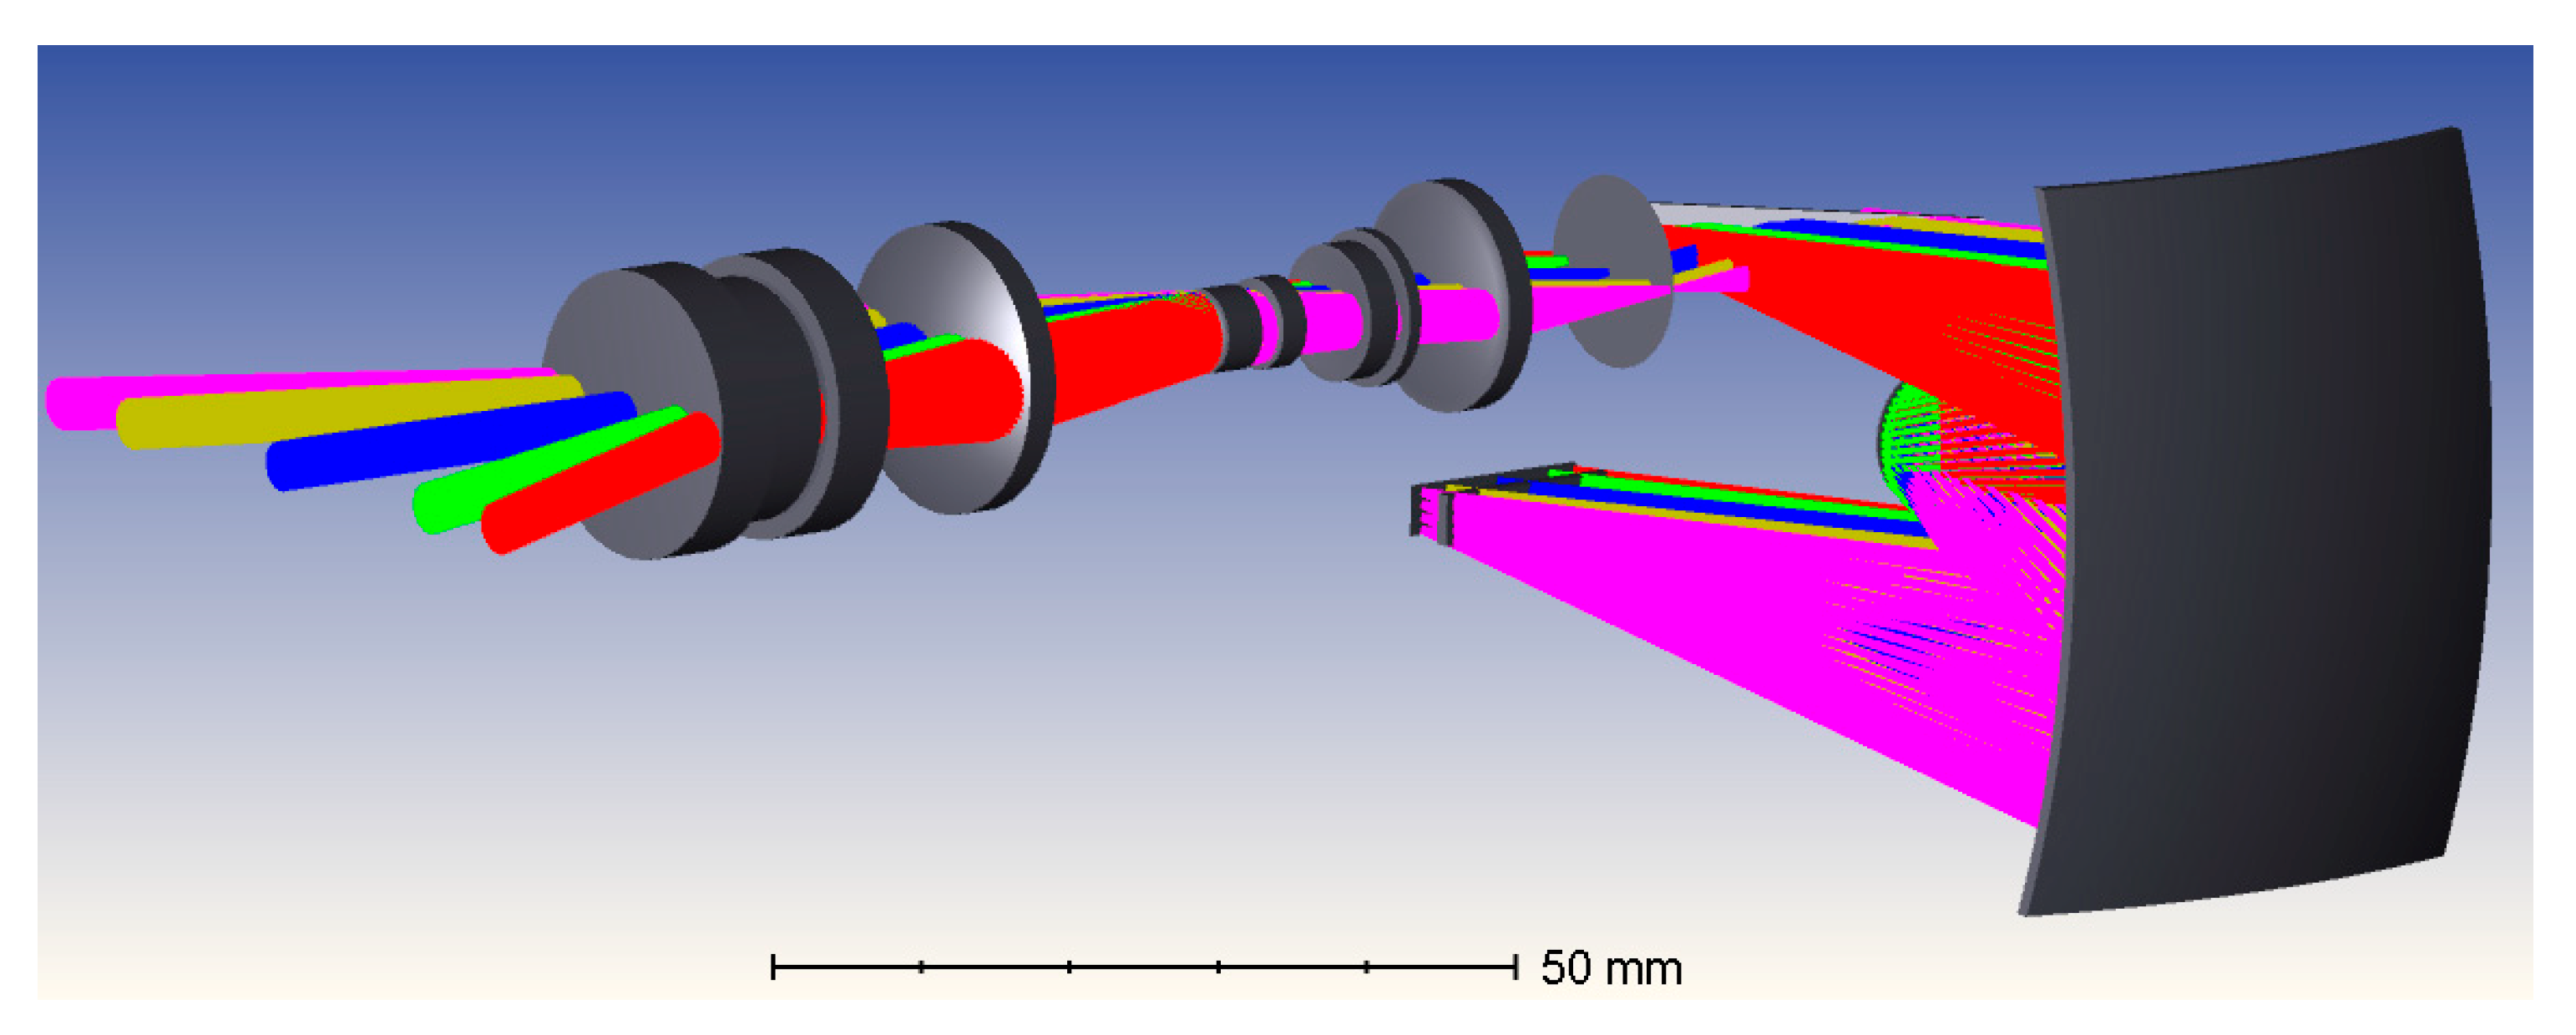
6.1. Integrated System
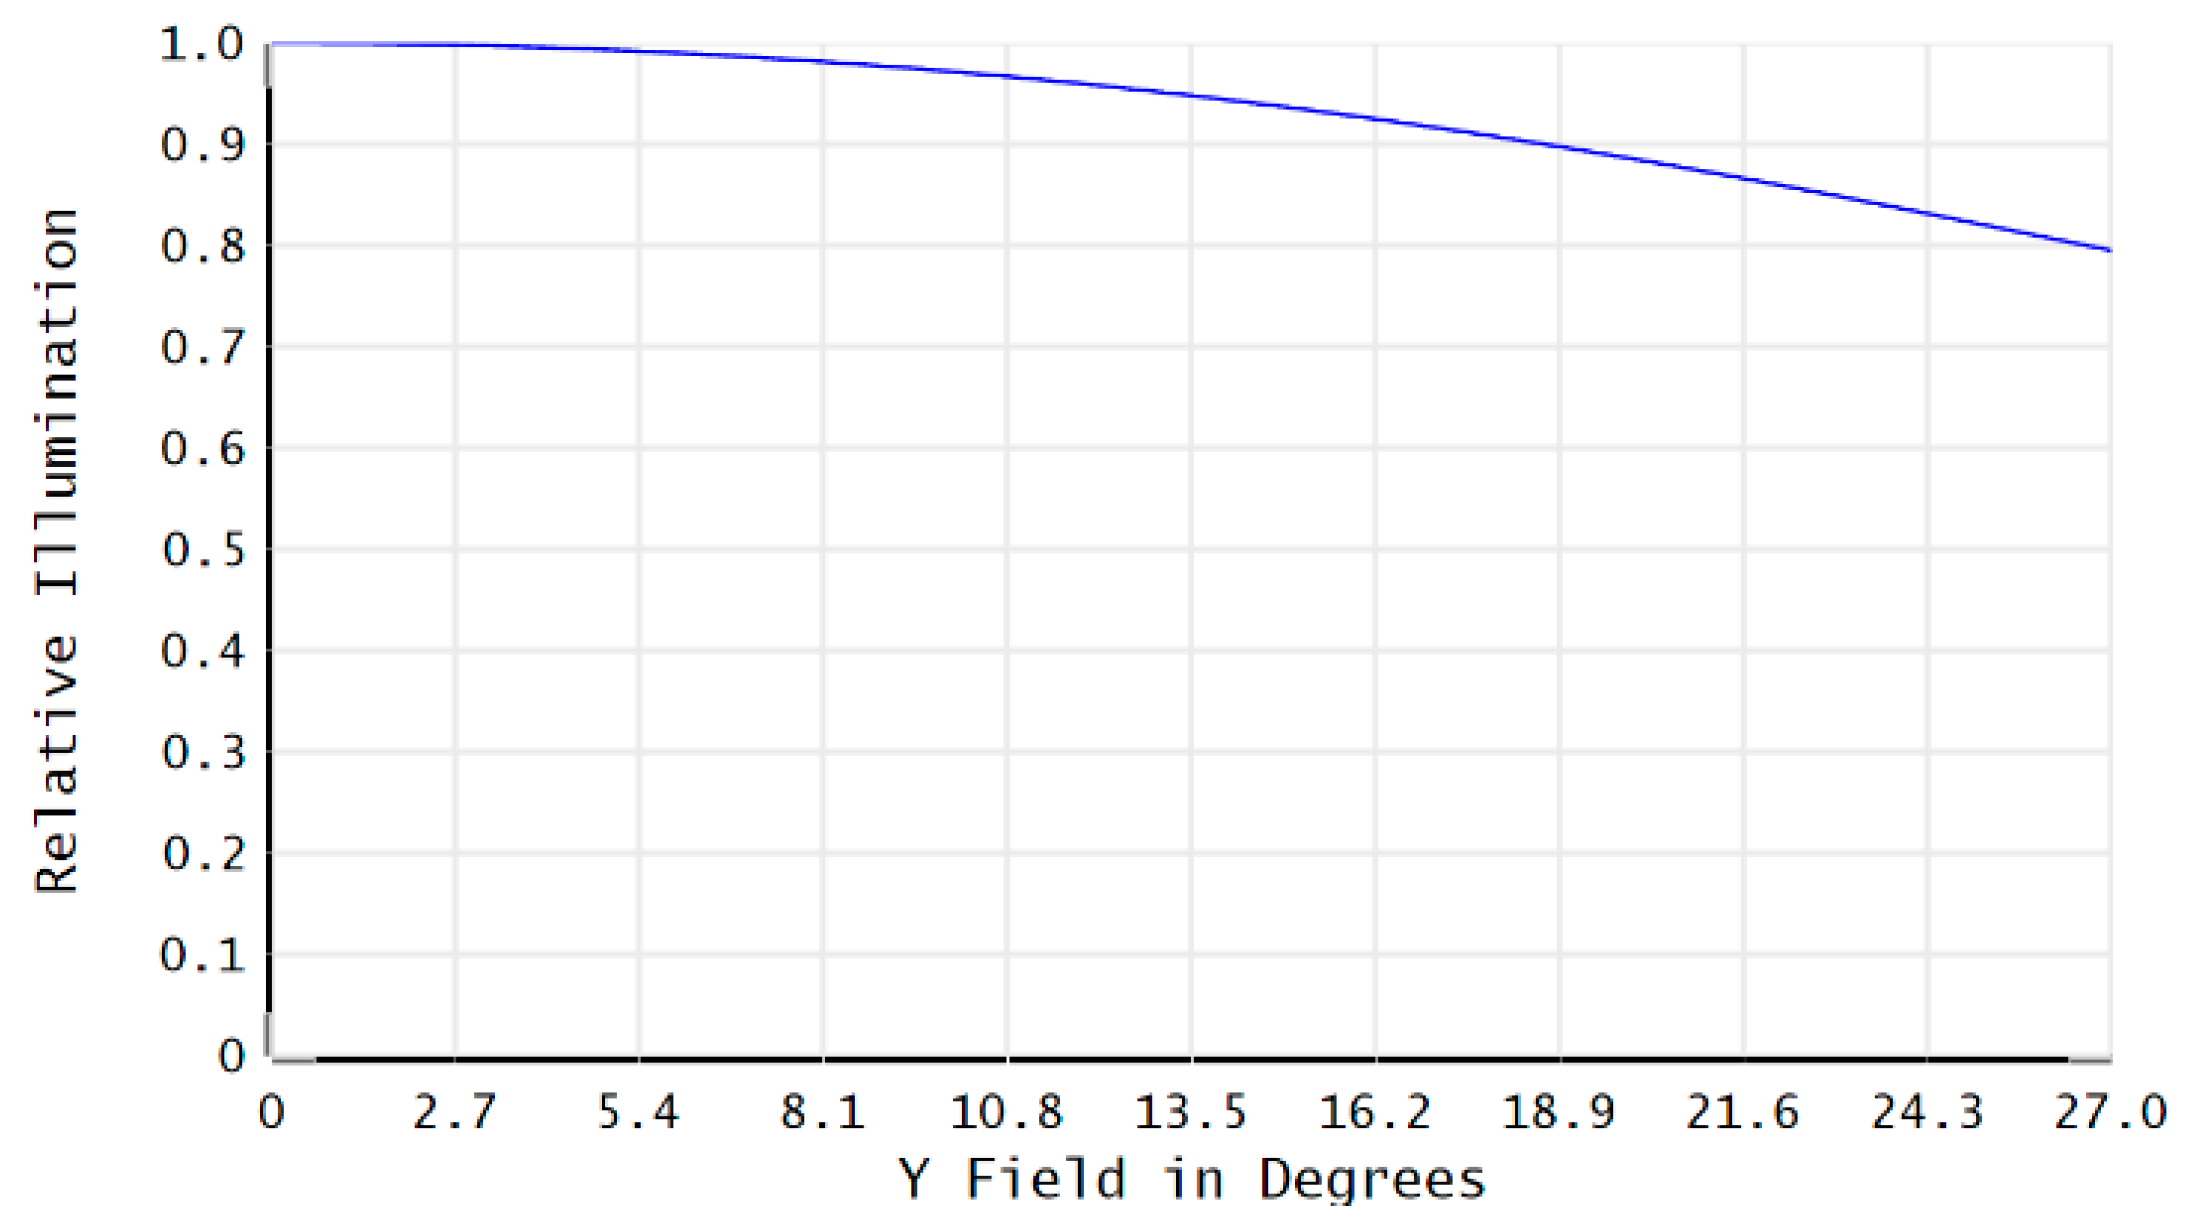
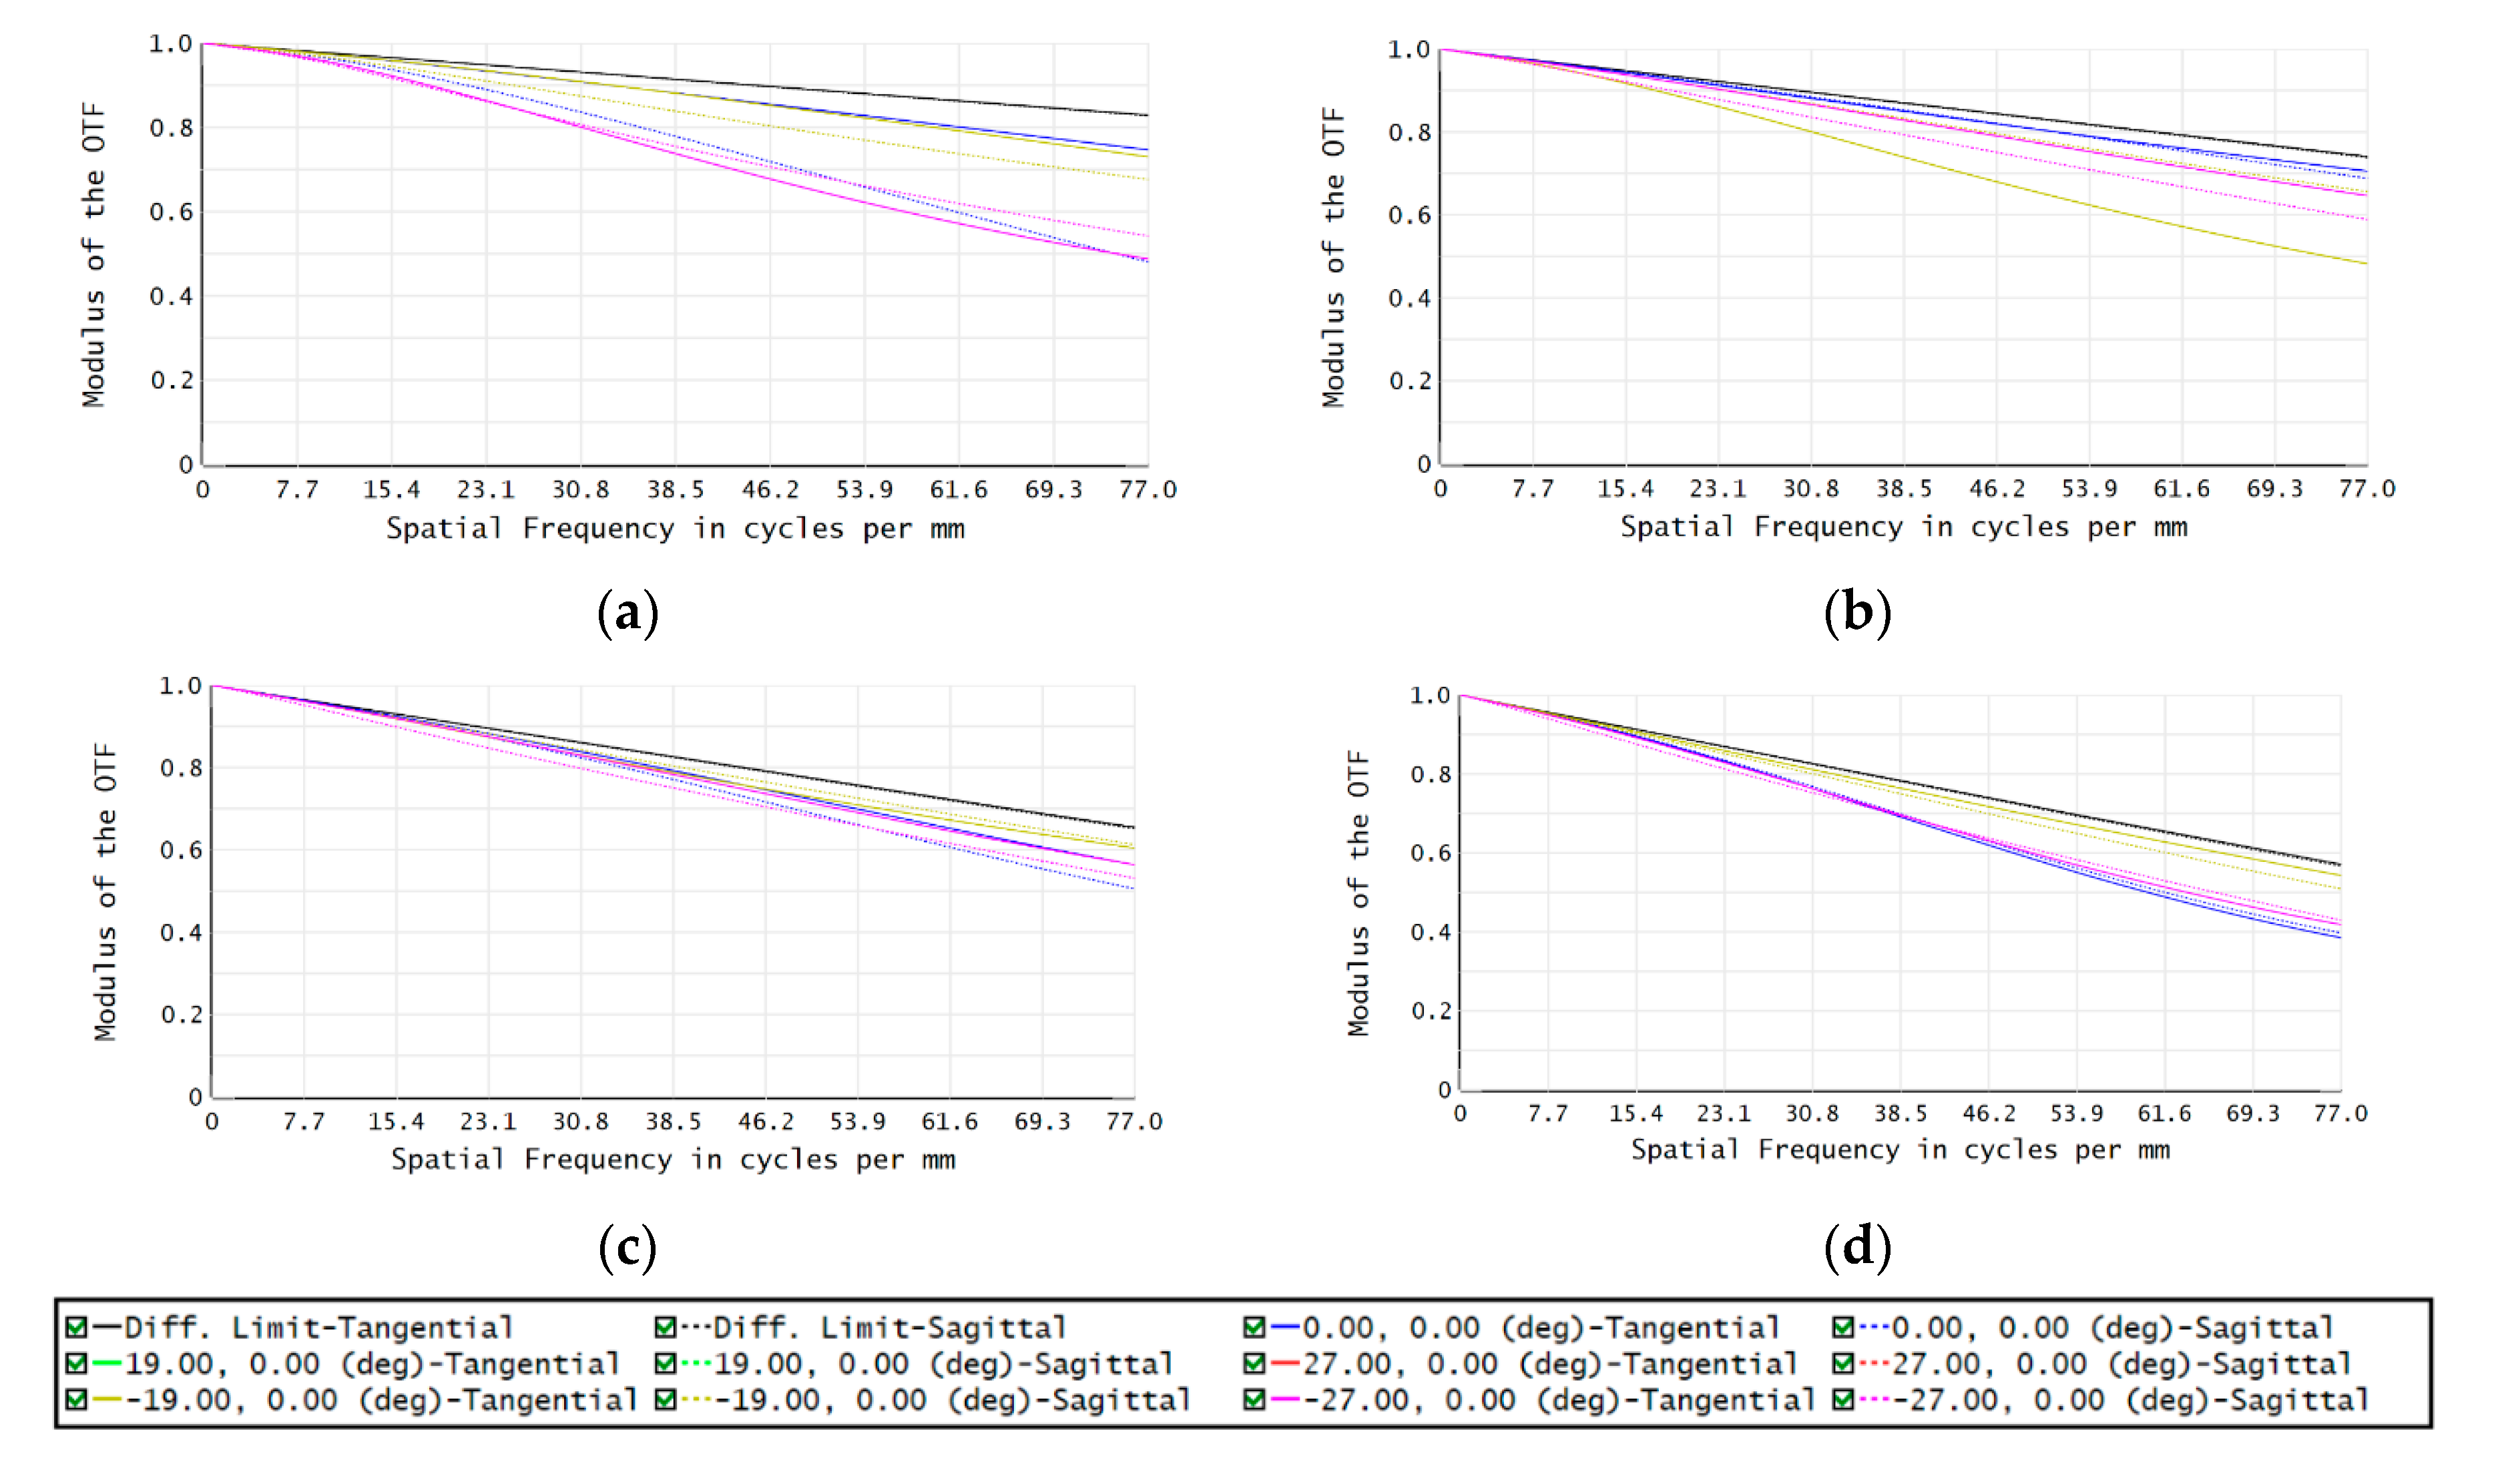
6.2. Image Quality Evaluation
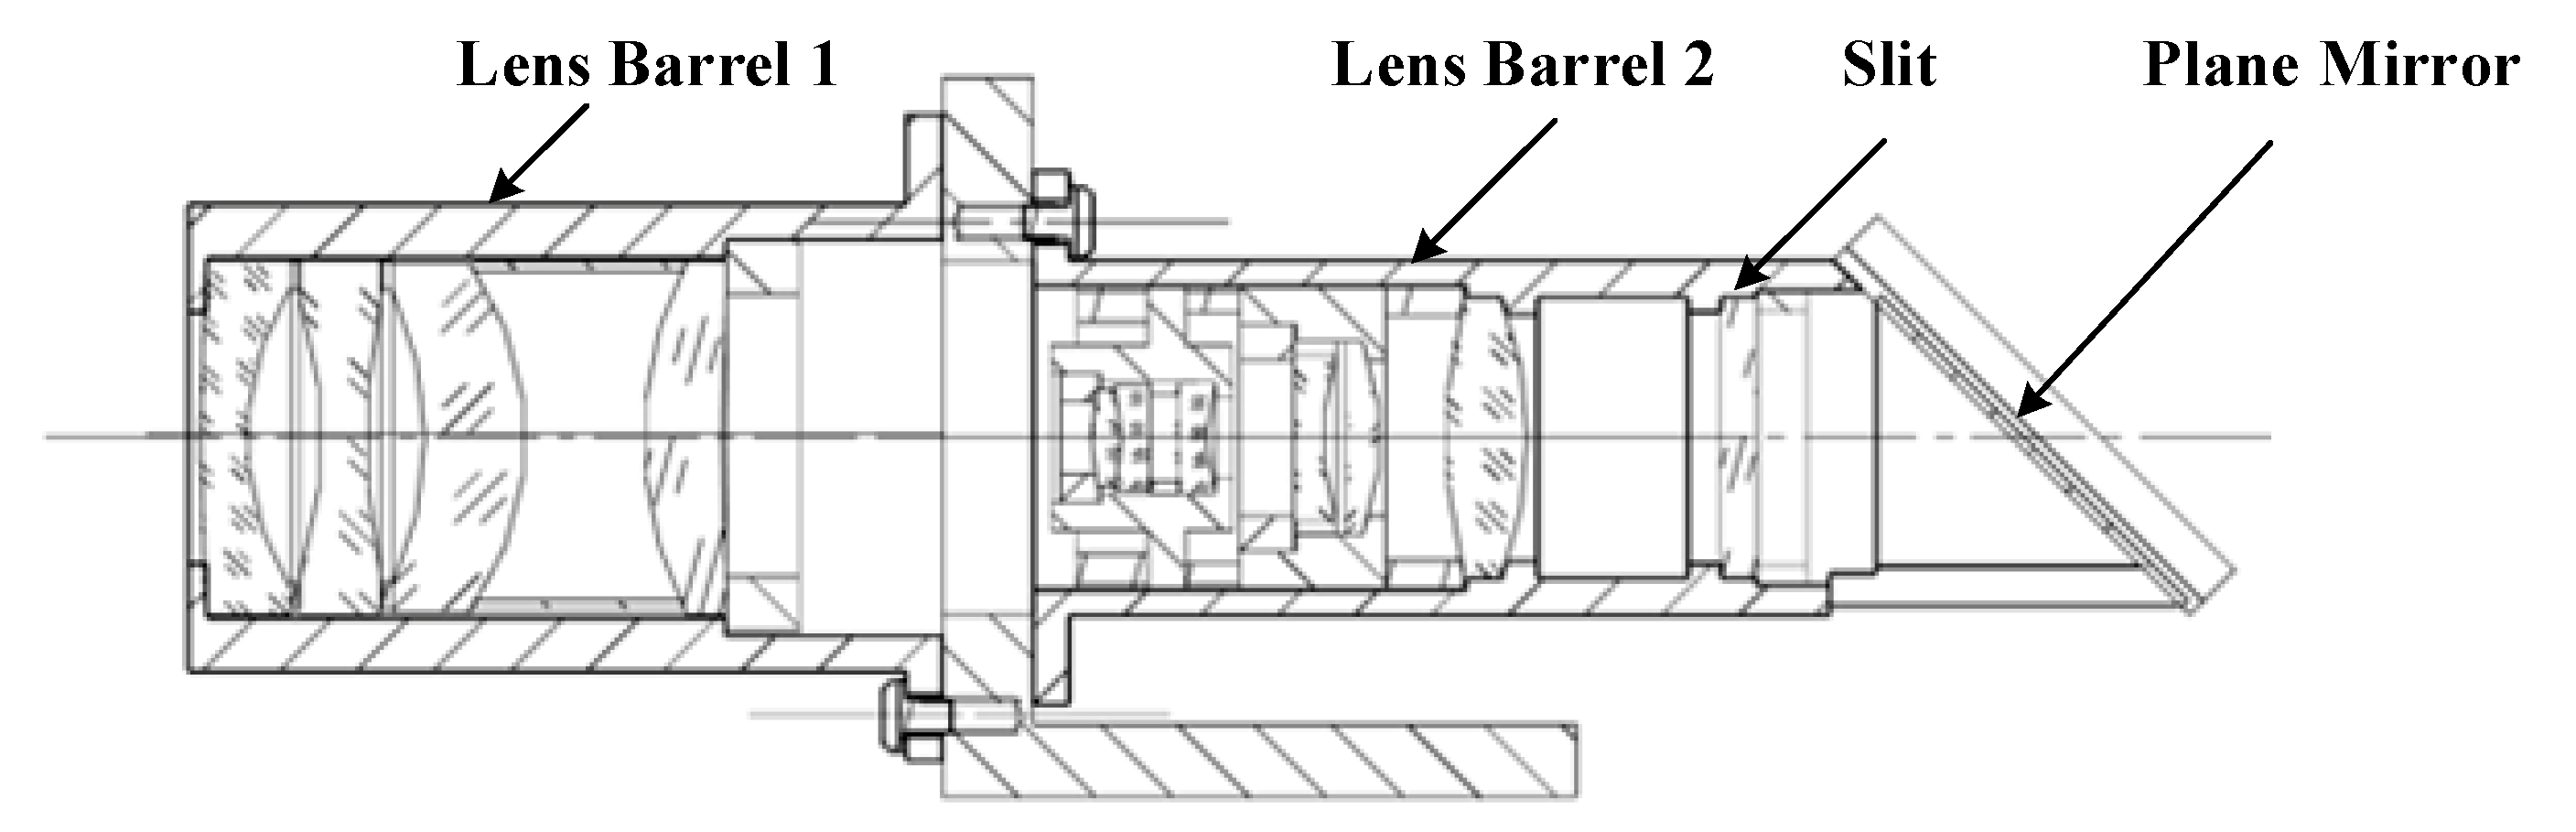
7. Optical–Mechanical Design
7.1. Optical–Mechanical Design of the Objective Lens
7.2. Optical–Mechanical Design for the Combined System
8. Conclusions
Author Contributions
Funding
Conflicts of Interest
References
- Yuan, L.; Xie, J.; He, Z.; Wang, Y.; Wang, J. Optical design and evaluation of airborne prism-grating imaging spectrometer. Opt. Express 2019, 27, 17686–17700. [Google Scholar] [CrossRef] [PubMed]
- Goetz, A.F. Three decades of hyperspectral remote sensing of the Earth: A personal view. Remote Sens. Environ. 2009, 113, S5–S16. [Google Scholar] [CrossRef]
- Mouroulis, P.Z.; Sellar, R.G.; Wilson, D.W.; Shea, J.J.; Green, R.O. Optical design of a compact imaging spectrometer for planetary mineralogy. Opt. Eng. 2007, 46, 063001. [Google Scholar] [CrossRef]
- Kumar, K.A.; Thapa, N.; Kuriakose, S.A. Advances in spaceborne hyperspectral imaging systems. Curr. Sci. 2015, 108, 826. [Google Scholar]
- Mouroulis, P.; Green, R.O. Review of high fidelity imaging spectrometer design for remote sensing. Opt. Eng. 2018, 57, 040901. [Google Scholar] [CrossRef]
- Bender, H.A.; Mouroulis, P.Z.; Green, R.O.; Wilson, D.W. Optical design, performance, and tolerancing of next-generation airborne imaging spectrometers. Proc. SPIE 2010, 7812, 181–189. [Google Scholar]
- Warren, C.P.; Even, D.; Pfister, W.; Nakanishi, K.; Velasco, A.; Breitwieser, D.; Yee, S.; Naungayan, J. Miniaturized visible near-infrared hyperspectral imager for remote-sensing applications. Opt. Eng. 2012, 51, 111720–111721. [Google Scholar] [CrossRef]
- Baohua, W.; Ningjuan, R.; Chongling, G.; Yuanyuan, W.; Xiaoming, Z. Optical System Design of Airborne Light and Compact High Resolution Imaging Spectrometer. Acta Opt. Sin. 2015, 35, 1022001. [Google Scholar] [CrossRef]
- Liyin, Y.; Jianan, X.; Jia, H.; Gang, L. Optical design of compact infrared imaging spectrometer. Infrared Laser Eng. 2018, 47, 418001. [Google Scholar] [CrossRef]
- Sigernes, F.; Fortuna, J.; Grøtte, M.E.; Syrjäsuo, M.; Storvold, R.; Johansen, T.A. Do it yourself hyperspectral imager for handheld to airborne operations. Opt. Express 2018, 26, 6021. [Google Scholar] [CrossRef] [PubMed]
- Kwo, D.; Lawrence, G.; Chrisp, M. Design of A Grating Spectrometer From A 1:1 Offner Mirror System. Proc. SPIE 1987, 818, 275–281. [Google Scholar]
- Lobb, D.R. Theory of concentric designs for grating spectrometers. Appl. Opt. 1994, 33, 2648–2658. [Google Scholar] [CrossRef] [PubMed]
- Lobb, D.R. Imaging spectrometers using concentric optics. Proc. SPIE 1997, 3118, 339–347. [Google Scholar]
- Mouroulis, P.; Wilson, D.W.; Maker, P.D.; Muller, R.E. Convex grating types for concentric imaging spectrometers. Appl. Opt. 1998, 37, 7200–7208. [Google Scholar] [CrossRef] [PubMed]
- Prietoblanco, X.; Monteroorille, C.; Couce, B.; La Fuente, R.D. Analytical design of an Offner imaging spectrometer. Opt. Express 2006, 14, 9156–9168. [Google Scholar] [CrossRef] [PubMed]
- Kim, S.H.; Kong, H.J.; Lee, J.U.; Lee, J.H.; Lee, J.H. Design and construction of an Offner spectrometer based on geometrical analysis of ring fields. Rev. Sci. Instrum. 2014, 85, 083108. [Google Scholar] [CrossRef] [PubMed]
- Zhu, J.; Shen, W. Analytical design of athermal ultra-compact concentric catadioptric imaging spectrometer. Opt. Express 2019, 27, 31094–31109. [Google Scholar] [CrossRef] [PubMed]
- Sellar, R.G.; Boreman, G.D.; Kirkland, L.E. Comparison of signal collection abilities of different classes of imaging spectrometers. Proc. SPIE 2002, 4816, 389–396. [Google Scholar]
- Sellar, R.G.; Boreman, G.D. Comparison of relative signal-to-noise ratios of different classes of imaging spectrometer. Appl. Optics 2005, 44, 1614–1624. [Google Scholar] [CrossRef] [PubMed]
- Fisher, J.; Welch, W.C. Survey and analysis of fore-optics for hyperspectral imaging systems. Proc. SPIE 2006, 6206, 62062R. [Google Scholar]


| Spectral Range | Spectral Resolution | Spatial Resolution | Coverage Width | Total Weight | SNR |
|---|---|---|---|---|---|
| 0.4~1.0 μm | 15 nm | 0.5 m@1 km | 1 km@1 km | <3 kg | ≥100 |
| Parameters | Value |
|---|---|
| Pixel number | 2048 × 1152 |
| Pixel size (μm) | 6.5 × 6.5 |
| Dark Noise () | <6 |
| Dark Current () | <1 |
| Maximum frame rate (fps) | 167 |
| Parameters | Value |
|---|---|
| 4.225 × 10⁻¹¹ m2 | |
| 0.85 | |
| 0.014 s | |
| 15 nm | |
| F | 4.5 |
| Parameters | Value |
|---|---|
| Focal length | 13 mm |
| Relative aperture | 1/4.5 |
| FOV | 54° |
| Spectral range | 400~1000 nm |
| Parameters | Value |
|---|---|
| Working wavelength (nm) | 400~1000 |
| Slit length (mm) | 13.5 |
| Slit image dispersion width (mm) | 2.6 |
| Object space NA | 0.11 |
© 2020 by the authors. Licensee MDPI, Basel, Switzerland. This article is an open access article distributed under the terms and conditions of the Creative Commons Attribution (CC BY) license (http://creativecommons.org/licenses/by/4.0/).
Share and Cite
Wang, Y.; Gu, Z.; Meng, X.; Zhang, L.; Fu, Y. Optical Design of a Miniaturized Airborne Push-Broom Spectrometer. Appl. Sci. 2020, 10, 2627. https://doi.org/10.3390/app10072627
Wang Y, Gu Z, Meng X, Zhang L, Fu Y. Optical Design of a Miniaturized Airborne Push-Broom Spectrometer. Applied Sciences. 2020; 10(7):2627. https://doi.org/10.3390/app10072627
Chicago/Turabian StyleWang, Yang, Zhiyuan Gu, Xiangyue Meng, Lei Zhang, and Yuegang Fu. 2020. "Optical Design of a Miniaturized Airborne Push-Broom Spectrometer" Applied Sciences 10, no. 7: 2627. https://doi.org/10.3390/app10072627
APA StyleWang, Y., Gu, Z., Meng, X., Zhang, L., & Fu, Y. (2020). Optical Design of a Miniaturized Airborne Push-Broom Spectrometer. Applied Sciences, 10(7), 2627. https://doi.org/10.3390/app10072627