Using 2D CNN with Taguchi Parametric Optimization for Lung Cancer Recognition from CT Images


Abstract
1. Introduction
2. Methods
2.1. Taguchi Method
2.2. Materials
2.3. 2D CNN Model
3. Experimental Results
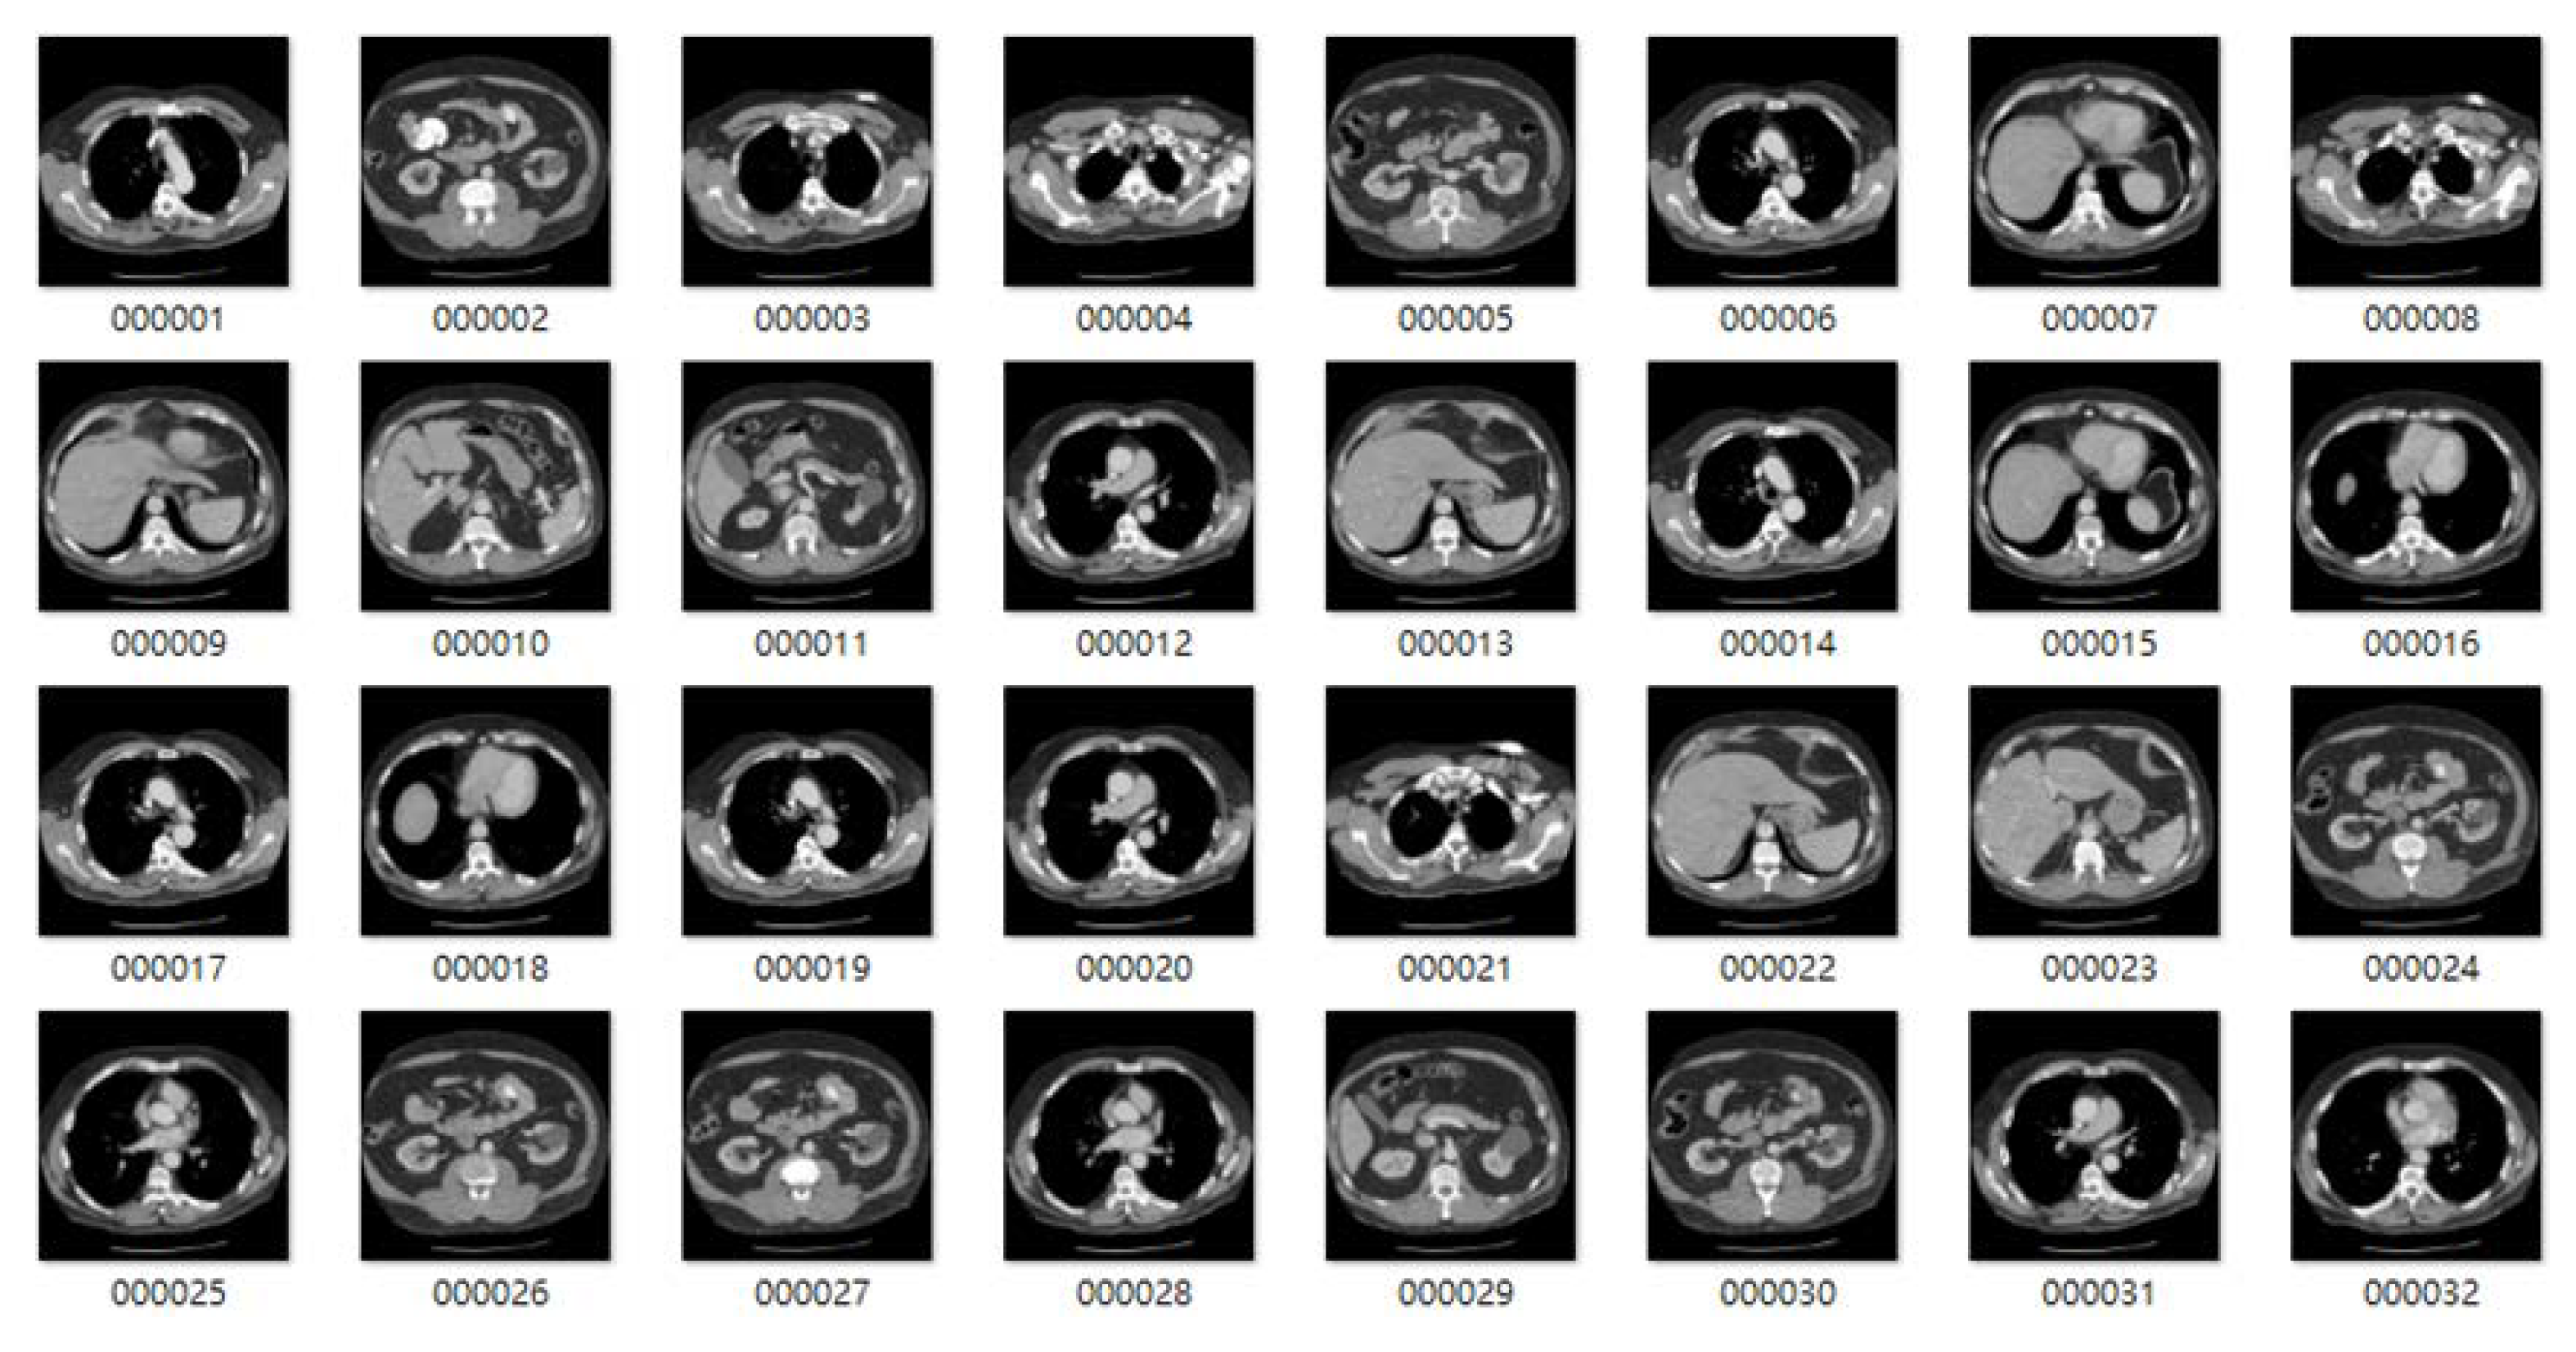
3.1. LIDC-IDRI
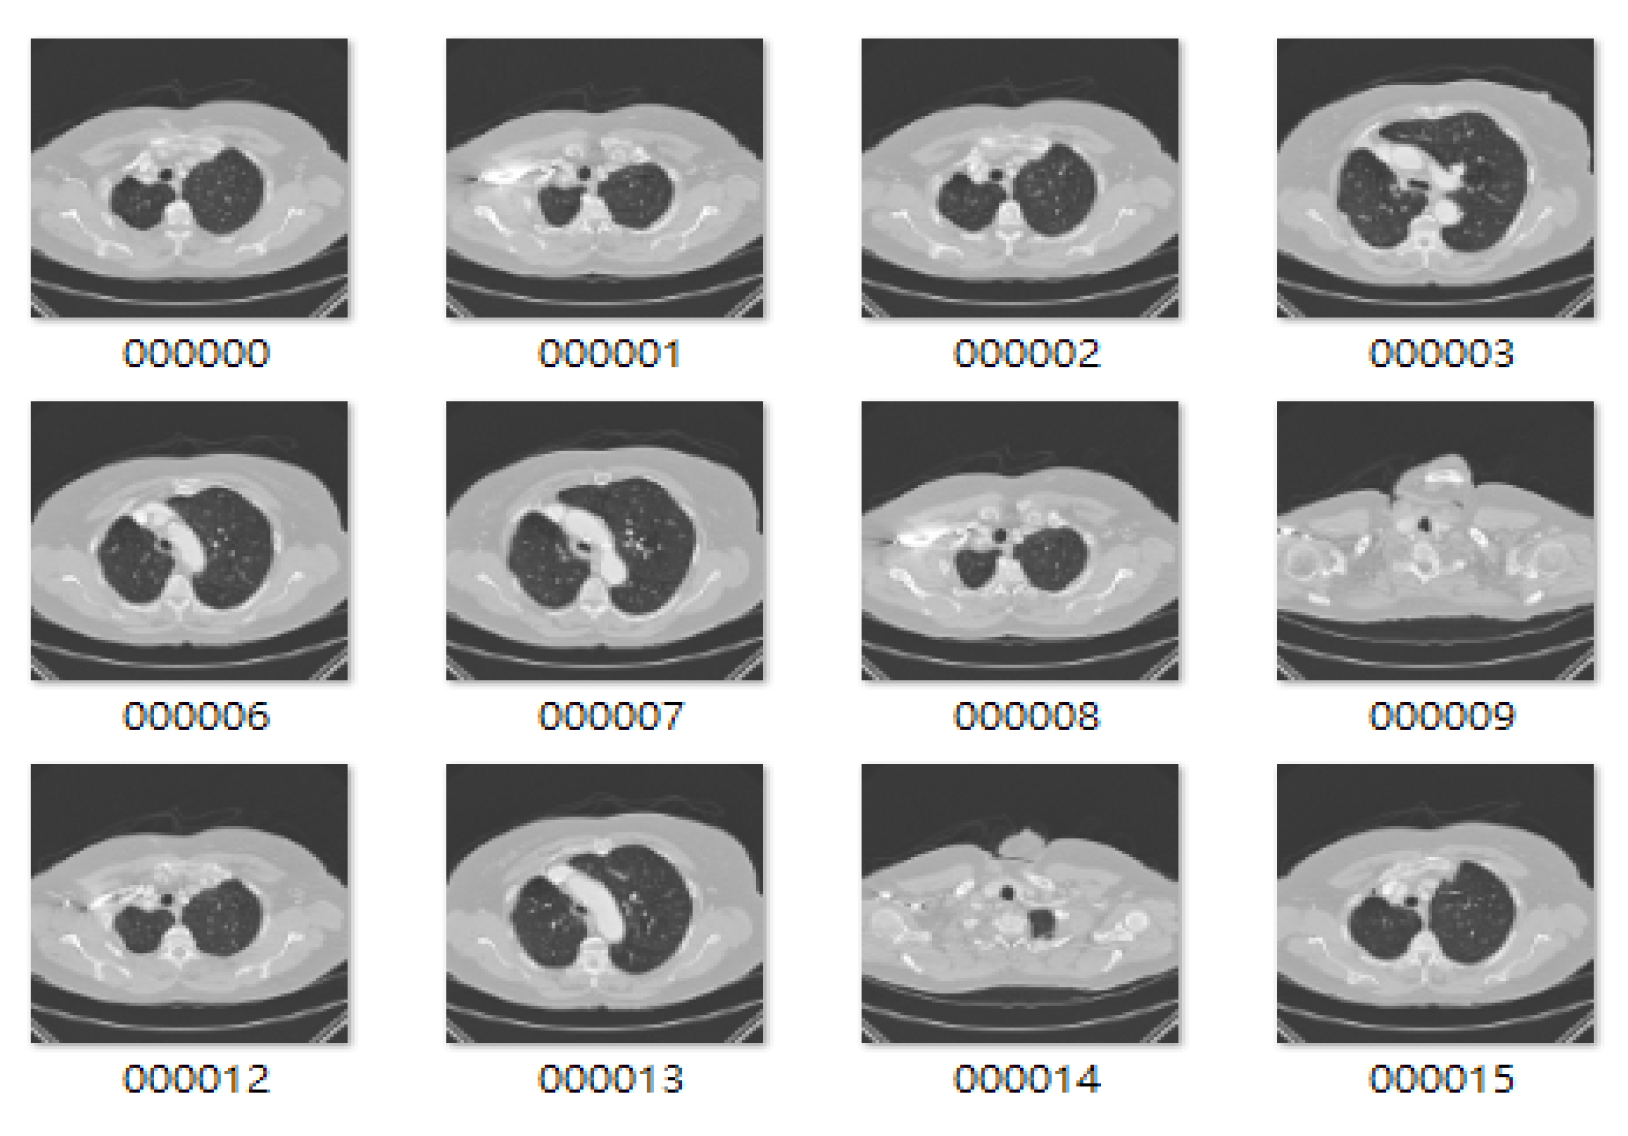
3.2. SPIE-AAPM
3.3. Discussion
4. Conclusions
Author Contributions
Funding
Conflicts of Interest
References
- Bray, F.; Ferlay, J.; Soerjomataram, I.; Siegel, R.L.; Torre, L.A.; Jemal, A. Global cancer statistics 2018: GLOBOCAN estimates of incidence and mortality worldwide for 36 cancers in 185 countries. CA Cancer J. Clin. 2018, 68, 394–424. [Google Scholar] [CrossRef]
- Togaçar, M.; Ergen, B.; Cömert, Z. Detection of lung cancer on chest CT images using minimum redundancy maximum relevance feature selection method with convolutional neural networks. Biocybern. Biomed. Eng. 2020, 40, 23–39. [Google Scholar] [CrossRef]
- Zhanga, S.; Hanb, F.; Lianga, Z.; Tane, J.; Caoa, W.; Gaoa, Y.; Pomeroyc, M.; Ng, K.; Hou, W. An investigation of CNN models for differentiating malignant from benign lesions using small pathologically proven datasets. Comput. Med Imaging Graph. 2019, 77. [Google Scholar] [CrossRef]
- Liu, H.; Zhang, S.; Jiang, X.; Zhang, T.; Huang, H.; Ge, F.; Zhao, L.; Li, X.; Hu, X.; Han, J.; et al. The cerebral cortex is bisectionally segregated into two fundamentally different functional units of gyri and sulci. Cereb. Cortex 2019, 29, 4238–4252. [Google Scholar] [CrossRef]
- Zhang, S.; Liu, H.; Huang, H.; Zhao, Y.; Jiang, X.; Bowers, B.; Guo, L.; Hu, X.; Sanchez, M.; Liu, T. Deep learning models unveiled functional difference between cortical gyri and sulci. IEEE Trans. Biomed. Eng. 2019, 66, 1297–1308. [Google Scholar] [CrossRef]
- Liu, Y.; Wang, H.; Gu, Y.; Lv, X. Image classification toward lung cancer recognition by learning deep quality model. J. Vis. Commun. Image Represent. 2019, 78. [Google Scholar] [CrossRef]
- Bonavita, I.; Rafael-Palou, X.; Ceresa, M.; Piella, G.; Ribas, V.; Ballester, M.A.G. Integration of convolutional neural networks for pulmonary nodule malignancy assessment in a lung cancer classification pipeline. Comput. Methods Programs Biomed. 2020, 185. [Google Scholar] [CrossRef]
- Dolz, J.; Desrosiers, C.; Wang, L.; Yuan, J.; Shen, D.; Ayed, I.B. Deep CNN ensembles and suggestive annotations for infant brain MRI segmentation. Comput. Med Imaging Graph. 2020, 79. [Google Scholar] [CrossRef]
- Teramoto, A.; Tsukamoto, T.; Kiriyama, Y.; Fujita, H. Automated classification of lung Cancer types from cytological images using deep convolutional neural networks. BioMed Res. Int. 2017, 2017. [Google Scholar] [CrossRef]
- Trigueros, D.S.; Meng, L.; Hartnett, M. Enhancing convolutional neural networks for face recognition with occlusion maps and batch triplet loss. Image Vis. Comput. 2018, 79, 99–108. [Google Scholar] [CrossRef]
- Giménez, M.; Palanca, J.; Botti, V. Semantic-based padding in convolutional neural networks for improving the performance in natural language processing. A case of study in sentiment analysis. Neurocomputing 2020, 378, 315–323. [Google Scholar] [CrossRef]
- Suresh, S.; Mohan, S. NROI based feature learning for automated tumor stage classification of pulmonary lung nodules using deep convolutional neural networks. J. King Saud Univ. Comput. Inf. Sci. 2019. [Google Scholar] [CrossRef]
- Yunus, M.; Alsoufi, M.S. A Statistical Analysis of Joint Strength of dissimilar Aluminium Alloys Formed by Friction Stir Welding using Taguchi Design Approach, ANOVA for the Optimization of Process Parameters. IMPACT Int. J. Res. Eng.Technol. 2015, 3, 63–70. [Google Scholar]
- Canel, T.; Zeren, M.; Sınmazçelik, T. Laser parameters optimization of surface treating of Al 6082-T6 with Taguchi method. Opt. Laser Technol. 2019, 120. [Google Scholar] [CrossRef]
- Özakın, A.N.; Kaya, F. Experimental thermodynamic analysis of air-based PVT system using fins indifferent materials: Optimization of control parameters by Taguchi method and ANOVA. Sol. Energy 2020, 197, 199–211. [Google Scholar] [CrossRef]
- Özel, S.; Vural, E.; Binici, M. Optimization of the effect of thermal barrier coating (TBC) on diesel engine performance by Taguchi method. Fuel 2020, 263. [Google Scholar] [CrossRef]
- Rezania, A.; Atouei, S.A.; Rosendahl, L. Critical parameters in integration of thermoelectric generators and phase change materials by numerical and Taguchi methods. Mater. Today Energy 2020, 16. [Google Scholar] [CrossRef]
- Idris, F.N.; Nadzir, M.M.; Shukor, S.R.A. Optimization of solvent-free microwave extraction of Centella asiatica using Taguchi method. J. Environ. Chem. Eng. 2020. [Google Scholar] [CrossRef]
- Armato, S.G., III; McLennan, G.; Bidaut, L.; McNitt-Gray, M.F.; Meyer, C.R.; Reeves, A.P.; Clarke, L.P. Data from LIDC-IDRI. Cancer Imaging Arch. 2015. [Google Scholar] [CrossRef]
- Armato, S.G., III; Hadjiiski, L.; Tourassi, G.D.; Drukker, K.; Giger, M.L.; Li, F.; Redmond, G.; Farahani, K.; Kirby, J.S.; Clarke, L.P. SPIE-AAPM-NCI Lung Nodule Classification Challenge Dataset. Cancer Imaging Arch. 2015. [Google Scholar] [CrossRef]
- Eun, H.; Kim, D.; Jung, C.; Kim, C. Single-view 2D CNNs with fully automatic non-nodule categorization for false positive reduction in pulmonary nodule detection. Comput. Methods Programs Biomed. 2018, 165, 215–224. [Google Scholar] [CrossRef] [PubMed]
- Masood, A.; Sheng, B.; Li, P.; Hou, X.; Wei, X.; Qin, J.; Feng, D. Computer-Assisted Decision Support System in Pulmonary Cancer detection and stage classification on CT images. J. Biomed. Inform. 2018, 79, 117–128. [Google Scholar] [CrossRef] [PubMed]
- Nithila, E.E.; Kumar, S.S. Automatic detection of solitary pulmonary nodules using swarm intelligence optimized neural networks on CT images. Eng. Sci. Technol. Int. J. 2017, 20, 1192–1202. [Google Scholar] [CrossRef]


| Columns | Abbreviations | Factors | Level 1 | Level 2 | Level 3 |
|---|---|---|---|---|---|
| A | C1_S | conv1_Stride | 1 | 2 | |
| B | C1_P | conv1_padding | 0 | 1 | |
| C | C2_S | conv2_Stride | 1 | 2 | |
| D | C2_P | conv2_padding | 0 | 1 | |
| E | C1_KS | conv1_Kernel size | 3 | 5 | 7 |
| F | C1_F | conv1_Filter | 4 | 6 | 12 |
| G | C2_KS | conv2_Kernel size | 3 | 5 | 7 |
| H | C2_F | conv2_Filter | 8 | 16 | 32 |
| Exp. No | Factor | |||||||
|---|---|---|---|---|---|---|---|---|
| C1_S A | C1_P B | C2_S C | C2_P D | C1_KS E | C1_F F | C2_KS G | C2_F H | |
| 1 | 1 | 0 | 1 | 0 | 3 | 4 | 3 | 8 |
| 2 | 1 | 0 | 1 | 0 | 5 | 6 | 5 | 16 |
| 3 | 1 | 0 | 1 | 0 | 7 | 12 | 7 | 32 |
| 4 | 1 | 0 | 1 | 0 | 3 | 4 | 3 | 8 |
| 5 | 1 | 0 | 1 | 0 | 5 | 6 | 5 | 16 |
| 6 | 1 | 0 | 1 | 0 | 7 | 12 | 7 | 32 |
| 7 | 1 | 0 | 2 | 1 | 3 | 4 | 5 | 32 |
| 8 | 1 | 0 | 2 | 1 | 5 | 6 | 7 | 8 |
| 9 | 1 | 0 | 2 | 1 | 7 | 12 | 3 | 16 |
| 10 | 1 | 1 | 1 | 1 | 3 | 4 | 7 | 16 |
| 11 | 1 | 1 | 1 | 1 | 5 | 6 | 3 | 32 |
| 12 | 1 | 1 | 1 | 1 | 7 | 12 | 5 | 8 |
| 13 | 1 | 1 | 2 | 0 | 3 | 6 | 7 | 8 |
| 14 | 1 | 1 | 2 | 0 | 5 | 12 | 3 | 16 |
| 15 | 1 | 1 | 2 | 0 | 7 | 4 | 5 | 32 |
| 16 | 1 | 1 | 2 | 1 | 3 | 6 | 7 | 16 |
| 17 | 1 | 1 | 2 | 1 | 5 | 12 | 3 | 32 |
| 18 | 1 | 1 | 2 | 1 | 7 | 4 | 5 | 8 |
| 19 | 2 | 0 | 2 | 1 | 3 | 6 | 3 | 32 |
| 20 | 2 | 0 | 2 | 1 | 5 | 12 | 5 | 8 |
| 21 | 2 | 0 | 2 | 1 | 7 | 4 | 7 | 16 |
| 22 | 2 | 0 | 2 | 0 | 3 | 6 | 5 | 32 |
| 23 | 2 | 0 | 2 | 0 | 5 | 12 | 7 | 8 |
| 24 | 2 | 0 | 2 | 0 | 7 | 4 | 3 | 16 |
| 25 | 2 | 0 | 1 | 1 | 3 | 12 | 5 | 8 |
| 26 | 2 | 0 | 1 | 1 | 5 | 4 | 7 | 16 |
| 27 | 2 | 0 | 1 | 1 | 7 | 6 | 3 | 32 |
| 28 | 2 | 1 | 2 | 0 | 3 | 12 | 5 | 16 |
| 29 | 2 | 1 | 2 | 0 | 5 | 4 | 7 | 32 |
| 30 | 2 | 1 | 2 | 0 | 7 | 6 | 3 | 8 |
| 31 | 2 | 1 | 1 | 1 | 3 | 12 | 7 | 32 |
| 32 | 2 | 1 | 1 | 1 | 5 | 4 | 3 | 8 |
| 33 | 2 | 1 | 1 | 1 | 7 | 6 | 5 | 16 |
| 34 | 2 | 1 | 1 | 0 | 3 | 12 | 3 | 16 |
| 35 | 2 | 1 | 1 | 0 | 5 | 4 | 5 | 32 |
| 36 | 2 | 1 | 1 | 0 | 7 | 6 | 7 | 8 |
| Layer | Image Size | Kernel Size | Stride | Padding | Filter |
|---|---|---|---|---|---|
| Input | 50 × 50 × 3 | ||||
| Convolution Layer 1 | 5 × 5 | 1 | 0 | 6 | |
| Relu Layer | |||||
| MaxPooling Layer1 | 2 × 2 | 2 × 2 | |||
| Convolution Layer 2 | 5 × 5 | 1 | 0 | 16 | |
| Relu Layer | |||||
| MaxPooling Layer2 | 2 × 2 | 2 × 2 | |||
| FullyConnectedLayer | 1 × 1 | 1 | 0 | 120 | |
| FullyConnectedLayer | |||||
| SoftmaxLayer | |||||
| Classification |
| Run# | Factor | Result | |||||||||||
|---|---|---|---|---|---|---|---|---|---|---|---|---|---|
| A C1_S | B C1_P | C C2_S | D C2_P | E C1_KS | F C1_F | G C2_KS | H C2_F | Y1 (%) | Y2 (%) | Y3 (%) | Yave (%) | S/N (Y) | |
| 1 | 1 | 0 | 1 | 0 | 3 | 4 | 3 | 8 | 97.19 | 90.45 | 93.06 | 93.57 | −0.498 |
| 2 | 1 | 0 | 1 | 0 | 5 | 6 | 5 | 16 | 87.84 | 93.97 | 95.10 | 92.30 | −0.725 |
| 3 | 1 | 0 | 1 | 0 | 7 | 12 | 7 | 32 | 94.70 | 88.85 | 89.66 | 91.07 | −0.741 |
| 4 | 1 | 0 | 1 | 0 | 3 | 4 | 3 | 8 | 94.58 | 96.80 | 95.00 | 95.46 | −0.405 |
| 5 | 1 | 0 | 1 | 0 | 5 | 6 | 5 | 16 | 95.10 | 88.59 | 92.19 | 91.96 | −0.739 |
| 6 | 1 | 0 | 1 | 0 | 7 | 12 | 7 | 32 | 91.06 | 92.96 | 94.19 | 92.74 | −0.657 |
| 7 | 1 | 0 | 2 | 1 | 3 | 4 | 5 | 32 | 97.47 | 97.77 | 96.66 | 97.30 | −0.238 |
| 8 | 1 | 0 | 2 | 1 | 5 | 6 | 7 | 8 | 90.21 | 86.67 | 94.70 | 90.53 | −0.882 |
| 9 | 1 | 0 | 2 | 1 | 7 | 12 | 3 | 16 | 92.51 | 92.21 | 90.04 | 91.59 | −0.765 |
| 10 | 1 | 1 | 1 | 1 | 3 | 4 | 7 | 16 | 96.58 | 92.25 | 96.46 | 95.10 | −0.443 |
| 11 | 1 | 1 | 1 | 1 | 5 | 6 | 3 | 32 | 98.10 | 97.88 | 98.68 | 98.22 | −0.156 |
| 12 | 1 | 1 | 1 | 1 | 7 | 12 | 5 | 8 | 88.65 | 80.98 | 85.05 | 84.89 | −1.440 |
| 13 | 1 | 1 | 2 | 0 | 3 | 6 | 7 | 8 | 86.69 | 91.24 | 91.00 | 89.64 | −0.957 |
| 14 | 1 | 1 | 2 | 0 | 5 | 12 | 3 | 16 | 88.08 | 92.33 | 92.07 | 90.83 | −0.842 |
| 15 | 1 | 1 | 2 | 0 | 7 | 4 | 5 | 32 | 97.21 | 97.27 | 92.57 | 95.68 | −0.390 |
| 16 | 1 | 1 | 2 | 1 | 3 | 6 | 7 | 16 | 91.50 | 93.77 | 98.00 | 94.42 | −0.509 |
| 17 | 1 | 1 | 2 | 1 | 5 | 12 | 3 | 32 | 98.64 | 93.71 | 99.43 | 97.26 | −0.250 |
| 18 | 1 | 1 | 2 | 1 | 7 | 4 | 5 | 8 | 88.47 | 77.28 | 83.02 | 82.92 | −1.666 |
| 19 | 2 | 0 | 2 | 1 | 3 | 6 | 3 | 32 | 95.83 | 96.66 | 96.14 | 96.21 | −0.336 |
| 20 | 2 | 0 | 2 | 1 | 5 | 12 | 5 | 8 | 83.79 | 84.42 | 80.15 | 82.79 | −1.648 |
| 21 | 2 | 0 | 2 | 1 | 7 | 4 | 7 | 16 | 93.38 | 96.32 | 92.53 | 94.08 | −0.534 |
| 22 | 2 | 0 | 2 | 0 | 3 | 6 | 5 | 32 | 95.67 | 94.86 | 96.26 | 95.60 | −0.392 |
| 23 | 2 | 0 | 2 | 0 | 5 | 12 | 7 | 8 | 85.17 | 89.66 | 83.69 | 86.17 | −1.304 |
| 24 | 2 | 0 | 2 | 0 | 7 | 4 | 3 | 16 | 81.06 | 85.29 | 81.28 | 82.54 | −1.673 |
| 25 | 2 | 0 | 1 | 1 | 3 | 12 | 5 | 8 | 92.76 | 91.24 | 92.65 | 92.22 | −0.705 |
| 26 | 2 | 0 | 1 | 1 | 5 | 4 | 7 | 16 | 92.51 | 92.09 | 92.03 | 92.21 | −0.705 |
| 27 | 2 | 0 | 1 | 1 | 7 | 6 | 3 | 32 | 96.11 | 96.72 | 94.88 | 95.90 | −0.364 |
| 28 | 2 | 1 | 2 | 0 | 3 | 12 | 5 | 16 | 90.79 | 87.05 | 85.69 | 87.84 | −1.134 |
| 29 | 2 | 1 | 2 | 0 | 5 | 4 | 7 | 32 | 96.46 | 91.68 | 94.80 | 94.31 | −0.514 |
| 30 | 2 | 1 | 2 | 0 | 7 | 6 | 3 | 8 | 80.41 | 77.09 | 77.36 | 78.29 | −2.131 |
| 31 | 2 | 1 | 1 | 1 | 3 | 12 | 7 | 32 | 97.86 | 98.44 | 99.13 | 98.48 | −0.134 |
| 32 | 2 | 1 | 1 | 1 | 5 | 4 | 3 | 8 | 93.10 | 95.08 | 92.51 | 93.56 | −0.580 |
| 33 | 2 | 1 | 1 | 1 | 7 | 6 | 5 | 16 | 89.58 | 81.99 | 81.26 | 84.28 | −1.511 |
| 34 | 2 | 1 | 1 | 0 | 3 | 12 | 3 | 16 | 94.70 | 92.03 | 91.12 | 92.62 | −0.670 |
| 35 | 2 | 1 | 1 | 0 | 5 | 4 | 5 | 32 | 96.84 | 97.81 | 92.78 | 95.81 | −0.379 |
| 36 | 2 | 1 | 1 | 0 | 7 | 6 | 7 | 8 | 82.70 | 87.11 | 86.32 | 85.38 | −1.380 |
| Level | Factors | |||||||
|---|---|---|---|---|---|---|---|---|
| A C1_S | B C1_P | C C2_S | D C2_P | E C1_KS | F C1_F | G C2_KS | H C2_F | |
| 1 | −0.7002 | −0.7672 | −0.6953 | −0.9153 | −0.5467 | −0.6927 | −0.7514 | −1.199 |
| 2 | −0.8939 | −0.8381 | −0.898 | −0.7147 | −0.7258 | −0.8493 | −0.9297 | −0.8646 |
| 3 | −1.1451 | −0.8756 | −0.7365 | −0.354 | ||||
| Delta | 0.1938 | 0.0708 | 0.2028 | 0.2006 | 0.5985 | 0.1829 | 0.1933 | 0.845 |
| Rank | 5 | 8 | 3 | 4 | 2 | 7 | 6 | 1 |
| Best level | 1 | 1 | 1 | 2 | 1 | 1 | 3 | 3 |
| Optimal parameter | 1 | 0 | 1 | 1 | 3 | 4 | 7 | 32 |
| Source | Degree of Freedom (DF) | Sum of Squares (SS) | Mean Squares (MS) | Ffactor | p-Value |
|---|---|---|---|---|---|
| A (C1_S) | 1 | 0.34989 | 0.34989 | 4.46 | 0.047 |
| B (C1_P) | 1 | 0.07722 | 0.07722 | 0.98 | 0.333 |
| C (C2_S) | 1 | 0.3776 | 0.3776 | 4.81 | 0.040 |
| D (C2_P) | 1 | 0.17179 | 0.17179 | 2.19 | 0.155 |
| E (C1_KS) | 2 | 1.60437 | 0.80218 | 10.23 | 0.001 |
| F (C1_F) | 2 | 0.1853 | 0.09265 | 1.18 | 0.327 |
| G (C2_KS) | 2 | 0.27429 | 0.13714 | 1.75 | 0.20 |
| H (C2_F) | 2 | 3.3545 | 1.67725 | 21.38 | 0 |
| Error | 20 | 1.56897 | 0.07845 | ||
| Total | 32 | 8.5957 |
| Methods | Accuracy (%) | Sensitivity (%) | Specificity (%) | False Positive Rate (FPR) (%) |
|---|---|---|---|---|
| Masood et al. [22] | 86.02 | 83.91 | 89.32 | 10.68 |
| Togaçar et al. [2] | 99.51 | 99.71 | 99.71 | 0.29 |
| 2D CNN with Taguchi parametric optimization | 98.83 | 99.97 | 99.93 | 0.06 |
| Level | Factors | |||||||
|---|---|---|---|---|---|---|---|---|
| A C1_S | B C1_P | C C2_S | D C2_P | E C1_KS | F C1_F | G C2_KS | H C2_F | |
| 1 | −0.1761 | −0.45716 | −0.33985 | −0.69967 | −0.16709 | −0.30776 | −0.47113 | −0.83316 |
| 2 | −0.68205 | −0.44783 | −0.5456 | −0.24574 | −0.41333 | −0.60539 | −0.38385 | −0.44508 |
| 3 | −0.77581 | −0.44307 | −0.50125 | −0.07798 | ||||
| Delta | 0.50595 | 0.00933 | 0.20575 | 0.45393 | 0.60872 | 0.29763 | 0.1174 | 0.75518 |
| Rank | 3 | 8 | 6 | 4 | 2 | 5 | 7 | 1 |
| Best level | 1 | 2 | 1 | 2 | 1 | 1 | 2 | 3 |
| Optimal parameter | 1 | 1 | 1 | 1 | 3 | 4 | 5 | 32 |
| Source | Degree of Freedom (DF) | Sum of Squares (SS) | Mean Squares (MS) | Ffactor | p-Value |
|---|---|---|---|---|---|
| A (C1_S) | 1 | 1.90796 | 1.90796 | 8.01 | 0.01 |
| B (C1_P) | 1 | 0.00445 | 0.00445 | 0.02 | 0.893 |
| C (C2_S) | 1 | 0.37877 | 0.37877 | 1.59 | 0.222 |
| D (C2_P) | 1 | 1.13952 | 1.13952 | 4.79 | 0.041 |
| E (C1_KS) | 2 | 1.68889 | 0.84445 | 3.55 | 0.048 |
| F (C1_F) | 2 | 0.42157 | 0.21078 | 0.89 | 0.428 |
| G (C2_KS) | 2 | 0.05862 | 0.02931 | 0.12 | 0.885 |
| H (C2_F) | 2 | 2.53983 | 1.26991 | 5.33 | 0.014 |
| Error | 23 | 4.76109 | 0.23805 | ||
| Total | 35 | 12.9007 |
| Methods | Accuracy (%) | Sensitivity (%) | Specificity (%) | False Positive Rate (FPR) (%) |
|---|---|---|---|---|
| Masood et al. [22] | 84.87 | 81.22 | 82.97 | 17.03 |
| Nithila and Kumar [23] | 97.20 | 100 | 94.4 | 5.60 |
| 2D CNN with Taguchi parametric optimization | 99.97 | 99.94 | 99.94 | 0.06 |
| Original 2D CNN | 2D CNN with Taguchi Parametric Optimization | |
|---|---|---|
| conv1_Kernel size | 5 | 3 |
| conv1_Filter | 6 | 4 |
| conv1_Stride | 1 | 1 |
| conv1_padding | 0 | 0 |
| conv2_Kernel size | 5 | 7 |
| conv2_Filter | 16 | 32 |
| conv2_Stride | 1 | 1 |
| conv2_padding | 0 | 1 |
| Accuracy | 91.97% | 98.83% |
| Original 2D CNN | 2D CNN with Taguchi Parametric Optimization | |
|---|---|---|
| conv1_Kernel size | 5 | 3 |
| conv1_Filter | 6 | 4 |
| conv1_Stride | 1 | 1 |
| conv1_padding | 0 | 1 |
| conv2_Kernel size | 5 | 5 |
| conv2_Filter | 16 | 32 |
| conv2_Stride | 1 | 1 |
| conv2_padding | 0 | 1 |
| Accuracy | 94.68% | 99.97% |
© 2020 by the authors. Licensee MDPI, Basel, Switzerland. This article is an open access article distributed under the terms and conditions of the Creative Commons Attribution (CC BY) license (http://creativecommons.org/licenses/by/4.0/).
Share and Cite
Lin, C.-J.; Jeng, S.-Y.; Chen, M.-K. Using 2D CNN with Taguchi Parametric Optimization for Lung Cancer Recognition from CT Images. Appl. Sci. 2020, 10, 2591. https://doi.org/10.3390/app10072591
Lin C-J, Jeng S-Y, Chen M-K. Using 2D CNN with Taguchi Parametric Optimization for Lung Cancer Recognition from CT Images. Applied Sciences. 2020; 10(7):2591. https://doi.org/10.3390/app10072591
Chicago/Turabian StyleLin, Cheng-Jian, Shiou-Yun Jeng, and Mei-Kuei Chen. 2020. "Using 2D CNN with Taguchi Parametric Optimization for Lung Cancer Recognition from CT Images" Applied Sciences 10, no. 7: 2591. https://doi.org/10.3390/app10072591
APA StyleLin, C.-J., Jeng, S.-Y., & Chen, M.-K. (2020). Using 2D CNN with Taguchi Parametric Optimization for Lung Cancer Recognition from CT Images. Applied Sciences, 10(7), 2591. https://doi.org/10.3390/app10072591