Abstract
This article presents an analysis of the effectiveness of object detection in digital images with the application of a limited quantity of input. The possibility of using a limited set of learning data was achieved by developing a detailed scenario of the task, which strictly defined the conditions of detector operation in the considered case of a convolutional neural network. The described solution utilizes known architectures of deep neural networks in the process of learning and object detection. The article presents comparisons of results from detecting the most popular deep neural networks while maintaining a limited training set composed of a specific number of selected images from diagnostic video. The analyzed input material was recorded during an inspection flight conducted along high-voltage lines. The object detector was built for a power insulator. The main contribution of the presented papier is the evidence that a limited training set (in our case, just 60 training frames) could be used for object detection, assuming an outdoor scenario with low variability of environmental conditions. The decision of which network will generate the best result for such a limited training set is not a trivial task. Conducted research suggests that the deep neural networks will achieve different levels of effectiveness depending on the amount of training data. The most beneficial results were obtained for two convolutional neural networks: the faster region-convolutional neural network (faster R-CNN) and the region-based fully convolutional network (R-FCN). Faster R-CNN reached the highest AP (average precision) at a level of 0.8 for 60 frames. The R-FCN model gained a worse AP result; however, it can be noted that the relationship between the number of input samples and the obtained results has a significantly lower influence than in the case of other CNN models, which, in the authors’ assessment, is a desired feature in the case of a limited training set.
1. Introduction
Recently, the development of deep convolutional neural networks and their broader application in the field of digital image processing was observed [1], areas well as the development of decision-making processes automation in the power sector. The conducted research focused on individual elements of electric power infrastructure [2,3], including electric power insulators [4,5,6]. Using UAVs (unmanned aerial vehicles) as a platform for obtaining data on power transmission elements is becoming widespread. There are many challenges to overcome when automating the analysis of digital images captured by UAV vehicles. The biggest o problems are difficulties related to the number of images and resulting data labeling problems. This is usually a manual task that requires precision and accuracy to provide the learning algorithms with the most valuable input information. During the process, it is possible to filter out unnecessary, redundant, or distorted data.
This article presents research related to the elimination of the indicated problem. The analysis of the learning outcomes of selected implementations of the convolutional neural networks was performed with the use of a limited set of visual training data, recorded during the flight of a UAV vessel over electric power infrastructure objects.
The remainder of the paper is organized into the following sections: Section 2 provides a review of the video data acquisition process for the purposes of diagnostic testing of power insulators. The problem statement and the research methodologies, together with the proposed approach of insulator detection using different convolutional neural networks (CNNs), are outlined in Section 3. The results of the research and discussion are also reported. Section 4 provides a conclusion for the study. Section 5 presents a discussion of unsolved research problems.
2. Recording of Visual Data
Electric power lines are very specific objects similar to other industrial infrastructure facilities, usually covering a wide area. This requires performing periodic inspections for proper maintenance. Usually, periodical flights are made by airplanes or unmanned aerial vehicles [7], during which visual material is recorded depicting the state of individual elements of overhead high voltage lines. The continuous development of imaging methods allows image-recording at increasing resolutions with an increasingly larger number of frames per second. Obtaining desired information from the acquired visual material requires application of appropriate processing and the development of new analysis methods for the detection of specific irregularities affecting the proper functioning of the inspected object. The visual data (video, series of frames) recorded during a controlled flight, due to the vastness of electric power infrastructure and the consecutive development of imaging techniques, are currently characterized by very large volume, whereas analysis conducted by humans is expensive, inefficient in terms of time, burdened with many errors, and dependent on the perception and experience of the person making the inference based on visual material.
At the same time, human analysis is characterized by high flexibility in decision-making in unusual situations that require complex multi-criteria analysis and the need to consider many aspects from different fields. The development of artificial intelligence, in the field of robotic process automation (RPA), among others, allows for effective algorithm application in the area of visual material analysis. In terms of inspection of the state of technical infrastructure, the challenges for these types of algorithms are as follows:
- The need to use advanced methods of image processing (deep learning);
- The need to build appropriate datasets which enable the construction of models describing the essential elements of technical infrastructure;
- A high degree of complication in making decisions concerning the assessment of the state of the examined object.
3. Application of the Proposed Approach to Insulator Detection
3.1. Dataset Preparation for CNN
The quality of prediction generated by convolutional neural networks depends to a large extent on the use of an appropriate machine learning dataset [8]. The dataset built to solve a specific problem should be characterized by the following features [9,10]:
- A large number of samples;
- Balance in terms of individual classes;
- High quality of images;
- Diversity in terms of depicting the analyzed objects (position, rotation, scale, lighting, obscuration);
- Accuracy of annotations (objects marking) in images.
The quality of digital images is significant. As demonstrated in Reference [11], an increase in the current conditions for large datasets meets many challenges as follows:
- The diversity of data sources brings abundant data types and complex data structures, which increase the difficulty of data integration;
- Data volume is tremendous, and it is difficult to evaluate data quality within a reasonable amount of time;
- Data change very fast, and the “timeliness” of data is very short, which necessitates higher requirements for processing technology;
- No unified and approved data quality standards exist, and the research on the quality of large datasets only just began.
The main focus during the process of creating a training dataset for convolutional neural networks was on using as few training frames as possible. The aim was to improve the quality of the training dataset and significantly shorten the pre-processing and training time of individual neural network architectures.
3.2. Description of the Proposed Approach
The block diagram in Figure 1 shows the individual stages of the conducted research. The first stage involved an inspection flight along an electric power line with the use of an unmanned aerial vehicle and a camera recording a digital image at a resolution of 3840 × 2160. Then, the recorded video material was divided into single digital images with a specific time interval. The selected images containing the examined object or objects were pre-processed and then tagged.
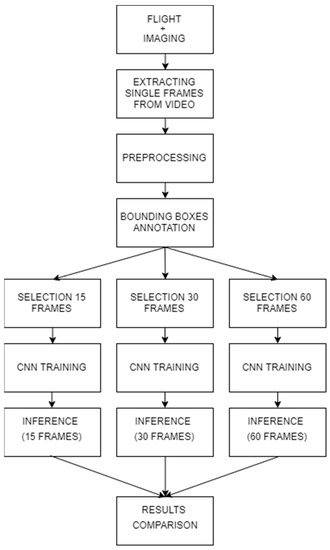
Figure 1.
Subsequent stages of the research experiment.
In the next stage, the selected images were divided into training datasets consisting of 15, 30, and 60 frames, and a test dataset consisting of 283 frames containing 2560 regions of interest (ROIs) representing a power insulator. In the in-depth study for testing of selected CNNs (the faster region-convolutional neural network (faster R-CNN) and the region-based fully convolutional network (R-FCN)), training datasets were also prepared, comprising five, 10, 20, 25, 35, 40, 45, 50, and 55 frames. A detailed description of the dataset preparation process with its sample elements is described in more detail in the next section. For each prepared dataset (15, 30, 60 frames), the process of training for the selected convolutional neural network was conducted. The inference process for an identical test dataset was performed, and, in the last stage, the obtained results were compared.
3.3. Training and Test Dataset
The training and test datasets included images taken during the flight of the UAV along the high-voltage line. For data acquisition, a GoPro Hero 4 camera was used. All the images of the training and test datasets were manually tagged, thus obtaining a prepared training dataset and a ground truth for the test set. For each image, a separate XML file was generated. The file contained coordinates (x_min, y_min, x_max, y_max) of the regions of interest (ROIs), defining the positions of objects in the scene. Figure 2 presents examples of tagged images from the flight along the high-voltage line. The whole dataset contained 343 photos. In total, 3138 ROIs containing the insulator were marked. The test dataset consisted of 283 images (2560 ROIs), and the entire training dataset contained 60 images (578 ROIs). Additionally, the training dataset was divided into smaller sets of images, i.e., five, 10, 15, 20, 25, 30, 35, 40, 45, 50, 55, and 60 frames.
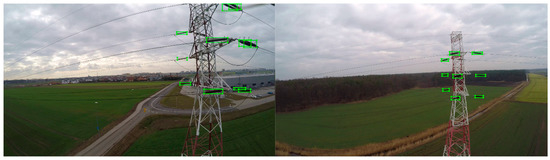
Figure 2.
Examples of tagged images recorded during the flight of an unmanned aerial vehicle (UAV) along the high-voltage line.
3.4. Applied Convolutional Neural Networks
For insulator detection, five different convolutional neural networks were selected. These CNNs are described in Table 1.

Table 1.
Description of selected convolution neural networks (CNNs).
3.5. The Analysis Results for All the Applied Convolutional Neural Networks
The operation results of the selected convolutional neural networks were evaluated based on three parameters: precision, recall, and average precision. The precision parameter shows how often the network generates an incorrect prediction. The precision parameter is described by the relationship of true positive predictions resulting from the network (correctly detected insulators) and false positives (number of wrong predictions) generated by the network. In turn, the recall parameter shows how many objects were detected from all the tagged objects. It is crucial to assess the accuracy of the prediction of the region of interest generated by the network. The IoU (intersection over union) parameter was used to assess this accuracy. The IoU parameter describes the relationship between overlap area which is the sum of the area of the region delimited by the network and tagged manually in the picture and union area which is the product of the area of the region delimited by the network and the region hand-tagged in the picture. In the analysis of network operation, the key parameter was the average precision parameter, as well as the average precision curve, on the basis of which this parameter was determined. This curve was drawn based on previously determined precision and recall parameters for each single object detection. The shape and position of the average precision (AP) curve allowed assessing the accuracy of the network operation. For example, if the AP curve is more horizontal and located higher on the y-axis, the network is more accurate, while, as it reaches further on the x-axis, the number of objects it manages to detect correctly is increased. Ideally, it should be a straight line at the level of y = 1 reaching up to the value of x = 1. On this basis, the average precision parameter was calculated. Table 2 presents the results of analyses for selected neural networks trained using 15, 30, and 60 frames of film depicting the flight along the high-voltage line. Table 2 contains values of average precision, precision, and recall parameters calculated for three different established IoU values (i.e., 0.25, 0.5, and 0.75).
Table 2.
Summary of the analyses results for all the applied convolutional neural networks. IOU—intersection over union.
As can be seen in Table 2, a change in the value of the IoU parameter had a significant impact on the analysis results. For further analysis, it was assumed that the IoU level equal to 0.5 was sufficient to conclude that the insulator was correctly identified in the image. For an IoU of 0.5, it is clear that the networks Faster R-CNN and R-FCN had by far the highest efficiency. The recall parameter was particularly important here, which had a value of as much as 0.7925 for the R-FCN/ResNet network trained on 60 frames for the IoU of 0.5. This means that, in this case, the network was able to identify almost 80% of the insulators correctly. Given that the networks Faster R-CNN and R-FCN achieved much better results than the other algorithms, they were selected for further, more detailed analyses.
3.6. The In-Depth Analysis Results for the Faster R-CNN and R-FCN Networks
The first step in the further analysis was to verify how the increase in the number of video frames used for training affected the quality of network operation. For this purpose, both networks were re-trained using five, 10, 15, 20, 25, 30, 35, 40, 45, 50, 55, and 60 frames. Figure 3 presents the average precision curves of the Faster R-CNN model for the IoU of 0.5, which demonstrate the results of the network operation on the test dataset for different numbers of frames that were involved in the training process.
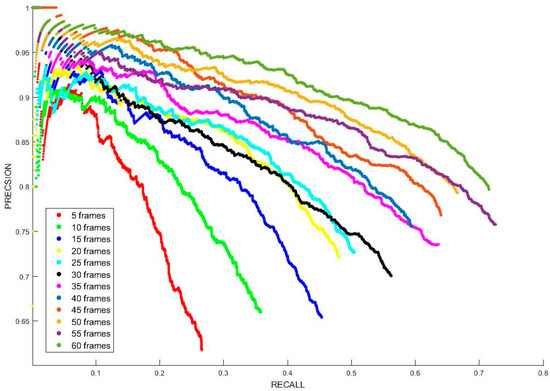
Figure 3.
Average precision curve for the Faster R-CNN model trained on 5–60 frames.
As shown in Figure 3, the number of training frames involved in the learning process had a significant impact on the detection quality of Faster R-CNN. Noticeably, the best result was obtained for the network trained on a dataset consisting of 60 training frames. It should also be noted that the networks trained with 25 and 35 frames were surprisingly good. Figure 4 presents the results obtained for the R-FCN model in similar conditions.
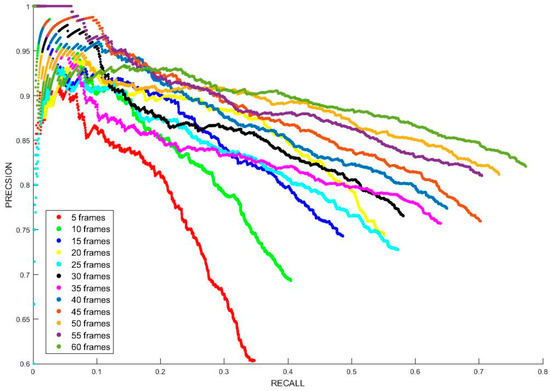
Figure 4.
Average precision curve for the R-FCN model trained on 5–60 frames.
As shown in Figure 4, the AP curves for the R-FCN model were flatter and reached further along the x-axis than those for the Faster R-CNN model. It can also be seen that the increase in the number of frames was not as crucial here as it was in the case of the Faster R-CNN model. In particular, this was visible for networks trained for more than 15 frames. The slope of AP curves did not change as significantly here either. In the final stage of the analysis, the relationship between the increase in the number of training frames and the AP parameter value was examined. The obtained results are shown in Figure 5, which also shows graphs and formulas of functions matched to the measurement data, together with calculated determination coefficients.
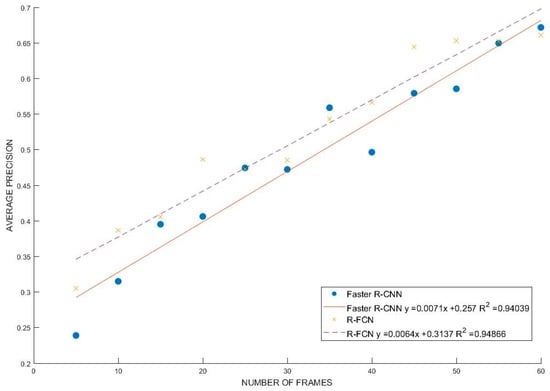
Figure 5.
Average precision values for the Faster R-CNN and R-FCN models trained on 5–60 frames depending on the number of frames. With a determined trend line and calculated coefficient of determination R2.
As showed in Figure 5, the determination coefficients R2 for both functions were at a similar level of approximately 0.94. The slope of trend lines for the R-FCN model was slightly smaller, which means that fewer training frames were needed to obtain a comparable effect to the Faster R-CNN model. To finalize the presented activities, an in-depth study was performed which was divided into two stages. In the first stage, the selected networks (Faster R-CNN and R-FCN) were trained in 20,000 steps for 15, 30, and 60 frames of the recorded material. Subsequently, an inference was made, and a set of images was obtained representing both the objects sought and the other objects that were wrongly classified. Next, manual selection of correctly classified objects was made, assuming the parameter IOU = 0.5, with which the original training sets were supplemented. Expanded training datasets prepared in this manner were used to tune the previously obtained models again in the second stage of training. The obtained results are presented in Figure 6 and Figure 7.
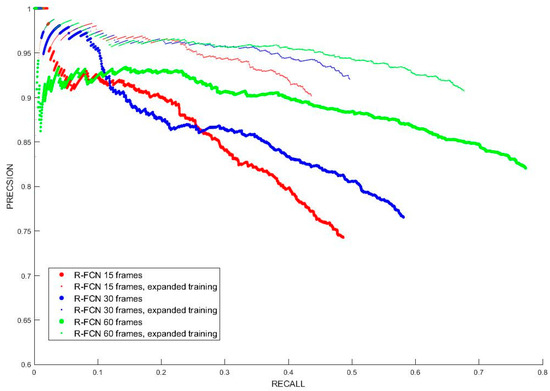
Figure 6.
The average precision curve for the R-FCN model trained on the training dataset and additionally tuned in three considered cases with 15, 30, and 60 frames.
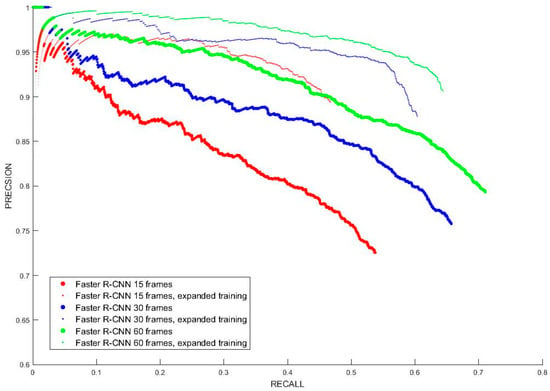
Figure 7.
The average precision curve for the Faster R-CNN model which was trained on a training dataset and additionally tuned in three considered cases with 15, 30, and 60 frames.
Figure 6 presents a comparison of average precision curves obtained for the R-FCN network additionally tuned in three considered cases with 15, 30, and 60 frames. As can be seen, the detection accuracy significantly improved; the precision parameter curves were closer to the line y = 1, but the recall parameter slightly deteriorated, as fewer insulators were found. Figure 7 presents an analogical situation to Figure 6, with the results obtained after testing the Faster R-CNN model. In this case, a significant improvement in detection accuracy can be observed, especially for 15 frames of the video, but there was also a decrease in the number of insulators found. In this case, the shape of the curves (30 and 60 frames) also changed; their end parts sloped downward. Accurately calculated parameters of average precision, precision, and recall are presented in Table 3.
Table 3.
Summary of the results of the in-depth analysis including the calculated parameters of average precision, precision, and recall for the networks Faster R-CNN and R-FCN (15, 30, and 60 frames).
Average accuracy was not a clear indicator which, for the analyzed cases 15, 30 or 60, gave better results. It is worth noting that, as a result of the in-depth study, an improvement in precision was achieved in each of the cases. For the Faster R-CNN model, the improvement was respectively 23.19%, 15.84%, and 14.27%, and, for the R-FCN model, it was 21.44%, 20.31%, and 10.50%. On the other hand, the recall parameter for the Faster R-CNN model deteriorated respectively by 13.07%, 8.14%, and 9.29%, and, for the R-FCN model, it deteriorated respectively by 10.28%, 14.52%, and 12.57%.
4. Conclusions
Creating object detectors of a particular class in digital images requires the development of an appropriate learning dataset. The application of a limited learning dataset is possible for image sequences in which there is a moderate, highly predictable variability of imaging conditions (lighting conditions, background variability, scene composition, etc.) in which the visual material is recorded. In the studied cases, a diagnostic flight along high-voltage lines in non-urbanized areas was implemented, and known deep neural network architectures such as You Only Look Once (YOLO), Single- Shot MultiBox Detector (SSD), Faster R-CNN, and R-FCN were used to develop the object detector.
This article presented the comparison results for the detection of an object of the “power insulator” class while maintaining a limited training dataset consisting of five, 10, 15, 20, 25, 30, 35, 40, 45, 50, 55, and 60 frames of visual material. The research aimed to assess the influence of the size of training dataset on the achieved efficiency for various deep neural network architectures. For the evaluation of efficiency, three IoU threshold values (at the level of 0.25, 0.5, and 0.75) were used to assess the quality of the obtained detections. The best results were reached for two networks, Faster R-CNN and R-FCN. Faster R-CNN received the highest AP at the level of 0.8 for 60 training frames. During the study, it was demonstrated that the number of training data directly translated into the results obtained by the trained detector. The R-FCN model got a poorer AP result; however, it can be observed that the relationship between the number of input samples and the obtained results had a much smaller impact than in the case of the other networks, which, in the authors’ opinion, is a desirable feature in the case of a limited input dataset.
The main contribution of the work is the evidence that a limited training set (in our case, just 60 training frames) could be used for object detection, assuming an outdoor scenario with well-defined conditions. The decision of which network will generate the best result for such a limited training set is not a trivial task. In contrast to a previous study carried out [24], in our case, the Faster R-CNN network obtained a better AP result for the same limited training sample, which suggests that deep neural networks will achieve different levels of effectiveness depending on the amount of training data. As part of the in-depth study, additional network tuning was conducted, considering the results gained after the first stage of training. For the two analyzed networks (Faster R-CNN and R-FCN), in each of the three cases (15, 30, and 60 frames), the precision parameter improved while the recall parameter deteriorated.
5. Discussion
In this article, the authors presented a study of the effectiveness of power insulator detection in digital images with the application of a limited training dataset. However, the detection efficiency is also affected by other problems such as the following:
- Flat and limited (unidirectional) views of objects. For aerial photographs taken perpendicular to the ground, objects of interest are relatively small and have fewer elements, mainly in flat and rectangular form. They usually include shots from above, omitting many important features of those objects in other planes.
- Large sizes of digital images. Currently, aerial imaging provides visual material at very high resolutions, which allows capturing increasingly more details, but at the same time introduces problems related to the use of sufficient computing power necessary to process them. These problems are eliminated by applying various methods of pre-processing for aerial photography. However, their proper selection requires a lot of research to determine the effectiveness of various solutions dedicated to specific technical problems.
- Overlapping objects. Objects may be occluded by other objects of the same type, which causes, e.g., inaccuracies when labeling data.
- Replication of the same objects in different digital images. The same object can occur in two separate images, which can lead to double detection and errors when recognizing objects in images.
Directions for further research include the verification of the results obtained in limited datasets captured during other inspection flights and effectiveness analysis for other methods of detecting objects in digital images. It is also appropriate to examine the influence of augmentation of images used in the process of training a convolutional network on detection efficiency.
Author Contributions
Conceptualization, M.T.; methodology, M.T. and P.M.; resources, J.O.; software, P.M. and J.O.; supervision, M.T.; validation, P.M.; visualization, J.O. All authors have read and agreed to the published version of the manuscript.
Funding
This research received no external funding.
Conflicts of Interest
The authors declare no conflicts of interest.
References
- Michalski, P.; Ruszczak, B.; Tomaszewski, M. Convolutional Neural Networks Implementations for Computer Vision. In Biomedical Engineering and Neuroscience, Advances in Intelligent Systems and Computing Book Series AISC; Springer: Cham, Switzerland, 2018; Volume 720, pp. 98–110. [Google Scholar] [CrossRef]
- Michalski, P.; Ruszczak, B.; Lorente, P.J.N. The Implementation of a Convolutional Neural Network for the Detection of the Transmission Towers Using Satellite Imagery. In Information Systems Architecture and Technology: Proceedings of 40th Anniversary International Conference on Information Systems Architecture and Technology–ISAT 2019; Springer International Publishing: Cham, Switzerland, 2020. [Google Scholar] [CrossRef]
- Pierdicca, R.; Malinverni, E.S.; Piccinini, F.; Paolanti, M.; Felicetti, A.; Zingaretti, P. Deep convolutional neural network for automatic detection of damaged photovoltaic cells. Int. Arch. Photogramm. Remote Sens. Spat. Inf. Sci. 2018, 42, 893–900. [Google Scholar] [CrossRef]
- Zhang, S.; Zhang, S.; Wang, B.; Habetler, T.G. Deep Learning Algorithms for Bearing Fault Diagnostics—A Comprehensive Review. IEEE Access 2019, 8, 29857–29881. [Google Scholar] [CrossRef]
- Gasz, R.; Ruszczak, B.; Tomaszewski, M.; Zator, S. The Registration of Digital Images for the Truss Towers Diagnostics. In Information Systems Architecture and Technology: Proceedings of 39th International Conference on Information Systems Architecture and Technology–ISAT 2018; Advances in Intelligent Systems and Computing, (AISC, Volume 852); Borzemski, L., Świątek, J., Wilimowska, Z., Eds.; Springer: Cham, Switzerland, 2019. [Google Scholar] [CrossRef]
- Tomaszewski, M.; Ruszczak, B.; Michalski, P.; Zator, S. Detection of Power Line Insulators on Digital Images with the Use of Laser Spots. IET Image Process. 2019, 13, 2358–2366. [Google Scholar] [CrossRef]
- Yan, K.; Huang, S.; Song, Y.; Liu, W.; Fan, N. Insulator recognition based on convolution neural network. In Proceedings of the Chinese Control Conference CCC, Dalian, China, 26–28 July 2017; pp. 4077–4081. [Google Scholar]
- Zhao, Z.; Zhen, Z.; Zhang, L.; Qi, Y.; Kong, Y.; Zhang, K. Insulator Detection Method in Inspection Image Based on Improved Faster R-CNN. Energies 2019, 12, 1204. [Google Scholar] [CrossRef]
- Tomaszewski, M.; Osuchowski, J.; Debita, Ł. Effect of Spatial Filtering on Object Detection with the SUF Algorithm. In Proceedings of the International Scientific Conference BCI 2018 Opole, Opole, Poland, 13–14 March 2018; Springer: Cham, Swizerlands, 2018; pp. 121–140. [Google Scholar]
- Siddiqui, Z.A.; Park, U.; Lee, S.W.; Jung, N.J.; Choi, M.; Lim, C.; Seo, J.H. Robust Powerline Equipment Inspection System Based on a Convolutional Neural Network. Sensors (Basel) 2018, 18, 3837. [Google Scholar] [CrossRef] [PubMed]
- Shakhatreh, H.; Sawalmeh, A.; Al-Fuqaha, A.; Dou, Z.; Almaita, E.; Khalil, I.; Othman, S.; Khreishah, A.; Guizani, M. Unmanned Aerial Vehicles: A Survey on CivilApplications and Key Research Challenges. Available online: https://arxiv.org/abs/1805.00881 (accessed on 2 February 2020).
- Gu, J.; Wang, Z.; Kuen, J.; Ma, L.; Shahroudy, A.; Shuai, B.; Liu, T.; Wang, X.; Wang, G.; Cai, J.; et al. Recent advances in convolutional neural networks. Pattern Recognit. 2018, 77, 354–377. [Google Scholar] [CrossRef]
- Wang, Z.; Oates, T. Encoding time series as images for visual inspection and classification using tiled convolutional neural networks. In Proceedings of the Workshops at the Twenty-Ninth AAAI Conference on Artificial Intelligence, Austin, TX, USA, 25–30 January 2015. [Google Scholar]
- Simonyan, K.; Zisserman, A. Very deep convolutional networks for large-scale image recognition. arXiv 2015, arXiv:1409.1556. arXiv.org e-Print archive. Available online: https://arxiv.org/abs/1409.1556 (accessed on 3 February 2020).
- Everingham, M.; Eslami, S.A.; Van Gool, L.; Williams, C.K.; Winn, J.; Zisserman, A. The pascal visual object classes challenge: A retrospective. Int. J. Confl. Violence (IJCV) 2015, 111, 98–136. [Google Scholar] [CrossRef]
- Redmon, J.; Divvala, S.; Girshick, R.; Farhadi, A. You Only Look Once: Unified, Real-Time Object Detection. In Proceedings of the 2016 IEEE Conference on Computer Vision and Pattern Recognition (CVPR), Las Vegas, NV, USA, 27–30 June 2016. [Google Scholar]
- Cai, L.; Zhu, Y. The Challenges of Data Quality and Data Quality Assessment in the Big Data Era. Data Sci. J. 2015, 14, 2. [Google Scholar] [CrossRef]
- Ren, S.; He, K.; Girshick, R.; Sun, J. Faster R-CNN: Towards Real-Time Object Detection with Region Proposal Networks. In Proceedings of the IEEE Transactions on Pattern Analysis and Machine Intelligence; IEEE: Piscataway, NJ, USA, 2016; Volume 39, pp. 1137–1149. [Google Scholar]
- Girshick, R.; Donahue, J.; Darrell, T.; Malik, J. Rich feature hierarchies for accurate object detection and semantic segmentation. In Proceedings of the IEEE Computer Society Conference on Computer Vision and Pattern Recognition; IEEE: Piscataway, NJ, USA, 2014; pp. 580–587. [Google Scholar]
- Girshick, R. Fast R-CNN. In Proceedings of the IEEE International Conference on Computer Vision, Santiago, Chile, 7–13 December 2015; IEEE: Piscataway, NJ, USA, 2015; Volume 2015, pp. 1440–1448. [Google Scholar]
- Szegedy, C.; Vanhoucke, V.; Ioffe, S.; Shlens, J.; Wojna, Z. Rethinking the Inception Architecture for Computer Vision. In Proceedings of the 2016 IEEE Conference on Computer Vision and Pattern Recognition (CVPR), Las Vegas, NV, USA, 27–30 June 2016; pp. 2818–2826. [Google Scholar]
- Liu, W.; Anguelov, D.; Erhan, D.; Szegedy, C.; Reed, S.; Fu, C.; Berg, A.C. SSD: Single Shot Multibox Detector, Lecture Notes in Computer Science (Including Subseries Lecture Notes in Artificial Intelligence and Lecture Notes in Bioinformatics). In Proceedings of the Computer Vision – ECCV 2016: 14th European Conference, Amsterdam, The Netherlands, 11–14 October 2016. [Google Scholar]
- Sandler, M.; Howard, A.; Zhu, M.; Zhmoginov, A.; Chen, L.C. MobileNetV2: Inverted Residuals and Linear Bottlenecks. In Proceedings of the IEEE Computer Society Conference on Computer Vision and Pattern Recognition, Salt Lake City, UT, USA, 18–23 June 2018; IEEE: Piscataway, NJ, USA, 2018; pp. 4510–4520. [Google Scholar]
- Redmon, J.; Farhadi, A. YOLOv3: An Incremental Improvement, 2018. arXiv 2018, arXiv:1804.02767. Available online: https://arxiv.org/abs/1804.02767 (accessed on 3 February 2020).
- Dai, J.; Li, Y.; He, K.; Sun, J. R-FCN: Object Detection via Region-based Fully Convolutional Networks. In Proceedings of the Advances in Neural Information Processing Systems 29: Annual Conference on Neural Information Processing Systems 2016, Barcelona, Spain, 5–10 December 2016. [Google Scholar]
© 2020 by the authors. Licensee MDPI, Basel, Switzerland. This article is an open access article distributed under the terms and conditions of the Creative Commons Attribution (CC BY) license (http://creativecommons.org/licenses/by/4.0/).