Abstract
This study aims to evaluate the fitness, surface microhardness, and trueness of crowns fabricated from three types of dental ceramic blocks (HASS Rosetta, IPS e.max CAD, and VITA Suprinity) and analyze the correlations between them. A crown was first designed in computer-aided design (CAD) software. To create a crown designed model (CDM), the design file was extracted from the CAD software, and a lithium disilicate block was processed from the file with a milling machine. To create a crown scanned model (CSM), the inside of the fabricated crown was digitized using a contact scanner. Using three-dimensional (3D) inspection software (Geomagic Control X; 3D Systems), the CDM and CSM were then superimposed, and their 3D trueness was analyzed. To measure the surface microhardness of the blocks, the specimens were polished and subjected to the Vickers hardness test. The fitness of the fabricated crowns was evaluated by applying a modified silicone replica technique. Pearson correlation analysis was performed to assess the correlations between trueness, surface microhardness, and fitness. In addition, the significance of differences between the three types of dental ceramic blocks was analyzed using one-way analysis of variance (ANOVA). Significant differences in the trueness, surface microhardness, and marginal fit were observed between ceramic blocks of different types. There were also positive correlations between trueness, surface microhardness, marginal fit, and internal fit. While the marginal fit of crowns fabricated from each of the three types of ceramic blocks was in the clinically permitted range (<120 µm), there were differences in the trueness and surface microhardness, depending on the type of block. However, crowns fabricated from each of the three materials have surface microhardness that is clinically applicable.
1. Introduction
The introduction of intraoral scanners and their combination with dental computer-aided design and computer-aided manufacturing (CAD/CAM) systems has enabled the chairside production of prostheses [1,2,3,4]. As such CAD/CAM systems do not require a working model to be fabricated, prostheses are produced rapidly, which reduces the patient treatment time [1,2,3]. Lithium disilicate ceramics are widely used for dental prostheses because they are aesthetic materials with a short sintering time [4,5]. Four-axial milling units are also preferred to minimize patient treatment time [4,5,6,7,8]. Crowns fabricated from lithium disilicate materials have shown a high survival rate [6]. However, lithium disilicate materials are reported to have low strength under occlusal forces [5,6,7]. Therefore, zirconia is used to reinforce lithium disilicate materials [8]. However, studies comparing zirconia-reinforced lithium silicate glass ceramics with zirconia-free lithium silicate glass ceramics are lacking.
When using dental CAD/CAM systems, it is important to evaluate the consistency between the designed crown and the fabricated crown [4,5,9,10]. Low consistency may affect the marginal and internal fit of a prosthesis [4,9,10]. Trueness indicates the similarity of the prosthesis designed first in CAD software (CAD reference model) with the fabricated prosthesis (CAD test model) [4,9,10]. A prosthesis exhibiting excellent trueness may offer the advantage of time for the patient to adjust to the prothesis [4,10]. The trueness of the fabricated crown may differ depending on the type of lithium disilicate block used due to the differences in processability [10]. However, few studies have investigated the correlation between the surface microhardness of the ceramic material and the trueness of the resulting crown.
The marginal and internal fit of a fixed prosthesis are important predictors of successful prosthetic treatment [4,11,12,13,14]. An excellent marginal fit allows the maintenance of a healthy periodontal status and prevents the dissolution of resin cement [11,12,14]. An excellent internal fit increases the dropout resistance of the prosthesis [11,14]. Therefore, many studies have focused on the marginal and internal fit parameters that affect prostheses prognosis [4,5,11,12,13,14]. Currently, fixed prostheses produced with dental CAD/CAM systems have reported marginal fit values that are typically less than 100 µm, and marginal gap values below 100–120 µm have been reported to be clinically permissible in most studies [11,14,15].
Although there are various methods of evaluating the marginal and internal fit, the silicone replica technique is recommended as a reliable method [5,14]. This method involves injecting silicone to measure the rim and inner space of the prostheses by replication [5,14]. The thickness of silicone replicas can also be measured by optical scanning [16].
Many previous studies have evaluated the marginal and internal fit of the crowns fabricated from lithium disilicate materials and verified their stability [5,6,11,15]. In addition, long-term clinical studies with these crowns have yielded promising results [6]. However, there is insufficient evidence regarding the correlation between the trueness of the crowns and their marginal and internal fit.
This study aims to evaluate the fitness, surface microhardness, and trueness of crowns fabricated from three types of dental ceramic blocks and to analyze the correlations between them. The first null hypothesis is that there is no difference between the fitness, surface microhardness, and trueness of crowns and the type of dental ceramic block used for fabrication. The second null hypothesis is that there is no correlation between fitness, surface microhardness, and trueness.
2. Materials and Methods
This study was performed as shown in Figure 1. First, to measure the trueness of the crowns, a crown designed model (CDM) was created using CAD software, and the crowns were fabricated using a milling unit. To obtain a crown scanned model (CSM), the inside of a crown was digitalized using a contact scanner. The CDM and CSM were superimposed using testing software, and 3D analysis was performed (Figure 1). The marginal and internal fit were also evaluated using a modified silicone replica technique (Figure 1). To measure the surface microhardness, specimens were polished and subjected to the Vickers hardness test (Figure 1).
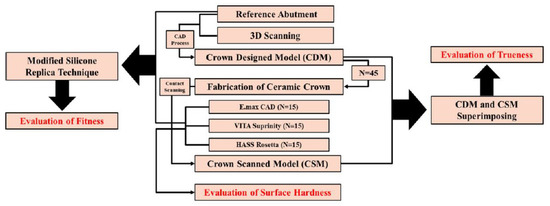
Figure 1.
Experimental design.
A pilot experimental procedure was conducted five times using power analysis software (G*Power v3.1.9.2, Heinrich-Heine-Universität, Düsseldorf, Germany) to determine the appropriate sample size, which was calculated to be 20 (actual power = 97.8%; power = 97.8%; α = 0.05). This finding indicated that the proposed study required a minimum of 20 subjects to ensure a power > 97.8%. The actual power achieved with N = 20 (97.8%) was slightly higher than the requested power. The production and evaluation of the specimens were conducted by a single skilled investigator (K.S for consistency [17,18].
2.1. Sample Preparation
For the main digitized model, single crowns were designed and retrieved in CAD software (EZIS VR, DDS, Seoul, Korea). The crowns were designed to default values (cement space: 80 µm). The designed virtual crowns were extracted as stereolithography (STL) files to be used as reference data for the evaluation of trueness.
Each STL file was transferred to the milling unit (EZIS HM, DDS, Seoul, Korea) for production. EZIS HM is a chairside four-axial milling unit, and according to the manufacturer, it has a processing accuracy of ±1 µm and a maximum spindle speed of 63,000 rpm; the milling time was 15 min/unit [5]. To fabricate more precise prostheses, the milling unit was calibrated by the manufacturer. Three types of lithium disilicate blocks (HASS Rosetta, IPS e.max CAD, and VITA Suprinity) were used (Table 1). To fabricate each crown, the lithium disilicate blocks were milled using a milling unit. The pilot test for crown processing was performed five times using a single bur instrument (Step Bur 12 and Cylinder Pointed Bur 12 s, Dentsply Sirona, York, PA, USA), and the text crowns exhibited no difference in trueness (p = 0.162). Therefore, the bur was replaced after five crowns were processed with the bur instrument.

Table 1.
Datasheet of lithium disilicate block testing.
2.2. Trueness
Residue was removed from each fabricated crown using an ultrasound cleaner for five minutes in distilled water. After drying, each crown was connected to a stationary jig, and the inside was scanned using a contact scanner (DS10, Renishaw, Gloucestershire, UK) (Figure 2A,B). For precision scanning, the scanner was calibrated before each use. Each scan (virtual crown) was extracted as an STL file to be used as test data for the evaluation of trueness (Figure 2C).
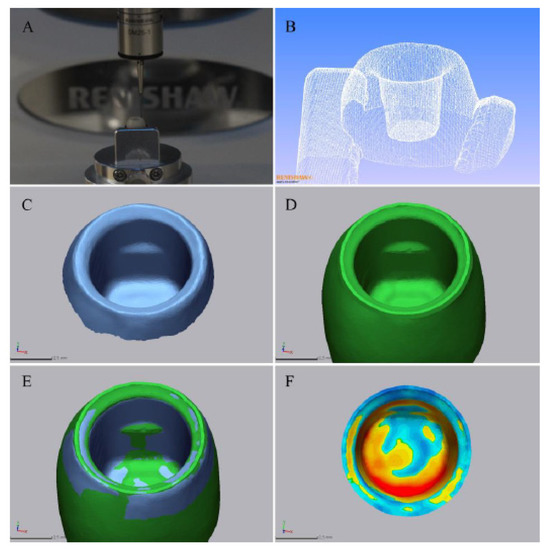
Figure 2.
Procedure for evaluating trueness. (A) The contact scanning procedure. (B) A 3D modeling result of contact scanning. (C) A crown scanned model (CSM). (D) A crown designed model (CDM). (E) A CSM and CDM superimposed. (F) A color difference map.
The 3D inspection software (Geomagic Control X v2018.0.0, 3D Systems Inc., Rock Hill, SC, USA) recommended by ISO-12836 was used in this study. To retrieve the CDM file from the 3D inspection software and perform a 3D comparison, only the inside area of the crown was segmented, using the margin as a boundary (Figure 2D). After the CDM file was prepared, the CSM file was retrieved, and the initial alignment was conducted. The inner region of the segmented crowns was designated, and the two files were superimposed in the point cloud by best fit alignment (Figure 2E). The sampling rate was specified as 100%.
The dimensional differences between the CDM and CSM files were calculated for all data points in the segmented inner region. Each data point consists of three coordinate values (X, Y, Z), and the distance between each corresponding data point in the CDM and CSM files was calculated as a trueness value. The root mean square (RMS) was then calculated using the following formula [10]:
For all data points, is the position of the measurement point i in the reference scan data; is the position of the measurement point i in the evaluation scan data; and n refers to the number of data points measured in each analysis.
The RMS value indicates the degree of deviation in the scan data. A low RMS value indicates a good 3D agreement of the superimposed data. Each 3D comparison is shown as a color difference map, having a range of ±100 µm (20 color segments) and an allowable tolerance range (green) of ±10 µm (Figure 2F). The red zone (10 µm to 100 µm) indicates that the CSM data are located above the CDM data, implying that the milling failed to reach the target position. The blue zone (−10 µm to −100 µm) indicates that the CSM data are located below the CDM data, implying that the milling exceeded the target position. The green zone (±10 µm) corresponds to areas that were milled precisely. A high RMS value indicates poor 3D agreement of the superimposed data; visually, this results in larger areas of red and blue in the color difference map. Relative comparisons of the extent of the red and blue areas in the color difference maps for samples with high RMS values and the trend of these results were evaluated as in previous studies [4,5,7,8,9,10].
2.3. Surface Microhardness
After crowns were fabricated, 20 specimens were prepared from each type of ceramic block and polished with SiC paper (Allied High Tech Products, Rancho Domingues, CA, USA) and diamond paste (Allied High Tech Products, Rancho Domingues, CA, USA) under a load of 100 g and wheel speed of 100 rpm. The surface microhardness was measured using a microhardness tester (HMV-2, S Shimadzu, Tokyo, Japan) following the ASTM C1327-03 Standard [10]. Vickers indentations per specimen were introduced using a diamond indenter and a load of 9.8 N for 20 s. Vickers hardness was calculated as follows [19]:
where H is hardness (GPa); P is the load applied (kg); and d is the mean diagonal length of the indentation (mm).
2.4. Marginal and Internal Fit
The marginal and internal fit of the ceramic crowns were evaluated as shown in Figure 3. The marginal and internal fit can be assessed by measuring the thickness of the replicated silicone material between the crown and the abutment [4,14]. A silicone-based indicator paste (Fit Checker, GC, Leuven, Belgium) was used to fill the inside of a crown, which was then carefully seated on the abutment teeth. After checking to see whether the crown was positioned accurately, it was loaded with finger pressure. As the thickness of the silicone material may vary with different pressures, the 60 crown specimens were loaded using the following procedure: gauze was placed on a ceramic crown specimen and positioned so that a binder clip held the occlusal surface and the bottom of the model. After the silicone was completely polymerized, the crown was carefully removed so that the silicone material would not fall onto the abutment teeth. Using a desktop optical scanner (E1, 3Shape, Denmark), scans were taken of the abutment teeth with and without silicone material (Figure 3A,B, respectively). The STL files of the CDM and CSM were retrieved from the 3D inspection software (Geomagic Control X) (Figure 3C,D), and the initial alignment and best-fit alignment were superimposed (Figure 3E). After checking whether the files were accurately superimposed, virtual planes were established, as shown in Figure 3F. The same virtual plane coordinates were used for each corresponding specimen, and the fitness was measured. The fitness was measured in the margin, chamfer, axial, angle, and occlusal areas of the virtual planes (Figure 3F). The thickness of the replicated silicone material was measured by the 3D inspection software (Figure 3F).
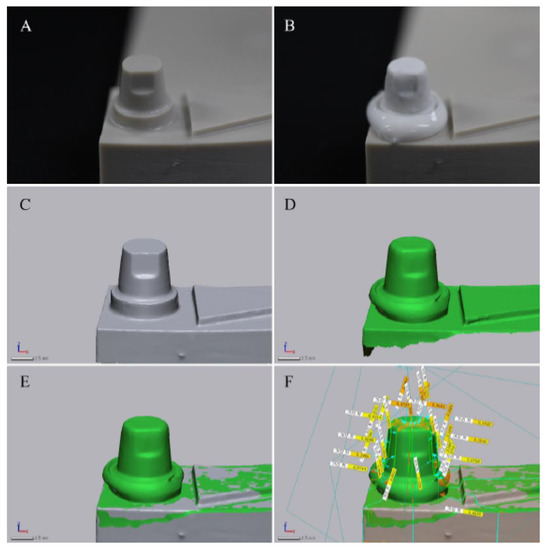
Figure 3.
Procedure for measuring marginal and internal fit. (A) A fabricated model without silicone material. (B) A fabricated model with silicone material. (C) A scanned model without silicone material. (D) A scanned model with silicone material. (E) Superimposition of (B,D). (F) Marginal and internal fit measurements on virtual planes by measuring the thickness of the replicated silicone material.
2.5. Statistical Analysis
Data were analyzed using SPSS statistical software (release 25.0, IBM, Chicago, IL, USA), and α = 0.05 was considered significant. The normal distribution of the data was investigated using the Shapiro–Wilk test, which demonstrated that the data formed a normal distribution. The equality of the dispersion was evaluated using the Levene test, and the differences between groups were analyzed using one-way ANOVA, and Tukey’s honestly significant difference test was used as a post hoc test. Statistically significant differences between experimental groups (p < 0.05) are indicated by different capital letters; groups with the same capital letter are not statistically different (p ≥ 0.05).
Pearson correlation analysis was used to analyze correlations between trueness, surface microhardness, and fitness. According to previous studies, correlations can be categorized according to the magnitude of the pearson correlation coefficient (PCC). Correlations between variables can be described as perfect (PCC = −1 or 1), strong (PCC = −0.7 to −0.9 or 0.7 to 0.9), moderate (PCC = −0.4 to −0.6 or 0.4 to 0.6), or weak (PCC = −0.1 to −0.3 or 0.1 to 0.3) [20].
3. Results
3.1. Trueness
The trueness values measured for the crowns fabricated with the three ceramic materials are shown in Table 2. The first null hypothesis was rejected for trueness (p < 0.001) because the trueness values varied according to the ceramic material. Crowns fabricated with HASS Rosetta had the lowest trueness value (26.5 ± 2.5 µm), which was significantly different from the crowns fabricated with IPS e.max (33 ± 8.8 µm) or VITA Suprinity (38.4 ± 5.4 µm) (p < 0.05); however, trueness values were not significantly different between crowns fabricated with IPS e.max CAD and VITA Suprinity (p ≥ 0.05).
Table 2.
Comparison of the trueness according to the type of lithium disilicate block.
Comparisons of trueness using color difference maps (Figure 4) showed the same trend as the data in Table 2. Crowns fabricated with HASS Rosetta had the smallest area of blue and red, while the extent of blue and red in the color difference maps from crowns fabricated with IPS e.max CAD and VITA Suprinity were similar to each other, but greater than that of HASS Rosetta (Figure 4).
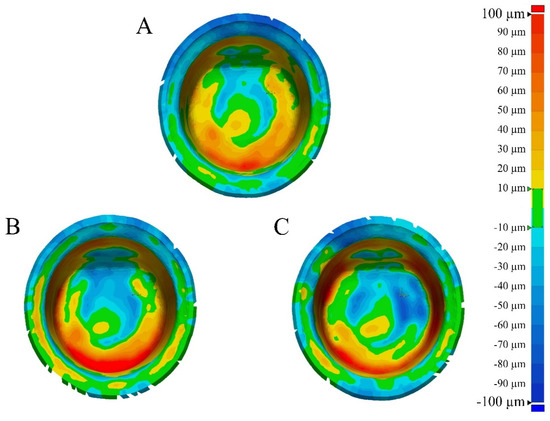
Figure 4.
Comparison of the color difference map according to the lithium disilicate block. (A) HASS Rosetta. (B) IPS e.max CAD. (C) VITA Suprinity.
3.2. Surface Microhardness
The results of the microhardness test are shown in Table 3. The first null hypothesis was rejected for surface microhardness (p < 0.001) because the surface microhardness values varied according to the ceramic material. Crowns fabricated with HASS Rosetta showed the lowest surface microhardness (5.29 ± 0.13 GPa), which was significantly different to the crowns fabricated with IPS e.max CAD (5.8 ± 0.21 GPa) or VITA Suprinity (5.94 ± 0.32 GPa) (p < 0.05); however, the surface microhardness values were not significantly different between the crowns fabricated with IPS e.max CAD and VITA Suprinity (p ≥ 0.05).
Table 3.
Comparison of the surface microhardness according to the type of lithium disilicate block.
3.3. Marginal and Internal Fit
The marginal and internal fit of the ceramic crowns determined by measuring the replicated silicone material thickness are shown in Table 4 and Table 5. Crowns fabricated with HASS Rosetta showed the lowest marginal fit (68.8 ± 8.1 µm), which was significantly different to crowns fabricated with VITA Suprinity (98.6 ± 26.2 µm) (p < 0.05), but not IPS e.max CAD (80.1 ± 27.2 µm) (p > 0.05); however, marginal fit values between the crowns fabricated from IPS e.max CAD and VITA Suprinity were not significantly different (p > 0.05). No significant differences in internal fit were observed between crowns fabricated from any of the three ceramic materials (p = 0.14), so the null hypothesis was not rejected for internal fit; however, the null hypothesis was rejected for marginal fit (p = 0.003).
Table 4.
Comparison of the marginal fit according to the type of lithium disilicate block.
Table 5.
Comparison of the internal fit according to the type of lithium disilicate block.
3.4. Correlation Analysis
The results of the Pearson correlation analysis are shown in Table 6. In descending order of positive pearson correlation coefficient (PCC) value, strong correlations were found between trueness and surface microhardness (0.845), trueness and marginal fit (0.844), trueness and internal fit (0.822), surface microhardness and marginal fit (0.828), and surface microhardness and internal fit (0.764).
Table 6.
Pearson correlation coefficient (PCC) values for trueness, surface microhardness, marginal fit, and internal fit.
4. Discussion
In this study, crowns fabricated with three types of ceramic blocks (HASS Rosetta, IPS e.max CAD, and VITA Suprinity) showed significant differences in the presented evaluations (trueness, surface microhardness, and marginal fit) (Table 2, Table 3, Table 4 and Table 5). In addition, the trueness, surface microhardness, and marginal and internal fit showed strong positive correlations (p < 0.001) (Table 6). Therefore, the two null hypotheses of this study were rejected according to the results, and the following conclusions can be drawn: the ceramic block material affects the marginal fit, surface microhardness, and trueness of the prostheses, and poor trueness and surface microhardness adversely affect the marginal and internal fit.
A previous study also observed differences in trueness values according to the three types of ceramic blocks [10], and its findings agreed with those of this study: There was a significant difference in trueness according to the ceramic block material [10]. However, investigations of the correlation between trueness and hardness and their further impact on the marginal and internal fit are lacking. The findings of this study showed that poor trueness and hardness of a ceramic block material could adversely affect the marginal and internal fit of the prostheses.
This study suggests that although low trueness and hardness values may result in excellent marginal and internal fit, the clinical environment should be considered. A low value of hardness for a ceramic may indicate that the material is inappropriate for use in the oral cavity [19,21] due to the possibility of fracture as a result of high occlusal loads [19]. A high hardness value means that the ceramic material can bear high occlusal loads [19]; however, a ceramic crown with a high hardness value may cause abrasion of the antagonist [19]. Moreover, as observed in this study, high hardness values may adversely affect the marginal and internal fit. Thus, a ceramic crown must have a clinically acceptable hardness value that is not too high or too low and that provides excellent marginal and internal fit.
Previous studies showed that the crowns fabricated with CAD/CAM systems had small marginal fit values of <100 µm [11]. The long-term stability of a fixed prosthesis with a marginal fit value of >120 µm may be affected due to periodontitis, cement dissolution, and secondary caries [11,14]. Therefore, there is a consensus that marginal fit values less than 100–120 µm are clinically permissible for fixed prostheses [11,14]. The marginal fit values of crowns fabricated for this study were <100 µm and were in the clinically permissible range for all three types of ceramic blocks. Although the three types of ceramic blocks showed differences in surface microhardness values, all were considered to be appropriate for clinical use in terms of their marginal fit.
This study had several limitations. First, only three types of ceramic blocks were evaluated. New ceramic materials have been developed recently, and it will be necessary to evaluate prostheses fabricated with such products in the future. Second, this study used a four-axial milling unit, which is the type most widely used in chairside CAD/CAM. As previous findings showed that trueness evaluations might vary depending on the number of axes [7,22,23], it is necessary to compare these findings with a five-axial milling unit. Finally, the trueness of the outer surface of the crown was not evaluated because regions with an undercut and narrow, deep shape such as the outer shape of the crown could not be scanned using a touch-probe scanner. However, additional studies should be undertaken to analyze the trueness of the outer surface.
5. Conclusions
The type of ceramic block affected the trueness, surface microhardness, and marginal fit of the fabricated prosthesis. Ceramic blocks with high surface microhardness values may yield fabricated crowns with poor trueness. Poor trueness may adversely affect the marginal and internal fit. To fabricate a crown with an excellent marginal and internal fit, the ceramic block must have low surface microhardness; however, additional studies are needed to evaluate the optimum surface microhardness considering clinical conditions such as occlusal load. Although the marginal fit values of crowns fabricated with the different types of ceramic blocks (HASS Rosetta, IPS e.max CAD, and VITA Suprinity) were within the clinically permitted limit (<120 µm), there were differences in the surface microhardness, depending on the type of block. However, all three types were found to have surface microhardness values that are clinically applicable.
Author Contributions
Conceptualization, K.S.; Methodology, K.L.; Validation, K.-b.L.; Formal Analysis, K.S.; Investigation, K.S.; Data Curation, K.L.; Writing—Original Draft, K.L. and K.S.; Visualization, K.S.; Supervision, K.-b.L.; Project Administration, K.-b.L. All authors have read and agreed to the published version of the manuscript.
Funding
This work was supported by the Technology Innovation Program (or Industrial Strategic Technology Development Program) (10077743, The development of the handpiece design for the air turbine and root canal treatment) funded by the Ministry of Trade, Industry & Energy (MOTIE, Korea); the Industrial Strategic Technology Development Program (10062635, New hybrid milling machine with a resolution of less than 10 µm development, using open CAD/CAM S/W integrated platforms for one-day prosthetic treatment of 3D smart medical care system) funded by the Ministry of Trade, Industry & Energy (MOTIE, Korea); and the Korea Institute for Advancement of Technology (KIAT) through the National Innovation Cluster R&D program (P0006691).
Acknowledgments
The authors thank the researchers of the Advanced Dental Device Development Institute, Kyungpook National University for their time and contributions to the study.
Conflicts of Interest
The authors declare no conflicts of interest. The funders had no role in the design of the study; in the collection, analyses, or interpretation of the data; in the writing of the manuscript; or in the decision to publish the results.
References
- Park, G.-H.; Son, K.; Lee, K.-B. Feasibility of using an intraoral scanner for a complete-arch digital scan. J. Prosthet. Dent. 2019, 121, 803–810. [Google Scholar] [CrossRef] [PubMed]
- Park, J.-M.; Kim, R.J.-Y.; Lee, K.-W. Comparative reproducibility analysis of 6 intraoral scanners used on complex intracoronal preparations. J. Prosthet. Dent. 2020, 123, 113–120. [Google Scholar] [CrossRef] [PubMed]
- Braian, M.; Wennerberg, A. Trueness and precision of 5 intraoral scanners for scanning edentulous and dentate complete-arch mandibular casts: A comparative in vitro study. J. Prosthet. Dent. 2019, 122, 129–136. [Google Scholar] [CrossRef] [PubMed]
- Jang, D.; Son, K.; Lee, K.-b. A Comparative Study of the Fitness and Trueness of a Three-Unit Fixed Dental Prosthesis Fabricated Using Two Digital Workflows. Appl. Sci. 2019, 9, 2778. [Google Scholar] [CrossRef]
- Lee, J.-J.; Son, K.; Bae, E.-B.; Choi, J.-W.; Lee, K.-B.; Huh, J.-B. Comparison of the Trueness of Lithium Disilicate Crowns Fabricated from All-in-One and Combination CAD/CAM Systems. Int. J. Prosthodont. 2019, 32, 352–354. [Google Scholar] [CrossRef]
- Araujo, N.S.; Moda, M.D.; Silva, E.A.; Zavanelli, A.C.; Mazaro, J.V.Q.; Pellizzer, E.P. Survival of all-ceramic restorations after a minimum follow-up of five years: A systematic review. Quintessence Int. 2016, 47, 395–405. [Google Scholar] [CrossRef]
- Bosch, G.; Ender, A.; Mehl, A. A 3-dimensional accuracy analysis of chairside CAD/CAM milling processes. J. Prosthet. Dent. 2014, 112, 1425–1431. [Google Scholar] [CrossRef]
- Chen, X.P.; Xiang, Z.X.; Song, X.F.; Yin, L. Machinability: Zirconia-reinforced lithium silicate glass ceramic versus lithium disilicate glass ceramic. J. Mech. Behav. Biomed. Mater. 2020, 101, 103435. [Google Scholar] [CrossRef]
- Wang, W.; Yu, H.; Liu, Y.; Jiang, X.; Gao, B. Trueness analysis of zirconia crowns fabricated with 3-dimensional printing. J. Prosthet. Dent. 2019, 121, 285–291. [Google Scholar] [CrossRef]
- Son, K.; Yu, B.-y.; Yoon, T.H.; Lee, K.-b. Comparative Study of the Trueness of the Inner Surface of Crowns Fabricated from Three Types of Lithium Disilicate Blocks. Appl. Sci. 2019, 9, 1798. [Google Scholar] [CrossRef]
- Papadiochou, S.; Pissiotis, A.L. Marginal adaptation and CAD-CAM technology: A systematic review of restorative material and fabrication techniques. J. Prosthet. Dent. 2018, 119, 545–551. [Google Scholar] [CrossRef] [PubMed]
- de Paula Silveira, A.C.; Chaves, S.B.; Hilgert, L.A.; Ribeiro, A.P.D. Marginal and internal fit of CAD-CAM-fabricated composite resin and ceramic crowns scanned by 2 intraoral cameras. J. Prosthet. Dent. 2017, 117, 386–392. [Google Scholar] [CrossRef] [PubMed]
- Renne, W.; Wolf, B.; Kessler, R.; McPherson, K.; Mennito, A.S. Evaluation of the marginal fit of CAD/CAM crowns fabricated using two different chairside CAD/CAM systems on preparations of varying quality. J. Esthet. Restor. Dent. 2015, 27, 194–202. [Google Scholar] [CrossRef] [PubMed]
- Son, K.; Lee, S.; Kang, S.H.; Park, J.; Lee, K.B.; Jeon, M.; Yun, B.J. A Comparison Study of Marginal and Internal Fit Assessment Methods for Fixed Dental Prostheses. J. Clin. Med. 2019, 8, 785. [Google Scholar] [CrossRef]
- Dolev, E.; Bitterman, Y.; Meirowitz, A. Comparison of marginal fit between CAD-CAM and hot-press lithium disilicate crowns. J. Prosthet. Dent. 2019, 121, 124–128. [Google Scholar] [CrossRef]
- Lee, D.-H. Digital approach to assessing the 3-dimensional misfit of fixed dental prostheses. J. Prosthet. Dent. 2016, 116, 836–839. [Google Scholar] [CrossRef]
- Son, K.; Lee, W.-S.; Lee, K.-B. Prediction of the learning curves of 2 dental CAD software programs. J. Prosthet. Dent. 2019, 121, 95–100. [Google Scholar] [CrossRef]
- Son, K.; Lee, K.-B. Prediction of learning curves of 2 dental CAD software programs, part 2: Differences in learning effects by type of dental personnel. J. Prosthet. Dent. 2019. [Google Scholar] [CrossRef]
- Elsaka, S.E.; Elnaghy, A.M. Mechanical properties of zirconia reinforced lithium silicate glass-ceramic. Dental Materials 2016, 32, 908–914. [Google Scholar] [CrossRef]
- Dancey, C.; Reidy, J. Statistics without Maths for Psychology: Pearson Higher; Pearson: London, UK, 2014. [Google Scholar]
- Colombo, M.; Poggio, C.; Lasagna, A.; Chiesa, M.; Scribante, A. Vickers Micro-Hardness of New Restorative CAD/CAM Dental Materials: Evaluation and Comparison after Exposure to Acidic Drink. Materials 2019, 12, 1246. [Google Scholar] [CrossRef]
- Bohez, E.L. Compensating for systematic errors in 5-axis NC machining. Comput. Aided Des. 2002, 34, 391–403. [Google Scholar] [CrossRef]
- Kim, C.-M.; Kim, S.-R.; Kim, J.-H.; Kim, H.-Y.; Kim, W.-C. Trueness of milled prostheses according to the number of ball-end mill burs. J. Prosthet. Dent. 2016, 115, 624–629. [Google Scholar] [CrossRef] [PubMed]
© 2020 by the authors. Licensee MDPI, Basel, Switzerland. This article is an open access article distributed under the terms and conditions of the Creative Commons Attribution (CC BY) license (http://creativecommons.org/licenses/by/4.0/).