Abstract
Since the heterogeneity of the cement-based material contributes to a random spatial distribution of compressive strength, a reliability analysis based on the compressive strength of concrete is fundamental to carry out structural safety assessment. By analyzing 10,317 datapoints on compressive strength of concrete, a time-varying reliability evaluation based on the third-moment (TM) method was proposed to predict the service life of concrete. Unlike the second-moment (SM) method, skewness is taken into account in the TM; thus, the calculated result of concrete failure time based on the TM is more accurate. In this paper, the errors of the calculated results using time-varying reliability evaluation are within 3%, as shown by Monte Carlo (MC) simulation. In addition, the proposed model (aiming to calculate the equivalent design compressive strength) verifies the concrete failure time calculated by time-varying reliability. According to the results, concrete failure times calculated by these two models are in good agreement. Overall, based on the simple and effective methodology adopted in this paper, it is feasible to develop time-varying reliability based on other factors that might also lead to concrete failure, such as carbonation-induced corrosion, cracking, or deflection of the concrete.
1. Introduction
Reinforced concretes have been applied worldwide in structural engineering since the beginning of the nineteenth century [1,2,3,4,5]. However, structure damage has increasingly occurred under aggressive service environments, which might be caused by ambient temperature, freeze–thaw cycles, precipitation, carbon dioxide, chloride, and sulfate [6,7,8]. Therefore, it is significant to implement effective strategies to guarantee structural safety and strengthen vulnerable buildings. In this paper, a proposed model based on the compressive strength of concrete was applied to predict the concrete failure time.
Carbonation is one of the most fundamental triggers of concrete deterioration [9,10,11,12,13], and carbonation depth is used to describe the level of carbonation-induced corrosion. As presented in the existing paper, the carbonation depth has both favorable and unfavorable effects on the compressive strength of concrete. On the positive side, carbonation-induced corrosion contributes to the increase of the compressive strength and the harnessing of concrete because numerous concrete pores are occupied by the carbonation product, calcium carbonate [14]. On the negative side, too much calcium carbonate that exceeds the limit of concrete pores might cause additional internal pressure and micro-cracking [15,16]. In this paper, the relationship between carbonation depth and the compressive strength of concrete is analyzed using a prediction model of carbonation depth [17].
Since the presence of variations associated with climatic factors (e.g., temperature and humidity), concrete materials, and geometric configurations [18,19], the compressive strength of concrete should be regarded as a variable in order to account for these uncertainties in deterioration. In practical engineering problems, these unavoidable uncertainties are often qualified by probabilistic models [20,21,22], among which reliability analyses are widely applied in structural safety assessments [23,24,25]. In the existing time-varying reliability models, the probabilities of corrosion initiation and corrosion damage are calculated based on the change in climatic variables [26]. Szilágyi [27] developed a phenomenological constitutive model for obtaining the rebound hardness of a surface concrete as a property of the time-dependent material. Nevertheless, this model has not yet been ratified for practical applications. A previously conducted study [28] exhibits the property of compressive strength in the case of deteriorating concrete in the Tohoku region of Japan; however, the prediction model of compressive strength and the method of structural safety evaluation were not provided. Generally, most existing probabilistic models may not be suitable for evaluating the service life of concrete.
Based on a large number of tested data on compressive strength, an effective model based on the reliability to evaluate the service life of concrete was developed. It is noted that different sizes and shapes of the tested components affect the compressive strength of concrete. Therefore, the conversion and standardization of the value of compressive strength may produce an inaccurate result [29]. In this paper, all the shapes and sizes of the experimental members were unified. Additionally, the compressive strengths of all the samples were tested using core pulling. Gao [30] proposed that the compressive strength obeys a normal distribution; however, by analyzing 10,317 datapoints considered in this study, it is observed that a gamma distribution is more appropriate to describe the distribution of compressive strength. Moreover, though Gao’s model serves the purpose of evaluating the compressive strength, only the mean value of compressive strength is considered. Therefore, the probabilistic model may not obtain the precise prediction of concrete failure time. Regarding the discreteness of the statistic, both mean value and coefficient of variation are expected to be considered in the model to evaluate the service life of concrete. Thus, a time-varying evaluation model based on reliability was proposed in this study.
The failure probability and reliability index equivalently evaluate the structural safety. However, the reliability index, being very simple and with respect to function, is not integral, which is in contrast to the calculation of failure probability. Among all the methods for computing the reliability index, moment methods are used worldwide to observe the reliability index [25]. Compared with the second-moment (SM) method, the reliability evaluation based on the third-moment (TM) method is more accurate because the skewness (the third dimensionless central moment) is considered [31,32]. Tested by MC simulation, the results evaluated by the TM reliability are more accurate than those by the SM reliability.
In this paper, the concrete guaranteed rate was applied to predict the concrete failure time calculated by time-varying reliability. To testify the reliability-based computation of the concrete failure time, the equivalent design compressive strength (functioning as the ultimate concrete compressive strength) was investigated to observe the concrete failure time. The concrete failure times computed by both models agree well.
2. Distribution Fitting of the Compressive Strength of Concrete
Deterioration in concrete construction is a severe problem that leads to durability problems and even structural failure. In order to prevent concrete failure and retrofit the aging constructions over time, periodical testings of the structural components are conducted every three years, as shown in Figure 1. In this paper, all data were obtained from these testings, and all tested components were of natural fine aggregated concrete, taken from 1061 buildings (e.g., schools, residences, and office buildings) in Yokohama, Japan, where the average temperature and humidity were 15.208 °C and 69%, respectively. The tested compressive strength in these experiments was regarded as the core compressive strength (), and the average dimensions of the components were 80 mm in diameter and 100 mm in height.
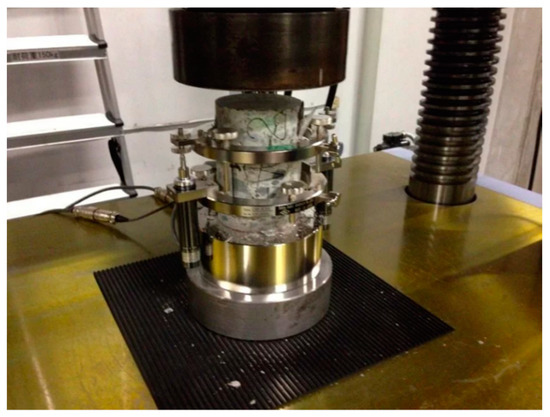
Figure 1.
The compressive strength experiment of concrete core.
The tested data (10,317) were divided into several groups according to different design values of concrete strength () and the service time of concrete (years), as shown in Figure 2 and Figure 3.
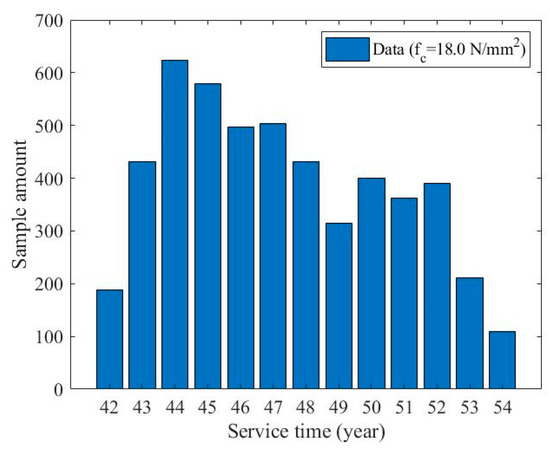
Figure 2.
Statistics of concrete strength ().
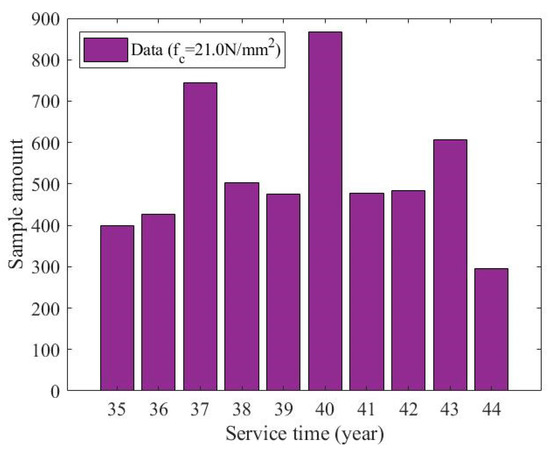
Figure 3.
Statistics of concrete strength ().
MATLAB software was used to analyze the fitting distributions of datasets with the sample significance level a = 0.05. The tests of gamma distribution, normal distribution, Rayleigh distribution, and extreme value distribution were executed based on these data. It was found that the gamma distribution had the highest goodness of fit, as shown in Figure 4. Figure 5 shows the comparison of R-squares between the gamma distribution and the normal distribution of different service years. According to Figure 5, the gamma distribution proved to be more applicable to describe the compressive strength. Additionally, for a deteriorating process, the stochastic gamma process was adopted to analyze the time-varying reliability. Abdel-Hameed [33] was the first to propose the gamma process as the first choice to describe the performance degradation process [34]. Moreover, van Noortwijk modeled the stochastic process of deterioration with a gamma process, which had independent gamma-distributed increments with identical scale parameters [35]. The results indicate that a gamma process can properly model the monotonic behavior of aging. Overall, the preceding research figure shows that the gamma process is suitable to model gradual and monotonically accumulating damage over time [35,36]. Based on these existing conclusions and the analysis in this paper, the gamma distribution is appropriate to describe the distribution of compressive strength.
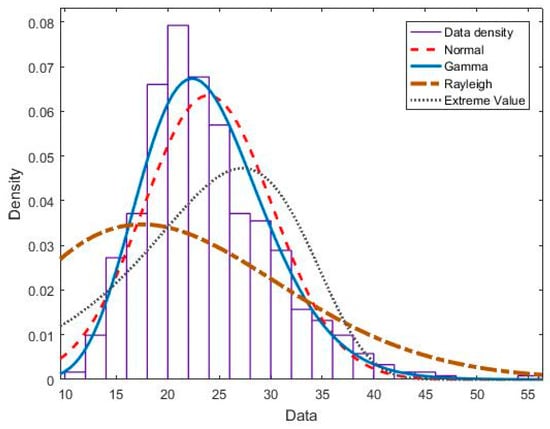
Figure 4.
Distribution fitting of compressive strength.
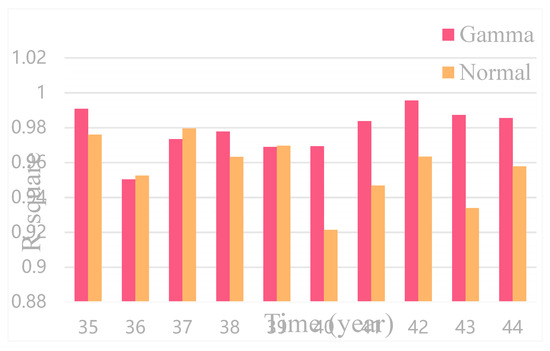
Figure 5.
Contrast of goodness of fit for gamma distribution and normal distribution.
3. Prediction for the Mean Value of Compressive Strength
Carbonation-induced corrosion can lead to a residual capacity loss of the reinforced concrete structures [37]. Generally, carbonation depth is used to define the carbonized level of the concrete. To analyze the relation between the carbonation depth and the compressive strength of concrete, and to develop a prediction model for the mean value of compressive strength (MVCS) in which the environment factors (temperature and humidity) are considered, the ratio of compressive strength to carbonation depth was investigated. In addition, the concrete failure time calculated by this prediction model was used to compare with those calculated by time-varying reliability.
Based on the existing model of carbonation depth [17], the carbonation depth is expressed as
where is the mean value of carbonation depth in a nonstandard condition (mm); is the coefficient of temperature; is the coefficient of humidity; is the environmental temperature (); T0 is the average temperature (); is the environmental humidity (%); RH 0 is the average humidity (%); t is the service time of concrete (year); is the mean value of the standard value of compressive strength (); (equal to concrete grade) is the standard value of compressive strength (), which is observed by converting (design value of compressive strength ()) [38]; and is the coefficient of variation, which can be obtained via the Code for Design of Concrete Structures [39].
According to the investigation of the relevant climate data, the climate changes among different years were not apparent. In order to simplify the calculation of Equation (1), T is set as the median of all mean values of the temperature of different years, and RH is the median of all mean values of the humidity of different years. Different from the prediction model of carbonation depth in the existing paper [17], is replaced by , which is more appropriate to calculate the ratio , as shown in Equation (4). Relevant parameters calculating the carbonation depth are presented in Table 1.

Table 1.
Relevant parameters calculating the carbonation depth in Yokohama, Japan.
To analyze the relation between compressive strength of concrete and carbonation depth, the ratio of relative concrete strength to carbonation depth is developed as
where is the ratio of the relative MVCS to the mean value of carbonation depth (MVCD); is the relative MVCS; and is the MVCS of different years (), which is obtained based on 10,317 experimental datapoints, as shown in Table 2.
Table 2.
Mean value of compressive strength with (a) and (b) .
According to Table 2, it was found that the compressive strength of concrete decreased with the increase of time.
Based on Equations (1)–(6) and Table 1 and Table 2, Ra values of different servicing years were fitted as shown in Figure 6.
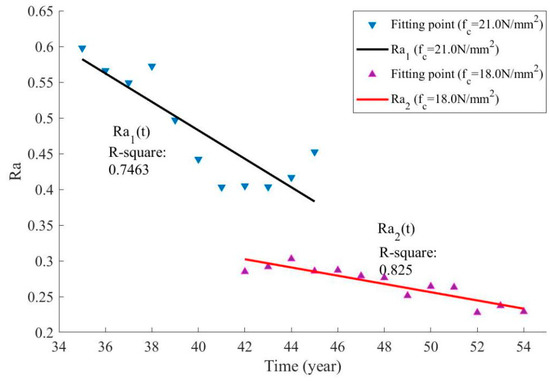
Figure 6.
Fitting of the ratio of the relative concrete strength to the mean value of carbonation depth.
According to Figure 6, Ra decreased as time increased, showing that the compressive strength of concrete decreased with the increase of carbonation depth over time. In addition, it is known that the carbonation depth increased with the increase of time. Therefore, combined with the definition of carbonation depth, it was concluded that carbonation-induced corrosion can result in the decrease of compressive strength of concrete, which agrees with the conclusion drawn from Zha [40].
The fitting curves in Figure 6 are expressed as
where is the ratio of the relative compressive strength to carbonation depth with ; and is the ratio of the relative compressive strength to carbonation depth with .
By comparing the changing rate of with , the deterioration rate of concrete with is faster than that of .
On the basis of Equations (1), (5), (7) and (8), the new prediction models of are proposed as
where is the relative compressive strength of ; is the relative compressive strength of ; is the mean value of the standard value of compressive strength with ; and is the mean value of the standard value of compressive strength with .
Figure 7 is developed from Equations (9) and (10), showing that with an increase of service time, the compressive strength decreased, and the speed of strength deterioration increased. is the limit state of concrete failure in conducting concrete safety assessments (failure mode Ι). As shown in Figure 7, the concrete failure time of was observed to be 48.2 years, while that of was observed to be 61.8 years. However, the coefficient of variation was not considered in this model, leading to the inaccurate prediction of concrete failure time.
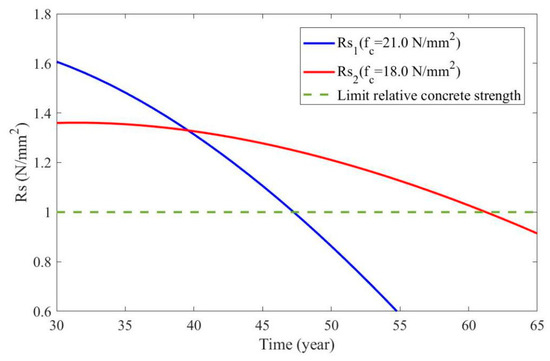
Figure 7.
Relative concrete strength ( and ).
4. Effect of on the Distribution of Compressive Strength
Based on the analysis of distribution fitting, a gamma distribution was used to describe the distribution of compressive strength. To investigate the effect of on the distribution, the coefficient of variation, skewness, and kurtosis of tested data with different values were investigated, as presented in Figure 8, Figure 9 and Figure 10.
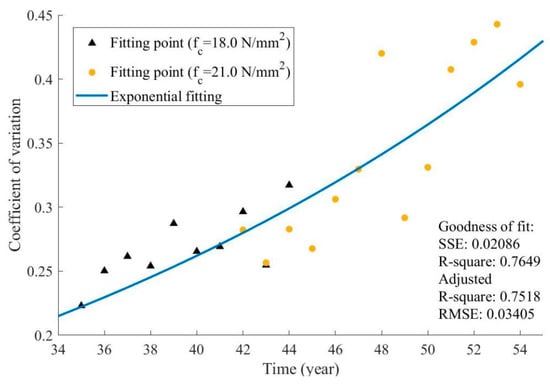
Figure 8.
Time-varying coefficient of variation.
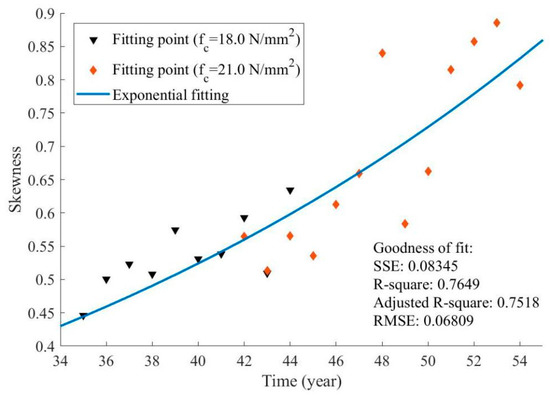
Figure 9.
Time-varying skewness.
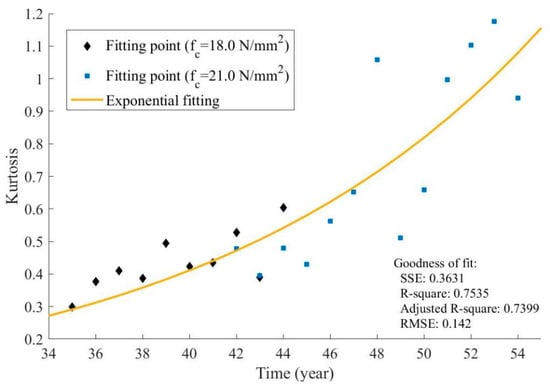
Figure 10.
Time-varying kurtosis.
Figure 8, Figure 9 and Figure 10 also present the corresponding fitting curves with acceptable R-squares, indicating that the influence of on the coefficient of variation, the skewness, and the kurtosis was negligible. Based on Figure 8, Figure 9 and Figure 10, three eigenvalues increased with the increase of time. Besides, the coefficient of variation increased over time, resulting in dispersion expansion of the statistic. Therefore, the accuracy of the observed concrete failure time determined only by the mean value would decrease when time increases.
According to the property of gamma distribution, these three eigenvalues can be calculated by the shape parameter , which are expressed as
where is the coefficient of variation; is the shape parameter; is the skewness; and is the kurtosis.
Since the three eigenvalues are determined only by , it is concluded that also has no influence on .
5. Scale Parameter and Shape Parameter of Gamma Distribution
A reliability analysis was applied in this paper to predict the concrete failure time with high accuracy. In order to develop a time-varying reliability, the parameters ( and ) of the gamma distribution function at different service years need to be investigated. Different from , varies with different values of . The parameters and the corresponding fitting curves are observed in Figure 11 and Figure 12.
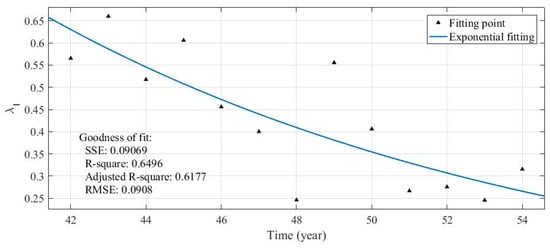
Figure 11.
Scale parameter () fitting ().
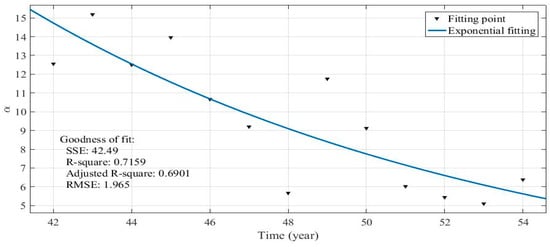
Figure 12.
Shape parameter () fitting.
Equations (14) and (15) are the predicted models of these two parameters obtained by curve fitting.
Another method for computing the time-varying scale parameter is proposed without fitting . The proposed method is presented in the subsequent section.
In this paper, MVCS was computed by Equation (16a). Besides, based on the property of gamma distribution, MVCS can also be expressed as Equation (16b).
where and are both the mean value of compressive strength; and n is used to distinguish and with different .
Figure 13 shows two prediction models of and of , which are expressed based on Equations (10), (16a) and (14), (15), (16b), respectively. The difference between the predicted results exists because and were both obtained based on curve fitting. The errors between the predicted results were less than 2%.
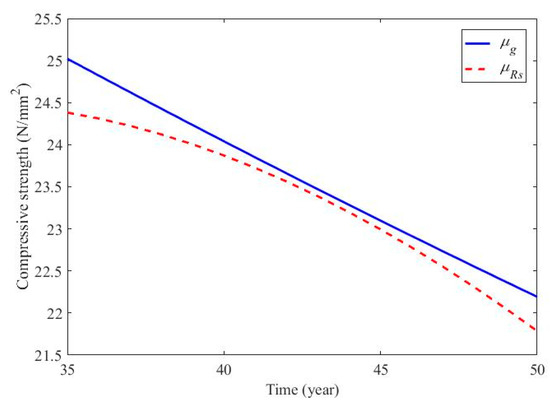
Figure 13.
Comparison of results calculated by and ().
According to Figure 13, it is concluded that and were equivalent to evaluate the compressive strength, which is expressed as Equation (17a). Therefore, an approximate expression, formulated based on Equation (17a) for the time-varying scale parameter, is elaborated as presented by Equation (17b).
In light of Equation (17b), it is feasible to obtain without curve fitting. By using the proposed method, of is obtained based on Equations (9), (15), and (17b), as shown in Figure 14.
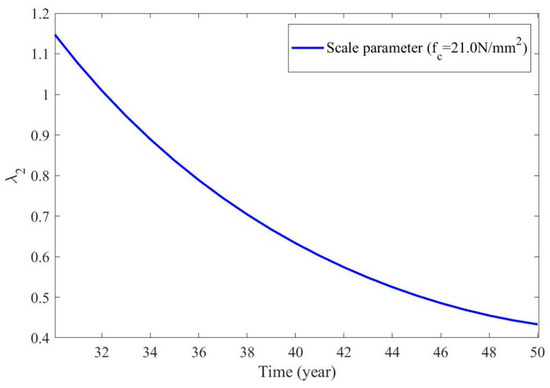
Figure 14.
Scale parameter () with .
6. Time-Varying Reliability Evaluation Based on the Tm Method
Since concrete failure is regarded as , the performance function is deduced as Equation (18), where x is the random variable of compressive strength. According to the cumulative density function (CDF) of the gamma distribution, the failure probability () is expressed as
where G(x) is the performance function; and x is the random variable of compressive strength.
One of the most important steps to calculate is to analyze the integral of the probability density function (PDF), leading to the difficulty in probability computation. In this paper, a reliability analysis based on the TM method was proposed with a simpler calculation.
The calculation steps of the time-varying TM reliability index () [25] are
where is the SM reliability index; is the mean value of ; is the standard deviation of ; and is the skewness of .
Figure 15 and Figure 16 show the time-varying failure probability, time-varying reliability index, and the corresponding results of MC simulation (). Other failure probabilities and reliability indices of different can be developed using the same method. In this paper, an MC simulation was used to verify the accuracy of reliability. From the MC simulation, the errors of the failure probability and the TM reliability index were within 3%, as shown in Table 3. Obviously, from Figure 16, had a better agreement than because skewness was considered in . Thus, and in this paper can be used to evaluate the structural safety with high accuracy.
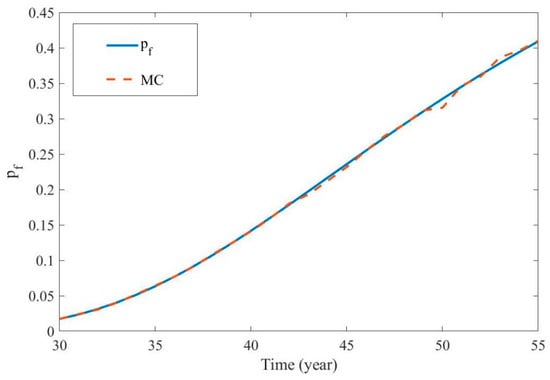
Figure 15.
Time-varying failure probability and MC simulation ().
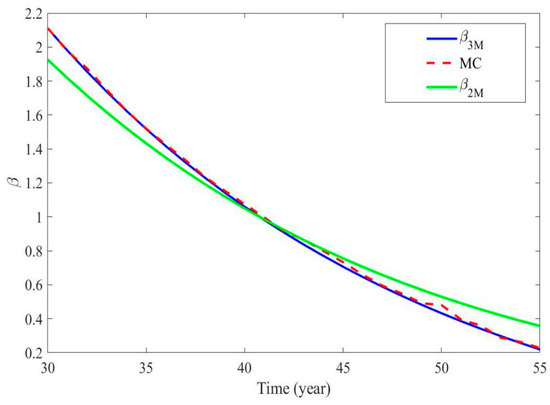
Figure 16.
Time-varying reliability index and MC simulation ().
Table 3.
Part of failure probabilities and reliability indices from 36 to 40 years.
7. Concrete Guaranteed Rate and Concrete Failure Time
On the basis of the building code calibration, concrete quality is determined by the guaranteed rate of above 95% [40]. Therefore, to evaluate concrete failure time based on reliability, the guaranteed rate was applied in this paper. The concrete failure time can be obtained when the qualified rate () is equal to the guaranteed rate (). As shown in Figure 17, is represented by the dimension of the shaded area.
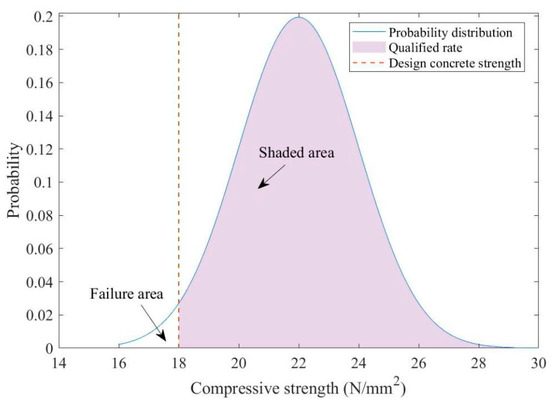
Figure 17.
Normal distribution of and .
is obtained through the probability degree (d) [39], which reflects the relative degree of limit error, as shown in Table 4.
Table 4.
Probability degree and guaranteed rate.
and are expressed as
where is the standard deviation.
Figure 18 shows the relationship between and . From Figure 18, the failure time of was expected to be 35.8 years. When (shown in Figure 14) was applied in the reliability calculation, the concrete failure time of was 38.8 years, as shown in Figure 19.
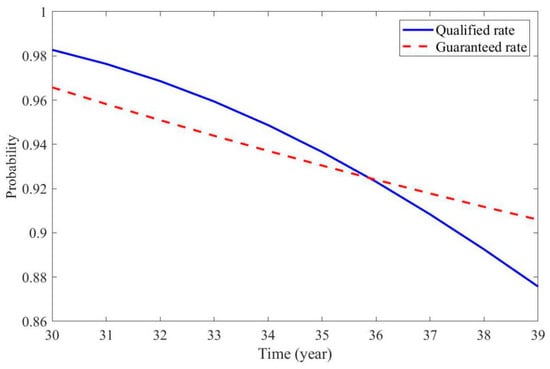
Figure 18.
Time-varying qualified rate and guaranteed rate of .
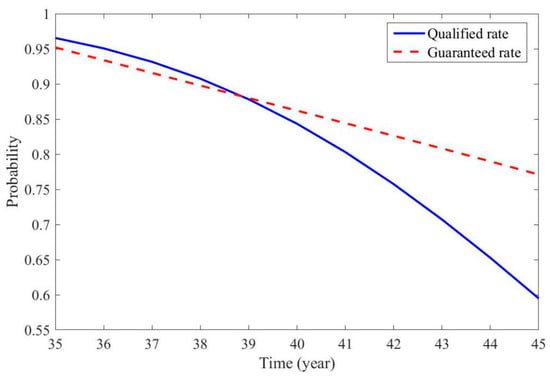
Figure 19.
Time-varying qualified rate and guaranteed rate of .
The failure probability and reliability index are equivalent indices of reliability. According to the concrete failure time (35.8 years) calculated by the failure probability, the limit reliability index of was observed as 1.466. Other limit reliability indices of different values can be observed through the same method. Failure mode II is defined as the reliability index less than the limit reliability index.
8. Prediction Model of Equivalent Design Compressive Strength
To test the accuracy of predicted results (concrete failure time) calculated by time-varying reliability, this paper applies the prediction model of equivalent design compressive strength (). By the definition of , implies that , at which point the concrete is regarded as out of service. McIntyre [41] calculated the equivalent design compressive strength from a set of core tested data by the following steps:
where and are the coefficients of variation of the situ compressive strength and the core test strength, respectively; is the converting coefficient of variation when there are fewer than 30 tests; is the multiplying factor (see [41]); is the mean value of core strength (with coefficient of variation = ); is the mean value of situ compressive strength (with coefficient of variation = 17.5%); and is the equivalent design strength.
The in this paper is expressed as Equation (33) based on Figure 8.
The relative equivalent design compressive strength is expressed as
Failure mode III occurs when . Based on Equations (28)–(34), failure mode III was reached at 36.7 years when , and at 38.3 years when (see Figure 20). These results were close to the calculated results of 35.8 years in Figure 18, and 38.8 years in Figure 19, respectively. The calculated results were in good agreement because both the mean and coefficient of variation were considered in the two prediction models. Moreover, the failure modes of the two models were based on the concrete guaranteed rate.
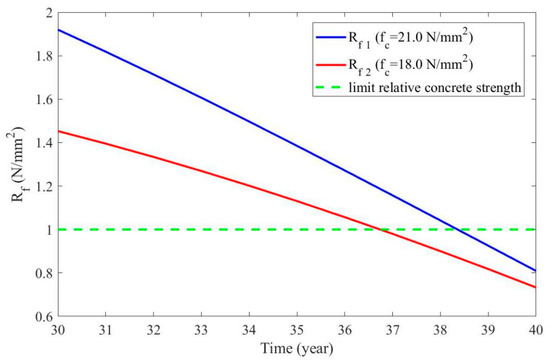
Figure 20.
Relative equivalent design concrete strength ( and ).
9. Example
of beam Ι and beam II of different buildings in Yokohama, Japan, was , and the service years of beam Ι and beam II were 31 and 38 years, respectively.
In this example, , , and were , 31 years, and 38 years, respectively. Climate statistics were collected on a related weather website.
9.1. Calculation Ι
Using Equations (4) and (10), the relative compressive strengths of beam Ι and beam II were calculated as
According to failure mode Ι, both beams were still in service.
9.2. Calculation II
Using Equations (14) and (15) and (20)–(24), the corresponding reliability indices were calculated as
According to failure mode II, beam Ι was in service, whereas beam II had been destroyed.
9.3. Calculation III
Using Equations (4), (10), and (28)–(34), the corresponding equivalent design compressive strengths are calculated as
According to failure mode III, the result of the safety evaluation coincided with that obtained in calculation II.
On the basis of the analysis and discussion above, the result of Calculation Ι is different from others because only the mean value is considered. Therefore, the first result is inconvincible. From the second and third results, beam Ι is relatively secure. However, beam II is suggested to be retrofitted. It is suggested that the member of failure probability of less than 0.5 is supposed to be replaced rather than strengthened.
10. Conclusions
- (1)
- The environmental factors (temperature and humidity) are considered in the prediction model of MVCS.
- (2)
- Compared with other distributions, such as a normal distribution and lognormal distribution, the gamma distribution is applied to describe the distribution of compressive strength with the highest R-square.
- (3)
- The time-varying TM reliability, with higher accuracy in contrast to SM method, is proposed to predict the concrete failure time.
- (4)
- Compared with the results of MC simulation, the prediction model of time-varying reliability based on the TM method is accurate, and the errors are within 3%.
- (5)
- Tested by the model for calculating an equivalent design compressive strength, the errors of the concrete failure time calculated by time-varying reliability are acceptable.
Author Contributions
conceptualization, Y.Z. and J.W.; methodology, J.W.; software, W.Z.; validation, J.W. and W.Z.; formal analysis, W.Z.; investigation, W.Z.; resources, X.Z.; data curation, J.W. and Y.Z.; writing—original draft preparation, W.Z.; writing—review and editing, W.Z.; visualization, W.Z.; supervision, J.W.; project administration, Y.Z. and X.Z.; funding acquisition, Y.Z. and X.Z. All authors have read and agreed to the published version of the manuscript.
Funding
This research work was supported by the Natural Science Foundation of China (Grant No. 51878413).
Conflicts of Interest
The authors declare no conflict of interest.
References
- Wahid, F.; Yu, B.; Tuan, D.N.; Allan, M.; Priyan, N. New advancements, challenges and opportunities of multi-storey modular buildings—A state-of-the-art review. Eng. Struct. 2019, 183, 883–893. [Google Scholar]
- Lantsoght, E.O.; van der Veen, C.; de Boer, A.; Hordijk, D.A. State-of-the-art on load testing of concrete bridges. Eng. Struct. 2017, 150, 231–241. [Google Scholar] [CrossRef]
- Bernardino, C.; Alessandro, P.F.; Paolo, V. Combining fiber-reinforced concrete with traditional reinforcement in tunnel linings. Eng. Struct. 2009, 31, 1600–1606. [Google Scholar]
- Wahid, F.; Yu, B.; Ahmed, D.A.; Sindu, S.; Juri, J. Modular assembly of water-retaining walls using GFRP hollow profiles: Components and connection performance. Compos. Struct. 2018, 194, 1–11. [Google Scholar]
- Wahid, F.; Ahmed, D.A.; Yuan, H.; Yu, B. Short-term flexural behaviour of concrete filled pultruded GFRP cellular and tubular sections with pin-eye connections for modular retaining wall construction. Compos. Struct. 2018, 206, 1–10. [Google Scholar]
- Zhang, H.R.; Ji, T.; Liu, H. Performance evolution of the interfacial transition zone (ITZ) in recycled aggregate concrete under external sulfate attacks and dry-wet cycling. Constr. Build. Mater. 2019, 229, 116938. [Google Scholar] [CrossRef]
- Al-Khafaji, A.F.; Myers, J.J.; Wang, W. Bond evaluation of SRP strengthening system exposed to several harsh environmental conditions. Constr. Build. Mater. 2020, 231, 117093. [Google Scholar] [CrossRef]
- Lee, H.; Cody, R.D.; Cody, A.M.; Spry, P.G. The formation and role of ettringite in Iowa highway concrete deterioration. Cem. Concr. Res. 2005, 35, 332–343. [Google Scholar] [CrossRef]
- José, A.B.; Sofia, R. A review on the carbonation and Chloride Penetration resistance of Structural Lightweight Aggregate Concrete. Materials 2019, 12, 3456. [Google Scholar]
- Chen, Y.; Liu, P.; Yu, Z.W. Effects of environmental factors on concrete carbonation depth and compressive strength. Materials 2018, 11, 2167. [Google Scholar] [CrossRef]
- Parrott, L.J. Some effects of cement and curing upon carbonation and reinforcement corrosion in concrete. Mater. Struct. 1996, 29, 164–173. [Google Scholar] [CrossRef]
- Jones, M.R.; Dhir, R.K.; Newlands, M.D.; Abbas, A.M.O. A study of the CEN test method for measurement of the carbonation depth of hardened concrete. Mater. Struct. 2000, 33, 135–142. [Google Scholar] [CrossRef]
- Alexander, M.G.; Mackechnie, J.R.; Yam, W. Carbonation of concrete bridge structures in three South African localities. Cem. Concr. Compos. 2007, 29, 750–759. [Google Scholar] [CrossRef]
- Kim, J.K.; Kim, C.Y.; Yi, S.T.; Lee, Y. Effect of carbonation on the rebound number and compressive strength of concrete. Cem. Concr. Compos. 2009, 31, 139–144. [Google Scholar] [CrossRef]
- Richardson, M.G. Carbonation of Reinforced Concrete: Its Causes and Management; University College Dublin: Dublin, Ireland, 1988. [Google Scholar]
- Junior, A.N.; Filho, R.D.T.; Fairbairn, E.D.M.R.; Dweck, J. A study of the carbonation profile of cement pastes by thermogravimetry and its effect on the compressive strength. Therm. Anal. Calorim. 2014, 116, 69–76. [Google Scholar] [CrossRef]
- Chen, M.; Li, X.J.; Liu, L.Q. Random calculation model of carbonation depth for long-age high performance concrete. Sichuang Build. Sci. 2018, 44, 80–84. [Google Scholar]
- Zhao, H.; Sun, W.; Wu, W.; Gao, B. The effect of the material factors on the concrete resistance against carbonation. Civ. Eng. 2018, 22, 1265–1274. [Google Scholar] [CrossRef]
- Li, G.; Yuan, Y.S.; Liu, X.; Du, J.M.; Li, F.M. Influences of environment climate conditions on concrete carbonation rate. Adv. Eng. Mater. 2011, 194–196, 904–908. [Google Scholar] [CrossRef]
- Lee, J.J.; Kim, D.; Chang, S.K.; Nocete, C.F.M. An improved application technique of the adaptive probabilistic neural network for predicting concrete strength. Comput. Mater. Sci. 2009, 44, 988–998. [Google Scholar] [CrossRef]
- Kim, D.K.; Lee, J.J.; Lee, J.H.; Chang, S.K. Application of probabilistic neural networks for prediction of concrete strength. Mater. Civ. Eng. 2005, 17, 353–362. [Google Scholar] [CrossRef]
- Bao, H.; Yu, M.; Liu, Y.; Ye, J. Experimental and statistical study on the irregularity of carbonation depth of cement mortar under supercritical condition. Constr. Build. Mater. 2018, 174, 47–59. [Google Scholar] [CrossRef]
- Zhang, X.G.; Wang, J.; Zhao, Y.G.; Tang, L.P.; Xing, F. Time-dependent probability assessment for chloride induced corrosion of RC structures using the third-moment method. Constr. Build. Mater. 2015, 76, 232–244. [Google Scholar] [CrossRef]
- Wang, J.; Lu, Z.H.; Saito, T.; Zhang, X.G.; Zhao, Y.G. A simple third-moment reliability index. Asia Arch. Build. Eng. 2017, 16, 171–178. [Google Scholar] [CrossRef]
- Zhao, Y.G.; Lu, Z.H.; Ono, T. First third moments of some commonly used performance functions. J. Struct. Constr. Eng. 2017, 617, 31–37. [Google Scholar]
- Stewart, M.G.; Wang, X.; Nguyen, M.N. Climate change impact and risks of concrete infrastructure deterioration. Eng. Struct. 2011, 33, 1326–1337. [Google Scholar] [CrossRef]
- Szilágyi, K.; Borosnyói, A.; Zsigovics, I. Rebound surface hardness of concrete: Introduction of an empirical constitutive model. Constr. Build. Mater. 2011, 25, 2480–2487. [Google Scholar] [CrossRef]
- Saichi, M.; Mihasha, H.; Tanaka, R.; Shinohe, H.; Shibata, A. Concrete strength of existing buildings in tohoku district. Arch. Inst. Jpn. 2001, 546, 9–16. [Google Scholar]
- Oliver, Z.; Michael, S.; Konrad, B. Time dependent development of compressive strength of concrete and the influence on the bearing capacity of post-installed anchorages. Beton-und Stahlbetonbau 2015, 110, 402–409. [Google Scholar]
- Gao, X.L.; Li, J.; Ren, X.D. Probabilistic model for long-term time-dependent compressive strength of concrete in existing buildings. Perform. Constr. Facil. 2018, 32, 04018074. [Google Scholar] [CrossRef]
- Zhao, Y.G.; Ono, T. Moment methods for structural reliability. Struct. Saf. 2001, 23, 47–75. [Google Scholar] [CrossRef]
- Zhao, Y.G.; Ono, T.; Idota, H.; Hirano, T. A three-parameter distribution used for structural reliability evaluation. J. Struct. Constr. Eng. 2001, 66, 31–38. [Google Scholar] [CrossRef]
- Abdel-Hameed, M. A Gamma Wear Process. IEEE Trans. Reliab. 1975, 24, 152–153. [Google Scholar] [CrossRef]
- Jia, X.S. The decision models for reliability centered maintenance. Natl. Def. Ind. Press 2007, 116–118. [Google Scholar]
- Van Noortwijk, J.M.; van der Weide, J.A.M.; Kallen, M.J.; Pandey, M.D. Gamma processes and peaks-over-threshold distributions for time-dependent reliability. Reliab. Eng. Syst. Saf. 2007, 92, 1651–1658. [Google Scholar] [CrossRef]
- Mahmoodian, M.; Alani, A. Modeling deterioration in concrete pipes as a stochastic gamma process for time-dependent reliability analysis. J. Pipeline Syst. Eng. Pract. 2014, 5, 04013008. [Google Scholar] [CrossRef]
- Vu, Q.H.; Pham, G.; Chonier, A.; Brouard, E.; Rathnarajan, S.; Pillai, R.; Gettu, R.; Santhanam, M.; Aguayo, F.; Folliard, K.J.; et al. Impact of different climates on the resistance of concrete to natural carbonation. Constr. Build. Mater. 2019, 216, 450–467. [Google Scholar] [CrossRef]
- Ministry of Housing and Urban-Rural Development of the People’s Republic of China. National Standard of the Peoples Republic of China, Code for Design of Concrete Structures: GB 50010-2010[S]; China Architecture & Building Press: Beijing, China, 2015.
- Ministry of housing and urban-rural development of the people’s Republic of China (MOHURD). Code for Design of Concrete Structures; TJ10-74; MOHURD: Beijing, China, 1974. (In Chinese)
- Zha, X.X.; Ning, J.Q.; Saafi, M.; Dong, L.J.; Dassekpo, J.B.M.; Ye, J.Q. Effect of supercritical carbonation on the strength and heavy metal retention of cement-solidified fly ash. Cem. Concr. Res. 2019, 120, 36–45. [Google Scholar] [CrossRef]
- Mcintyre, M. Interpretation and application of core test data in strength evaluation of-existing concrete bridge structures. Can. Civ. Eng. 1990, 17, 471–480. [Google Scholar] [CrossRef]
© 2020 by the authors. Licensee MDPI, Basel, Switzerland. This article is an open access article distributed under the terms and conditions of the Creative Commons Attribution (CC BY) license (http://creativecommons.org/licenses/by/4.0/).