Abstract
A novel technique is proposed for the analysis and modeling of timbre perception features, including a new terminology system for evaluating timbre in musical instruments. This database consists of 16 expert and novice evaluation terms, including five pairs with opposite polarity. In addition, a material library containing 72 samples (including 37 Chinese orchestral instruments, 11 Chinese minority instruments, and 24 Western orchestral instruments) and a 54-sample objective acoustic parameter set were developed as part of the study. The method of successive categories was applied to each term for subjective assessment. A mathematical model of timbre perception features (i.e., bright or dark, raspy or mellow, sharp or vigorous, coarse or pure, and hoarse or consonant) was then developed for the first time using linear regression, support vector regression, a neural network, and random forest algorithms. Experimental results showed the proposed model accurately predicted these attributes. Finally, an improved technique for 3D timbre space construction is proposed. Auditory perception attributes for this 3D timbre space were determined by analyzing the correlation between each spatial dimension and the 16 timbre evaluation terms.
1. Introduction
The subjective perception of sound originates from three auditory attributes: loudness, pitch, and timbre [1]. In recent years, researchers have established relatively mature evaluation models for loudness and pitch [2,3], but a quantitative calculation and assessment of timbre is far more complicated. Studies have shown that timbre is a critical acoustic cue for conveying musical emotion. It also provides an important basis for human recognition and classification of music, voice, and ambient sounds [4]. Therefore, the quantitative analysis of timbre and the establishment of a parameterized model are of significant interest in the fields of audio-visual information processing, music retrieval, and emotion recognition. The subjective nature of timbre complicates the evaluation process, which typically relies on subjective evaluations, signal processing, and statistical analysis. The American National Standards Institute (ANSI) defines timbre as an attribute of auditory sensation in terms of which a listener can judge that two sounds similarly presented and having the same loudness and pitch are dissimilar [5], making it an important factor for distinguishing musical tones [6].
Timbre evaluation terms (i.e., timbre adjectives) are an important metric for describing timbre perception features. As such, a comprehensive and representative terminology system is critical for ensuring the reliability of experimental auditory perception data. Conventionally, timbre evaluation research has focused on the fields of music and language sound quality, traffic road noise control, automobile or aircraft engine noise evaluation, audio equipment sound quality design, and soundscape evaluation. Among these, research in English-speaking countries is relatively mature, as shown in Table 1. However, differences in nationality, cultural background, customs, language, and environment inevitably affect the cognition of timbre evaluation terms [7,8,9,10,11]. In addition, Chinese instruments differ significantly from Western instruments in terms of their structure, production material, and sound production mechanisms. The timbre of Chinese instruments is also more diverse than that of Western instruments and existing English timbre evaluation terms may not be sufficient for describing these nuances. As such, the construction of musical timbre evaluation terms is of great significance to the study of Chinese instruments.

Table 1.
Previous studies on timbre evaluation terms.
Timbre contains complex information concerning the source of a sound. Humans can perform a series of tasks to recognize objects by listening to these sounds [38]. As such, the quantitative analysis and description of timbre perception characteristics has broad implications in military and civil fields, such as instrument recognition [39], music emotion recognition [40], singing quality evaluation [41], active sonar echo detection [42], and underwater target recognition [43]. Developing a mathematical model of timbre perception features is vital to achieving a quantitative description of timbre. Two primary methods have conventionally been used to quantify timbre perception features. The first is the concept of psychoacoustic parameters [6]. That is, by analyzing the auditory characteristics of the human ear, a mathematical model can be established to represent subjective feelings, such as sharpness, roughness, and fluctuation strength [44]. Since most of the experimental stimulus signals in these experiments were noise, the calculated value for the musical signal differed from the subjective feeling, which is both limited and one-sided. Another technique combines subjective evaluation experiments with statistical analysis. In other words, the experiment is designed according to differences in perceived features from sound signals, from which objective parameters can be extracted. The correlation between objective parameters and perceived features is established through statistical analysis or machine learning, which is then used to develop a mathematical model of the perceived features. This approach has been widely used in the fields of timbre modeling [45,46], music information retrieval [47], instrument classification [48], instrument consonance evaluation [49], interior car sound evaluation [50], and underwater target recognition [42]. However, the experimental materials in these studies were Western instruments or noise. Chinese instruments are unique in their mechanisms of sound production and playing techniques, producing a rich timbre variety. As such, it is necessary to use Chinese instruments as a stimulus to establish a more complete timbre perception model.
Timbre is an auditory attribute with multiple dimensions, which can be represented by a continuous timbre space. This structure is of great importance to the quantitative analysis and classification of sound properties. The semantic differential method was used in early timbre space research [12,13]. Recently, multidimensional scaling (MDS) based on dissimilarity has been used to construct these spaces. For example, Grey used 16 Western instrument sound samples to create a three-dimensional (3D) timbre space [51]. McAdams et al. studied the common dimensions of timbre spaces with synthetic sounds used as experimental materials, establishing a relationship between the dimensions of a space and the corresponding acoustic parameters [52]. Martens et al. used guitar timbre to study the differences in timbre spaces constructed under different language backgrounds [53,54]. Zacharakis and Pastiadis conducted a subjective evaluation and analysis using 16 Western musical instruments, proposing a luminance–texture–mass (LTM) model for semantic evaluation. In this process, six semantic scales were analyzed using principal component analysis (PCA) and multidimensional scaling (MDS) to produce two different timbre spaces [55]. Simurra and Queiroz used a set of 33 orchestral music excerpts that were subjectively rated using quantitative scales based on 13 pairs of opposing verbal attributes. Factor analysis was included to identify major perceptual categories associated with tactile and visual properties, such as mass, brightness, color, and scattering [56]. Multidimensional scaling requires the acquisition of a dissimilarity matrix between each sample. However, existing methods use a paired comparison technique for the subjective evaluation experiment. This approach not only involves a large experimental workload, it also imposes a higher professional requirement, making the evaluation scale difficult to control. This paper proposes a new indirect model for constructing timbre spaces based on the method of successive categories. In this system, the dissimilarity matrix is calculated based on experimental data from the method of successive categories. This reduces the workload and increases the stability and reliability of the data.
The remainder of this paper is organized as follows. Section 2 introduces the timbre library construction process and Section 3 develops the timbre evaluation terminology. Section 4 introduces the perception feature model, and the timbre space is constructed in Section 5. Section 6 concludes the paper. The research methodology for the study is presented in Figure 1.
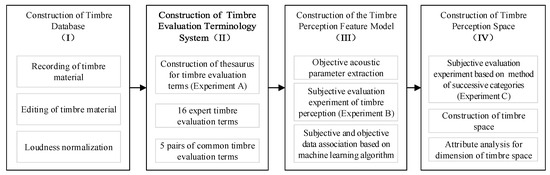
Figure 1.
The proposed methodology.
2. Timbre Database Construction
2.1. Timbre Material Collection
A high-quality database of timbre materials was constructed by recording all materials required for the experiment in a full anechoic chamber, with a background noise level of −2 dBA. The equipment included a BK 4190 free-field microphone and a BK LAN-XI3560 AD converter. The performers were teachers and graduate students from the College of Music. Recordings consisted of musical scales and individual pieces of music. The Avid Pro Tools HD software was used to edit the audio material. The length of each clip was between 6–10 s, the sampling rate was 44,100 Hz, the quantization accuracy was 16 bits, and all audio was saved in the wav format. Previous studies on timbre used Western instruments as stimulus materials. However, the variety of timbre samples needed to be as rich as possible to increase the accuracy of timbre perception features. The timbre variety was enriched by using a collection of 72 different musical instruments, including 36 Chinese orchestral instruments, 12 Chinese minority instruments, and 24 Western orchestral instruments. The names and categories of the 72 instruments are listed in Appendix A. A timbre library containing 72 audio files was constructed from the data.
2.2. Loudness Normalization
In accordance with the definition of timbre, the influence of pitch and loudness are often excluded from timbre studies. However, previous research has shown that timbre and pitch are not independent in certain cases [57]. As such, timbre perception features presented in this paper include pitch as a factor. In order to eliminate the influence of loudness, a balance experiment was used to normalize the loudness of the timbre materials based on experimental results [58].
3. Construction of the Timbre Subjective Evaluation Term System
A timbre evaluation glossary including 32 evaluation terms was constructed and a subjective timbre evaluation experiment was conducted, based on a forced selection methodology (experiment A). Sixteen representative timbre evaluation terms were selected by combining the results of a clustering analysis. Finally, correlation analysis was used to calculate the correlation of these 16 evaluation terms. Six terms with a coefficient larger than 0.85 were removed. The remaining 10 terms were paired into five groups with opposite polarity (the absolute value of the correlation coefficient was greater than 0.81). These five pairs were used for timbre evaluation experiments based on the method of successive categories (experiment B), as well as the parametric modeling of timbre perception features.
3.1. Construction of the Thesaurus for Timbre Evaluation Terms
A thorough investigation of timbre evaluation terms was conducted under conditions of equivalent sound. A total of 329 terms were collected from the literature and a survey. Five people with a professional music background then deleted 155 of these terms (e.g., polysemy, ambiguous meaning, compound terms, etc.) that were, in their opinion, not suitable for a subjective experiment. A group of 21 music professionals listened to audio clips of the remaining 174 terms and judged whether they were suitable for describing the sound. The 32 most frequent evaluation terms were selected and a lexicon containing 32 timbre metrics was produced (Table 2). These terms completely describe all aspects of timbre dynamics, but they do include some redundant information, which needed to be assessed further using statistical analysis.
Table 2.
A lexicon of 32 timbre evaluation terms in their original language (Chinese), with an accompanying English translation.
3.2. Experiment A: A Subjective Evaluation Experiment Based on a Forced Selection Methodology
A subjective evaluation experiment was conducted in a standard listening room with a reverberation time of 0.3 s, which conforms to listening standards [59]. A total of 41 music professionals (21 males) participated in the experiment. Their ages ranged between 18 and 35 and they had no history of hearing loss. A forced selection methodology was employed in which audio clips from the material library were played in turn and subjects determined whether a given evaluation term was suitable for describing the audio clip. Clustering analysis and correlation analysis were then used to assess the experimental data (as discussed below), producing a music expert timbre evaluation term system (including 16 evaluation terms) and an ordinary timbre evaluation term system (including 5 pairs of evaluation terms with opposite polarity).
3.3. Data Analysis and Conclusion of Experiment A
A multidimensional scale was used to analyze the distance relationships for 32 evaluation terms in the two-dimensional space. The distance relationship between the 32 terms is shown in Figure 2. It is evident from Figure 2 that the distance between terms was small in some regions, indicating a high degree of correlation. In order to reduce the workload of subsequent timbre perception feature modeling, cluster analysis was used to further reduce the dimensionality of the evaluation terms. Figure 3 shows a cluster pedigree diagram calculated using a system clustering method. Using this diagram and the selection frequency obtained previously, the 32 terms were combined to produce 16 timbre evaluation terms (see Table 3). These 16 terms constituted the music expert timbre evaluation system used in the modeling of timbre spaces (experiment C).
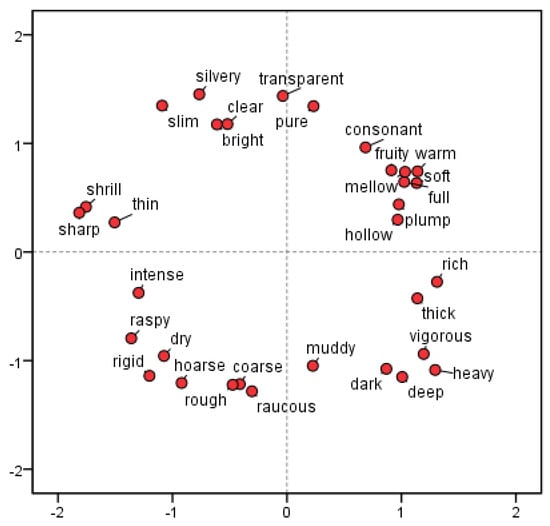
Figure 2.
The distance relationship between the 32 evaluation terms.
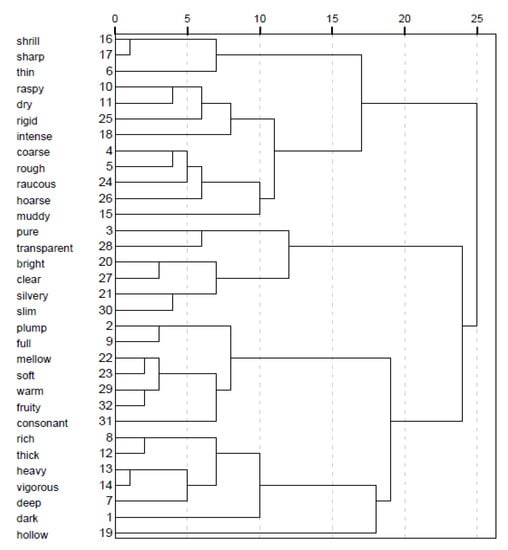
Figure 3.
A cluster diagram of 32 timbre evaluation terms.
Table 3.
A musical expert timbre evaluation term system, including 16 timbre evaluation terms in their original language (Chinese) and the corresponding English translations.
A common timbre evaluation terminology system was then developed by calculating the Pearson correlation coefficient (PCC) for these 16 terms. The 6 terms with the highest correlation (PCC > 0.85) were excluded, resulting in a correlation matrix for the remaining 10 terms (Table 4). Terms with negative PCCs or large absolute values were selected from this matrix to form evaluation pairs with opposite meanings. These 10 terms were then combined to form five pairs (Table 5), constituting an ordinary timbre evaluation system. These pairs were used for the timbre evaluation experiment based on the method of successive categories (experiment B) and the parametric modeling of timbre perception features.
Table 4.
A correlation matrix for 10 timbre evaluation terms.
Table 5.
An ordinary timbre evaluation term system including five pairs of evaluation terms in their original language (Chinese) and the associated English translations.
4. Construction of a Timbre Perception Feature Model
Objective acoustic parameters were extracted from audio samples in 166 dimensions. The method of successive categories was then used to conduct a timbre perception evaluation experiment (experiment B), as well as reliability and validity analysis for the resulting data. Linear regression, support vector regression, a neural network, and a random forest algorithm were used to construct a timbre perception feature model. The accuracy of this model was then evaluated and it was used to predict timbre perception features for new audio materials.
4.1. Construction of the Objective Acoustic Parameter Set
Timbre is a multidimensional perception attribute that is closely related to the time-domain waveform and spectral structure of sound [60]. In order to establish a timbre perception feature model, an objective acoustic parameter set was constructed using 54 parameters extracted from the timbre database. Objective acoustic parameters refer to any values acquired using a mathematical model representing a normal sound signal in the time and frequency domains. These 54 parameters can be divided into 6 categories [61]:
- (1)
- Temporal shape features: calculated from the waveform or the signal energy envelope (e.g., attack-time, temporal increase or decrease, and effective duration).
- (2)
- Temporal features: auto-correlation coefficients with a zero-crossing rate.
- (3)
- Energy features: referring to various energy content in the signal (i.e., global energy, harmonic energy, or noise energy).
- (4)
- Spectral shape features: calculated from the short-time Fourier transform (STFT) of the signal (e.g., centroid, spread, skewness, kurtosis, slope, roll-off frequency, or Mel-frequency cepstral coefficients).
- (5)
- Harmonic features: calculated using sinusoidal harmonic modeling of the signal (e.g., harmonic/noise ratio, odd-to-even and tristimulus harmonic energy ratio, and harmonic deviation).
- (6)
- Perceptual features: calculated using a model of human hearing (i.e., relative specific loudness, sharpness, and spread).
4.2. Calculation Method
The acoustic parameters were calculated as follows. The spectral centroid for the magnitude spectrum of the STFT [60] is given by:
where Mt[n] is the magnitude of the Fourier transform at frame t and frequency n. This centroid is a measure of the spectral shape, where higher centroid values indicate “brighter” sounds. Spectral slope was calculated using a linear regression over spectral amplitude values. It should be noted that spectral slope is linearly dependent on the spectral centroid as follows [62]:
where slope(tm) is the spectral slope at time tm, ak is the spectral amplitude at k, and fk is the frequency at k. Tristimulus values were introduced by Pollard and Jansson as a timbral equivalent to color attributes in vision. The tristimulus comprises three different energy ratios, providing a description of the first harmonics in a spectrum [63]:
where H is the total number of partials and ah is the amplitude of partial h.
Spectral flux is a time-varying descriptor calculated using STFT magnitudes. It represents the degree of variation in a spectrum over time, defined as unity minus the normalized correlation between successive ak terms [64]:
Inharmonicity measures the departure of partial frequencies fh from purely harmonic frequencies hf0. It is calculated as a weighted sum of deviations from harmonicity for each individual partial [62]:
where f0 is the fundamental frequency and fh is the frequency of partial h.
Spectral roll-off was proposed by Scheirer and Slaney [65]. It is defined as the frequency fc(tm) below which 95% of the signal energy is contained:
where sr/2 is the Nyquist frequency and af is the spectral amplitude at frequency f. In the case of harmonic sounds, it can be shown experimentally that spectral roll-off is related to the harmonic or noise cutoff frequency. The spectral roll-off also reveals an aspect of spectral shape as it is related to the brightness of a sound.
The odd-to-even harmonic energy ratio distinguishes sounds with a predominant energy at odd harmonics (such as the Guan) from other sounds with smoother spectral envelopes (such as the Suona). It is defined as:
Twelve time-varying statistics were calculated for the 54 parameters, including the maximum, minimum, mean, variance, standard deviation, interquartile range, skewness coefficient, and kurtosis coefficient, producing an objective acoustic parameter set containing 166 dimensions (see Table 6). In this paper, Timbre Toolbox [62] and MIRtoolbox [66] were used for feature extraction. The corresponding acoustic parameters were extracted from materials in the timbre database and the acquired data were used to construct a timbre perception feature model.
Table 6.
Acoustic parameters.
4.3. Experiment B: A Timbre Evaluation Experiment Based on the Method of Successive Categories
A subjective evaluation experiment was conducted in a standard listening room with a reverberation time of 0.3 s, which conforms to listening standards [59]. A total of 34 subjects (16 males) with a professional music background participated in the experiment. Their ages ranged from 18 to 35 and they had no history of hearing loss. The experimental subjective evaluation process was conducted as follows. Material fragments were played, and the subjects judged the psychological scale of the piece for each timbre perception feature (evaluation term) in sequence, scoring it on a nine-level scale. All experimental materials were played prior to the formal experiment to familiarize subjects with the samples in advance. This was done to assist each subject in mastering the evaluation criteria and scoring scale, reducing the discretization of evaluation data for the same sample. Each piece was played twice with an interval of 5 s and a sample length of 6–10 s. Each evaluation term was tested for 10 min, with a 15-min break every half hour.
The validity and reliability of data from these 34 samples were analyzed to calculate a correlation coefficient between the scores for each subject. The Euclidean distance between the evaluation terms was calculated using cluster analysis to identify the two subjects with the largest difference in each group. Some subjects may not have had a sufficient understanding of the purpose of the experiment. Data from these subjects were excluded and not used for subsequent timbre perception feature modeling. The method of successive categories was used to conduct a statistical analysis of the experimental data [67]. The theoretical basis for this approach assumes the psychological scale to be a random variable, subject to a normal distribution. The boundary of each category was not a predetermined value, but a random variable identified from the experimental data. The Thurstone scale was then used to process the data and produce a psychological scale for all timbre materials and each perception feature for modeling purposes. Figure 4 shows the resulting scale for 72 musical instruments in 5 timbre evaluation dimensions. In each image, the dotted line represents the average value of each instrument in the corresponding dimension.
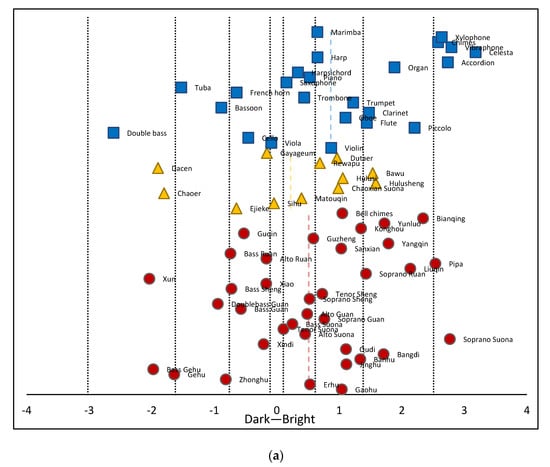
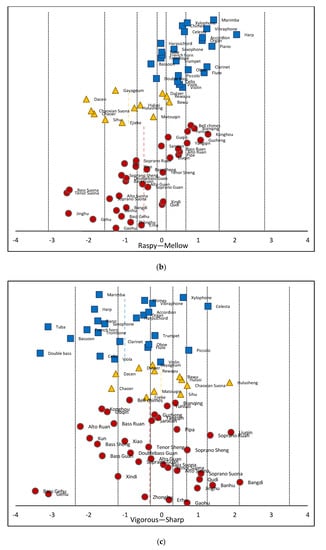
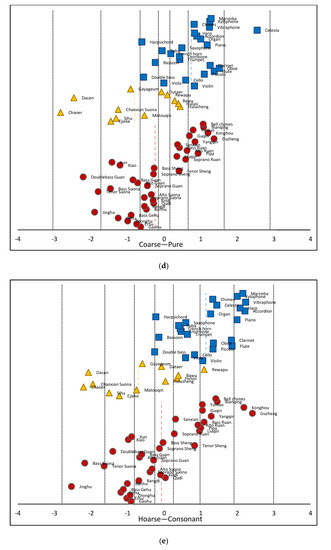
Figure 4.
A psychological scale of 72 musical instruments, including (a) bright/dark, (b) raspy/mellow, (c) sharp/vigorous, (d) coarse/pure, and (e) hoarse/consonant. The blue squares represent Western orchestral instruments, the yellow triangles represent Chinese minority instruments, and the red circles represent Chinese orchestral instruments. The dotted blue line represents the mean value of the Western orchestral instruments, the dotted yellow line represents the mean value of the Chinese minority instruments, and the dotted red line represents the mean value of the Chinese orchestral instruments.
It is evident from Figure 4 that the distribution of timbre values for Chinese instruments differed significantly from Western instruments. For example, raspy/mellow and hoarse/consonant exhibited drastically different scales. This suggested the timbre database containing Chinese instruments had a richer variety of timbre types than a conventional Western instrument database. In addition, the distribution of timbre samples in the five timbre evaluation scale pairs was relatively balanced. This suggested the proposed evaluation terminology was representative of multiple timbre types and could better distinguish the attributes of different instruments. These factors could help to improve the accuracy of timbre perception feature models.
4.4. Construction of a Prediction Model
In this study, multiple linear regression, support vector regression, a neural network, and a random forest algorithm were used to correlate objective parameters and subjective evaluation experimental data to construct a mathematical model of timbre perception features. Stepwise techniques were used for variable entry and removal in the multiple linear regression algorithm [68], and radial basis functions were selected as kernels for support vector regression [69]. A multi-layer perceptron was adopted in the neural network, which included a hidden layer [70]. Random forest is a common ensemble model consisting of multiple CART-like trees, each of which grows on a bootstrap object acquired by sampling the original data cases with replacements [71].
Before modeling, feature selection was conducted for the target attribute to be predicted. This process consisted of three steps:
- (1)
- Screening: removes unimportant or problematic predictors and cases.
- (2)
- Ranking: sorts remaining predictors and assigns ranks; this step considers one predictor at a time to determine how well it predicts the target variable.
- (3)
- Selecting: identifies the important subset of features to use in subsequent models.
During the modeling phase, 80% of the data were used for training and the remaining 20% were used for validation. The input to the model was a 166-dimensional objective parameter set and the output was the value of the five perception dimensions (bright/dark, raspy/mellow, sharp/vigorous, coarse/pure, and hoarse/consonant). Correlation coefficients were used to evaluate the accuracy of the model and represented the results of the correlation analysis between the model prediction data and subjective evaluation data, with higher coefficients representing a more accurate model.
The accuracy of prediction results for the four algorithms across the five perception dimensions are shown in Table 7. Figure 5 provides a histogram of the prediction accuracy in different dimensions. These experimental results suggested that the proposed technique provided valid predictions in each of the five dimensions. The algorithm exhibiting the best performance exceeded 0.9 for bright/dark, sharp/vigorous, coarse/pure, and hoarse/consonant sound types. The averaged results indicated that the neural network (0.915) and random forest (0.864) outperformed multiple linear regression (0.665) and support vector regression (0.670). The neural network was particularly accurate in its predictions of the five perception dimensions.
Table 7.
A comparison of the accuracies achieved by four algorithms.
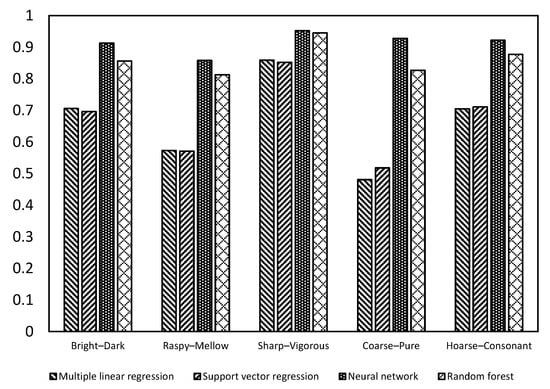
Figure 5.
A prediction accuracy histogram for the five perception attributes.
5. The Construction of Timbre Space
Multidimensional scaling (MDS) was used to construct a 3D timbre perception space to represent the distribution of 37 Chinese instruments more intuitively. Unlike many common analysis methods, MDS is heuristic and does not require assumptions about spatial dimensionality [72]. It also offers the advantages of visualization and helps to identify potential factors affecting the similarity between terms. The construction of a timbre space includes three steps:
- (1)
- Subjective evaluation experiment based on sample dissimilarity: where a dissimilarity matrix between samples was obtained using a subjective evaluation experiment. Existing research has conventionally paired up samples in the material database to score the dissimilarity. The process was simplified in this study, which reduced the workload.
- (2)
- Dimension reduction of distance matrix based on MDS: where the MDS algorithm was used to calculate the dissimilarity matrix such that sample distances in high-dimensional spaces can be represented in low-dimensional spaces (usually two or three dimensions).
- (3)
- Attribute interpretation of each dimension of timbre space: where the correlation between each dimension and the timbre perception features was analyzed using a statistical method. Interpretable attributes for each dimension were then acquired from this space.
The performance of multidimensional scaling algorithms depends on the sample dissimilarity matrix. In previous studies [51,52], this matrix was acquired using a subjective evaluation experiment that compared and scored the dissimilarity of any two samples. A total of n2/2 experiments must be conducted for n samples. This quadratic relationship significantly increases the computational complexity and runtime, which makes quantifying the dissimilarity more difficult. This paper presents an improved methodology in which a set of evaluation indicators were selected (as complete as possible) and all samples were successively scored with each indicator. These results constituted the feature vector for the sample and the distance to each vector was calculated to obtain the dissimilarity of all samples. The 16 timbre evaluation terms shown in Table 3 were used to assess the attributes of each dimension during the analysis phase.
The method of successive categories was then used to conduct a subjective evaluation experiment on timbre materials for 37 Chinese instruments (experiment C). Grade 9 was performed on 16 perception dimensions in Table 3 and the reliability and validity of the experimental data were analyzed. The Euclidean distance of the feature vectors was calculated, producing a dissimilarity matrix for 37 Chinese instruments. The MDS algorithm was used to process the timbre dissimilarity matrix and construct a 3D timbre perception space.
5.1. Experiment C: Subjective Evaluation Experiment Based on Sample Dissimilarity
Three factors were considered during sample selection to prepare the sound data needed in the subjective evaluation experiment [73]:
- (1)
- The appropriate number of samples: The number of samples must be sufficiently large to ensure the accuracy of the MDS algorithm and impose sufficient constraints on the model. In practice, however, it is difficult to establish precise rules for determining these data. However, empirical solutions do exist. In most MDS-based timbre studies, at least 10 sound samples are required for two-dimensional spaces and at least 15 sound samples are needed for three-dimensional spaces [51,74,75]. In this paper, 37 kinds of Chinese instruments were used as experimental materials, which ensured that sufficient constraints were provided to the MDS model.
- (2)
- The range of timbre variation: The range of timbre varies depending on the subject of the study, with larger instrumental variety (i.e., orchestral music) providing better data [34]. Models constructed in this way can be applied more broadly to new timbre samples. In this study, 37 kinds of Chinese instruments were selected. As can be seen from Figure 4, compared with Western instruments, Chinese instruments had a wider distribution range in terms of their timbre evaluation scale. As such, the Chinese instrument samples selected in this paper ensured a diverse range of timbre samples.
- (3)
- The uniformity of timbre sample distributions: The distribution of sound samples in each timbre perception attribute should be as uniform as possible. Timbre spaces are continuous perceptual spaces and a uniform distribution sample set is beneficial to the construction of continuous timbre spaces. Non-uniform sample distributions can degrade solutions to the MDS equations, preventing the structures between classes from being fully displayed [76]. As seen in Figure 4, the samples selected in this study covered a broad range of timbre attributes and they were distributed at varying psychological scales, providing a uniform distribution.
Subjective evaluation of the experimental environment and the subjects was conducted as in experiment B. The process was as follows: while playing each experimental sample, the subjects judged the psychological scale of the sample on 16 timbre perception features (timbre evaluation terms) in turn, scoring each on a 9-point scale.
5.2. The Construction of the 3D Timbre Space Using MDS
The reliability and validity processing method applied to the experimental data was the same as in experiment B. The processed data were averaged and the mean score for all subjects on each evaluation term was calculated for each sample. These data were then used to calculate the timbre dissimilarity, expressed in the form of a distance matrix. The MDS algorithm was adopted in this paper [77], which considers individual differences between subjects and assigns a corresponding weight to each score. This approach considers terms in every dimension and more fully utilizes the experimental data. Multidimensional scaling is based on dissimilarity analysis for two samples in a timbre attribute space, which can be expressed using a distance matrix as follows:
where represents the dissimilarity evaluation score for subject i assessing sounds j and k, represents the weight of subject i in the rth dimension, and represents the coordinates of sample k in the rth dimension.
Equation (8) was used to calculate the distance for 37 timbre feature vectors and the dissimilarity distance matrix for 37 samples. This matrix was used as input into the MDS algorithm. The number of timbre space dimensions was determined by referring to previous research results [51,52]. The timbre space dimension was determined in three dimensions using Kruskal’s stress function [78]. The coordinates of each sound sample in 3D timbre space were acquired by using MDS to reduce the dimensionality of the dissimilarity distance matrix (Figure 6).
Figure 6.
A 3D timbre space for 37 Chinese instruments.
5.3. Perception Attribute Analysis of the Timbre Space Dimension
The correlation between 16 timbre perception attributes was calculated to analyze the auditory attributes of each dimension in the timbre space. The coordinates of the samples were projected into three dimensions to obtain the spatial distribution of the data. Pearson correlation coefficients were calculated between each dimension and the 16 timbre perception attributes (Table 8). Further analysis suggested dimension 1 was positively correlated with the “bright” perception attribute and negatively correlated with “vigorous.” As such, dimension 1 could be defined as “bright/vigorous.” Dimension 2 was positively correlated with “hoarse” and negatively correlated with “consonant.” However, the correlation of dimension 3 was not as obvious, as it was only slightly correlated with “full/mellow.” Figure 6 suggests that different types of instruments were distributed at different positions in the timbre space, which could be used to categorize individual timbres.
Table 8.
The results of correlation analysis in 3D timbre space.
6. Conclusions
This study presented a novel methodology for the analysis and modeling of timbre perception features in musical sounds. The primary contributions can be summarized as follows:
- (1)
- A novel method was proposed for constructing two sets of timbre evaluation terminology systems in a Chinese context. Experimental results from a subjective evaluation showed that these terms could successfully distinguish timbre from different instruments.
- (2)
- A timbre material library containing 72 musical instruments was constructed according to relevant standards. A subjective evaluation experiment was conducted using the method of successive categories. The psychological scales of the subjects were acquired using five pairs of perceptual dimensions. A mathematical model of timbre perception features was then developed using multiple linear regression, support vector regression, a neural network, and the random forest algorithm. Experimental results showed that this constructed model could predict perceptual features for new samples.
- (3)
- An improved method for constructing 3D timbre space was proposed and demonstrated using the MDS algorithm applied to 37 Chinese instruments. Auditory perceptual attributes were determined by analyzing the correlation between the 3 dimensions of the timbre space and 16 perceptual attributes.
In future research, we will focus on the following three aspects of this study. First, supplemental sample materials will be acquired based on the existing timbre database. We will attempt to expand the variety and quantity of the data to improve the consistency and robustness of the model. Second, a subjective evaluation experiment, statistical analysis, and other techniques will be used to select timbre evaluation terms that accurately reflect the essential attributes of timbre to provide support for the construction of simple and effective timbre spaces. Third, the machine learning algorithm will be improved by including more subjective evaluation data. Additional correlation algorithms will also be tested to improve the accuracy of the model predictions. Finally, mathematical modeling will be implemented for each dimension in the timbre space. The distribution of other (i.e., Western) instruments will be compared to that of Chinese instruments to identify common patterns.
Author Contributions
Investigation, conceptualization, methodology, data curation, and writing (original draft, review, and editing): J.L.; project administration and supervision: W.J., Y.J., and S.W.; software, experimental process, and data processing: J.L. and X.Z. All authors have read and agreed to the published version of the manuscript.
Funding
This study was supported by the Key Laboratory Research Funds of Ministry of Culture and Tourism (WHB1801).
Conflicts of Interest
The authors declare no conflict of interest.
Appendix A
The timbre materials mentioned in Section 2.1 contains 72 instruments, including 37 Chinese orchestral instruments, 11 Chinese minority instruments, and 24 Western orchestral instruments (Table A1). The names of the Chinese orchestral instruments and Chinese minority instruments are given in their original languages (Chinese), with an accompanying English translation.
Table A1.
Instrument list.
Table A1.
Instrument list.
| Category | Type | Name of the Instrument | |||
|---|---|---|---|---|---|
| Chinese Orchestral Instruments (37) | Bowed Instrument (7) | 高胡 (Gaohu) | 二胡 (Erhu) | 中胡 (Zhonghu) | 革胡 (Gehu) |
| 低音革胡 (Bass Gehu) | 京胡 (Jinghu) | 板胡 (Banhu) | |||
| Wind Instrument (17) | 梆笛 (Bangdi) | 曲笛 (Qudi) | 新笛 (Xindi) | ||
| 高音笙 (Soprano Sheng) | 中音笙 (Tenor Sheng) | 低音笙 (Bass Sheng) | |||
| 高音唢呐 (Soprano Suona) | 中音唢呐 (Alto Suona) | 次中音唢呐 (Tenor Suona) | 低音唢呐 (Bass Suona) | ||
| 高音管 (Soprano Guan) | 中音管 (Alto Guan) | 低音管 (Bass Guan) | 倍低音管 (Doublebass Guan) | ||
| 埙 (Xun) | 箫 (Xiao) | 巴乌 (Bawu) | |||
| Plucked Instrument (10) | 小阮 (Soprano Ruan) | 中阮 (Alto Ruan) | 大阮 (Bass Ruan) | ||
| 柳琴 (Liuqin) | 琵琶 (Pipa) | 扬琴 (Yangqin) | 古筝 (Guzheng) | ||
| 古琴 (Guqin) | 箜篌 (Konghou) | 三弦 (Sanxian) | |||
| Percussion Instrument (3) | 编钟 (Bell chimes) | 编磬 (Bianqing) | 云锣 (Yunluo) | ||
| Chinese Minority Instruments (11) | Bowed Instrument (4) | 艾捷克 (Ejieke) | 四胡 (Sihu) | 马头琴 (Matouqin) | 潮尔 (Chaoer) |
| Wind Instrument (4) | 朝鲜唢呐 (Chaoxian Suona) | 葫芦笙 (Hulusheng) | 葫芦丝 (Hulusi) | 大岑 (Dacen) | |
| Plucked Instrument (3) | 热瓦普 (Rewapu) | 都塔尔 (Dutaer) | 伽倻琴 (Gayageum) | ||
| Western Orchestral Instruments (24) | Bowed Instrument (4) | Violin | Viola | Cello | Double bass |
| Woodwind Instrument (6) | Piccolo | Flute | Oboe | Clarinet | |
| Bassoon | Saxophone | ||||
| Brass Instrument (4) | Trumpet | Trombone | French horn | Tuba | |
| Keyboard Instrument (4) | Piano | Harpsichord | Organ | Accordion | |
| Plucked Instrument (1) | Harp | ||||
| Percussion Instrument (5) | Celesta | Vibraphone | Chimes | Xylophone | |
| Marimba | |||||
References
- Chen, X. Sound and Hearing Perception; China Broadcasting and Television Press: Beijing, China, 2006. [Google Scholar]
- Moore, B.C.; Glasberg, B.R.; Baer, T. A model for the prediction of thresholds, loudness, and partial loudness. J. Audio Eng. Soc. 1997, 45, 224–240. [Google Scholar]
- Meddis, R.; O’Mard, L. A unitary model of pitch perception. J. Acoust. Soc. Am. 1997, 102, 1811–1820. [Google Scholar] [CrossRef]
- Patel, A.D. Music, Language, and the Brain; Oxford University Press: Oxford, UK, 2010. [Google Scholar]
- ANSI S1.1-1994. American National Standard Acoustical Terminology; Acoustical Society of America: New York, NY, USA, 1994. [Google Scholar]
- Zwicker, E.; Fastl, H. Psychoacoustics: Facts and Models; Springer Science & Business Media: Berlin, Germany, 2013; Volume 22. [Google Scholar]
- Cermak, G.W.; Cornillon, P.C. Multidimensional analyses of judgments about traffic noise. J. Acoust. Soc. Am. 1976, 59, 1412–1420. [Google Scholar] [CrossRef]
- Kuwano, S.; Namba, S.; Fastl, H.; Schick, A. Evaluation of the impression of danger signals-comparison between Japanese and German subjects. In Contributions to Psychological Acoustics; Schick, A., Klatte, M., Eds.; BIS: Oldenburg, Germany, 1997; pp. 115–128. [Google Scholar]
- Iwamiya, S.-I.; Zhan, M. A comparison between Japanese and Chinese adjectives which express auditory impressions. J. Acoust. Soc. Jpn. (E) 1997, 18, 319–323. [Google Scholar] [CrossRef]
- Stepanek, J. Relations between perceptual space and verbal description in violin timbre. acústica 2004 Guimarães 2004, 077. [Google Scholar]
- Kim, S.; Bakker, R.; Ikeda, M. Timbre preferences of four listener groups and the influence of their cultural backgrounds. In Proceedings of the Audio Engineering Society: Audio Engineering Society Convention 140, Paris, France, 4–7 June 2016. [Google Scholar]
- Solomon, L.N. Semantic Approach to the Perception of Complex Sounds. J. Acoust. Soc. Am. 1958, 30, 421–425. [Google Scholar] [CrossRef]
- von Bismarck, G. Timbre of steady sounds: A factorial investigation of its verbal attributes. Acta Acust. United Acust. 1974, 30, 146–159. [Google Scholar]
- Pratt, R.L.; Doak, P.E. A subjective rating scale for timbre. J. Sound Vibrat. 1976, 45, 317–328. [Google Scholar] [CrossRef]
- Namba, S.; Kuwano, S.; Hatoh, T.; Kato, M. Assessment of musical performance by using the method of continuous judgment by selected description. Music Percept. 1991, 8, 251–275. [Google Scholar] [CrossRef]
- Ethington, R.; Punch, B. SeaWave: A system for musical timbre description. Comput. Music J. 1994, 18, 30–39. [Google Scholar] [CrossRef]
- Faure, A.; Mcadams, S.; Nosulenko, V. Verbal correlates of perceptual dimensions of timbre. In Proceedings of the 4th International Conference on Music Perception and Cognition, Montréal, QC, Canada, 14–15 August 1996. [Google Scholar]
- Howard, D.M.; Tyrrell, A.M. Psychoacoustically informed spectrography and timbre. Organised Sound 1997, 2, 65–76. [Google Scholar] [CrossRef]
- Shibuya, K.; Koyama, T.; Sugano, S. The relationship between KANSEI and bowing parameters in the scale playing on the violin. In IEEE SMC’99 Conference Proceedings. 1999 IEEE International Conference on Systems, Man, and Cybernetics (Cat. No.99CH37028); IEEE: Tokyo, Japan, 1999; Volume 4, pp. 305–310. [Google Scholar]
- Kuwano, S.; Namba, S.; Schick, A.; Hoege, H.; Fastl, H.; Filippou, T.; Florentine, M.; Muesch, H. The timbre and annoyance of auditory warning signals in different countries. In Proceedings of the INTERNOISE, Nice, France, 27–30 August 2000. [Google Scholar]
- Disley, A.C.; Howard, D.M. Timbral semantics and the pipe organ. In Proceedings of the Stockholm Music Acoustic Conference 2003, Stockholm, Sweden, 6–9 August 2003; pp. 607–610. [Google Scholar]
- Moravec, O.; Štepánek, J. Verbal description of musical sound timbre in Czech language. In Proceedings of the Stockholm Music Acoustic Conference 2003, Stockholm, Sweden, 6–9 August 2003; pp. SMAC–1–SMAC–4. [Google Scholar]
- Collier, G.L. A comparison of novices and experts in the identification of sonar signals. Speech Commun. 2004, 43, 297–310. [Google Scholar] [CrossRef]
- Martens, W.L.; Marui, A. Constructing individual and group timbre spaces for sharpness-matched distorted guitar timbres. In Proceedings of the Audio Engineering Society: Audio Engineering Society Convention 119, New York, NY, USA, 7–10 October 2005. [Google Scholar]
- Disley, A.C.; Howard, D.M.; Hunt, A.D. Timbral description of musical instruments. In Proceedings of the International Conference on Music Perception and Cognition, Bologna, Italy, 22–26 August 2006; pp. 61–68. [Google Scholar]
- Stepánek, J. Musical sound timbre: Verbal description and dimensions. In Proceedings of the 9th International Conference on Digital Audio Effects (DAFx-06), Montreal, QC, Canada, 18–20 September 2006; pp. 121–126. [Google Scholar]
- Katz, B.; Katz, R.A. Mastering Audio: The Art and the Science., 2nd ed.; Focal Press: Oxford, UK, 2007. [Google Scholar]
- Howard, D.; Disley, A.; Hunt, A. Towards a music synthesizer controlled by timbral adjectives. In Proceedings of the 14th International Congress on Sound & Vibration, Cairns, Australia, 9–12 July 2007. [Google Scholar]
- Barbot, B.; Lavandier, C.; Cheminée, P. Perceptual representation of aircraft sounds. Appl. Acoust. 2008, 69, 1003–1016. [Google Scholar] [CrossRef]
- Pedersen, T.H. The Semantic Space of Sounds; Delta: Atlanta, GA, USA, 2008. [Google Scholar]
- Alluri, V.; Toiviainen, P. Exploring perceptual and acoustical correlates of polyphonic timbre. Music Percept. 2010, 27, 223–242. [Google Scholar] [CrossRef]
- Fritz, C.; Blackwell, A.F.; Cross, I.; Woodhouse, J.; Moore, B.C. Exploring violin sound quality: Investigating English timbre descriptors and correlating resynthesized acoustical modifications with perceptual properties. J. Acoust. Soc. Am. 2012, 131, 783–794. [Google Scholar] [CrossRef]
- Altinsoy, M.E.; Jekosch, U. The semantic space of vehicle sounds: Developing a semantic differential with regard to customer perception. J. Audio Eng. Soc. 2012, 60, 13–20. [Google Scholar]
- Elliott, T.M.; Hamilton, L.S.; Theunissen, F.E. Acoustic structure of the five perceptual dimensions of timbre in orchestral instrument tones. J. Acoust. Soc. Am. 2013, 133, 389–404. [Google Scholar] [CrossRef]
- Zacharakis, A.; Pastiadis, K.; Reiss, J.D. An interlanguage study of musical timbre semantic dimensions and their acoustic correlates. Music Percept. 2014, 31, 339–358. [Google Scholar] [CrossRef]
- Skovenborg, E. Development of semantic scales for music mastering. In Proceedings of the Audio Engineering Society: Audio Engineering Society Convention 141, Los Angeles, CA, USA, 29 October–1 November 2016. [Google Scholar]
- Wallmark, Z. A corpus analysis of timbre semantics in orchestration treatises. Psychol. Music 2019, 47, 585–605. [Google Scholar] [CrossRef]
- Chen, K.-A.; Wang, N.; Wang, J.-C. Investigation on human ear’s capability for identifing non-speech objects. Acta Phys. Sin. 2009, 58, 5075–5082. [Google Scholar] [CrossRef]
- Herrera-Boyer, P.; Peeters, G.; Dubnov, S. Automatic classification of musical instrument sounds. J. New Music Res. 2003, 32, 3–21. [Google Scholar] [CrossRef]
- Bowman, C.; Yamauchi, T. Perceiving categorical emotion in sound: The role of timbre. Psychomusicol. Music Mind Brain 2016, 26, 15–25. [Google Scholar] [CrossRef]
- Gupta, C.; Li, H.; Wang, Y. Perceptual evaluation of singing quality. In 2017 Asia-Pacific Signal and Information Processing Association Annual Summit and Conference (APSIPA ASC); IEEE: Kuala Lumpur, Malaysia, 2017; pp. 577–586. [Google Scholar]
- Allen, N.; Hines, P.C.; Young, V.W. Performances of human listeners and an automatic aural classifier in discriminating between sonar target echoes and clutter. J. Acoust. Soc. Am. 2011, 130, 1287–1298. [Google Scholar] [CrossRef]
- Wang, N.; Chen, K.-A. Regression model of timbre attribute for underwater noise and its application to target recognition. Acta Phys. Sin. 2010, 59, 2873–2881. [Google Scholar]
- Blauert, J. Communication Acoustics; Springer: Berlin/Heidelberg, Germany, 2005; Volume 2. [Google Scholar]
- Jensen, K. Timbre Models of Musical Sounds. Ph.D. Thesis, Department of Computer Science, University of Copenhagen, Copenhagen, Denmark, 1999. [Google Scholar]
- Desainte-Catherine, M.; Marchand, S. Structured additive synthesis: Towards a model of sound timbre and electroacoustic music forms. In Proceedings of the International Computer Music Conference (ICMC99), Beijing, China, 22–28 October 1999; pp. 260–263. [Google Scholar]
- Aucouturier, J.J.; Pachet, F.; Sandler, M. “The way it sounds”: Timbre models for analysis and retrieval of music signals. IEEE Trans. Multimedia 2005, 7, 1028–1035. [Google Scholar] [CrossRef]
- Burred, J.; Röbel, A.; Rodet, X. An accurate timbre model for musical instruments and its application to classification. In Learning the Semantics of Audio Signals, Proceedings of the First International Workshop, LSAS 2006; Cano, P., Nürnberger, A., Stober, S., Tzanetakis, G., Eds.; Technische Informationsbibliothek u. Universitätsbibliothek: Athens, Greece, 2006; pp. 22–32. [Google Scholar]
- Wang, X.; Meng, Z. The consonance evaluation method of Chinese plucking instruments. Acta Acust. 2013, 38, 486–492. [Google Scholar]
- Sciabica, J.-F.; Bezat, M.-C.; Roussarie, V.; Kronland-Martinet, R.; Ystad, S. Towards the timbre modeling of interior car sound. In Proceedings of the 15th International Conference on Auditory Display, Copenhagen, Denmark, 18–22 May 2009. [Google Scholar]
- Grey, J.M. Multidimensional perceptual scaling of musical timbres. J. Acoust. Soc. Am. 1977, 61, 1270–1277. [Google Scholar] [CrossRef]
- McAdams, S.; Winsberg, S.; Donnadieu, S.; De Soete, G.; Krimphoff, J. Perceptual scaling of synthesized musical timbres: Common dimensions, specificities, and latent subject classes. Psychol. Res. 1995, 58, 177–192. [Google Scholar] [CrossRef]
- Martens, W.L.; Giragama, C.N. Relating multilingual semantic scales to a common timbre space, 2002. In Proceedings of the Audio Engineering Society Convention 113, Los Angeles, CA, USA, 5– 8 October 2002. [Google Scholar]
- Martens, W.L.; Giragama, C.N.; Herath, S.; Wanasinghe, D.R.; Sabbir, A.M. Relating multilingual semantic scales to a common timbre space-Part II. In Proceedings of the Audio Engineering Society Convention 115, New York, NY, USA, 10–13 October 2003. [Google Scholar]
- Zacharakis, A.; Pastiadis, K. Revisiting the luminance-texture-mass model for musical timbre semantics: A confirmatory approach and perspectives of extension. J. Audio Eng. Soc. 2016, 64, 636–645. [Google Scholar] [CrossRef]
- Simurra Sr, I.; Queiroz, M. Pilot experiment on verbal attributes classification of orchestral timbres. In Proceedings of the Audio Engineering Society Convention 143, New York, NY, USA, 18–21 October 2017. [Google Scholar]
- Melara, R.D.; Marks, L.E. Interaction among auditory dimensions: Timbre, pitch, and loudness. Percept. Psychophys. 1990, 48, 169–178. [Google Scholar] [CrossRef]
- Zhu, J.; Liu, J.; Li, Z. Research on loudness balance of Chinese national orchestra instrumental sound. In Proceedings of the 2018 national acoustical congress of physiological acoustics, psychoacoustics, music acoustics, Beijing, China, 9–12 November 2018; pp. 34–35. [Google Scholar]
- EBU – TECH 3253. Sound Quality Assessment Material Recordings for Subjective Tests. Users’ handbook for the EBU SQAM CD; EBU: Geneva, Switzerland, 2008. [Google Scholar]
- Alías, F.; Socoró, J.; Sevillano, X. A review of physical and perceptual feature extraction techniques for speech, music and environmental sounds. Appl. Sci. 2016, 6, 143. [Google Scholar] [CrossRef]
- Peeters, G. A large set of audio features for sound description (similarity and classification). CUIDADO IST Proj. Rep. 2004, 54, 1–25. [Google Scholar]
- Peeters, G.; Giordano, B.L.; Susini, P.; Misdariis, N.; McAdams, S. The timbre toolbox: Extracting audio descriptors from musical signals. J. Acoust. Soc. Am. 2011, 130, 2902–2916. [Google Scholar] [CrossRef] [PubMed]
- Pollard, H.F.; Jansson, E.V. A tristimulus method for the specification of musical timbre. Acta Acust. United Acust. 1982, 51, 162–171. [Google Scholar]
- Krimphoff, J.; McAdams, S.; Winsberg, S. Caractérisation du timbre des sons complexes. II. Analyses acoustiques et quantification psychophysique. J. Phys. IV 1994, 4, C5-625–C5-628. [Google Scholar] [CrossRef][Green Version]
- Scheirer, E.; Slaney, M. Construction and evaluation of a robust multifeature speech/music discriminator. In 1997 IEEE International Conference on Acoustics, Speech, and Signal Processing; IEEE Comput. Soc. Press: Munich, Germany, 1997; pp. 1331–1334. [Google Scholar]
- Lartillot, O. MIRtoolbox 1.7.2 User’s Manual; RITMO Centre for Interdisciplinary Studies in Rhythm, Time and Motion, University of Oslo: Oslo, Norway, 2019. [Google Scholar]
- Meng, Z. Experimental Psychological Method for Subjective Evaluation of Sound Quality; National defence of Industry Press: Beijing, China, 2008. [Google Scholar]
- Hodeghatta, U.R.; Nayak, U. Multiple linear regression. In Business Analytics Using R - A Practical Approach; Apress: Berkeley, CA, USA, 2017; pp. 207–231. [Google Scholar]
- Yeh, C.-Y.; Huang, C.-W.; Lee, S.-J. A multiple-kernel support vector regression approach for stock market price forecasting. Expert Syst. Appl. 2011, 38, 2177–2186. [Google Scholar] [CrossRef]
- Haykin, S.S. Neural Networks and Learning Machines., 3rd ed.; Pearson education: Upper Saddle River, NJ, USA, 2009. [Google Scholar]
- Witten, I.H.; Frank, E.; Hall, M.A.; Pal, C.J. Data Mining: Practical Machine Learning Tools and Techniques; Morgan Kaufmann Publishers, Inc.: San Francisco, CA, USA, 2016. [Google Scholar]
- Borg, I.; Groenen, P.J.; Mair, P. Applied Multidimensional Scaling; Springer Science & Business Media: Berlin/Heidelberg, Germany, 2012. [Google Scholar]
- Chen, K.-A. Auditory Perception and Automatic Recognition of Environmental Sounds; Science Press: Beijing, China, 2014. [Google Scholar]
- Susini, P.; McAdams, S.; Winsberg, S.; Perry, I.; Vieillard, S.; Rodet, X. Characterizing the sound quality of air-conditioning noise. Appl. Acoust. 2004, 65, 763–790. [Google Scholar] [CrossRef]
- Tucker, S. An Ecological Approach to the Classification of Transient Underwater Acoustic Events: Perceptual Experiments and Auditory Models; University of Sheffield: Sheffield, UK, 2003. [Google Scholar]
- Shepard, R.N. Representation of structure in similarity data: Problems and prospects. Psychometrika 1974, 39, 373–421. [Google Scholar] [CrossRef]
- Borg, I.; Groenen, P.J.F.; Mair, P. Variants of different MDS models. In Applied Multidimensional Scaling. SpringerBriefs in Statistics; Springer: Berlin/Heidelberg, Germany, 2013; pp. 37–47. [Google Scholar]
- Borg, I.; Groenen, P. Modern multidimensional scaling: Theory and applications. J. Educ. Meas. 2003, 40, 277–280. [Google Scholar] [CrossRef]
© 2020 by the authors. Licensee MDPI, Basel, Switzerland. This article is an open access article distributed under the terms and conditions of the Creative Commons Attribution (CC BY) license (http://creativecommons.org/licenses/by/4.0/).