Abstract
A compact multifrequency measurement system based on frequency-to-time mapping technology is proposed and experimentally demonstrated using an integrated frequency scanning signal generator. The relationship between the input microwave frequency and the time difference of a pair of pulses is established to realize the frequency information mapping to the time information. As a main part in the proposed frequency measurement system, the frequency-scanning signal is generated by heterodyning of two lasers with the monolithic integrated laser array, of which one is modulated on a saw-tooth signal. In the proposed frequency measurement system, it can measure single/multiple frequency microwave signals with a large bandwidth for high resolution and flexible tunable measurement range for multifrequency band. In the experimental demonstration, the single frequency measurement errors are less than 90 MHz within the measurement range from 4 to 12 GHz. For two-tone signal, the measurement resolution reaches about 150 MHz.
1. Introduction
The ultra-fast microwave frequency measurement with a broadband is significant for application in the electronic warfare system [1,2]. A traditional electrical frequency measurement system can realize an ultra-high resolution within a limited processing bandwidth. In order to increase the measurement bandwidth as well as reduce the volume of the hardware and the expense, numerous microwave photonic frequency measurement methods [1] including frequency-to-power mapping, photonics-assisted microwave channelization, and frequency-to-time mapping (FTM) have been demonstrated. The technique, where the frequency information is mapped to an optical/microwave power has been reported to implement the instantaneous frequency measurement [3,4,5,6]. The power ratio between dual-channel optical/microwave powers is established using an optical comb filter [3], an optical mixing unit [4], or a couple of dispersive delay elements [5,6] as frequency-dependent transfer function. The FPM-based technique can capture the instantaneous frequency in a wideband and high resolution (up to multi-MHz), but it cannot be used to measure the multitone signal. The channelization [1,7] has been developed based on space-division multiplexing, wavelength-division multiplexing, and time-division multiplexing. Although the instantaneous bandwidth is larger than hundreds of GHz, the resolution is vastly limited by the channel resolution. In [8,9,10,11], the FTM-based approaches to implement multiple-frequency measurement have been proposed using the optical time gate with the resolution up to hundreds of MHz. Recently, our group has proposed an FTM technique using frequency scanning Fourier domain mode-lock optoelectronic oscillator [11] to achieve a high-resolution single/multitone signal measurement. It is obvious that the multiple discrete devices used to set up the measurement system increase the cost and complexity of the frequency measurement system.
In this letter, a compact microwave multifrequency measurement system based on FPM is proposed and experimentally demonstrated using an integrated linear-frequency modulation (LFM) signal generator. For an unknown microwave signal, the frequency information is inversely mapped using the relationship between the input microwave frequency and time difference of a pair of pulses. As a main part, the LFM signal is generated by heterodyning of two lasers with a monolithic integrated laser array, where a saw-tooth signal is added to modulate on one of the two lasers. Using our proposed scheme, single/multitone microwave signal can be measured with the property of broadband and high resolution. The reconfiguration among multiple bands is easy to achieve by tuning the bias current of lasers. From the experimental results, a large microwave frequency measurement ranges from 4 to 12 GHz and a low measured error of 90 MHz is realized. Moreover, a measurement resolution for two-tone signal is approximately to 150 MHz.
2. Principle
The schematic diagram of the proposed microwave frequency measurement system is shown in Figure 1. The main part in the proposed structure is the LFM signal generation by heterodyning of the monolithic integrated laser array, which consists of four distributed feedback (DFB) lasers and an array waveguide grating, is demonstrated in our reported reference [12]. The laser array is beaten at a photodetector after amplifying via the erbium-doped optical fiber amplifier. As reported in [13], the performance of the laser array can be realized by loading the bias current to ground-signal-ground electrode port as well as direct current (DC) to thermal tuners electrode port. In [12], DFB1 and DFB2 in one integrated transmitter module are used to generate the microwave signal. When a saw-tooth signal is injected to modulate the DC1, DFB1 can realize the wavelength linear scanning. After detection at a photodiode, the LFM signal is generated, of which the duration time and bandwidth are totally determined by the repeat frequency and amplitude of the saw-tooth signal. The frequency-scanning performance of the LFM signal can be obtained by calculating the real-time frequency distribution of the generated LFM signal using short-time Fourier transform (STFT). After down-conversion with an unknown microwave signal received by the antenna, a pair of pulses is recorded in the oscilloscope after passing through the low-pass filter.
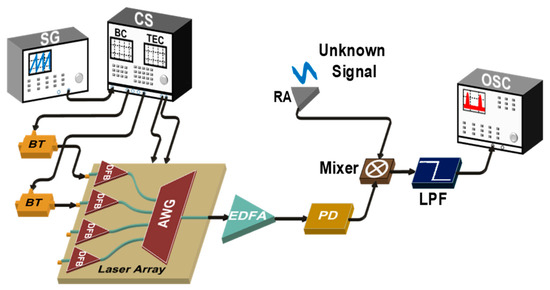
Figure 1.
Experimental setup. CS: current source, SG: signal generator, DFB: distributed feedback laser, BT: bias-tee, BC: bias current; TEC: thermoelectric coolers; AWG: array waveguide grating, EDFA: erbium-doped optical fiber amplifier, PD: photodetector, RA: received antenna, LPF: low-passband filter, OSC: oscilloscope.
As shown in Figure 1, the received unknown microwave signal in Figure 2a and the frequency-to-time relationship curve of the generated LFM signal based on the monolithic integrated laser array in Figure 2b are passed into the mixer to generate the frequency down-conversion signal. A portion of down-conversion signal between the received unknown microwave signal and the frequency-scanning signal is filtered by the low-pass filter. Therefore, a pair of optical pulses can be observed at the output of low passband filter shown in Figure 2c. The principle of the proposed microwave signal frequency measurement system based on FTM is shown in Figure 2d when a pair of beat-notes is filtered. The beat-note between the unknown microwave signal and the frequency scanning signal is matched with the passband of the low passband filter. The relationship between the frequency of input microwave signal in the frequency domain and the time difference ΔT of optical pulses in the time domain is established, which is used to achieve the FTM. For a single-tone microwave signal, when a portion of the beat-note frequency signal is recorded in the oscilloscope, the beat-note frequency is expressed as
where is the frequency of the generated LFM signal. As shown in Figure 2d, a pair of pulses can be observed at the output of the low passband filter in one sweep period, where one pulse is the beat-note signal between the input microwave signal and the positive chirp rate section of the generated LFM signal, the other comes from the beat-note signal between the input microwave signal and the negative chirp rate section of the generated LFM signal. The down-conversion frequency at the output of the low passband filter can be written as
where and is the exact time when the filtered frequency is measured by the oscilloscope. Therefore, the FTM relationship is established as
where is the time difference between double pulses. From Equation (3), the frequency of the unknown signal is related to the time difference between double pulses. Therefore, the frequency of unknown signal in the frequency domain can be obtained via the time difference in the time domain.
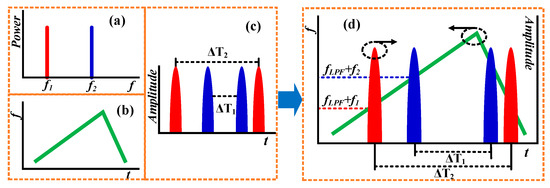
Figure 2.
(a) The two-tone unknown signal from the received antenna, (b) the frequency-to-time relationship of the linear frequency modulation (LFM) signal by the heterodyning of two lasers, (c) a pair of pulses for two-tone signal can be recorded at the output of the low passband filter, (d) the principle based on the frequency information mapping to the time information.
3. Results and Discussion
The experiment based on the setup shown in Figure 1 was carried out. The low passband filter has a 3-dB bandwidth of 150 MHz and the suppression ratio of 20 dB. As a main component in the LFM signal generator, the InP-based (Indium phosphorus) laser array was designed and then fabricated in Fraunhofer HHI (Berlin, Germany) with the chip size of 4 × 6 mm. Four DFB lasers combine within an array waveguide grating, where four pair of electrodes are orderly arranged on the vertical direction of the device. The fabrication as well as the package is described in detail in our reported reference [12] and does not repeatedly demonstrate our previous work in the FTM-based frequency measurement system. Here, it focuses on the FTM-based frequency measurement method for measuring single-tone signal and two-tone signal with a high resolution over a large bandwidth.
In the experiment, the optical module was kept at 25 °C controlled by thermoelectric cooler. The bias currents of DFB1 and DFB2 were fixed at 68 and 30 mA, respectively. The direct current from the controller (ILX Lightwave LDC-3724C, California, CA, USA) and an electrical signal from the pulse function arbitrary generator (Agilent Technologies 81150A, Woburn, MA, USA) was used to drive the DFB1 to achieve the precise wavelength tuning with a period of 18 KHz and a peak-to-peak voltage of 4 V. An erbium-doped optical fiber amplifier (JDS Uniphase, Santa Rosa, CA, USA) was used to amplify the light wave with a tunable gain and a noise figure of 3.3 dB. Double amplified light waves with an output power of 6.2 dBm is heterodyne detection at a photodiode (HP 11982A, Santa Rosa, CA, USA) with a 3-dB bandwidth of 15 GHz and a photoelectric conversion efficiency of 300 V/W. Thus, a frequency scanning microwave signal was generated at the output of photodiode. In the frequency measurement experiment, we assume that a microwave signal from a vector network analyzer (R&S ZVA40) acting as an unknown signal is down-conversion with the generated frequency-scanning microwave signal at the mixer. The beat-note pulse was selected after a low passband filter and observed in the oscilloscope.
For the LFM signal generation, an 18 KHz saw-tooth driving signal was added to the DFB1 to realize wavelength scanning and a fast frequency scanning microwave signal can be generated by heterodyning of two lasers as demonstrated in our reported reference [12]. The frequency scanning performance in one period is shown in Figure 3a. The period approached 55 and the frequency scanning range is from 3.5 to 12.5 GHz by calculating the real-time frequency distribution of the generated LFM signal at the output of photodiode using STFT. As shown in Figure 3a, a saw-tooth signal is modulated on one laser, but the generated triangular-shape LFM consists of positive chirp rate region and negative chirp rate region which results from the relaxation oscillation of the laser. It is reported that the chirp-rate of the LFM signal rather than the waveform of the driving signal limits the measurement error [11].
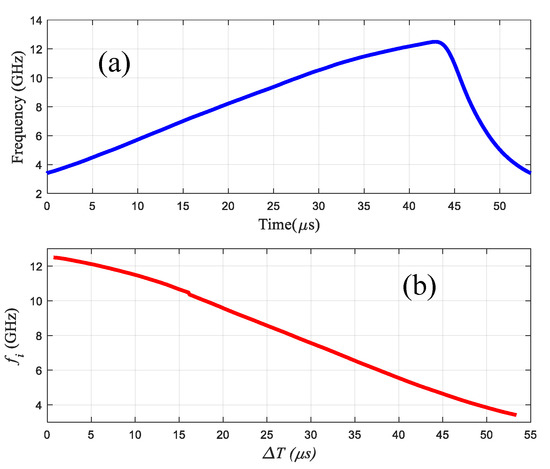
Figure 3.
(a) Measured frequency scanning property of the heterodyning with a scanning range from about 3.5 to 12.5 GHz. (b) The relationship between the frequency of the unknown signal and the time difference.
The down-conversion microwave signal between the input microwave signal and the generated frequency scanning signal by heterodyning of two lasers with the laser array, which includes two optical pulses with different pulse widths, was recorded by the oscilloscope. A negative FTM database between the time difference of a pair of pulses and the frequency of microwave signal was set up as shown in Figure 3b. Through these operations, the FTM relationship was achieved and then the unknown microwave frequency measurement can be looked up through the FTM database by measuring the time different between two pulses. For an unknown signal, a pair of optical pulses was recorded in the oscilloscope and the time difference was calculated to inversely map the unknown microwave signal frequency using the FTM-based relationship shown in Figure 3b. The microwave frequency measurement range ranged from 3.5 to 12.5 GHz depending on the LFM signal performance.
A microwave signal from the vector network analyzer acted as unknown signal with the output power of 5 dBm and the frequency of 5 GHz was injected into the mixer to demonstrate the single-frequency performance of the frequency measurement system. The recorded pulse in a single period on the oscilloscope is shown in Figure 4a. As shown in Figure 4a, the duration of the right pulse is shorter than the left pulse. It results from the positive slope of the frequency scanning less than the negative slope in one period as shown in Figure 3a. The real-time frequency distribution of the pulse is shown in Figure 4b using STFT. From Figure 4b, the time difference between a pair of pulses is achieved clearly. By measuring the time difference, the frequency of the unknown microwave signal can be calculated using the FTM relationship shown in Figure 3b.
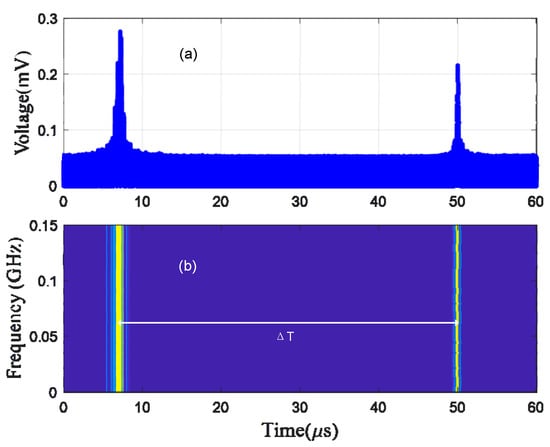
Figure 4.
Measured result for a single frequency microwave signal at 5 GHz. (a) Measured waveform on the oscilloscope. (b) Corresponding instantaneous frequency and time relationship using STFT.
Figure 5a–e shows the recorded unknown signal in the oscilloscope, where the frequency is set as 4–12 GHz with 2 GHz frequency space. The time difference between a pair of pulses was calculated by the STFT as shown in Figure 5f–j. The microwave frequency was measured by the time information inversely mapping to the frequency information in Figure 3b. The input microwave power for our proposed frequency measurement system should be larger than −15 dBm, which is mainly limited by noise floor of the frequency measurement system as well as the efficiency of the frequency mixing between the input microwave signal and the generated frequency scanning signal. The minimum input power of the unknown microwave signal can be further improved by incorporating an electrical amplifier. Besides, the maximum power is up to 20 dBm which is dependent on the 1-dB compression point of the mixer. Hence, the linear dynamic range can be further enhanced by reducing the noise and optimizing the component of the proposed frequency measurement system.
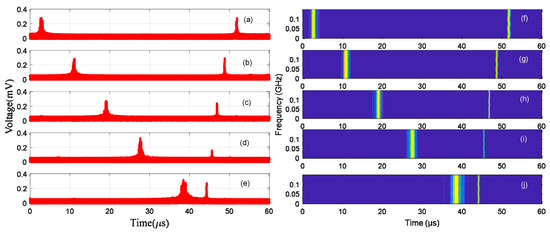
Figure 5.
Frequency measurement results for single-frequency microwave signal at 4, 6, 8, 10, and 12 GHz. (a–e) Measured waveform on the oscilloscope. (f–j) Corresponding instantaneous frequency and time relationship using STFT.
When the single-frequency microwave signal ranging from 4 to 12 GHz injects into the microwave frequency measurement system, the measurement frequencies and measurement errors at different frequencies are calculated as the result shown in Figure 6a,b. The frequency measurement range is from 4 to 12 GHz, which depends on the frequency scanning range generated by heterodyning of two lasers. Our proposed frequency measurement range can be extended to 15 GHz and even above by increasing the driving voltage. The maximum measured bandwidth is theoretically limited by the bandwidth of photodiode as well as the mixer. The measurement errors for the single-frequency microwave signal in Figure 6b are less than 90 MHz, which mainly comes from the resolution of the oscilloscope and the ambiguity of time difference after STFT. A higher accuracy can be obtained with the higher slope of frequency-to-time function in Figure 3a [11] as well as precise temperature control to fix one wavelength. Besides, in order to degrade the measured error, the FTM relationship in Figure 3b can be acquired by doing statistics over many measurements.
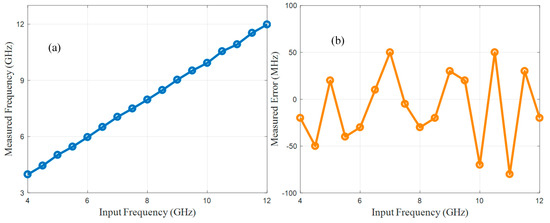
Figure 6.
Frequency measurement results (a) and errors (b) for different frequency microwave signals.
The wavelength stability of the laser array is closely related to the operating temperature. The fluctuation of operating temperature would result in the wavelength change of the laser array and then the frequency of beat-note signals subsequently changing after the heterodyning detection of two lasers. Besides, the overheated laser chip is vulnerable to burn out in the case of nonuse of the thermal control. As we all know, the wavelength of laser varies with the temperature approximately 0.2 nm/°C and then the thermal control accuracy reaches to 4 × 10⁻⁵ °C/MHz. When the home-made temperature control circuit is about 10−4 °C in our laboratory, the wavelength stability is theoretically 2.5 MHz.
Multifrequency measurement based on the proposed microwave frequency measurement system was also verified. Two-tone signal at 5 and 5.3 GHz from two signal generators are combined using an electrical power combiner and then injected into the electrical mixer. The pulses from the output of the low passband filter are shown in Figure 7a and its real-time frequency distribution is calculated using STFT as the result shown in Figure 7b. The frequencies of unknown signals were mapped using the FTM relationship with the time differences ≈ and . The frequency measurement accuracy for multiple frequencies based on the proposed frequency measurement system was also demonstrated. The fixed frequency was set as 5 GHz and the other frequency was changed from 5.1 to 5.3 GHz with a frequency step of 0.05 GHz, where the measured results are shown in Figure 8a–e. The time differences with different frequency spaces are calculated in Figure 8f–j after the STFT. From the results in Figure 8f–j, we can know that the frequencies of two-tone cannot be clearly distinguished when the frequency space less than 100 MHz. From Figure 7b, we can find that two peaks are close to each other and the 3-dB bandwidth of the recorded two-tone signal is approximately double the 3-dB bandwidth of the single-frequency signal. As the frequency space increases, the measured microwave signal is obviously separated into two lines. Hence, the resolution of the proposed frequency measurement system for two-tone microwave signal is about 150 MHz. The measurement accuracy for two-tone is determined by the bandwidth of the electrical filter as well as the chirp-rate of the generated frequency-scanning microwave signal [11]. A higher chirp-rate by increasing the microwave frequency bandwidth can lead into a lower measurement error. Besides, a narrower electrical filter, which is 150 MHz in our experiment, can be expected to improve the measurement accuracy.
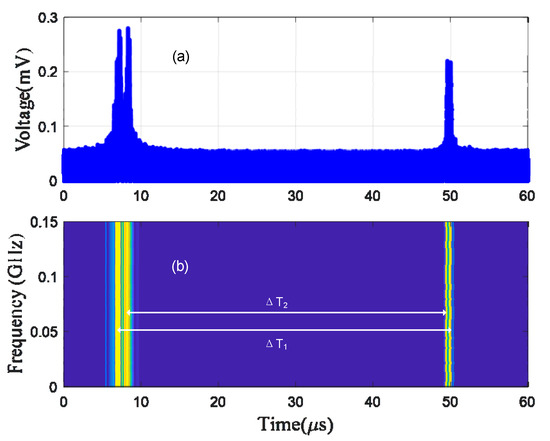
Figure 7.
Measured result for two-tone microwave signal at 5 and 5.3 GHz. (a) Measured waveform for two-tone signal in the oscilloscope. (b) Corresponding instantaneous frequency and the time relationship.
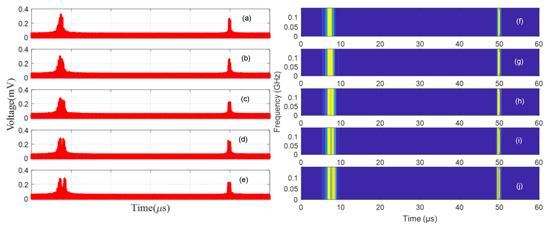
Figure 8.
Measured results for two-tone microwave signal as one fixed at 5 GHz and the other from 5.1 to 5.3 GHz with 0.05 GHz frequency step. (a–e) Measured waveform on the oscilloscope. (f–j) Corresponding instantaneous frequency and the time relationship.
4. Conclusions
A frequency measurement system based on frequency-to-time mapping was proposed to realize the ultra-fast multifrequency measurement. A relationship between the unknown signal and the time difference of two optical pulses was established with the assist of a frequency scanning heterodyne approach. The unknown microwave frequency was inversely mapped by FTM relationship. The proposed frequency measurement system can measure single frequency signal as well as multiple frequency signals with a wideband, high resolution, and small compact. The frequency measurement range ranged from 4 to 12 GHz with the measurement error less than 90 MHz. Meanwhile, two-tone microwave signal was also measured with the resolution less than 150 MHz. The proposed method to measure frequency information in time domain with the help of partly integrated heterodyning technology provides an alternative for microwave frequency measurement in radar and electronic warfare systems.
Author Contributions
Conceptualization and methodology, N.S.; software, T.H.; validation, N.S.; resources, M.L., W.L. and N.Z.; writing—original draft preparation, N.S.; writing—review and editing, N.S.; visualization, N.S.; supervision, N.S.; project administration, N.S.; funding acquisition, N.S. All authors have read and agreed to the published version of the manuscript.
Funding
This research was funded by the National Key R&D Program of China (2018YFB2201802) and the National Natural Science Foundation of China under 62075212, 61705217.
Conflicts of Interest
The authors declare no conflict of interest.
References
- Zou, X.; Lu, B.; Pan, W.; Yan, L.; Stöhr, A.; Yao, J. Photonics for microwave measurements. Laser Photon Rev. 2016, 10, 711–734. [Google Scholar] [CrossRef]
- Pan, S.; Yao, J. Photonics-Based Broadband Microwave Measurement. J. Light. Technol. 2017, 35, 3498–3513. [Google Scholar] [CrossRef]
- Lu, B.; Pan, W.; Zou, X.; Luo, B.; Yan, L.; Liu, X.; Xiang, S. Photonic Frequency Measurement and Signal Separation for Pulsed/CW Microwave Signals. IEEE Photon Technol. Lett. 2013, 25, 500–503. [Google Scholar] [CrossRef]
- Fandino, J.; Munoz, P. Photonics-based microwave frequency measurement using a double-sideband suppressed-carrier modulation and an InP integrated ring-assisted Mach–Zehnder interferometer filter. Opt. Lett. 2013, 38, 4316–4319. [Google Scholar] [CrossRef] [PubMed]
- Tu, Z.; Wen, A.; Gao, Y.; Chen, W.; Peng, Z.; Chen, M. A Photonic Technique for Instantaneous Microwave Frequency Measurement Utilizing a Phase Modulator. IEEE Photonics Technol. Lett. 2016, 28, 2795–2798. [Google Scholar] [CrossRef]
- Li, Y.; Pei, L.; Li, J.; Zheng, J.; Wang, Y.; Yuan, J.; Tang, Y. Instantaneous microwave frequency measurement with improved resolution. Opt. Commun. 2015, 354, 140–147. [Google Scholar] [CrossRef]
- Ma, Y.; Liang, D.; Peng, D.; Zhang, Z.; Zhang, Y.; Zhang, S.; Liu, Y. Broadband high-resolution microwave frequency measurement based on low-speed photonic analog-to-digital converters. Opt. Express 2017, 25, 2355–2368. [Google Scholar] [CrossRef] [PubMed]
- Nguyen, T.A.; Chan, E.H.W.; Minasian, R.A. Instantaneous high-resolution multiple-frequency measurement system based on frequency-to-time mapping technique. Opt. Lett. 2014, 39, 2419–2422. [Google Scholar] [CrossRef] [PubMed]
- Shi, J.; Zhang, F.; Ye, X.; Yang, Y.; Ben, D.; Pan, S. Photonics-based dual-functional system for simultaneous high-resolution radar imaging and fast frequency measurement. Opt. Lett. 2019, 44, 1948–1951. [Google Scholar] [CrossRef] [PubMed]
- Zhou, F.; Chen, H.; Wang, X.; Zhou, L.; Dong, J.; Zhang, X. Photonic Multiple Microwave Frequency Measurement Based on Frequency-to-Time Mapping. IEEE Photonics J. 2018, 10, 1–7. [Google Scholar] [CrossRef]
- Hao, T.; Tang, J.; Li, W.; Zhu, N.; Li, M. Microwave photonics frequency-to-time mapping based on a Fourier domain mode locked optoelectronic oscillator. Opt. Express 2018, 26, 33582–33591. [Google Scholar] [CrossRef]
- Shi, N.; Hao, T.; Li, W.; Zhu, N.; Li, M. Dual-Functional Transmitter for Simultaneous RF/LFM Signal Using a Monolithic Integrated DFB Array. IEEE Photonics Technol. Lett. 2020, 32, 239–242. [Google Scholar] [CrossRef]
- Song, Q.; Tang, J.; Shi, N.N.; Li, W.; Zhu, N.H.; Li, M. Monolithic integrated 4 × 25 Gb/s transmitter optical subassembly at 1.55 µm. Optics Commun. 2019, 441, 160–164. [Google Scholar] [CrossRef]
Publisher’s Note: MDPI stays neutral with regard to jurisdictional claims in published maps and institutional affiliations. |
© 2020 by the authors. Licensee MDPI, Basel, Switzerland. This article is an open access article distributed under the terms and conditions of the Creative Commons Attribution (CC BY) license (http://creativecommons.org/licenses/by/4.0/).