Featured Application
With the development of artificial intelligence, Internet technology, smart exercise equipment, and smart wearable devices, more and more people are becoming willing to use these technologies for exercise, whether out of curiosity or because they want to use them for scientific fitness. At the same time, many non-invasive static human data acquisition devices have become commonplace, and many hospitals and communities are already using them. The smart health system that we designed can easily process the in-exercise and non-exercise data collected by the above two ways. The system, which includes a mobile application, website, cloud server, smart wearable device, and other platforms, generates personalized prescriptions for users by learning the data. The system also includes many functions for public health, and exercise prescription is just one module of it.
Abstract
Using absolute intensity methods (metabolic equivalent of energy (METs), etc.) to determine exercise intensity in exercise prescriptions is straightforward and convenient. Using relative intensity methods (heart rate reserve (%HRR), maximal heart rate (%HRmax), etc.) is more recommended because it is more personalized. Taking target heart rate (THR) given by the relative method as an example, compared with just presenting the THR value, intuitively providing the setting parameters for achieving the THR with specific sport equipment is more user-friendly. The objective of this study was to find a method which combines the advantages (convenient and personalized) of the absolute and relative methods and relatively avoids their disadvantages, helping individuals to meet the target intensity by simply setting equipment parameters. For this purpose, we recruited 32 males and 29 females to undergo incremental cardiopulmonary exercise testing with cycling equipment. The linear regression model of heart rate and exercise wattage (the setting parameter of the equipment) was constructed for each one (R2 = 0.933, p < 0.001), and the slopes of the graph of these models were obtained. Next, we used an iterative algorithm to obtain a multiple regression model (adjusted R2 = 0.8336, p < 0.001) of selected static body data and the slopes of participants. The regression model can accurately predict the slope of the general population through their static body data. Moreover, other populations can guarantee comparable accuracy by using questionnaire data for calibration. Then, the predicted slope can be utilized to calculate the equipment’s settings for achieving a personalized THR through our equation. All of these steps can be assigned to the intelligent system.
1. Introduction
Exercise intensity refers to the amount of force exerted during an action and the degree of tension in the body. It is one of the main factors that determines exercise load and has a great stimulating effect on the human body. There are positive dose–response health/fitness benefits that result from increasing exercise intensity [1]. Appropriate exercise intensity can effectively promote bodily functions, thereby enhancing physical fitness. If the intensity of exercise is too high, it will reduce bodily functions and even cause sports injuries. Determining the exercise intensity is key to obtaining exercise benefits (improvement of cardiorespiratory fitness (CRF), muscular strength and endurance, flexibility, body composition, neuromotor fitness, etc.) and is one of the core steps in generating personalized exercise prescriptions [2].
There are many effective exercise intensity calculation methods that can be used to formulate personalized exercise prescriptions [1]. Absolute methods (oxygen uptake (VO2), metabolic equivalent of energy (METs), etc.), relative methods (heart rate reserve (%HRR), maximal heart rate (%HRmax), maximal oxygen uptake (%VO2max), etc.), and actual energy expenditure (EE) are commonly used. Although the absolute method can easily provide the exercise items necessary for achieving the target intensity (such as a comparison table of physical activity intensity [3,4]), it does not consider an individual’s CRF level, age, physiology differences, health status, living habits, or other personal factors. Thus, when estimating exercise intensity, the result may be too high or too low [5,6], leading to misclassification of exercise intensity [7,8,9], and the recommended exercise is unreasonable. Therefore, it is more often recommended to use relative methods to formulate exercise prescriptions under the guidelines issued by the American College of Sports Medicine [9,10], but the relative methods also have shortcomings. Relative methods do not directly give the specific exercise to achieve the target intensity but indirectly express the exercise intensity through other indicators. Among them, the commonly used %HRR method, the oxygen uptake reserve (VO2R) method, the %HRmax method, and the %VO2max method obtain exercise intensity in terms of target heart rate (THR) and target VO2R, but the exercise wattage (amount of exercise) required by different individuals to reach a specific THR or target VO2R is different, which is affected by multiple factors such as gender, height, and weight.
Exercise prescriptions are used to guide the public to exercise. For most ordinary exercisers who perform exercise prescriptions, their exercise knowledge is relatively limited, or they do not have with smart wearable devices. Prescriptions for these types of persons that define intensity only in terms of THR or target VO2R for exercise often result in the exerciser having difficulty understanding the meaning of the prescription and then performing it with an inappropriate intensity. Users will still encounter these problems when using exercise prescriptions for the first time, even if they have the knowledge and devices. In the current Chinese society, sports equipment has become popular, especially indoor electronic sports equipment. Not only do many communities provide free sports equipment for residents to use, but also, each family spends more on purchasing such equipment. Compared to traditional sports such as running and dancing, the use of sports equipment is more controllable because of the fewer external factors (such as running road conditions and dancing types). Therefore, the manner in which to combine sports equipment to accurately achieve target exercise intensity has become more important.
This study used a linear regression model to find the relationship between heart rate and exercise wattage (because we changed the exercise load by adjusting the setting parameters (wattage) of the equipment) and describes the relationship with the slope S of the model’s graph. Afterward, we used statistics and machine learning methods to predict the slope S through static human body data. Then, when generating a prescription, we used the predicted slope S and the THR obtained by the relative intensity method, combined with the resting heart rate (RHR) and HRmax (Fox-HRmax, Tanaka-HRmax, etc.), to determine the wattage of the bicycle equipment (spinning). This was calculated using Equation (1) as follows:
We collected data such as anthropometric data, cardiac and vascular function indicators, body composition, and bone density. These are universal human indicators that can reflect cardiovascular health, heart and lung capacity, skeletal muscle system, etc. We tried many commonly used multiple regression models (e.g., random forest and elastic net), and then selected the best one.
Using absolute methods is convenient and fast, but it is not personalized enough, while using relative methods is personalized but relatively complex and risky to operate. The method proposed by us combines the advantages of the two methods and relatively avoids their disadvantages. Based on the personalized THR obtained by using the relative method, our method can predict the input parameters of specific equipment (wattage for the smart cycling equipment) required to reach THR through static body data that can be used by exercisers conveniently. However, training and optimization of the model proposed in our method will remain ongoing through the interconnection of the data of the modules, such as electronic fitness equipment, intelligent systems, and smart wearable devices. Therefore, a closed loop of data acquisition, data learning, model optimization, and results presentation was formed.
2. Materials and Methods
2.1. Participants
This study was carried out at the Institute of Intelligent Machines, Chinese Academy of Sciences, Hefei, China. This study was approved by the Ethics Committee of the Hefei Institutes of Physical Science, Chinese Academy of Sciences (No. Y-2018-29). Participants were recruited through social media, advertisements in public places, and word of mouth. Sixty-one participants (aged 24–58 years) volunteered to participate in the study (32 males and 29 females), comprised of college students, scientific researchers, young and middle-aged white-collar workers, retired people, etc. All participants were informed about the study and signed a written informed consent form prior to participation. They had no contraindications for long-term or strenuous exercise, and none of them had experience in executing exercise prescriptions given by professionals or intelligent systems for a long time before the experiment. Their weekly exercise time and intensity was irregular.
2.2. Experimental Protocol
The experiment was scheduled to take place at least two hours after a meal (10:00 to 12:00 in the morning or 2:30 to 4:30 in the afternoon), maintaining the same ambient temperature (25 °C) and avoiding any sports 24 h before the test and try to maintain a static rest state between a meal and the start of the test. Using the maximum load (W-max) formula proposed by Wasserman et al. [11], we set the grading load experiment according to 20%, 40%, 50%, 70%, 85%, 100% of the W-max, and the load power of the bicycle ergometer (manufacturer: Lode BV Medical Technology, the Netherlands. IEC 60601-1. REF no. 960912) was intermittently adjusted from low to high until the participant was exhausted. This kind of experimental equipment, like many types of civilian cycling fitness equipment, uses wattage to adjust the exercise load, except that it is more expensive and more complicated. Exercise duration of each level was 3 min, as was the interval between each level, specifically measuring exercise heart rate. If a participant was unable to complete the 3-min test, the data could not be used until the heart rate had stabilized, and data which could not reach this stabilization were discarded. Each participant’s RHR (wattage is 0, 0% of W-max) was used with the heart rate and power data of each level to construct a linear regression model of heart rate and wattage and to obtain the slope S of the graph of the linear model.
2.3. Measured Features and Statistical Analysis
We chose to use static human body data (non-exercise (Non-Ex) data) to predict the slope S, which is much more convenient than obtaining the slope S directly from a cardiopulmonary exercise test. Before the experiment, the static human body data were collected for each participant. Then, the relevant questionnaires were carried out, including lifestyle, medical history, family history, and others. Pearson correlation analysis on the slope S was performed for all quantifiable features (all data in Table 1) except for the questionnaire data. The features were arranged from high to low in the Pearson correlation to form a feature matrix. The data of the 61 participants were divided into a training set (50 participants) and a test set (11 participants), and it was ensured that there was no significant difference in the main features of the two sets, such as gender and age.

Table 1.
Static human body data for the participants according to sex. Values refer to mean ± standard deviation (SD).
2.4. Algorithm Design
The algorithm (for the training set) can automatically select the best feature set from the feature matrix mentioned in Section 2.3 and can then analyze the related performance through multiple iterations. The specific steps are as follows:
- Select the i-th feature in the feature matrix as the j-th feature of the regression model for machine learning (i and j both start at 1).
- Perform multiple regression models to predict the slope S.
- Use the leave-one-out method to verify and save the adjusted R2 value of the model.
- Select another feature (i + 1) from the feature matrix and then perform steps 1–3 until all of the features in the feature matrix have been traversed.
- Select the feature with the best predictive effect, and then delete the selected features from the feature matrix. Add another feature (j + 1) of the regression model and repeat steps 1–4.
- Continue to add new features until the adjusted R2 value of the model drops for two consecutive time; then, the iteration is terminated.
We performed this algorithm separately for the linear regression, random forest, elastic net, polynomial regression, ridge regression, and lasso regression. Depending on the data in the iterations, we analyzed the performance of each model, selected the model with the best prediction effect, and determined the final feature set.
3. Results
Twenty-eight percent of the participants completed all six levels, 52% completed five levels, and the rest completed less than five levels. Half of the participants who achieved less than five levels were middle-aged, with an average age of 38.9 years. Therefore, they may have been affected by the degree of subjective coordination or other unknown subjective and objective factors that could lead to a lower level of completion.
3.1. Linear Regression Model of Heart Rate and Wattage
The data of different load levels and RHR were used one-by-one to construct a linear regression model for each participant. For each individual’s data, one single level of data was randomly selected as the test set, and the rest of the levels were used as the training set for the model. The average R2 value of all of the individuals’ models was 0.979, the standard deviation was 0.019, and the average p-value was 5.64 × 10⁻⁴. This shows that the linear regression model has high prediction accuracy, so the use of the univariate slope S can describe the graphic characteristic of the model well and can determine the required exercise load wattage. Then, we included all levels of data (regardless of training or test set) to reconstruct the model for each person. The slope S of the model’s graph was obtained from each participant (mean value = 0.684, standard deviation = 0.139, median = 0.678, maximum = 0.95, minimum = 0.441). The slope S was used as a dependent variable for training and validation by the model described later.
3.2. Feature Matrix and Regression Algorithm Analysis
3.2.1. Model Selection and Feature Analysis
In the process of using the iterative method to filter the features for predicting the slope S, the p-value obtained by each iteration of each model was much less than 0.001. The features finally selected by each model are shown in Figure 1. The adjusted R2 value and the selected feature of each model in the iteration are shown in Figure 2 and Table 2. Compared to several other models, the ridge regression achieved the largest adjusted R2 value and the smallest prediction error at the end of the iteration, so it was selected as the prediction model. Figure 2 shows that the adjusted R2 value reached the highest when the ridge regression model was iterated to four features. Based on the above situation, a final feature set of four features was selected to predict the slope S: the waist-to-hip ratio (WHR), grip strength (GS), left lower limb muscle (LLLM), and bone strength index (STI). However, we can easily find that the final set of four features is not the combination that achieves the highest correlation with the slope, which seems unreasonable. This is actually because the algorithm that we propose is result-oriented. The algorithm tried a huge number of feature combinations to select the one with the highest predictive accuracy, regardless of whether the combination of features made sense. For example, the algorithm selects LLLM but not RLLM, which is easy to cause doubts. However, such a result is just because we can obtain better prediction results through LLLM by the existing experimental data. This does not mean that LLLM be more important than RLLM. The accuracy of using RLLM is only slightly lower than that of using LLLM. This difference may be due to differences in population or dominant feet. Thus, the choice of LLLM and RLLM mainly depends on the equipment that the individual already owns. Of course, we can also put forward a new feature (lower limb muscle) to remove people’s doubts and make the result easier to figure out. The lower limb muscle (LLM) is the mean of LLLM and RLLM, which makes a lot more sense since, in cycling, the average power is generated by the average power of the two legs. The method of integrating features is also applicable to other pairs of body data that distinguish between right and left.
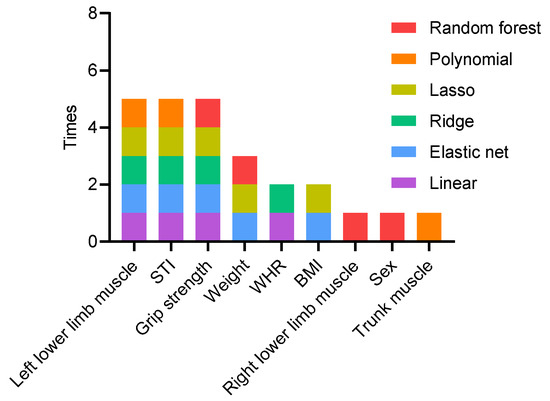
Figure 1.
Features used when each model was iterated to the optimal.
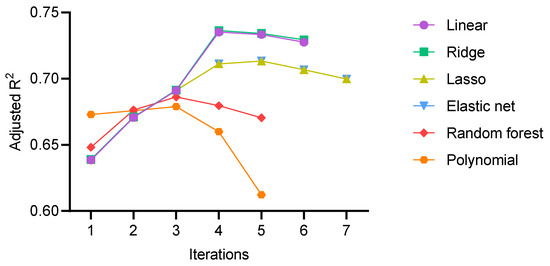
Figure 2.
In each iteration, all of the remaining features in the matrix were traversed to obtain the best prediction result. The plot shows how the adjusted R2 of the various models changed as features were iteratively added.
Table 2.
Feature selected by each model in each iteration.
3.2.2. Ridge Regression Model Analysis
The adjusted R2 was 0.7363, the root-mean-square error (RMSE) was 0.068, the p-value was , which was obtained by the leave-one-out method when the final feature set and regression model were determined, and the mean absolute error of each individual was 0.054 ± 0.041 (since the slope S is a ratio, we used the absolute error instead of the relative error). Eight of them had an absolute error greater than 0.1 and an average of 0.126.
We used the questionnaires filled out by participants and exercise experimental data to find the key factors that cause large errors (see Table 3). In the experimental data of these eight individuals, some individuals had an exhaustive heart rate that was more than 15 bpm lower than the HRmax calculated by the formula but had completed at least five levels of load. This shows that their cardiopulmonary exercise ability is stronger than that of the same type of people, and that the highest experimental level can no longer make them reach the HRmax. However, this situation may not be reflected through the collected static human body data, and it was not covered in the questionnaire either. There were also individuals whose exhausted heart rate was 15 bpm or more than 15 bpm lower than the maximum HRmax calculated by the formula and their completed load level was less than five. The load level they accomplished was lower and their exhausted heart rate was far from the theoretical HRmax, indicating that there may be other influencing factors in the experiment, such as poor subjective cooperation of the participants or errors in the experimental data collected. These are problems with exercise experimental data, indicating that the slope S obtained by linear regression of those individuals may deviate from the true value. Using an inaccurate slope S as the dependent variable to train the multiple regression model would undoubtedly cause a large error. In other individuals, some had fatty livers (which has a certain impact on exercise ability [12]), and some never exercised. The information obtained from the questionnaire shows that the static body data in the feature matrix used are not comprehensive enough and are only applicable to normal people, which may cause large errors. After excluding individuals with large errors, the model was re-trained, and the adjusted R2 was 0.8336, the RMSE was 0.049, the p-value was , and the average prediction absolute error was 0.041 ± 0.028.
Table 3.
Features of the samples with high prediction errors mined from existing questionnaires and exercise data.
Finally, the following regression equation was obtained:
We substituted the test set data into the equation and achieved an adjusted R2 of 0.7068 and a p-value of . Then, relying on the information reflected in the lifestyle questionnaire and the experimental data, we eliminated two cases of large error data. The adjusted R2 value after correction was 0.8247, the p-value was , and the predicted value was significantly correlated with the measured value, which shows that the above formula can predict the slope S of the general population. The scatter plots of the training and test sets are shown in Figure 3.
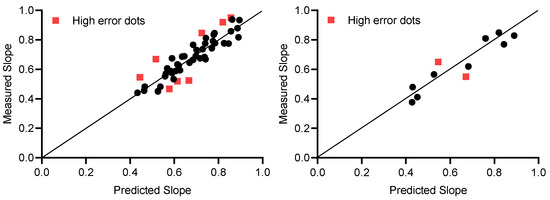
Figure 3.
The slope obtained by the prediction and the slope measured in the experiment. Training set on the left, test set on the right.
4. Discussion
This research proposed a new idea that uses static human body data (input of the model) to predict the slope (output of the model) through the machine learning model. Then, we can use the Equation (1) to easily figure out the parameters of the cycling equipment required to reach the THR. We use wattage here only because most smart cycling equipment uses it as the input parameter (although there are other examples, such as the speed of treadmills and rowing machine). If MPH is going to be an input parameter for most smart cycling equipment in the future, then the slope we need might be in terms of heart rate and MPH.
For wattage prediction, we focused on verifying our ideas and the model’s concepts. The purpose of this was not only to determine the final specific regression Equation (2), because in our main scenario (intelligent health system), a high-performance computer coupled with network technology can efficiently use and optimize the model, without the need of specific regression formulas. Our study showed that the slope could be accurately predicted through the static data we had, and that the predicted results could be further optimized through the key information obtained from the questionnaire, so as to expand the applicable scope of the model. After the model training is completed, using slope can help exercisers reach the target intensity accurately without the need for smart wearable devices. In daily use, the exerciser only needs to enter the predicted wattage into the smart cycling equipment to reach the target intensity. Of course, we certainly encourage people who are able to utilize wearable devices to use them because, in this way, we can obtain more in-exercise data. These data also do not require exercisers to observe and record. The device automatically uploads data when it is connected to the network. These data can be utilized to continuously optimize our models to provide better services.
Our method is relatively complex. It requires specific static body data monitoring equipment, rather than directly and continuously monitoring heart rate to reach exercise intensity. However, our method has specific usage scenarios because, among Chinese exercisers who use cycling equipment, only some people use exercise prescriptions. They obtained their prescriptions from professional departments, so they could easily obtain the static body data when they visit. Then, they can use our method without buying this equipment (body composition analyzer, an ultrasonic bone density meter, and other equipment). Other exercisers who did not utilize exercise prescriptions exercised more casually, lacked exercise knowledge, or even did not know what THR is. Even if they have a smart watch, they may be unable to accurately and scientifically use it to reach the THR. For those exercisers who have the ability to use a wearable device to reach the intensity without our method, they are more likely to suffer sports injuries during exercise, especially when they implement prescriptions for the first time because exercisers need to continue to pay attention to the changes in the heart rate data of the wearable device and whether the data remains stable throughout the exercise. When exercisers engage in exercises of moderate intensity or above, a lack of concentration can easily to cause sport injuries. On the other hand, many exercisers are not even sure if they can maintain their THR heart rate and complete the recommended exercise time. In this case, the exerciser may feel palpitation, chest tightness, cramps, and so on during the exercise, which also may cause sport injuries.
When the training set was initially set to 35 samples, the adjusted R2 was 0.63, while the adjusted R2 was 0.71 after excluding high error samples from the questionnaires or experimental data. In the process of continuous iteration, it was found that with an increase in the number of training samples, the adjusted R2 gradually increased and the model improved. At the same time, the regression equation obtained by the iteration constantly changed. The equation parameters obtained in this study were the optimal choices under the existing data volume. Although the selected features changed, they were mainly concentrated in the data such as body composition, bone density, and anthropometrics (see Figure 1). The features in the figure are strongly related to the slope S, and the slope S can be predicted accurately.
Cardiopulmonary fitness (aerobic capacity) is of great significance in basic medicine, clinical medicine, and sports medicine research. The body composition index is related to exercise ability, exercise habits, cardiopulmonary fitness, etc. [13,14,15]. On the other hand, there are some studies that show that bone density has similar characteristics [16,17,18]. Improving exercise habits through scientific exercise can improve exercise ability and cardiorespiratory health, which is accompanied by improvements in body composition and bone density. Moreover, the relationship between body composition and bone density to exercise ability and cardiorespiratory health can also be reflected in some people with diseases [19,20,21]. The above results are consistent with our research: the slope S reflected the exercise ability at a specific heart rate, which was capable of evaluating a person’s cardiorespiratory fitness (aerobic capacity). Thus, the slope S it is also closely related to body composition, bone density, and anthropometric data.
We constructed a dynamic machine learning closed loop consisting of smart wearable devices, human body data measurement devices, and Internet-based intelligent systems, which eventually became an important module in the entire smart health system (see Figure 4). This closed loop was gradually put into operation, continuously collecting data. Since the system had only just been put into operation, we only obtained a small amount of data; however, the data we did collect confirmed our ideas. With an increase in the number of users and daily usage, relevant static human body data, questionnaire data, and exercise data will be continuously input into the machine learning model that we built. In this way, not only the accuracy of the model will be continuously improved, but also the key factors that cause large prediction errors will be continuously found from the questionnaire. Among the above factors, definite positive or negative ones can be used to roughly calibrate the predicted results, resulting in a wider range of users for the model. However, on the one hand, the existing questionnaire types are relatively insufficient. This is because it is not completely clear which type of data obtained from the questionnaires will affect the results of the prediction. The impact factor of one of the eight large error samples could not be found from the sport experimental data and the existing questionnaire data. The reason for this may be the inherent prediction error of the model itself, but it is more likely that the positive and negative impact factors that cause the large error have not been discovered. On the other hand, a lot of information in the questionnaire is therefore difficult to quantify. This type of information is often described by adjectives such as yes/no, high/medium/low, and mild/moderate/severe. Since such data cannot be input into the machine learning model, they can only be used for a rough calibration of results. A positive factor means an increase in the predicted value, while a negative one reflects a reduction (the fourth and fifth rows of Table 3), but the amount that needs to be calibrated cannot be accurately determined. This requires us to continue to optimize the questionnaire and to find a suitable quantitative method in follow-up work. For some positive and negative factors, we found that there are some offsetting phenomena. For example, one participant in our exercise test had received systematic physical training before. Although he has fatty liver now, the prediction error was still within a reasonable range. With the increasing amount of data, it will be proven whether this offset phenomenon really exists and the specific factors that can be offset will become clearer.
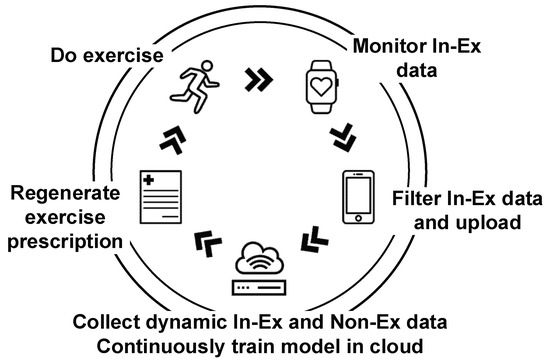
Figure 4.
The various parts of the closed loop containing the prediction model.
Moreover, our participants were all from Hefei, a city in Central China. For the global population, the final results may vary. We will build more models based on different exercise equipment in the next stage of our research. With the gradual improvement of our designed prescriptions, the threshold of the end users will be significantly reduced. Ultimately, the smart health system will solve the problem of shortage of sports science professionals and the high learning cost of exercise intensity execution, and it will also allow people to establish the habit of using exercise prescriptions for scientific fitness, which was the purpose of our research. We will try to join in-exercise (In-Ex) impact factor data (such as exercise pulse wave signal (photoplethysmography—PPG), exercise oxygen consumption, road conditions, weather, and wind speed) to study its effects. On the other hand, we also want to see if slope S can be used as a measure of the human body in the same way as HRmax and VO2max.
5. Conclusions
The slope S obtained by the linear regression model can determine the parameters of electronic sports equipment (cycling equipment) to achieve the target exercise intensity. The multiple regression model obtained by machine learning using body static data can achieve an accurate prediction of the slope S for the general population, and we can make the model applicable to more people by using our questionnaire to calibrate the results. Combined with the intelligent system, the model can be continuously trained, optimized, and will expand through cloud technology in the future.
Author Contributions
Conceptualization, Y.W., Z.M., and Y.S.; data curation, H.Z.; funding acquisition, Z.M. and Y.S.; investigation, H.Z.; methodology, Y.W.; project administration, Z.M. and Y.S.; software, Y.W. and Y.L.; supervision, Z.M.; validation, Y.L.; writing—original draft, Y.W.; writing—review and editing, Y.W. and Z.M. All authors read and agreed to the published version of the manuscript.
Funding
This research was funded by the major special project of the Anhui Science and Technology Department (grant number 18030801133), the Science and Technology Service Network Initiative (grant number KFJ-STS-ZDTP-079), and the key projects of the National Natural Science Foundation of universities in Anhui Province (grant number KJ2020A0112).
Acknowledgments
The authors would like to thank the participants and support personnel that took part in the study.
Conflicts of Interest
The authors declare no conflict of interest.
References
- Garber, C.E.; Blissmer, B.; Deschenes, M.R.; Franklin, B.A.; Lamonte, M.J.; Lee, I.M.; Nieman, D.C.; Swain, D.P. Amer Coll Sports M: Quantity and Quality of Exercise for Developing and Maintaining Cardiorespiratory, Musculoskeletal, and Neuromotor Fitness in Apparently Healthy Adults: Guidance for Prescribing Exercise. Med. Sci. Sports Exerc. 2011, 43, 1334–1359. [Google Scholar] [CrossRef] [PubMed]
- Thompson, P.D.; Arena, R.; Riebe, D.; Pescatello, L.S. ACSM’s New Preparticipation Health Screening Recommendations from ACSM’s Guidelines for Exercise Testing and Prescription, Ninth Edition. Curr. Sports Med. Rep. 2013, 12, 215–217. [Google Scholar] [CrossRef] [PubMed]
- Butte, N.F.; Watson, K.B.; Ridley, K.; Zakeri, I.F.; McMurray, R.G.; Pfeiffer, K.A.; Crouter, S.E.; Herrmann, S.D.; Bassett, D.R.; Long, A.; et al. A Youth Compendium of Physical Activities. Med. Sci. Sports Exerc. 2018, 50, 246–256. [Google Scholar] [CrossRef] [PubMed]
- Ainsworth, B.E.; Haskell, W.L.; Herrmann, S.D.; Meckes, N.; Bassett, D.R.; Tudor-Locke, C.; Greer, J.L.; Vezina, J.; Whitt-Glover, M.C.; Leon, A.S. 2011 Compendium of Physical Activities. Med. Sci. Sports Exerc. 2011, 43, 1575–1581. [Google Scholar] [CrossRef] [PubMed]
- Mezzani, A.; Hamm, L.F.; Jones, A.M.; E McBride, P.; Moholdt, T.; A Stone, J.; Urhausen, A.; A Williams, M. Aerobic exercise intensity assessment and prescription in cardiac rehabilitation: A joint position statement of the European Association for Cardiovascular Prevention and Rehabilitation, the American Association of Cardiovascular and Pulmonary Rehabilitation and the Canadian Association of Cardiac Rehabilitation. Eur. J. Prev. Cardiol. 2012, 20, 442–467. [Google Scholar] [PubMed]
- Swain, D.P. Energy cost calculations for exercise prescription: An update. Sports Med. 2000, 30, 17–22. [Google Scholar] [CrossRef] [PubMed]
- Ainsworth, B.E.; Haskell, W.L.; Leon, A.S.; Jacobs, D.R.; Montoye, H.J.; Sallis, J.F.; Paffenbarger, R.S. Compendium of physical activities–classification of energy costs of human physical activities. Med. Sci. Sports Exerc. 1993, 25, 71–80. [Google Scholar] [CrossRef] [PubMed]
- Ainsworth, B.E.; Haskell, W.L.; Whitt, M.C.; Irwin, M.L.; Swartz, A.M.; Strath, S.J.; O’Brien, W.L.; Bassett, D.R.; Schmitz, K.H.; O Emplaincourt, P.; et al. Compendium of Physical Activities: An update of activity codes and MET intensities. Med. Sci. Sports Exerc. 2000, 32, S498–S516. [Google Scholar] [CrossRef] [PubMed]
- Howley, E.T. Type of activity: Resistance, aerobic and leisure versus occupational physical activity. Med. Sci. Sports Exerc. 2001, 33, S364–S369. [Google Scholar] [CrossRef]
- Nelson, M.E.; Rejeski, W.J.; Blair, S.N.; Duncan, P.W.; Judge, J.O.; King, A.C.; Macera, C.A.; Castaneda-Sceppa, C. Physical Activity and Public Health in Older Adults: Recommendation from the American College of Sports Medicine and the American Heart Association. Med. Sci. Sports Exerc. 2007, 39, 1435–1445. [Google Scholar] [CrossRef]
- Wasserman, K.; Hansen, J.; Sue, D.Y.; Stringer, W.; Sietsema, K.; Sun, X.G.; Whipp, B.J. Principles of Exercise Testing and Interpretation: Including Pathophysiology and Clinical Applications, 10th ed.; Wolters Kluwer Health: Philadelphia, PA, USA, 2018. [Google Scholar]
- Duarte, S.M.; Rezende, R.E.; Stefano, J.T.; Perandini, L.A.; Dassouki, T.; Sa-Pinto, A.L.; Roschel, H.; Gualano, B.; Carrilho, F.J.; Oliveira, C.P. Impaired aerobic capacity and cardiac autonomic control in sedentary postmenopausal women with nonalcoholic fatty liver disease (NAFLD). J. Hepatol. 2015, 62, S733. [Google Scholar] [CrossRef]
- Chin, E.C.; Yu, A.P.; Lai, W.K.C.; Fong, D.Y.; Chan, D.K.; Wong, S.H.; Sun, F.-H.; Ngai, H.H.; Yung, P.S.H.; Siu, P.M. Low-Frequency HIIT Improves Body Composition and Aerobic Capacity in Overweight Men. Med. Sci. Sports Exerc. 2020, 52, 56–66. [Google Scholar] [CrossRef] [PubMed]
- McDaniel, B.B.; Naquin, M.R.; Sirikul, B.; Kraemer, R.R. Five Weeks of Aquatic-Calisthenic High Intensity Interval Training Improves Cardiorespiratory Fitness and Body Composition in Sedentary Young Adults. J. Sci. Med. Sport 2020, 19, 187–194. [Google Scholar]
- Wang, T.Y. Effects of High Intensity Circuit Training on Body Composition, Cardiopulmonary fitness and Metabolic Syndrome Markers in Middle Aged Male. Med. Sci. Sports Exerc. 2016, 48, 988–989. [Google Scholar] [CrossRef]
- Schwarz, P.; Jørgensen, N.R.; Nielsen, B.; Laursen, A.S.D.; Linneberg, A.; Aadahl, M. Muscle strength, power and cardiorespiratory fitness are associated with bone mineral density in men aged 31–60 years. Scand. J. Public Heal. 2014, 42, 773–779. [Google Scholar] [CrossRef]
- Scott, M.; Johannsen, N.M.; Welsch, M.A.; Credeur, D.P.; Church, T.S.; Ravussin, E.; Allen, J.D. Changes in Body Composition, Bone Mineral Density, Muscle Strength and Functional Ability following Exercise Training in Old Adults. Med. Sci. Sports Exerc. 2013, 45, 274. [Google Scholar]
- Ravnholt, T.; Tybirk, J.; Jorgensen, N.R.; Bangsbo, J. High-intensity intermittent “5-10-15” running reduces body fat, and increases lean body mass, bone mineral density, and performance in untrained subjects. Eur. J. Appl. Physiol. 2018, 118, 1221–1230. [Google Scholar] [CrossRef]
- Grabenbauer, A.; Grabenbauer, A.J.; Lengenfelder, R.; Grabenbauer, M.G.G.; Distel, L.V. Feasibility of a 12-month-exercise intervention during and after radiation and chemotherapy in cancer patients: Impact on quality of life, peak oxygen consumption, and body composition. Radiat. Oncol. 2016, 11, 42. [Google Scholar] [CrossRef]
- Hayashi, F.; Kaibori, M.; Sakaguchi, T.; Matsui, K.; Ishizaki, M.; Kwon, A.; Iwasaka, J.; Kimura, Y.; Habu, D. Loss of skeletal muscle mass in patients with chronic liver disease is related to decrease in bone mineral density and exercise tolerance. Hepatol. Res. 2017, 48, 345–354. [Google Scholar] [CrossRef] [PubMed]
- Youn, J.C.; Lee, S.J.; Lee, H.S.; Oh, J.; Hong, N.; Park, S.; Choi, D.; Rhee, Y.; Kang, S.-M.; Lee, S.-H. Exercise capacity independently predicts bone mineral density and proximal femoral geometry in patients with acute decompensated heart failure. Osteoporos. Int. 2015, 26, 2121–2129. [Google Scholar] [CrossRef]


Publisher’s Note: MDPI stays neutral with regard to jurisdictional claims in published maps and institutional affiliations. |
© 2020 by the authors. Licensee MDPI, Basel, Switzerland. This article is an open access article distributed under the terms and conditions of the Creative Commons Attribution (CC BY) license (http://creativecommons.org/licenses/by/4.0/).