Abstract
Induced seismicity is one of the negative phenomena caused by anthropogenic activities that include mining of minerals. This phenomenon manifests itself as sudden and unpredictable shocks of rock mass, which can cause surface deformation and damage to ground infrastructure. Until the advent of satellite radar interferometry that enables analysis of historical events, the characteristics of these unexpected surface deformations were difficult to assess. The main aim of the research was the spatial analysis of the geometry of surface displacements caused by eight induced tremors in the Rudna copper mine (SW Poland) and the dependence of deformation characteristics (vertical displacements, extent) on the induced shock energy. For this purpose, Sentinel-1 satellite imagery, the differential radar satellite interferometry (DInSAR) method and geographic information systems (GIS) based spatial statistics were used. Vertical displacements were mapped on the basis of 37 calculated interferograms. Spatial statistics on the pixel-to-pixel level were performed in the GIS Map Algebra environment. In the result, descriptive and spatial statistics characterizing deformations caused by individual shocks were calculated. The average values of vertical displacements ranged from −44 to −119 mm. Strong, statistical correlation between the extent, maximum vertical displacement, and energy values was determined. In addition, geometries of the formed deformation areas were analyzed and presented graphically. The results obtained in this research constitute development of a knowledge base on surface displacements caused by induced tremors in underground copper mining.
1. Introduction
Induced seismicity is a phenomenon that is directly or indirectly caused by industrial operations, such as mining of minerals, production of geothermal energy, underground storage of liquids and gases, extraction of conventional and unconventional hydrocarbons, construction of dams, and retention reservoirs. These technological processes change the stress distribution of the Earth’s crust and may cause seismic shocks. The mechanism of induced seismicity begins with anthropogenic activity in the rock mass or on its surface. Engineering works violate the natural state of equilibrium in the rock mass, which releases potential energy from the rocks. Then, part of this energy changes into seismic energy, which propagates from the focus of shock as elastic waves [1]. The resulting shocks can damage infrastructure, cause deformations on the surface of the earth, and pose danger to people. In our paper, we deal with terrain deformations that are the consequence of underground mining of minerals.
Induced seismicity and natural seismicity are the same in the form of surface vibrations. It would seem that the only differences between mining tremors and earthquakes are depth and energy of the event (magnitude). However, Zembaty [2,3] presented quantitative and qualitative differences in the context of surface effects, such as differences in size and intensity of shocks, differences in the duration of kinematic excitation, differences in the spectral properties of records of mining tremors and earthquakes, differences in peak values of ground movement, and differences between horizontal and vertical components of rock mass.
In recent years, there has been a significant increase in interest in induced seismicity by the scientific community, industry, government, as well as general society. The growing interest in this topic is due to the growing demand for energy and mineral resources [4]. To meet this demand, it is necessary to reach for (increasingly difficult to access) deposits. Complicated and complex mining conditions contribute to a greater number of induced shocks, which cause terrain deformations that, due to their usually unexpected nature, are difficult to detect with traditional surveying methods. Developments in space observation techniques make it possible, for the first time, to record the state of the surface before and after a seismic event and thus determine the resulting change. The process of the development of terrain deformations (the authors use the term as subsidence of the ground’s surface) resulting from seismicity induced by underground mining and characteristics (shape) of these deformations are not yet thoroughly investigated. The state of research in this area requires development to better understand the ground surface displacement process and to describe the geometry of the resulting terrain deformations.
Thus, the primary subject of this research is focused on spatial analysis of the geometry of terrain deformation area caused by induced shocks (tremors) on the case study of underground copper mining in Poland. In addition, the relationship of the terrain deformation characteristics (vertical displacement, extent) and the energy of induced shocks has been analyzed. For this purpose, Sentinel-1A/B data for eight different seismic events, differential radar satellite interferometry (DInSAR), and geographic information systems (GIS) have been used. The DInSAR method has the advantage over other geodetic techniques e.g., precise leveling, Global Navigation Satellite Systems (GNSS), as through continuous observation of earth surface at a given interval, it enables to use data recorded prior to unexpected in nature seismic events. Whereas, spatial statistic functions in GIS allow to combine and analyze statistically numerous datasets related to a seismic event.
Further description of the research in this paper has the following structure: presentation of the state of the knowledge in induced seismicity studies with InSAR methods, description of the study area, characteristics of the data and applied methodology, presentation, and discussion of results.
2. State of Knowledge
Many scientific papers have been published on the study of surface displacements caused by mining using geodetic and remote sensing methods [5,6,7,8]. However, Satellite Interferometric Synthetic Aperture Radar (InSAR)has become the leading method in this field [9]. InSAR data have been utilized to analyze, among other things, long term and short term deformations caused by mining activity [10,11,12,13,14,15]. The emergence of the European Space Agency’s Sentinel-1A/B satellite mission in 2014 enabled universal and open access to images from land and ocean surface observations. In the result, research using alternative to commercial spaceborne satellite radar interferometry data sources has been made possible to determine terrain deformations caused by induced shocks. Noteworthy studies in this field have been presented in Table 1.

Table 1.
Studies of terrain deformations caused by seismicity induced by underground extraction of resources using satellite radar interferometry.
In Poland, research focuses primarily on the underground exploitation of coal and copper, as induced seismic activity is associated with two mining centers: Upper Silesia Coal Basin and Legnica-Głogów Copper District [18,19,20,21,22]. However, internationally, the main areas of induced seismicity research focus on hydraulic fracturing used to extract gas and oil, e.g., in Oklahoma in the USA [23,24,25,27], and production of geothermal energy, e.g., Germany, and Iceland [16,17]. So far, induced tremors have been studied in order to determine the magnitude and location of terrain deformations, in relation to natural and technological conditions using satellite radar interferometry. Results of these studies [16,18,19,20,21,22,23,24,26,27] indicate that methods of satellite radar interferometry DInSAR, Small Baseline Subset (SBAS) method are suitable for detecting surface deformations measured in Line of Sight (LOS) of the satellite caused by induced seismicity. Up to now, the research on the geometry of surface deformations developed in the result of seismic events caused by underground mining and based on a large number of data has been limited. The presented studies investigate deformations caused primarily by a particular seismic event.
On the other hand, geographic information systems (GIS) provide tools for managing and processing various spatially referenced datasets and enable integration and modeling of the analyzed data. Apart from simple map overlay, spatial statistics, geodata mining and prediction methods, geographical information systems are used to augment studies of terrain deformations in mining areas. Table 2 shows notable examples of the use of GIS in research related to surface displacements caused by mining.
Table 2.
Studies of terrain deformations caused by mining utilizing geographic information systems.
The publications presented above concern mainly modelling and prediction of long-term surface displacements resulting from past and active mining. Geographic information systems analytical functions have been used for: assessing the impact of mining on the surface and surface infrastructure [30,31,32,33], time-spatial analysis of risks related to deformations [34,35,37], and to support public administration [29]. In addition, attempts were also made to identify and quantify the relationship between the location of terrain deformations and factors related to mining and geological conditions [28,36]. The hybrid (GIS and other) methods proposed in some cases were aimed at preparing preliminary data, which were then processed using GIS analytical functions, e.g., spatial regression methods to obtain the final result. In addition to using GIS to study displacements, this environment has been widely applied to assess the environmental impact of mining [38,39] and mineral resource management [40,41] as a leading analytical support system facilitating studies of mining influence on its surroundings. However, apart from mapping terrain deformations [34,35], GIS has not so far been extensively used to analyze surface displacements resulting from mining induced seismicity.
Thus, in our paper we investigate the characteristics of such terrain deformations based on a large number of datasets (8 seismic events and 37 maps of vertical displacements) and map algebra spatial statistics functions.
3. Study Area
The Rudna copper ore mine is located in the southwestern part of Poland in the Lower Silesian Voivodeship, north of the city of Polkowice. This underground mine is one of the seven mining fields forming the Legnica-Głogów Copper District. The Rudna mining terrain covers about 78 km2. The mines are operated by the KGHM Polish Copper S.A. Company. The general location of the mining area is shown in Figure 1.
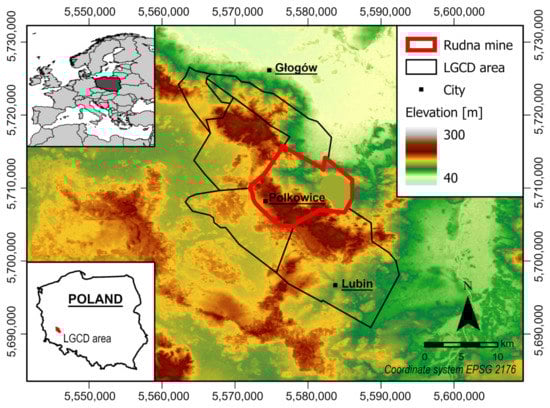
Figure 1.
Location of the Rudna underground copper ore mines (Poland), one of the largest underground copper mining operations in the world. Map background: Shuttle Radar Topography Mission (SRTM) Digital Elevation Model, resolution 30 m.
3.1. Geology and Tectonics
In terms of geology, the mine is located on the Fore-Sudetic Monocline (New Copper Basin), where the richest documented accumulation of copper in Poland has been documented (Figure 2).
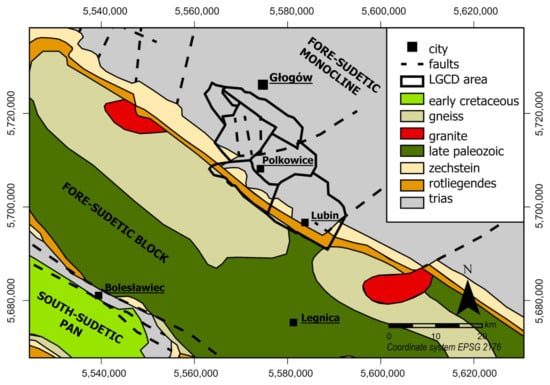
Figure 2.
Geology of the Fore-Sudetic area. Figure based on [42].
The depth of deposition of the copper orebody in the Rudna deposit ranges from 844 m up to 1250 m below the terrain surface. The deposit is made of sandstone ores (approximately 80% of resources), carbonate ores (approximately 15%) and copper-bearing shale constituting only 5% of total deposit mass [43]. The deposit layers have an north western–south eastern (North Western–South Eastern) extent according to the course of the monocline border with the Fore-Sudetic block and lean towards NE at an angle of 1° to 6° [44]. The southwestern part of the mining area is intersected by faults running east and north–east belonging to the Biedrzychowa fault line, extending from the Polkowice area [45]. Fault throw to the north–west range from 40 m to 140 m. The second most important dislocation named Paulinowa is located west of the shafts in western part of the mine. Paulinowa dislocation is a trough with a depth of 20 m to 30 m, parallel to the Biedrzychowa fault. Another dislocation covers the fault zone of the “Rudna Główna” in the southern part of the deposit area. It consists of bundles of faults forming strata and ditches with amplitudes ranging from several to 30 m. In addition to fault groups, there are single discontinuous dislocations with amplitudes of up to several meters.
3.2. Mining Operation
The Rudna operation is the largest copper ore mine in Europe and one of the largest underground mines of its kind in the world. The mine extracts copper ore from the Rudna deposit, part of the Sieroszowice deposit (15%), half of the Głogów Głęboki–Przemysłowy deposit and, to a small extent, a fragment of the Lubin-Małomice deposit [43]. The Rudna mine is distinguished by the largest thickness reaching up to several meters, with the average thickness of the deposit currently at the level of over 4 m. The mining of the deposit at the Rudna mine is carried out in three mining regions: Main Rudna, Western Rudna, Northern Rudna. The orebody is accessed through 10 shafts with depths of 941 m to 1244 m—3 mining, 4 ventilation, and 3 downhill-material. The mining process is carried out using chamber-pillar operation systems. Rudna is the most at risk of seismic activity among all the copper mines in the area, primarily due to the depth of mining.
3.3. Induced Seismicity
Over the years, the frequency of induced seismicity events in the Legnica–Glogów Copper District (LGCD) area has been increasing with the development of copper ore mining. Shocks registered here achieve high energy values (a magnitude above 4.0). These higher energy values of shocks are associated with the occurrence of clearly more durable ceiling rocks formed by anhydrites and dolomites. According to publicly available European Mediterranean Seismological Centre (EMSC) database, several dozen shocks occur annually in the LGCD area. In total, from January 2016 to July 2020, there were about 355 induced shocks [46]. A significant proportion of these events are weak shocks that are not felt by people and do not cause terrain deformation. The strongest shocks reaching magnitudes above 4 occur several times a year and are felt throughout the LGCD area. These high energy shocks are believed to cause surface subsidence over an area of several square kilometers and reaching several to a dozen or so centimeters [19,20]. Since 2016, 27 shocks with a magnitude above 4.0 have been recorded, nine shocks in 2016, six shocks in 2017, again, six shocks in 2018, four shocks in 2019, and, so far, two shocks in 2020.
4. Materials and Methods
In the analysis of terrain deformations caused by induced seismicity, eight events with magnitudes M ≥ 2.71 (by regional seismological station of the Polish Academy of Sciences) were investigated. These shocks occurred between 29 November 2016, and 7 February 2020, i.e., during the operation of the Sentinel-1A/B satellite missions. Six shocks occurred in the winter period, and two in the summer period. The highest magnitude of 3.75 was associated with two events, one on the 26 December 2017, and the other one 29 January 2019. The lowest magnitude 2.71 was associated with the event of 8 April 2017. The research methodology involved four main stages, which are presented on a scheme in Figure 3.
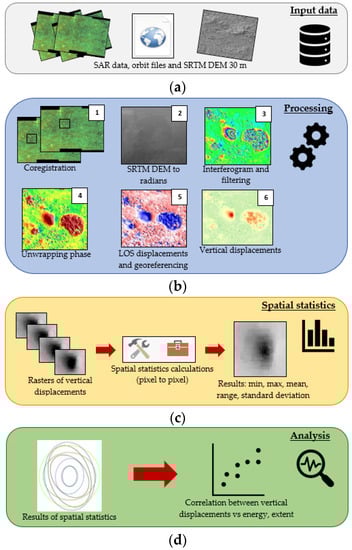
Figure 3.
Workflow of research consisting of four main stages: (a) collecting and preparing input data, (b) performing calculations using the DInSAR method, (c) descriptive and spatial statistics calculations, (d) analyzing the results in the context of deformation geometry characteristics.
To determine terrain displacements caused by these events satellite imagery of the European Space Agency Sentinel-1A/B mission were used. These twin satellites deliver new images of a given location on the Earth’s surface every 6 days. All of the data acquired by these satellites are available on the Alaska Satellite Facility (ASF). Data Search website [47]. For each of the analyzed seismic shocks, pairs of images were selected with a time interval of 6, 12, 18, or 24 days for ascending (73 track) and descending (22 track) orbits, with the first image recorded before the event and the second after. In addition, files specifying the precise position of the satellites in orbit and Shuttle Radar Topography Mission (SRTM) Digital Elevation Model of 30 m resolution were used.
The above input data were then used in the second stage to calculate the terrain displacements with differential satellite radar interferometry (DInSAR). The DInSAR method was developed by [48,49,50] and is widely used for detecting displacements caused by, among other things: landslides [51,52], earthquakes [53,54,55], mining exploitation [56,57], volcano eruption [58,59], and glacier motion [60,61]. This method is a development of the classic InSAR method and enables the determination of relative terrain deformations based on two radar scenes that were acquired by satellites at different times for a given place on the Earth’s surface. Satellite measurement is based on sending an electromagnetic wave towards the Earth, which after reflection from the earth returns to the satellite. The shift in the wave phase recorded in subsequent satellite passes indicate displacement towards the satellite’s line of sight (LOS) [62].
Calculations were performed in the GMT5SAR program [63] and began with coregistration of image pairs. For each pair, the master image being the scene registered earlier. Each master image in a given pair came from the closest available date before the shock occurred. In the next step, an interferogram was generated, i.e., the phase difference of the electromagnetic waves coiled in 2π cycles, was obtained. Then, the difference between the interferogram and SRTM in radians was calculated. Through this operation, the component responsible for the topography of the examined area was eliminated from the data. To improve the quality of the differential interferogram, data filtration (Gaussian filter) was performed to remove noise. In the final step of this stage unwrapping of the phase was performed, which allows reconstruction of the full signal from the differential interferogram. The phase unwrapping was completed in the SNAPHU program using the minimum cost flow method (MCF) [64]. Based on the results of phase unwrapping, Line of Sight (LOS) displacements of terrain were generated and given the WGS-84 reference system.
The LOS displacement raster has been resampled to a pixel dimension of 20 × 30 m. Using the GMT5SAR program, three components of the view geometry were determined (i.e., look vectors: horizontal north–south and east–west, vertical up–down) to calculate the incidence angle for each pixel representing the area of deformation. Based on the geometrical relationships between the Sentinel-1A/B satellites orbit and the measured point on the Earth’s surface, the incidence angle was determined using the Formula (1) [65]:
where:
- is incidence angle;
- is horizontal north–south of look vector;
- is horizontal east–west of look vector;
- is vertical up–down of look vector.
The value of the incidence angle for Sentinel-1A/B satellites ranges from 29° to 46°. In the next step vertical displacements were calculated using the following Formula (2) [66,67]:
where:
- is the vertical displacement;
- is the LOS displacement;
- is the incidence angle.
Once vertical displacements for each image pair were calculated, spatial statistics with the use of GIS raster map algebra’s cell statistic functions were used to determine shape of the deformation area after each of the induced shocks. The functions calculate a per-cell statistic from multiple rasters, such as maximum, minimum, mean or range values. In our case, the number of input rasters (vertical displacement maps) varied from 2 to 8 depending on the event, and the shape of deformation (vertical displacement at each location) was determined as mean value of all spatially congruent cells in raster maps.
These results were used in the next stage alongside descriptive summaries of vertical displacements to reflect the shape of terrain deformations. Descriptive statistics calculated in the study included: minimum, maximum, and mean vertical displacement values. The results have been presented in the form of graphs, and Table 3 shows the Results part. In addition, the Pearson correlation coefficient test statistic was calculated to assess statistically the potential relationship between the maximum observed value of vertical displacements, extent of deformation, and energy of each event.
Table 3.
Descriptive statistics for deformations resulting from the eight induced shocks including: magnitude, energy, vertical displacements, North-South (N–S) and West-East extents (W–E).
5. Results
The terrain deformations resulting from the induced shocks, which occurred in the period from 29 November 2016 to 7 February 2020, were analyzed. These shocks had energies from 2.9 × 10⁶ J (registered as 2.71 magnitude by regional seismological station of the Polish Academy of Sciences) to 3.1 × 10⁸ J (registered as 3.75 magnitude by regional seismological station of the Polish Academy of Sciences), location and date of these events is shown in Figure 4. Strong mining tremors in the area of LGOM are registered by the regional seismological station of the Polish Academy of Sciences, which is located several dozen kilometers to the south.
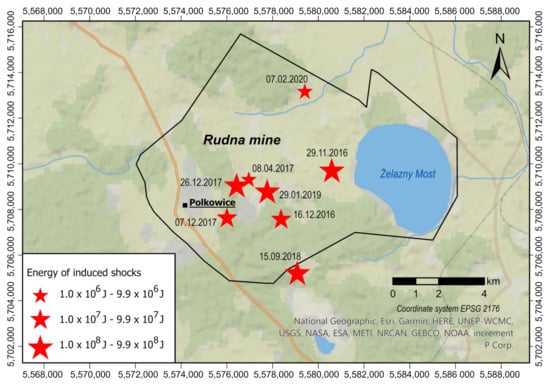
Figure 4.
Location and date of the 8 analyzed induced shocks.
In total, 68 pairs of images were processed, and 37 generated interferograms were investigated further (Appendix A). The remaining ones were characterized with low coherence values below 0.30 due to dense vegetation or snow coverage. Between 2 and 8 interferograms were obtained for each seismic shock. The time interval between pairs of images ranged from 6 to 24 days. The largest number of correct interferograms (8) was generated for the shock of 7 December 2017, and the lowest number of correct interferograms (2) was obtained for the shock of 29 January 2019. In the case of the remaining shocks, the number of correct ones was 3 (15 September 2018), 4 (16 December 2016 and 8 April 2017), and 5 (29 November 2016 and 26 December 2017).
The descriptive statistics for each of the analyzed seismic shocks are presented in Table 3. These include: date, magnitude, energy and number of analyzed image pairs resulting in a number of vertical displacement maps for each event. Then, highest, lowest and average maximum calculated vertical displacement values are given, as well as greatest, smallest and mean extent of deformation area. These values have been calculated from vertical displacement maps obtained for each of the analyzed events. The minimum, maximum and mean values for vertical displacements, the W–E extent and the N–S extent were obtained on the basis of raster map algebra’s cell statistic calculations in ESRI’s ArcGIS software licensed to Wroclaw University of Science and Technology.
The mean values of maximum vertical displacements (subsidence) ranged from −44 to −119 mm depending on the induced shock. The greatest vertical displacements were caused by the tremors on 26 December 2017, and 29 January 2019, with mean maximum displacement values of −109 and −119 mm, respectively. The smallest vertical displacements were the result of the tremors on 8 April 2017, and 7 February 2020, with mean maximum vertical displacement of −44 and −48 mm. The remaining tremors resulted in mean maximum vertical displacement values ranging from −67 to −96 mm.
In the case of horizontal extent of deformation areas, the mean values ranged from 0.550 m to 1950 m for the W–E direction and from 600 m to 2700 m for the N–S direction. The W–E direction and the N–S direction correspond approximately to the directions of the world, along which the trough profiles were measured. The value of −10 mm was assumed as the boundary of the area of subsidence, which determined the N–S and W–E extent of each deformation area. The smallest troughs formed after seismic events of 8 April 2017, and 7 February 2020 (550 m × 600 m and 500 m × 750 m respectively). The largest troughs, with spatial extents of 1900 m × 2350 m and 1850 m × 2700 m were caused by tremors on 26 December 2017, and 29 January 2019, respectively.
The individual vertical displacement maps obtained from both ascending and descending orbits were combined into a single vertical displacement map for each seismic event. The resulting maps represent the probable shape of the deformation area. For this purpose map algebra raster functions were used where average values of spatially congruent pixels representing vertical displacements were calculated. The resulting maps of terrain deformations have been presented in Figure 5.
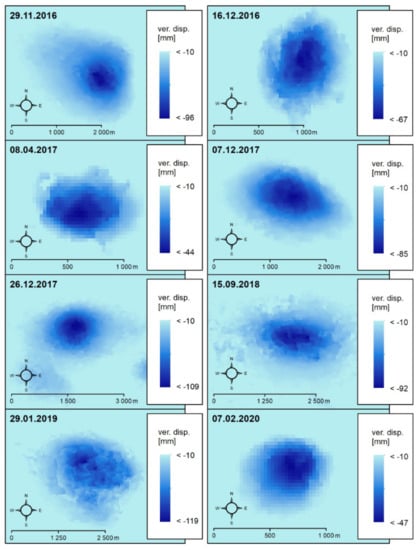
Figure 5.
Raster maps of vertical displacements for the 8 analyzed induced shocks.
In order to examine more precisely the shape of deformations of the ground surface, the generalized horizontal extent of troughs that developed after each event were superimposed with their centroids as the joint center (Figure 6). The value of −10 mm was assumed as the limit of the deformation area.
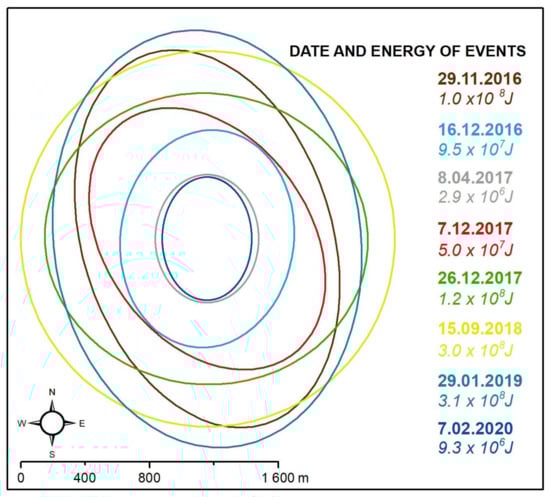
Figure 6.
Superimposed spatial extents of the analyzed eight deformation areas.
Generally, the resulting deformation areas have oval shapes (five cases), slightly elongated in the N–S direction that differs in extent depending on the energy of the seismic event that caused it. Two events produced almost circular deformation areas. Slight rotation of several deformation areas, greatest in the case of the event from 7 December 2017, can be noticed. The S–W elongation of the 26 December 2017, trough, may have been caused by the influence of the earlier shock that occurred in close vicinity on the 7 December 2017. This will beyond the scope of this paper and will be investigated in a separate study.
The vertical profiles of individual deformation areas in approximately W–E and N–S directions are shown in Figure 7a,b, respectively.
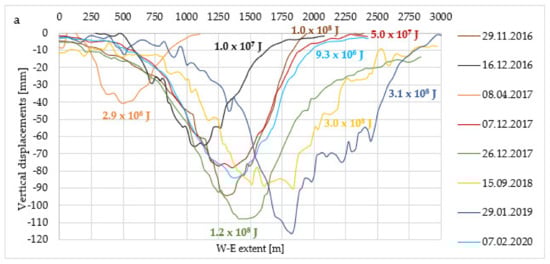
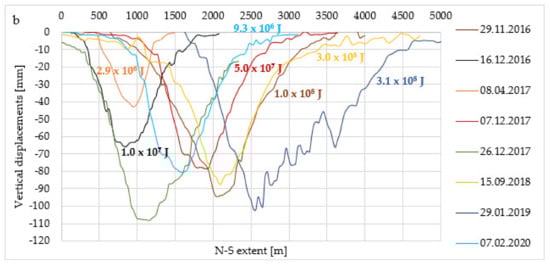
Figure 7.
Profiles of troughs formed by eight induced shocks (mean value of spatial extent vs. mean value vertical displacements). (a) Profiles towards the W–E. (b) Profiles towards the N–S.
The analyzed vertical profile lines show similar subsidence properties. The troughs, which were caused by shocks: 29 November 2016, 16 December 2016, 8 April 2017, 7 December 2017, 26 December, 2017, and 7 February 2020, have generally smooth and similar shapes that differ in size. In contrast, the profiles for the troughs of 15 September 2018, and 29 January 2019, are characterized by disturbances (local peaks in profile lines). This may be caused by noise in the obtained interferograms. In the case of the troughs of 15 September 2018, there is no visible disturbance of the geometry in the N–S direction as opposed to the W–E direction. The trough of 29 January 2019, shows numerous peaks, the course of the trough profile is not rectilinear which results from low coherence.
In the next stage of analysis, the potential relationships between the energy of tremors induced by underground mining activity and maximum vertical displacements, as well as energy and their spatial ranges in W–E and N–S directions were assessed. For this purpose Pearson statistical correlation coefficient (r) was calculated for three cases, energy vs. maximum mean vertical displacement, energy and W–E extent and energy and N–S extent of deformation areas. These relationships have been shown graphically in Figure 8a–c, respectively.
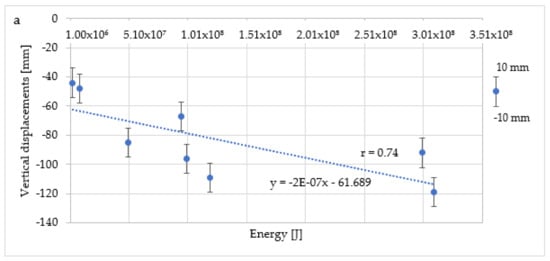
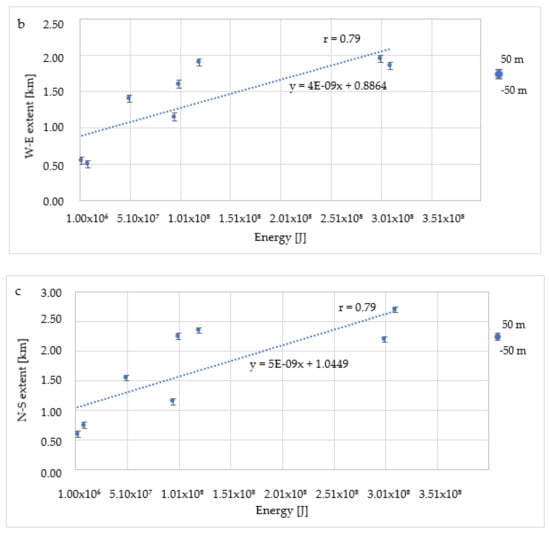
Figure 8.
Graphs and Pearson coefficient (r): (a) energy vs. max value of vertical displacements, (b) energy vs. mean value of W–E extent, (c) energy vs. mean value of N–S extent.
The strongest relationship between the analyzed variables was determined for the pair of energy vs. W–E extent and N–S extent variables (r = 0.79). The relationship of energy vs. vertical displacements is the weakest of all three analyzed pairs but still with strong positive correlation of r = 0.74. The outliers from the trend line mainly concern the shocks: 7 December 2017, and 15 September 2018, which have been characterized with the greatest noise (weakest coherence), as was mentioned before.
6. Discussion
In our study, satellite radar interferometry DInSAR method and Sentinel-1A/B radar images were used to detect LOS displacements caused by tremors induced by underground mining activity. Additionally, GIS functions were used to calculate vertical displacements and analyze geometry of the resulting deformations. Altogether, 68 interferograms were processed, and 37 interferograms were obtained for time bases from 6 days to 24 days. The remaining 31 interferograms were characterized with low coherence values, which could be caused by the coverage of the area with vegetation, presence of snow cover or the influence of weather conditions on the satellite signal. The greatest number of interferograms was obtained for the months of November, December, and February, ranging from 5 to 8 interferograms for a given seismic event. The smallest numbers of interferograms were generated for the months of January, April, and September, ranging from 2 to 4.
As a result, a multiple data set was obtained for a statistical investigation of the geometry of deformations and an attempt to determine the shape of troughs resulting from tremors (generalized shape). Our study, contrary to other works [19,20,21,68,69,70], focused on determining the mean maximum values of vertical and not LOS displacements based on number of vertical displacement maps for each event. In addition, we have analyzed a large number (8) of seismic events caused by underground mining.
Among the seismic events analyzed in our study three have been the subject of other research. The shock on 29 November 2016, was studied by [19,21,68,69,70] using both the DInSAR and/or SBAS methods, but based on a smaller number of interferograms. Malinowska et al. [21,68] determined the value of LOS displacements equal to −90 mm. Whereas, Milczarek [69] in the his study determined this value as equal to −80 mm. In another study [19], the author calculated the cumulative LOS displacements using the SBAS method for seismic events that occurred in 2014–2018. Our results indicate value of maximum vertical displacements of −96 mm and generalized extent of the deformation area of 1.6 km × 2.25 km based on superposition of five vertical displacement maps.
For the two other previously analyzed events, i.e., shocks on 7 December 2017, and 26 December 2017, Hejmanowski et al. [20] determined maximum LOS displacements at approximately −80 and −110 mm, respectively. These events were also studied by Owczarz and Blachowski [71] who determined maximum LOS displacements at −83 mm and −94 mm, respectively. Our present results, based on the superposition of 8 and 5 vertical displacement maps indicate subsidence of −85 and −109 mm, respectively and extent of the deformation area approximately 1.4 km × 1.55 km and 1.85 km × 2.35 km, respectively.
In addition, Owczarz [72] calculated the LOS displacement of deformation area (seismic event of the 29 January 2019) using various SAR data processing software and obtained max values of displacements ranging from −92 to −118 mm.
In the result of our calculations, knowledge database of surface deformations manifesting after seismic events was created using the DInSAR and GIS methods. Processing of a large number of image pair for each seismic event allowed for verification of the results and identification of the geometry of the resulting area of deformation based on pixel-to-pixel relationship between vertical displacement maps for different time intervals and different orbits. Based on the literature [20,21] it was assumed that deformations develop suddenly in a short period of time after the seismic event and thus various temporal baselines were analyzed together, i.e., between 6 and 24 days. All of the analyzed deformation areas occurred within the zone of direct influence of underground mining. This may point to the hypothesis that the seismic events accelerate manifestation of these direct effects (surface subsidence).
We have proposed a methodology to determine vertical, in contrast to LOS, displacements caused by seismic events related to underground mining based on pixel-to-pixel relationship between a number of vertical displacement maps for different time intervals. In addition, spatial extent and shape of the subsidence through can be determined in the same way providing more insight into the phenomenon of ground subsidence after induced seismic activity.
7. Conclusions
The presented research concerned the determination of surface effects caused by eight shocks induced in the area of underground copper mining. For this purpose, the DInSAR method was used to calculate the resulting surface displacements and GIS to analyze the obtained results. On the basis of the Sentinel-1 A/B data 68 image pairs were processed and 37 interferograms were obtained and further analyzed, which enabled the detection of terrain deformations. This research made it possible to determine the average values of: vertical displacements, spatial ranges in the W–E and N–S directions, the geometry of troughs, as well as the relationship between energy and displacements, spatial ranges. As a result of the research, the following conclusions were formulated:
- The Sentinel-1 A/B mission ensures sufficient frequency of delivering new satellite imagery to detect terrain displacements due to induced seismicity in the area of underground copper mining.
- The DInSAR method enables the determination of displacements caused by induced shocks with energy from 2.9 × 10⁶ J to 3.1 × 10⁸ J (magnitude from 2.71 to 3.75).
- The greatest number of interferograms was calculated for the winter months of: November December, February, while the smallest number in January, April, and September. Low coherence for these months was due to the area being covered with dense vegetation or snow.
- GIS provides tools facilitating further processing, as well as analysis of the results and their visualization. The use of spatial statistics made it possible to develop the characteristics of the geometry of the resulting troughs.
- The deepest trough was created after the shock of 29 January 2019 (energy 3.1 × 10⁸ J) with mean maximum vertical displacement equal to −119 mm. The shallowest trough was caused by the shock of 8 April 2017 (energy 2.9 × 10⁶ J) with an mean maximum vertical displacement of −44 mm. The mean values of the spatial ranges of these troughs ranged from 500 m and 1950 m in the W–E direction and from 600 m to 2700 m in the N–S direction.
- Strong positive relationship has been determined between energy of induced shocks and the resulting vertical displacements of terrain, as well as between energy and spatial extents of deformation areas. The highest value of the coefficient of Pearson (r = 0.79) was determined for the energy vs. W–E extent and N–S extent relationship while the lowest (r = 0.76) for energy vs. mean maximum vertical displacements.
In the future, the same researches are planned for other induced shocks in order to create a knowledge base on deformations in the Rudna mine.
Author Contributions
Conceptualization, K.O. and J.B.; methodology, K.O. and J.B.; software, K.O.; validation, K.O. and J.B.; formal analysis, K.O. and J.B.; investigation, K.O.; resources, K.O.; data curation, K.O.; writing—original draft preparation, K.O.; writing—review and editing, K.O. and J.B.; visualization, K.O. and J.B.; supervision, J.B. All authors have read and agreed to the published version of the manuscript.
Funding
The research has been supported by the statutory grant at the Department of Mining and Geodesy, Faculty of Geoengineering, Mining and Geology, Wroclaw University of Science and Technology.
Acknowledgments
The research has been realized with the support of Rudna mine of KGHM Polish Copper Ltd.
Conflicts of Interest
The authors declare no conflict of interest.
Appendix A
Table A1.
Satellite imagery on the basis of which 37 correct interferograms were generated.
Table A1.
Satellite imagery on the basis of which 37 correct interferograms were generated.
| Name of Satellite Imagery | Direction of Track | Number of Track | Temporal Baseline | Sub-Swath |
|---|---|---|---|---|
| 29 November 2016 | ||||
| S1A_IW_SLC__1SDV_20161128T164319_20161128T164346_014145_016D6F_F88D S1B_IW_SLC__1SDV_20161204T164255_20161204T164323_003249_005891_D8C7 | A | 73 | 6 | IW2 |
| S1A_IW_SLC__1SDV_20161128T164319_20161128T164346_014145_016D6F_F88D S1A_IW_SLC__1SDV_20161210T164319_20161210T164346_014320_0172FE_EAEB | A | 73 | 12 | IW2 |
| S1A_IW_SLC__1SDV_20161128T164319_20161128T164346_014145_016D6F_F88D S1B_IW_SLC__1SDV_20161216T164255_20161216T164323_003424_005D95_4152 | A | 73 | 18 | IW2 |
| S1B_IW_SLC__1SDV_20161119T050802_20161119T050832_003023_005239_697D S1A_IW_SLC__1SDV_20161207T050847_20161207T050914_014269_017152_805A | D | 22 | 18 | IW2 |
| S1A_IW_SLC__1SDV_20161128T164319_20161128T164346_014145_016D6F_F88D S1A_IW_SLC__1SDV_20161222T164318_20161222T164345_014495_017872_496C | A | 73 | 24 | IW2 |
| 16 December 2016 | ||||
| S1B_IW_SLC__1SDV_20161216T164255_20161216T164323_003424_005D95_4152 S1A_IW_SLC__1SDV_20161222T164318_20161222T164345_014495_017872_496C | A | 73 | 6 | IW2 |
| S1B_IW_SLC__1SDV_20161204T164255_20161204T164323_003249_005891_D8C7 S1A_IW_SLC__1SDV_20161222T164318_20161222T164345_014495_017872_496C | A | 73 | 18 | IW2 |
| S1B_IW_SLC__1SDV_20161213T050801_20161213T050831_003373_005C25_7299 S1A_IW_SLC__1SDV_20161219T050847_20161219T050914_014444_0176D0_EF54 | D | 22 | 6 | IW2 |
| S1A_IW_SLC__1SDV_20161207T050847_20161207T050914_014269_017152_805A S1A_IW_SLC__1SDV_20161219T050847_20161219T050914_014444_0176D0_EF54 | D | 22 | 12 | IW2 |
| 8 April 2017 | ||||
| S1A_IW_SLC__1SDV_20170328T164316_20170328T164343_015895_01A337_36E1 S1A_IW_SLC__1SDV_20170409T164316_20170409T164344_016070_01A875_4CDD | A | 73 | 12 | IW2 |
| S1B_IW_SLC__1SDV_20170331T050813_20170331T050840_004948_008A69_A126 S1B_IW_SLC__1SDV_20170412T050814_20170412T050841_005123_008F6C_D50B | D | 22 | 12 | IW2 |
| S1A_IW_SLC__1SDV_20170406T050845_20170406T050912_016019_01A6DC_8E48 S1B_IW_SLC__1SDV_20170424T050815_20170424T050842_005298_00947F_FD90 | D | 22 | 18 | IW2 |
| S1A_IW_SLC__1SDV_20170406T050845_20170406T050912_016019_01A6DC_8E48 S1A_IW_SLC__1SDV_20170430T050846_20170430T050913_016369_01B18B_D494 | D | 22 | 24 | IW2 |
| 7 December 2017 | ||||
| S1A_IW_SLC__1SDV_20171205T164333_20171205T164400_019570_0213BD_A995 S1B_IW_SLC__1SDV_20171211T164251_20171211T164318_008674_00F6AC_172B | A | 73 | 6 | IW2 |
| S1A_IW_SLC__1SDV_20171205T164333_20171205T164400_019570_0213BD_A995 S1A_IW_SLC__1SDV_20171217T164332_20171217T164359_019745_02192D_249B | A | 73 | 12 | IW2 |
| S1A_IW_SLC__1SDV_20171123T164333_20171123T164400_019395_020E3F_903B S1B_IW_SLC__1SDV_20171211T164251_20171211T164318_008674_00F6AC_172B | A | 73 | 12 | IW2 |
| S1B_IW_SLC__1SDV_20171129T164251_20171129T164318_008499_00F11E_4DB7 S1B_IW_SLC__1SDV_20171211T164251_20171211T164318_008674_00F6AC_172B | A | 73 | 18 | IW2 |
| S1A_IW_SLC__1SDV_20171202T050858_20171202T050925_019519_021209_A76E S1B_IW_SLC__1SDV_20171208T050822_20171208T050849_008623_00F501_431E | D | 22 | 6 | IW2 |
| S1A_IW_SLC__1SDV_20171202T050858_20171202T050925_019519_021209_A76E S1A_IW_SLC__1SDV_20171214T050857_20171214T050924_019694_021783_ECC9 | D | 22 | 12 | IW2 |
| S1B_IW_SLC__1SDV_20171126T050822_20171126T050849_008448_00EF78_238A S1B_IW_SLC__1SDV_20171208T050822_20171208T050849_008623_00F501_431E | D | 22 | 12 | IW2 |
| S1A_IW_SLC__1SDV_20171120T050858_20171120T050925_019344_020C93_B6C2 S1B_IW_SLC__1SDV_20171208T050822_20171208T050849_008623_00F501_431E | D | 22 | 18 | IW2 |
| 26 December 2017 | ||||
| S1B_IW_SLC__1SDV_20171223T164250_20171223T164317_008849_00FC3E_CE30 S1B_IW_SLC__1SDV_20180104T164250_20180104T164317_009024_0101ED_9550 | A | 73 | 12 | IW2 |
| S1B_IW_SLC__1SDV_20171211T164251_20171211T164318_008674_00F6AC_172B S1A_IW_SLC__1SDV_20171229T164332_20171229T164359_019920_021E98_F099 | A | 73 | 18 | IW2 |
| S1B_IW_SLC__1SDV_20171220T050821_20171220T050848_008798_00FA9A_9E8B S1B_IW_SLC__1SDV_20180101T050821_20180101T050848_008973_010039_7E5A | D | 22 | 12 | IW2 |
| S1B_IW_SLC__1SDV_20171208T050822_20171208T050849_008623_00F501_431E S1B_IW_SLC__1SDV_20180101T050821_20180101T050848_008973_010039_7E5A | D | 22 | 24 | IW2 |
| S1A_IW_SLC__1SDV_20171214T050857_20171214T050924_019694_021783_ECC9 S1A_IW_SLC__1SDV_20180107T050856_20180107T050923_020044_02226F_27B4 | D | 22 | 24 | IW2 |
| 15 September 2018 | ||||
| S1A_IW_SLC__1SDV_20180907T164340_20180907T164407_023595_029208_209A S1A_IW_SLC__1SDV_20180919T164340_20180919T164407_023770_0297A9_5AC0 | A | 73 | 12 | IW2 |
| S1B_IW_SLC__1SDV_20180910T050822_20180910T050849_012648_01756A_0B25 S1A_IW_SLC__1SDV_20180916T050904_20180916T050931_023719_029600_C0CB | D | 22 | 6 | IW2 |
| S1A_IW_SLC__1SDV_20180904T050904_20180904T050931_023544_029063_0704 S1A_IW_SLC__1SDV_20180916T050904_20180916T050931_023719_029600_C0CB | D | 22 | 12 | IW2 |
| 29 January 2019 | ||||
| S1A_IW_SLC__1SDV_20190117T164338_20190117T164405_025520_02D474_0CBA S1A_IW_SLC__1SDV_20190210T164337_20190210T164404_025870_02E129_AEE3 | A | 73 | 24 | IW2 |
| S1A_IW_SLC__1SDV_20190126T050902_20190126T050929_025644_02D905_B9FA S1B_IW_SLC__1SDV_20190201T050827_20190201T050854_014748_01B801_5400 | D | 22 | 6 | IW2 |
| 7 February 2020 | ||||
| S1A_IW_SLC__1SDV_20200205T164344_20200205T164411_031120_03939E_7435 S1B_IW_SLC__1SDV_20200211T164302_20200211T164329_020224_0264BB_2742 | A | 73 | 6 | IW2 |
| S1A_IW_SLC__1SDV_20200205T164344_20200205T164411_031120_03939E_7435 S1A_IW_SLC__1SDV_20200217T164343_20200217T164410_031295_0399AD_A4B0 | A | 73 | 12 | IW2 |
| S1B_IW_SLC__1SDV_20200130T164302_20200130T164329_020049_025F07_6125 S1B_IW_SLC__1SDV_20200211T164302_20200211T164329_020224_0264BB_2742 | A | 73 | 12 | IW2 |
| S1A_IW_SLC__1SDV_20200205T164344_20200205T164411_031120_03939E_7435 S1B_IW_SLC__1SDV_20200223T164301_20200223T164328_020399_026A5A_039B | A | 73 | 18 | IW2 |
| S1A_IW_SLC__1SDV_20200202T050908_20200202T050935_031069_0391D1_89C3 S1A_IW_SLC__1SDV_20200214T050908_20200214T050935_031244_0397E3_E01A | D | 22 | 12 | IW2 |
| S1A_IW_SLC__1SDV_20200202T050908_20200202T050935_031069_0391D1_89C3 S1B_IW_SLC__1SDV_20200220T050818_20200220T050846_020348_026899_D786 | D | 22 | 18 | IW2 |
| S1A_IW_SLC__1SDV_20200202T050908_20200202T050935_031069_0391D1_89C3 S1A_IW_SLC__1SDV_20200226T050908_20200226T050935_031419_039DEA_7C17 | D | 22 | 24 | IW2 |
References
- Gogolewska, A.; Kaźmierczak, M. Aktywność sejsmiczna w wybranych polach eksploatacyjnych w KGHM Polska Miedź S.A. O/ZG Rudna. CUPRUM Czasopismo Naukowo-Techniczne Górnictwa Rud 2014, 4, 35–54. [Google Scholar]
- Zembaty, Z. Rockburst induced ground motion—A comparative study. Soil Dyn. Earthq. Eng. 2004, 24, 11–23. [Google Scholar] [CrossRef]
- Zembaty, Z. Zastosowanie normy sejsmicznej “Eurokod 8” w projektowaniu budowli narażonych na działanie wstrząsów górniczych. Czas. Tech. Bud. 2010, 107, 173–180. [Google Scholar]
- Lasocki, S.; Orlecka-Sikora, B.; Leptokaropoulos, K.; Lizurek, G.; Sterzel, M.; Szepieniec, T.; Mutke, G. Platforma IS-EPOS jako nowoczesne narzędzie w badaniach sejsmiczności antropogenicznej. Zesz. Nauk. Inst. Gospod. Surowcami Miner. Energią PAN 2016, 93, 49–62. [Google Scholar]
- Bazanowski, M.; Szostak-Chrzanowski, A.; Chrzanowski, A. Determination of GPS session duration in ground deformation surveys in mining areas. Sustainability 2019, 11, 6127. [Google Scholar] [CrossRef]
- Jiránková, E.; Mučková, J.; Jadviščok, P.; Vochta, R.; Molčák, V.; Havlicová, M. Geodetic monitoring of the surface within the trial operation of the room and pillar mining method in the Ostrava-Karvina coal district. Int. J. Clean Coal Energy 2016, 5, 37–44. [Google Scholar] [CrossRef]
- Lazecky, M.; Jirankova, E.; Kadlecik, P. Multitemporal monitoring of Karvina subsidence troughs using Sentinel-1 and Terrasar-X interferometry. Acta Geodyn. Geromater. 2017, 14, 51–58. [Google Scholar] [CrossRef]
- Abdikan, S.; Arıkan, M.; Sanli, F.B.; Cakir, Z. Monitoring of coal mining subsidence in peri-urban area of Zonguldak city (NW Turkey) with persistent scatterer interferometry using ALOS-PALSAR. Environ. Earth Sci. 2014, 71, 4081–4089. [Google Scholar] [CrossRef]
- Liu, J.G.; Mason, P.J. Introduction to interferometric synthetic aperture radar technique. In Image Processing and GIS for Remote Sensing: Techniques and Applications; John Wiley & Sons, Ltd.: Hoboken, NJ, USA, 2016; pp. 113–125. ISBN 978-1-118-72419-4. [Google Scholar]
- Zheng, L.; Zhu, L.; Wang, W.; Guo, L.; Chen, B. Land subsidence related to coal mining in China revealed by L-Band InSAR analysis. Int. J. Environ. Res. Public Health 2020, 17, 1170. [Google Scholar] [CrossRef]
- Ng, A.H.-M.; Ge, L.; Zhang, K.; Chang, H.-C.; Li, X.; Rizos, C.; Omura, M. Deformation mapping in three dimensions for underground mining using InSAR—Southern highland coalfield in New South Wales, Australia. Int. J. Remote Sens. 2011, 32, 7227–7256. [Google Scholar] [CrossRef]
- Falorni, G.; Del Conte, S.; Bellotti, F.; Colombo, D. InSAR monitoring of subsidence induced by underground mining operations. In Proceedings of the Fourth International Symposium on Block and Sublevel Caving, Vancouver, BC, Canada, 15–17 October 2018. [Google Scholar]
- Li, Z.W.; Yang, Z.F.; Zhu, J.J.; Hu, J.; Wang, Y.J.; Li, P.X.; Chen, G.L. Retrieving three-dimensional displacement fields of mining areas from a single InSAR pair. J. Geod. 2015, 89, 17–32. [Google Scholar] [CrossRef]
- Fan, H.; Wen, B.; Liu, J.; Liu, J.; Yin, J. An improved method of three-dimensional displacement field generation in mining areas with a single InSAR pair. Eur. J. Remote Sens. 2019, 52, 493–503. [Google Scholar] [CrossRef]
- Diao, X.; Bai, Z.; Wu, K.; Zhou, D.; Li, Z. Assessment of mining-induced damage to structures using InSAR time series analysis: A case study of Jiulong Mine, China. Environ. Earth Sci. 2018, 77, 166. [Google Scholar] [CrossRef]
- Juncu, D.; Árnadóttir, T.; Geirsson, H.; Guðmundsson, G.B.; Lund, B.; Gunnarsson, G.; Hooper, A.; Hreinsdóttir, S.; Michalczewska, K. Injection-induced surface deformation and seismicity at the Hellisheidi geothermal field, Iceland. J. Volcanol. Geotherm. Res. 2020, 391, 106337. [Google Scholar] [CrossRef]
- Békési, E.; Fokker, P.A.; Martins, J.E.; Limberger, J.; Bonté, D.; van Wees, J.-D. Production-induced subsidence at the Los Humeros geothermal field inferred from PS-InSAR. Geofluids 2019, 2019, e2306092. [Google Scholar] [CrossRef]
- Rudziński, Ł.; Mirek, K.; Mirek, J. Rapid ground deformation corresponding to a mining-induced seismic event followed by a massive collapse. Nat. Hazards 2019, 96, 461–471. [Google Scholar] [CrossRef]
- Milczarek, W. Application of a small baseline subset time series method with atmospheric correction in monitoring results of mining activity on ground surface and in detecting induced seismic events. Remote Sens. 2019, 11, 1008. [Google Scholar] [CrossRef]
- Hejmanowski, R.; Malinowska, A.A.; Witkowski, W.T.; Guzy, A. An analysis applying InSAR of subsidence caused by nearby mining-induced earthquakes. Geosciences 2019, 9, 490. [Google Scholar] [CrossRef]
- Malinowska, A.A.; Witkowski, W.T.; Guzy, A.; Hejmanowski, R. Mapping ground movements caused by mining-induced earthquakes applying satellite radar interferometry. Eng. Geol. 2018, 246, 402–411. [Google Scholar] [CrossRef]
- Krawczyk, A.; Grzybek, R. An evaluation of processing InSAR Sentinel-1A/B data for correlation of mining subsidence with mining induced tremors in the Upper Silesian Coal Basin (Poland). E3S Web Conf. 2018, 26, 00003. [Google Scholar] [CrossRef]
- Loesch, E.; Sagan, V. SBAS Analysis of induced ground surface deformation from wastewater injection in east central Oklahoma, USA. Remote Sens. 2018, 10, 283. [Google Scholar] [CrossRef]
- Barnhart, W.D.; Yeck, W.L.; McNamara, D.E. Induced earthquake and liquefaction hazards in Oklahoma, USA: Constraints from InSAR. Remote Sens. Environ. 2018, 218, 1–12. [Google Scholar] [CrossRef]
- Kubanek, J.; Liu, Y.; Harrington, R.M.; Samsonov, S. Observation of surface deformation associated with hydraulic fracturing in western Canada using InSAR. In Proceedings of the EUSAR 2018, 12th European Conference on Synthetic Aperture Radar, Aachen, Germany, 4–7 June 2018; pp. 1–6. [Google Scholar]
- Albano, M.; Polcari, M.; Bignami, C.; Moro, M.; Saroli, M.; Stramondo, S. Did anthropogenic activities trigger the 3 April 2017 Mw 6.5 Botswana Earthquake? Remote Sens. 2017, 9, 1028. [Google Scholar] [CrossRef]
- Thorpe, S. Time Series Analysis of Surface Deformation Associated with Fluid Injection and Induced Seismicity in Timpson, Texas Using DInSAR Methods. Master Thesis, The University of Western Ontario, London, ON, Canada, 2017. [Google Scholar]
- Blachowski, J. Application of GIS spatial regression methods in assessment of land subsidence in complicated mining conditions: Case study of the Walbrzych coal mine (SW Poland). Nat. Hazards 2016, 84, 997–1014. [Google Scholar] [CrossRef]
- Sedlak, V. Some specific procedures in solving the deformation vector for mining undermined areas. J. Mater. Eng. Struct. JMES 2015, 2, 99–110. [Google Scholar]
- Malinowska, A. Classification and regression tree theory application for assessment of building damage caused by surface deformation. Nat. Hazards 2014, 73, 317–334. [Google Scholar] [CrossRef]
- Park, I.; Lee, J.; Saro, L. Ensemble of ground subsidence hazard maps using fuzzy logic. Cent. Eur. J. Geosci. 2014, 6, 207–218. [Google Scholar] [CrossRef]
- Blachowski, J.; Chrzanowski, A.; Szostak-Chrzanowski, A. GIS-based methodology for assessing effects of mining on the surface infrastructure. In Proceedings of the ResearchGate XV International Mine Surveying Congress, Aachen, Germany, 16–20 September 2013; pp. 529–545. [Google Scholar]
- Stecchi, F.; Mancini, F.; Ceppi, C.; Gabbianelli, G. Vulnerability to ground deformation phenomena in the city of Tuzla (BiH): A GIS and multicriteria approach. Nat. Hazards 2012, 64, 2153–2165. [Google Scholar] [CrossRef]
- Oh, H.-J.; Lee, S. Assessment of ground subsidence using GIS and the weights-of-evidence model. Eng. Geol. 2010, 115, 36–48. [Google Scholar] [CrossRef]
- Choi, J.-K.; Kim, K.-D.; Lee, S.; Won, J.-S. Application of a fuzzy operator to susceptibility estimations of coal mine subsidence in Taebaek City, Korea. Environ. Earth Sci. 2010, 59, 1009–1022. [Google Scholar] [CrossRef]
- Esaki, T.; Djamaluddin, I.; Mitani, Y. A GIS-based prediction method to evaluate subsidence-induced damage from coal mining beneath a reservoir, Kyushu, Japan. Q. J. Eng. Geol. Hydrogeol. 2008, 41, 381–392. [Google Scholar] [CrossRef]
- Zahiri, H.; Palamara, D.R.; Flentje, P.; Brassington, G.M.; Baafi, E. A GIS-based Weights-of-Evidence model for mapping cliff instabilities associated with mine subsidence. Environ. Geol. 2006, 51, 377–386. [Google Scholar] [CrossRef]
- Jordan, G. JRC PECOMINES project sustainable mineral resources management: From regional mineral resources exploration to spatial contamination risk assessment of mining. Environ. Geol. 2008, 58, 153. [Google Scholar] [CrossRef]
- Huang, S.; Li, X.; Wang, Y. A new model of geo-environmental impact assessment of mining: A multiple-criteria assessment method integrating Fuzzy-AHP with fuzzy synthetic ranking. Environ. Earth Sci. 2012, 66, 275–284. [Google Scholar] [CrossRef]
- Radwanek-Bąk, B. The concept of multi-criteria mineral resources protection. Environ. Geol. 2007, 52, 137–145. [Google Scholar] [CrossRef]
- Uberman, R. Evaluation of the cost approach’s usefulness for a mineral assets’ valuation. Gospod. Surowcami Miner. Miner. Resour. Manag. 2011, 27, 63–78. [Google Scholar]
- Dąbski, J.; Dunaj, A.; Markiewicz, M.; Mikoda, A.; Paździor, J.; Rydzewski, A.; Siewierski, S. Historia rozwoju KGHM Polska Miedź S.A. In Monografia KGHM Polska Miedź S.A.; KGHM CUPRUM Sp. z o.o. CBR: Wrocław, Poland, 2007. [Google Scholar]
- KGHM Strona Korporacyjna. Available online: https://kghm.com/pl (accessed on 20 August 2020).
- Sudoł, E. Using the leveling measurement in modeling of mining and geological parameters on LGOM area. Geod. Descr. Terrarum 2009, 8, 13–22. [Google Scholar]
- Butra, J.; Dębkowski, R.; Szpak, M.; Kirej, M. Koncepcja eksploatacji złoża rud miedzi w węźle uskoków Rudna Główna i Biedrzychowa O/ZG Rudna KGHM Polska Miedź S.A. Cuprum Czas. Nauk. Tech. Górnictwa Rud 2017, 2, 29–38. [Google Scholar]
- Earthquakes—Earthquake Today—Latest Earthquakes in the World—EMSC. Available online: https://www.emsc-csem.org/#2 (accessed on 20 August 2020).
- ASF Data Search. Available online: https://search.asf.alaska.edu/#/ (accessed on 20 August 2020).
- Gabriel, A.K.; Goldstein, R.M.; Zebker, H.A. Mapping small elevation changes over large areas: Differential radar interferometry. J. Geophys. Res. Solid Earth 1989, 94, 9183–9191. [Google Scholar] [CrossRef]
- Thiel, K.-H.; Hartl, P. Fields of experiments in ERS-1 SAR interferometry in Bonn and Naples. In Proceedings of the International Symposium—From Optics to Radar, SPOT and ERS-1 Applications, Paris, France, 10–13 May 1993. [Google Scholar]
- Zebker, H.A.; Rosen, P. On the derivation of coseismic displacement fields using differential radar interferometry: The Landers earthquake. In Proceedings of the IGARSS ‘94—1994 IEEE International Geoscience and Remote Sensing Symposium, Pasadena, CA, USA, 8–12 August 1994; Volume 1, pp. 286–288. [Google Scholar]
- Herrera, G.; Gutiérrez, F.; García-Davalillo, J.C.; Guerrero, J.; Notti, D.; Galve, J.P.; Fernández-Merodo, J.A.; Cooksley, G. Multi-sensor advanced DInSAR monitoring of very slow landslides: The Tena Valley case study (central Spanish Pyrenees). Remote Sens. Environ. 2013, 128, 31–43. [Google Scholar] [CrossRef]
- Huang, J.; Xie, M.; Farooq, A.; Williams, E.J. DInSAR technique for slow-moving landslide monitoring based on slope units. Surv. Rev. 2019, 51, 70–77. [Google Scholar] [CrossRef]
- Lanari, R.; Berardino, P.; Bonano, M.; Casu, F.; Manconi, A.; Manunta, M.; Manzo, M.; Pepe, A.; Pepe, S.; Sansosti, E.; et al. Surface displacements associated with the L’Aquila 2009 Mw 6.3 earthquake (central Italy): New evidence from SBAS-DInSAR time series analysis. Geophys. Res. Lett. 2010, 37. [Google Scholar] [CrossRef]
- Suresh, D.; Yarrakula, K. InSAR based deformation mapping of earthquake using Sentinel 1A imagery. Geocarto Int. 2020, 35, 559–568. [Google Scholar] [CrossRef]
- Govorčin, M.; Herak, M.; Matoš, B.; Pribičević, B.; Vlahović, I. Constraints on complex faulting during the 1996 Ston–Slano (Croatia) earthquake inferred from the DInSAR, seismological, and geological observations. Remote Sens. 2020, 12, 1157. [Google Scholar] [CrossRef]
- Parwata, I.N.S.; Shimizu, N.; Zeka, S.; Gruji, B.; Vrkljan, I. Application of DInSAR for monitoring the subsidence induced by salt mining in Tuzla, Bosnia and Herzegovina. In Proceedings of the International Society for Rock Mechanics and Rock Engineering, 10th Asian Rock Mechanics Symposium, Singapore, 29 October–3 November 2018. [Google Scholar]
- Wajs, J.; Milczarek, W.J. Detection of surface subsidence using SAR SENTINEL 1A imagery and the DInSAR method—A case study of the Belchatow open pit mine, Central Poland. E3S Web Conf. 2018, 55, 00004. [Google Scholar] [CrossRef]
- De Novellis, V.; Castaldo, R.; De Luca, C.; Pepe, S.; Zinno, I.; Casu, F.; Lanari, R.; Solaro, G. Source modelling of the 2015 Wolf volcano (Galápagos) eruption inferred from Sentinel 1-A DInSAR deformation maps and pre-eruptive ENVISAT time series. J. Volcanol. Geotherm. Res. 2017, 344, 246–256. [Google Scholar] [CrossRef]
- De Novellis, V.; Atzori, S.; Luca, C.D.; Manzo, M.; Valerio, E.; Bonano, M.; Cardaci, C.; Castaldo, R.; Bucci, D.D.; Manunta, M.; et al. DInSAR Analysis and analytical modeling of Mount Etna displacements: The December 2018 volcano-tectonic crisis. Geophys. Res. Lett. 2019, 46, 5817–5827. [Google Scholar] [CrossRef]
- Sánchez-Gámez, P.; Navarro, F.J. Glacier surface velocity retrieval using D-InSAR and offset tracking techniques applied to ascending and descending passes of Sentinel-1 data for southern Ellesmere ice caps, Canadian Arctic. Remote Sens. 2017, 9, 442. [Google Scholar] [CrossRef]
- Nela, B.R.; Bandyopadhyay, D.; Singh, G.; Glazovsky, A.F.; Lavrentiev, I.I.; Kromova, T.E.; Arigony-Neto, J. Glacier flow dynamics of the Severnaya Zemlya archipelago in Russian high arctic using the differential SAR interferometry (DInSAR) technique. Water 2019, 11, 2466. [Google Scholar] [CrossRef]
- Pepe, A.; Calò, F. A review of interferometric synthetic aperture RADAR (InSAR) multi-track approaches for the retrieval of Earth’s surface displacements. Appl. Sci. 2017, 7, 1264. [Google Scholar] [CrossRef]
- Sandwell, D.; Mellors, R.; Tong, X.; Wei, M.; Wessel, P. Open radar interferometry software for mapping surface deformation. Eos Trans. Am. Geophys. Union 2011, 92, 234. [Google Scholar] [CrossRef]
- Chen, C.W.; Zebker, H.A. Network approaches to two-dimensional phase unwrapping: Intractability and two new algorithms. J. Opt. Soc. Am. A JOSAA 2000, 17, 401–414. [Google Scholar] [CrossRef] [PubMed]
- GMTSAR—GMT—The Generic Mapping Tools. Available online: http://gmt.soest.hawaii.edu/projects/gmt5sar/boards/6 (accessed on 20 August 2020).
- Agustan; Kimata, F.; Abidin, H.Z.; Pamitro, Y.E. Measuring ground deformation of the tropical volcano, Ibu, using ALOS-PALSAR data. Remote Sens. Lett. 2010, 1, 37–44. [Google Scholar] [CrossRef]
- He, L.; Wu, L.; Liu, S.; Wang, Z.; Su, C.; Liu, S.-N. Mapping two-dimensional deformation field time-series of large slope by coupling DInSAR-SBAS with MAI-SBAS. Remote Sens. 2015, 7, 12440–12458. [Google Scholar] [CrossRef]
- Malinowska, A.; Witkowski, W.T.; Guzy, A.; Hejmanowski, R. Study of dynamic displacement phenomena with the use of imaging radars from the Sentinel mission. Zesz. Nauk. Inst. Gospod. Surowcami Miner. Energią PAN 2017, 101, 229–246. [Google Scholar]
- Milczarek, W. Investigation of post inducted seismic deformation of the 2016 MW 4.2 Tarnowek Poland mining tremor based on DinSAR and SBAS method. Acta Geodyn. Geomater. 2019, 16, 1–11. [Google Scholar] [CrossRef]
- Milczarek, W.; Kopeć, A.; Głąbicki, D. Estimation of tropospheric and ionospheric delay in DInSAR calculations: Case study of areas showing (natural and induced) seismic activity. Remote Sens. 2019, 11, 621. [Google Scholar] [CrossRef]
- Owczarz, K.; Blachowski, J. Analysis of the geometry of surface deformations caused by induced tremors in the area of underground copper mining. In Proceedings of the ISPRS Annals of Photogrammetry, Remote Sensing and Spatial Information Sciences, XXIV ISPRS Congress, Nice, France, 31 August–2 September 2020; pp. 149–156. [Google Scholar]
- Owczarz, K. Analysis of surface displacements caused by induced shocks with various radar data processing software. AIP Conf. Proc. 2020, 2209, 040005. [Google Scholar] [CrossRef]


Publisher’s Note: MDPI stays neutral with regard to jurisdictional claims in published maps and institutional affiliations. |
© 2020 by the authors. Licensee MDPI, Basel, Switzerland. This article is an open access article distributed under the terms and conditions of the Creative Commons Attribution (CC BY) license (http://creativecommons.org/licenses/by/4.0/).