1. Introduction
Archaeological cultural heritage is a precious asset that must be preserved and passed on to future generations. Digital 3D recording of objects, monuments, and sites has proven to be a reliable solution. This requires the design and implementation of adequate procedures for a correct and accurate 3D digitization of the asset. The documentation of prehistoric art has a triple purpose: (1) to serve as a research and knowledge tool, (2) to create records which will allow further investigations towards the implementation of conservation interventions, and (3) the production of replicas that will maintain the shape and materiality of the originals—which may significantly deteriorate over time [
1]. In the field of rock art, we generally investigate paintings and/or engravings. To obtain a faithful representation of the preserved traces, its final tracing must record, on the one hand, the engraving groove and, on the other, faithfully the pigment. This article presents the methodology followed to document a piece of Paleolithic portable art, using the macro photogrammetry as a basis. Photogrammetry is considered one of the most successful passive sensing techniques for measuring and reconstructing 3D objects from multiple images, regardless of the study scale and the platform (static/mobile, terrestrial/aerial/underwater/underground) used to acquire the images [
2].
Digital photography has been used for years to document rock art. Specifically in the study of engravings, macro photography, and reflectance transformation imaging (RTI) have been used for two decades [
3]. RTI technology is based on processing multiple images of an illuminated object from different directions (azimuth) and angles (elevation), while the camera remains in a fixed position. In the last five years, researchers who have used the RTI to better visualize engravings in portable art [
4] and petroglyphs [
5,
6] have also opted for the 3D digitization of the artefacts to trace the engravings on the surfaces. To increase the visibility of the engravings in the 3D model, they use rendering techniques in MeshLab that allow, by modifying the light intensities, to represent the shape through shading, improving details, such as concavities and convexities [
4,
5,
6,
7]. In the case of Cassen et al. [
5], they also use a deviation map created in Geomagic, comparing the original model with another modified by smoothing it. In all cases, the authors conclude that combining RTI with 3D digitization offers adequate results for the rock art documentation needs. Two methodologies that complement each other to create a unique result. However, it is important to keep in mind that the quality of the 3D model is essential for optimal results.
In recent years, other researchers have proposed methods that use the digital elevation model (DEM) and morphometric approaches applied through geographic information system (GIS) implementations, aiming to improve the identification of engravings [
8,
9]. This investigation assumes that etching is an anthropogenic depression in the surface topography.
On the other hand, the ImageJ DStretch complement designed by Harman [
10] for the image enhancement of cave paintings has also given good results to study fine engravings [
9,
11,
12]. DStretch is one of the most efficient tools for deciphering faint paintings [
13,
14,
15]. It is based on the application of the decorrelation stretching algorithm to the main components of a digital color image. Image enhancement techniques were first introduced to remote sensing. There are many custom color spaces employed in producing digital replicas. Digital image enhancement is immediate, nearly operator-independent, and reproducible (thanks to prerecorded settings), enhancing objectivity [
12]. According to Defrasne [
11], the software proved to be equally useful for visualization (enhancement) of linear incisions and scraping (scratches).
In this article, we propose a methodology for studying the plaquette tracing using a high-resolution model produced with macro-photogrammetry multi-view image-based reconstruction techniques, enhanced by raster-image analyses, typical of remote sensing applied to the interpretation and analysis of the earth’s surface. The paper is structured as follows:
Section 2 describes the archaeological context of the piece;
Section 3 describes the techniques used to acquire data and make the 3D model.
Section 4 focuses on products derived from the 3D model and their processing in order to document both engravings and paintings. Finally, the discussion and conclusions are drawnin
Section 5.
2. Context of the Piece
The documented piece, plaquette number 16330, is part of the portable art collection in Cova del Parpalló (Gandía, Valencia, Spain), one of the most important Paleolithic sites in the UNESCO’s World Heritage Site (WHS) Rock Art of the Mediterranean Basin on the Iberian Peninsula [
16]. The collection, of more than 5600 limestone plaquettes painted and/or engraved with animal figures and signs, is kept in the Museum of Prehistory in Valencia (Spain). The plaquette is engraved and painted on both sides, and the front of a horse (side A) (
Figure 1) and a complete goat (side B) are represented on it. These surface characteristics cannot be easily identified by the naked eye and are hardly made visible with conventional photography. It is a fractured piece in three parts measuring 19.7 × 23.7 cm (width by height) and 1.3 cm thick. While the representation of face B appears to be complete, the figure of the horse is only partially preserved, as the lower and right fractures abruptly interrupt the etched lines and painting, with possible loss of the distal part of the limbs and the body central-posterior part. The pronounced difference in the preservation of color between the lower and upper part of the horse must be understood for different preservation reasons (
Figure 1a). The fragments of the piece were found in two different sectors, probably as a consequence of the reuse of the larger fragment for the realization of a new motif on face B [
17].
There is an earlier tracing of the piece made by Villaverde that was published in 1994 [
16].
Figure 1b shows the face A tracing.
3. Methods and Equipment for Crafting 3D Models
Among the different steps involved in a 3D digitizing workflow, image acquisition is crucial for achieving high-quality results. In particular, the closer the camera is to the object, the shallower the (depth of field, DoF) and the more probable for certain parts of the object to be blurred out, preventing accurate photogrammetric measurements.
In [
18], a rotating platform was used to obtain the complete 3D of the Paleolithic portable art artefact. The camera remained in a fixed position mounted on a tripod, while the piece was photographed by rotating the platform at predefined angles. The same method was applied by Menna et al. [
19] who created a prototype 3D digitization system for recording heritage artefacts from images based on automated photographic taking and processing. According to Menna et al. [
19], one of the main problems with turntable-based systems is that, unfortunately, many objects do not always have a rotationally symmetrical shape, causing their surface to be closer to or further from the camera with obvious focus problems (DoF). To avoid blurring, wide-angle lenses (24 mm) that offer a large DoF are used, despite lower precision/resolution [
18,
20].
An alternative feasible possibility can be to move the camera lens system to a linear stage. It is what Vavulin et al. [
9] used, where they made use of a slider mounted on a graduated tripod. In particular, the article presented a 3D scanning method that yields enough resolution to record microrelief and identifies runic signs. However, to get a proper macro photo set, it is necessary to ensure accurate parallel camera pan both horizontally and vertically. In Angheluță and Rădvan [
21], they presented a workflow using macro photogrammetry for the 3D digitization of polychromies on a wooden support. The camera was mounted on a robust and precise positioning system (ARTIST CPS-200 from ArtInnovation) to achieve camera movement on all three axes.
The available tools (manual or motorized sliders) and their movement ranges determine the size of the documented area. In our case, a reproduction table has been used that allows the movement of the camera in the Z-axis (66 cm) and in the Y-axis (7 cm), and a turntable on which the moving part is freely placed on the XY plane. This data collection configuration can be applied to the three-dimensional digitization of flat and small-size pieces, such as portable art, coins, paintings on different supports, etc.
3.1. Data Acquisition
The piece remained exposed at that time in the museum, conditioning the data collection, just one day per week in the morning. It was to be held on Monday, the day the museum is closed to the public, and in the morning. The reduced time taken for the collection meant that only face A could be documented. Data were collected in the room adjacent to the room where the collection of portable art plaquette from Parpalló is kept (
Figure 2). It is a room that is usually closed to the public, with glass cabinets and exhibitors that have two windows that overlook an interior patio. During data collection, the crystals were covered with cardboard so that the room was illuminated only by artificial light from the ceiling. The location of the work table under a light source was chosen to avoid shadows on the piece (
Figure 2).
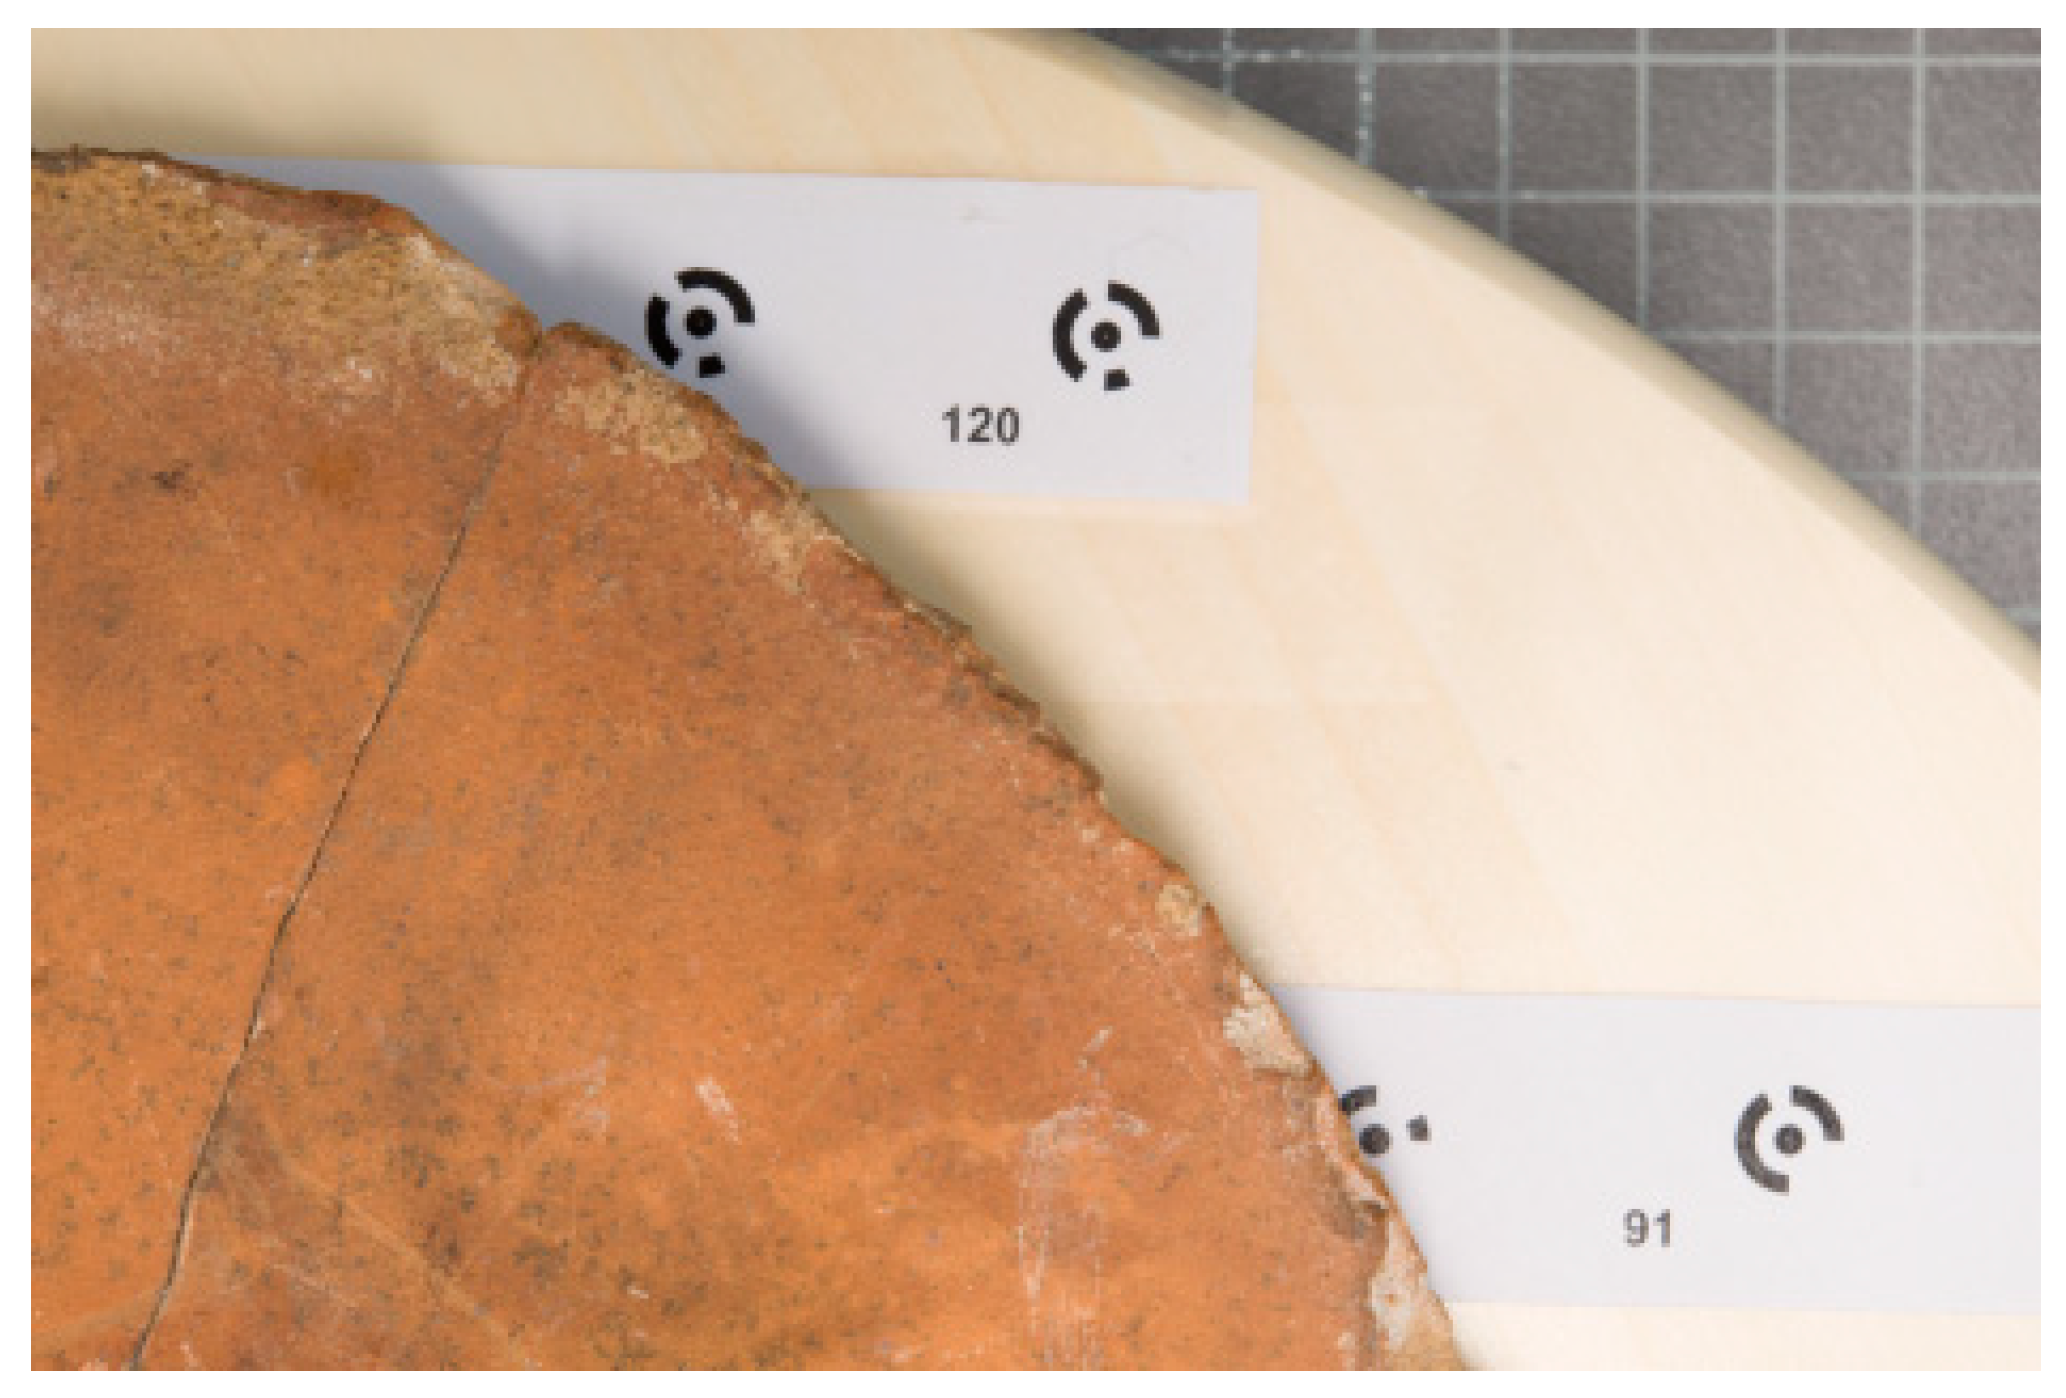
The data collection was planned to obtain a maximum 3:1 scale 3D model with a ground sampling distance (GSD) of 15 microns. One hundred and sixty-two images were taken with the Nikon D800E camera with 36.3 megapixel full-frame complementary metal-oxide semiconductor (CMOS) sensor and Nikon AF-S Micro Nikkor 60mm 1/2.8G ED lens. The instruments used were a KAISER RS 2 XA reproduction table with a 76 cm maximum height and a base of 40 × 50 cm, a 39 cm rotating platform in diameter with coded targets of known object coordinates achieved beforehand by bundle adjustment (
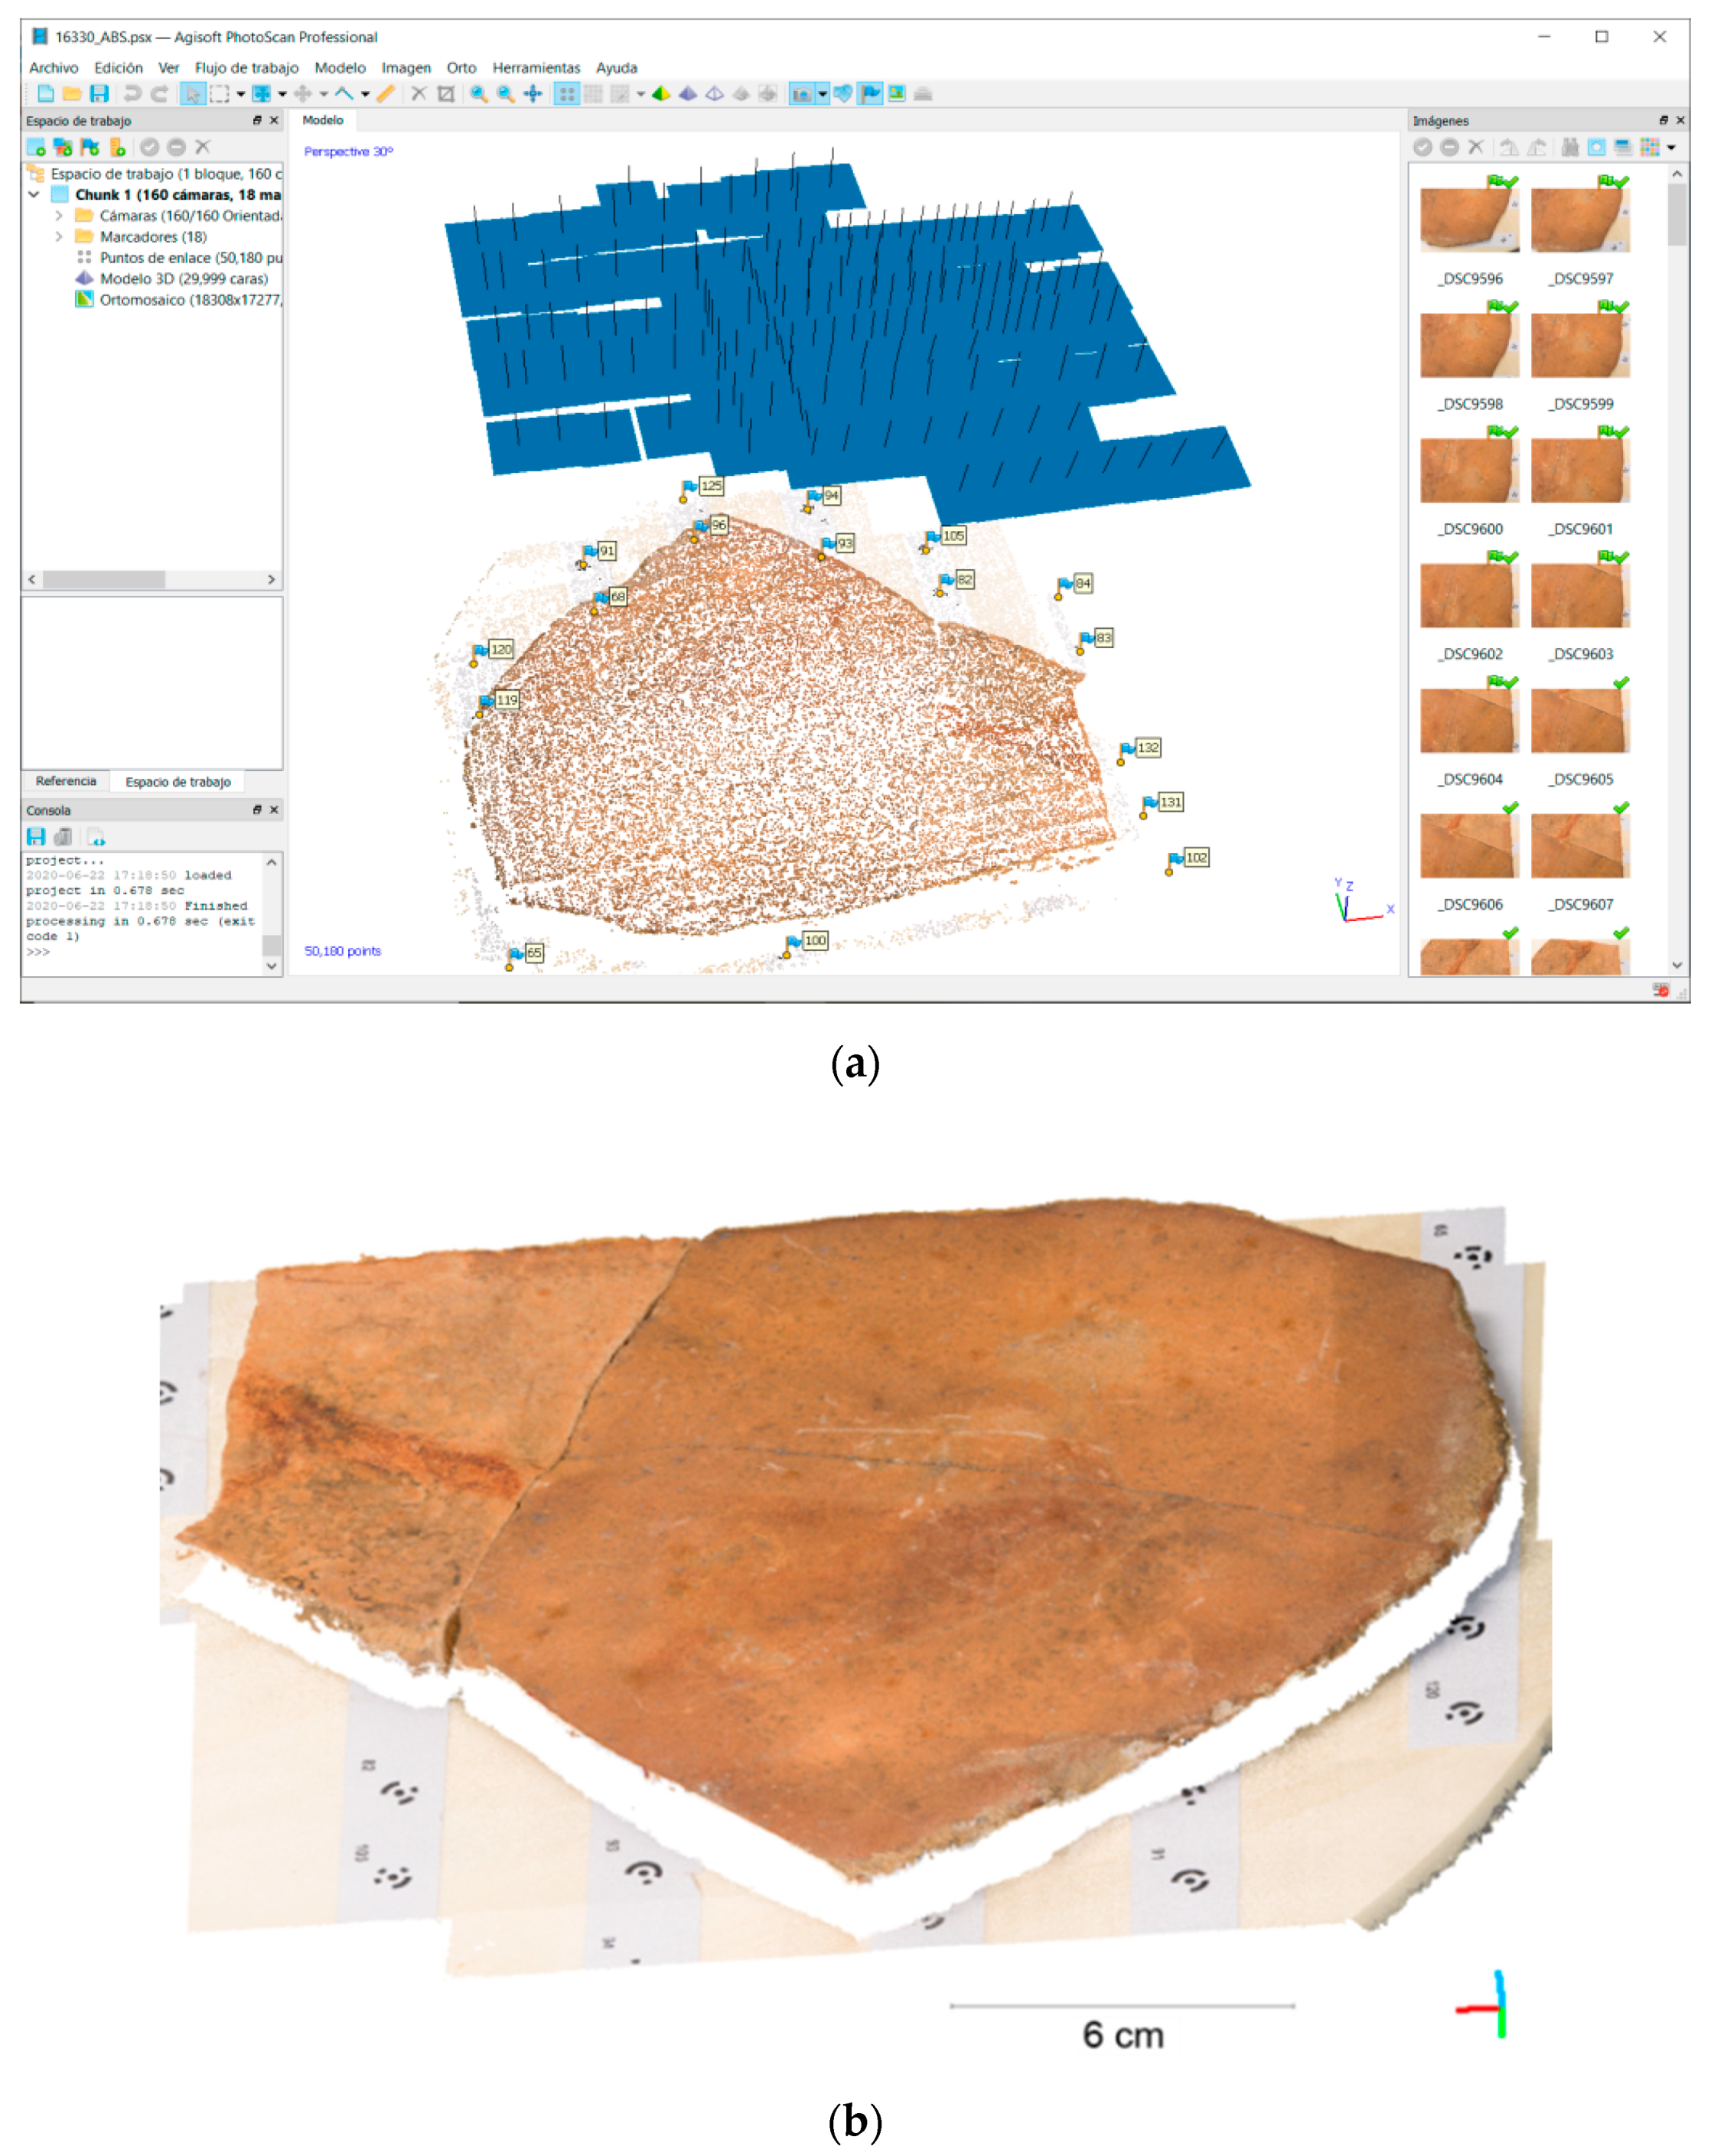
Figure 3) and a ColorChecker Passport color chart. The images were taken with a remote shutter, in manual mode with f/16, exposure time 1.6 s, ISO 100 and were saved in raw (Nikon Electronic File) format. The mean object camera distance was 21.1 cm. Longitudinal and transversal passes were made, both in normal and oblique grip (
Figure 4a). It was possible to manually move and rotate the turntable and to move horizontally up to 7 cm and tilt the camera mounted on the arm/head of the playback table. Thanks to this strategy, the images were always in focus and with the same spatial resolution. Furthermore, it was possible to obtain a good geometry of the self-calibration network [
22,
23]. Two hours were required to acquire the photogrammetric dataset (surface area of 313 cm
2).
White balance and color checker targets were captured at the same working distance and lighting conditions to correct the image set in post-processing for realistic texture [
21].
Camera calibration has always been an essential component of photogrammetric measurement. Self-calibration during the project is a routine but essential operation applied in close-range photogrammetry. In any case, the six outer orientation parameters that define the spatial position and orientation of the camera and the inner orientation parameters are simultaneously determined by during the bundle adjustment [
24]. According to Remondino and Fraser [
23], the quality of the self-calibration depends on the global geometry of the network, and especially the configuration of the shots. Highly convergent images should be taken, with shots rotated orthogonally and a large number of well-distributed object points.
3.2. Crafting 3D Model
The processes followed and the computer programs used for the 3D model elaboration of the 16330A board are explained below in a schematic way. The workflow carried out follows 5 steps: (a) Raw image processing for color correction and white balance. The images were saved in TIF format; (b) 160 image orientation and camera calibration. Eight additional parameters (f, cx, cy, K1, K2, K3, P1, P2) were calculated to achieve a 0.27 pixels reprojection error in the photogrammetric adjustment; the next step consisted of scaling and orienting the object thanks to the targets encoded with known object coordinates; (c) obtaining the 3D point cloud with a resulting average density of 1000 pts/mm
2 (
Figure 4b). The average point spacing or the lateral 3D point cloud resolution was 33 microns; (d) filtering and elimination of surfaces outside the target; (e) generation of the high-resolution 3D model by Delaunay triangulation, with the restriction of creating triangles whose edge size is shorter than 200 microns. ColorChecker Passport and Adobe Camera Raw were used in the first phase, Agisoft PhotoScan Professional was used in phases (b) and (c), and phases (d) and (e) were carried out with 3DReshaper.
4. Derived Products and Data Processing
From the high-resolution model created in 3DReshaper, the following products were derived using Agisoft PhotoScan: (a) Orthophotomosaic of 15,590 × 12,864 pixels with a resolution of 15 microns/pix (
Figure 1a and
Figure 5a). The result was exported in TIF format; (b) DEM with the same resolution. In this case, it was exported using different configurations: in 32-bit TIF format and as a hillshade in 8-bit TIF format (
Figure 6).
From the DEM elevation data, other secondary DEMs can be generated, which offer information that our eyes do not perceive at first glance (see
Section 4.1). In the same way, from the orthophotomosaic or macro images, image-enhancement techniques that reveal hidden information can be applied (see
Section 4.2).
The intention is to create a single work project where you can analyze all the data and generate a new tracing in the most objective way possible. In this case, we work in Adobe Photoshop, and we incorporate the different data through information layers (
Figure 5). All data are georeferenced to the control points, which allows us to combine the different layers to improve visualization, complete and validate doubtful information, etc. We use this program because it is more user-friendly, but we could also work in a computer-aided design (CAD)/GIS environment.
4.1. DEM
The first approach to the problem: a solution based solely on Agisoft allowed us to discover the suitability of the method used to obtain the 3D model. For the first time, we were able to observe the engraving grooves in detail from a DEM hillshade. This technique generates a raster image where each pixel is assigned an illumination value that depends on the location of a hypothetical light source. It, therefore, requires four input parameters: azimuth and elevation angle of the light source, slope, and exposure [
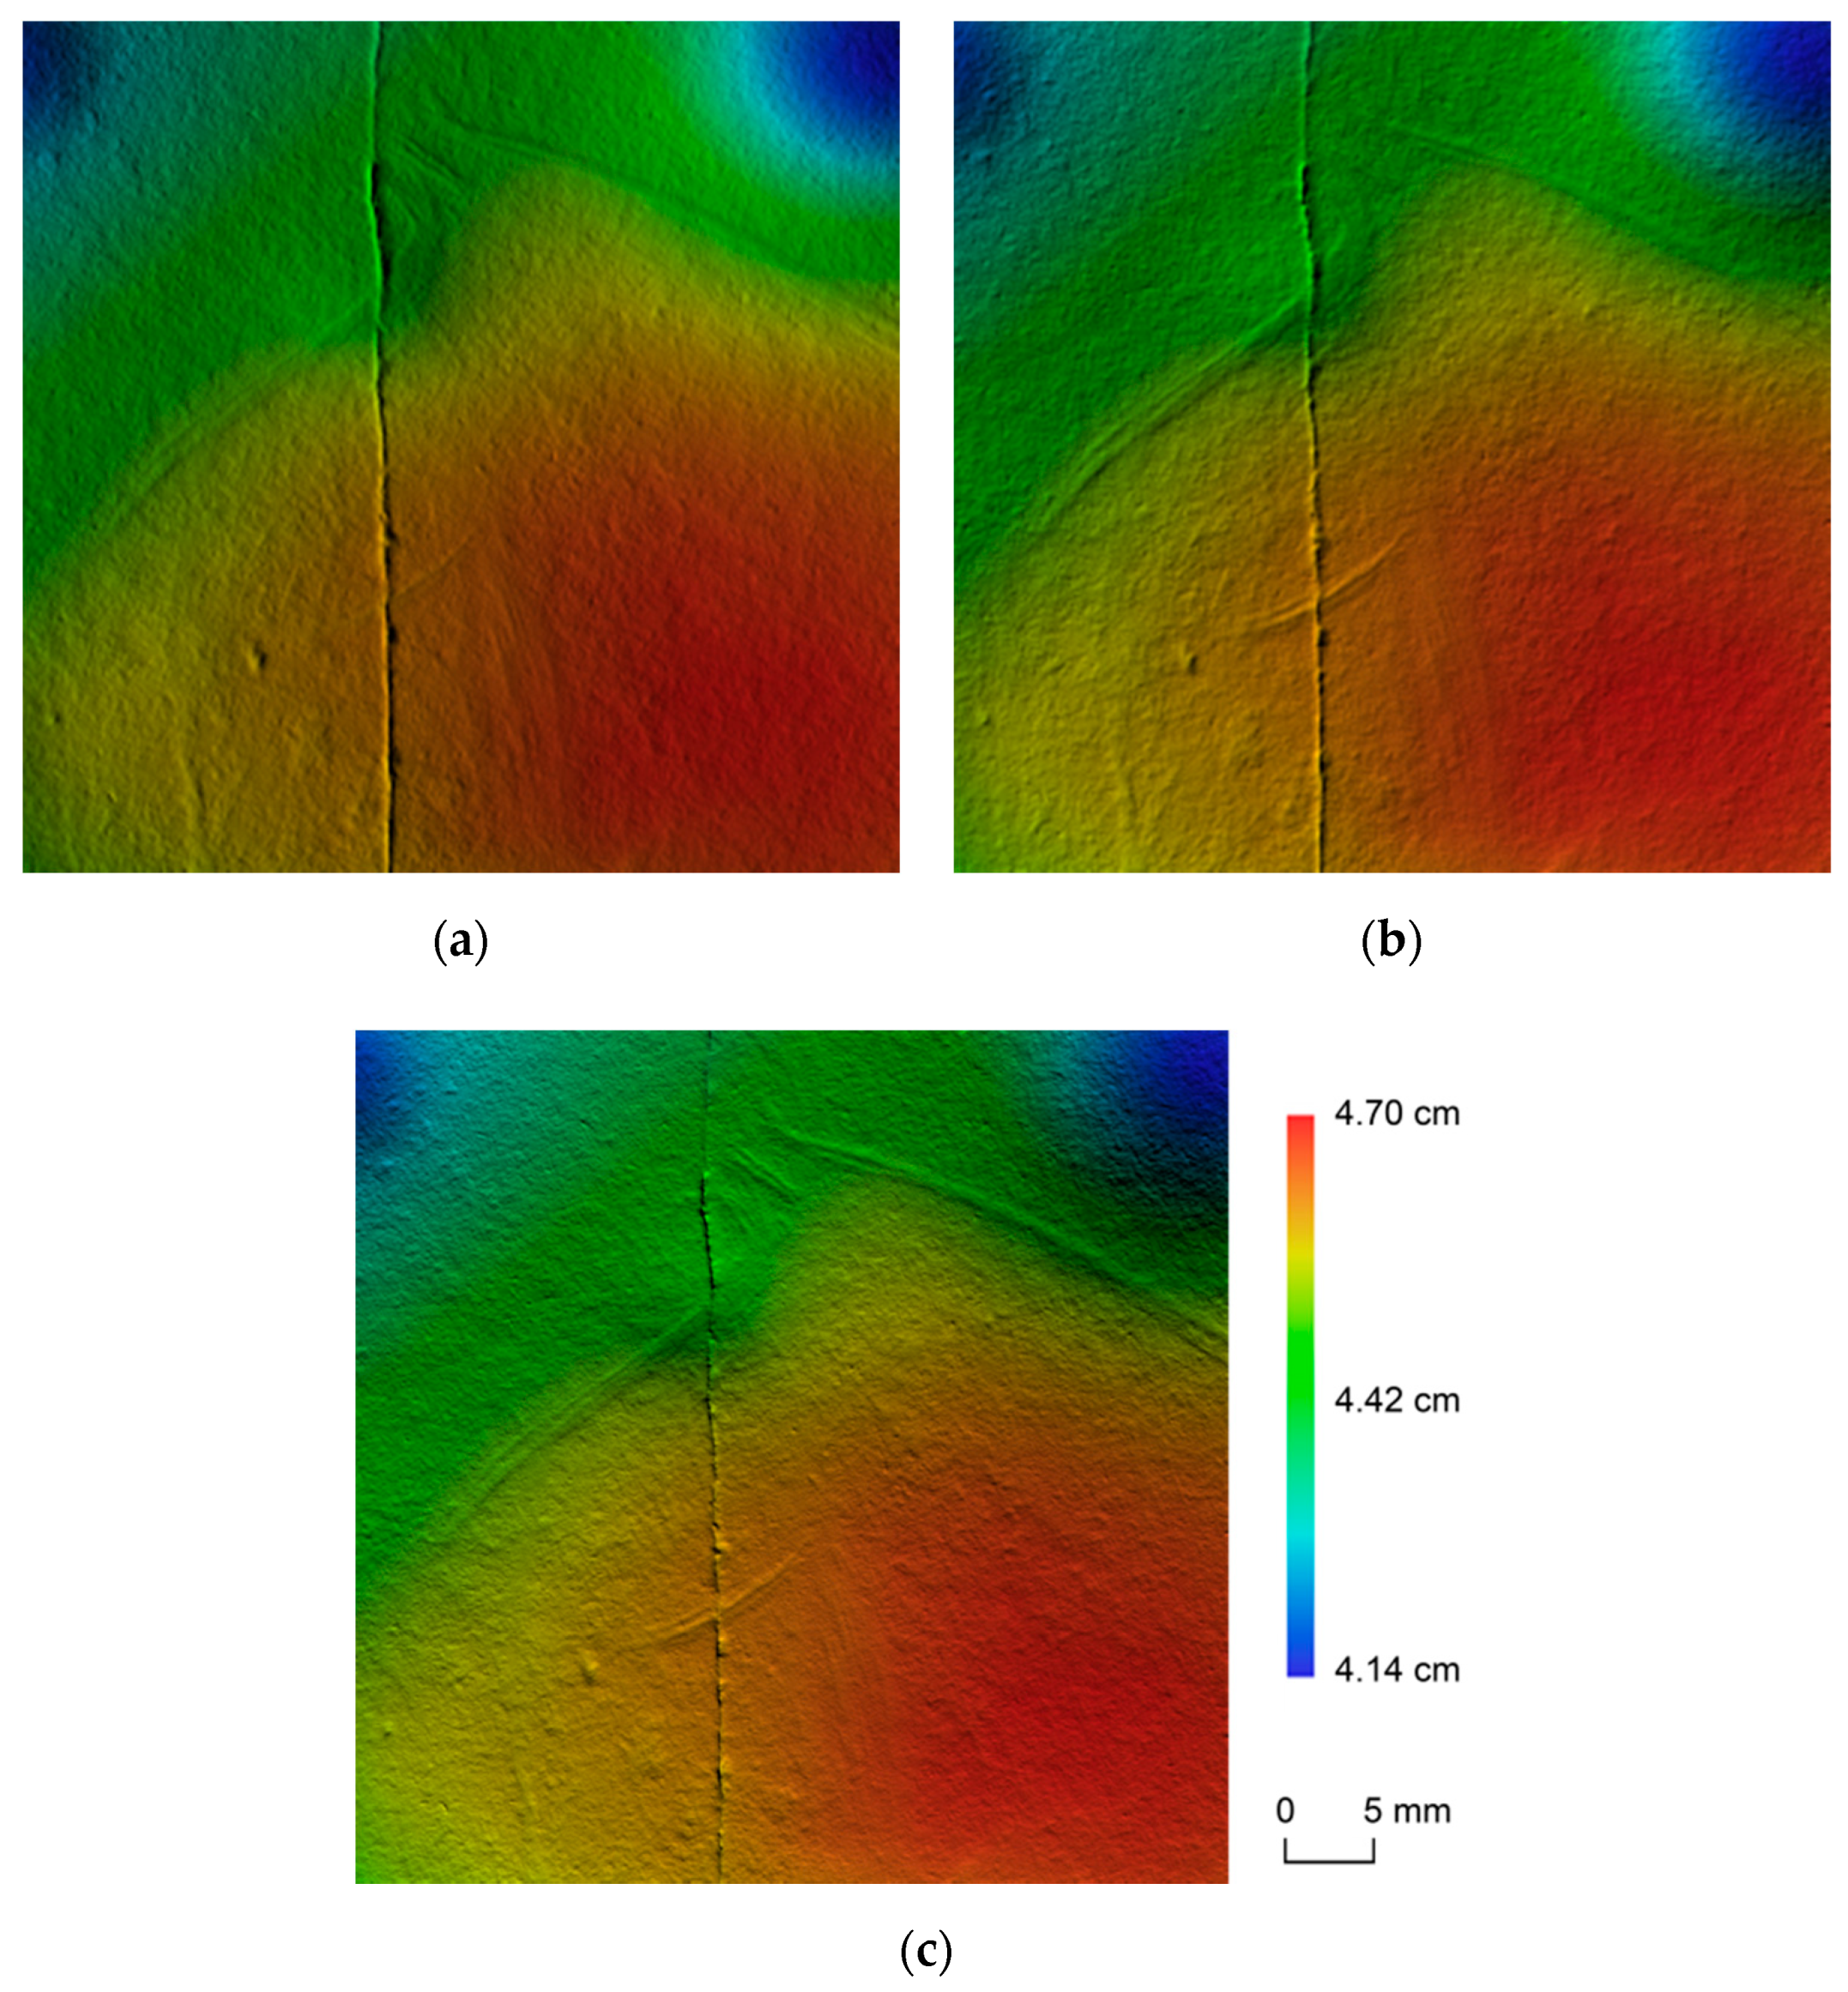
25]. The result is an indexed or grayscale image that reflects direct shadows and light. In this case, the program allows you to select the following parameters (Tools/Preferences/Appearance/Ortho) as well as the color palette and the position of the light source (Azimuth and Elevation). Three different hillshades were exported (
Figure 6) varying the azimuth angle by 60° and using grazing light (with an elevation angle of 30°). The images can be imported into a CAD, into a GIS, or directly stacked in a single Photoshop file (layers).
Observing the different images in
Figure 6, we see that hillshading offers a similar result to that obtained with the RTI technique. The lines of the engraving become more or less visible depending on the lighting angle of incidence. Ideally, the light should strike perpendicular to the lines. Three hillshades have been exported but as many synthetic images can be obtained with a simple and quick modification of the light source in Agisoft PhotoScan Professional. Although this solution presents the RTI technique virtues, it suffers from its defects when it comes to extracting the final layout of the figure. According to López-Menchero et al. [
6] the use of artificial grazing light increases the subjectivity of the perceived motif, since depending on the angle, power, and light source direction, some areas are enhanced to the detriment of others, sometimes generating shapes that can be misleading. The proposed solution was to export a significant number of hillshades so that all the traces were clearly visible and then delineated on the different images to obtain the tracing. Using, as other researchers do when presenting the final tracing, GIS [
8] or more professional graphic design programs such as Adobe Illustrator [
5,
11,
14] or Corel Draw [
26]. However, it was decided not to use this solution. Looking for an alternative that dispensed with shaders, where the lines of the engraving were automatically extracted in order to minimize operator intervention (subjectivity).
For the rest of the analysis, the program HyperCube v. 11.5 was used. It is a program specifically aimed at the visualization and analysis of multi and hyperspectral images. In addition, it allows filtering, warping, mosaic creation, resampling functions, and the ability to perform arithmetic operations on images and data. This program has been used by other rock art specialists for purposes and uses other than ours [
12,
27,
28]. There are several operations performed with HyperCube using as a base the DEM in 32-bit TIF format exported by Agisoft. The following sections detail the tools used and the objectives achieved.
4.1.1. Automatic Extraction of the Engraved Stroke
In this section, the Fourier transform application for image filtering is used to automatically extract engraving strokes. The procedure followed is summarized in two steps: (a) scaling the heights of the DEM to work in microns, using the Image Arithmetic tool (Functions/Arithmetic); (b) application of a high pass filter to the scaled DEM using the Fourier transform. The high-frequency enhancement filters (high pass) are intended to enhance any discontinuity, highlight the contrasts between homogeneous areas, emphasizing the lines. The central part of the Fourier spectrum is shown in
Figure 7. A star-shaped spatial distribution is observed and has arms that are perpendicular to the dominant orientations. Low frequencies are grouped in the center. Filtering in the frequency domain is started by selecting Fourier Operations (Functions/Fourier). The next step is the study of the radius of the filter to be applied for visualizing the spectrum (
Figure 7). The larger the circle radius, the greater the low frequencies range that are removed, and therefore, the more severe the effect of filtering. The chosen radius was 125 pixels. The result is an image where the dark areas represent deep areas (small microrelief depressions and the engraving grooves) (
Figure 5b).
4.1.2. Hillshade and Stroke Profile
Second, a hillshade was created using the shading tool (Applications/Shaded Relief). In this case, the program allows you to enter the slope in the X and Y directions. The initial values (15 and 12 microns) are automatically calculated from the average slope within the image. However, the smaller these are, the greater the shading effect. Therefore, it was decided to use a value of 5 microns in both directions. The position of the light source was left by default. The result was an image in grey levels (see
Figure 5c) with associated data from the original DEM, which allowed us to measure the grooves of the engraving. The tool used was the Line Profile Plot (Functions/Plot/Profile).
Figure 8 shows 9 outlines of the lines, on the mane, ears, forehead, snout, jaw, and neck. The hillshade layer is frequently used in cartography to give an impression of depth and to facilitate the interpretation of the relief and is often combined with other layers of information to improve its visualization. The image in
Figure 8 shows the result of applying the hillshade layer overlay with a transparency of 35% on the high pass layer. In addition, in
Figure 5d, it is superimposed applying the same transparency on the orthophotomosaic.
The engraved stroke is multiple and superficial, but well visible, and it seems, as in other pieces by Parpalló, aimed at precisely tracing the external animal’s figure contour. In the areas where the line is wider, between 8 and 10 passes are counted, and their total width does not exceed 1 mm. The delimitation of the painting and the contrast by eliminating the original patina could be the visual effects sought [
17]. Regarding the depth of the lines, we can indicate that on average they present values between 30–40 microns, there are more superficial lines that present values between 10–20 microns and deeper with values between 50–60 (see
Figure 8).
4.1.3. Integration of the Tracing Published in 1994 to the Current Documentation
It was decided to incorporate the existing previous archaeological documentation into the work project; this is the final tracing published in 1994 by Villaverde. Made by direct tracing on the piece, using cellophane paper and a Nikon trinocular magnifying glass with a range of 4 to 80 magnifications provided with a cold lighting system. Macro photographs were used to check details [
16]. The idea was to be added as a new information layer. The process followed to georeference the image is summarized in two steps: (a) Scanning the original tracing with the EPSON Perfection 3170 scanner. The output image was created with a 85 microns/pix resolution in TIF format (
Figure 1b); (b) registration of the scanned image with respect to the high pass image of the DEM (
Figure 5b) employing an affine transformation. The tool used was the image registration tool (Functions/Warp). Seven homologous points distributed throughout the image were identified, being the RMS was 13.08 pixels. The resampling type chosen was the nearest neighbor interpolation. A detail of the result is shown in
Figure 5e. In
Figure 5f, it is shown superimposed on the orthophotomosaic layer; note how the lines of the engraving have been masked.
4.2. Digital Image Enhancement with DStretch
To preserve the highest possible quality in the enhanced output mosaic of orthorectified images, a strategy similar to those proposed by Quesada and Harman [
29] for applying DStretch on Gigapixel images has been followed. In this case, it has been preferred to first apply the decorrelation algorithm on every single picture (
Figure 3) and then compose the mosaic.
We have worked with the plug-in DStretch Version 8.22. The procedure begins with a representative area selection on the image of the piece (orthophotomosaic of
Figure 1), the definition of the intensity scale and the choice of the color space with which the decorrelation algorithm manages to emphasize the areas of interest. In most cases, it is necessary to select several color spaces to highlight different aspects. The color space used to emphasize the red paint is LRE (
Figure 5g and
Figure 9). Additionally, good results have been obtained to isolate traces recorded with the DStretch-YRE enhancement (
Figure 5h). The different classified images are saved in TIF format together with their corresponding matrix file (.txt) with information on the transformation carried out. This file will be used later and contains the chosen color space, the 9 coefficients of the covariance matrix, and the mean color value of the image selection.
The next step begins with the selection of the necessary images to compose the mosaic ensuring a suitable coating. In this case, only 16 images were selected (
Figure 3). The same DStretch enhancements were applied on all images, importing the file with the matrix data and using the mean color value stored there. The treated images were replaced in the Agisoft project by the original raw ones. The last step was the creation of the mosaic using only the selected images and with the same parameters (pixel size, projection plane, etc.) used in
Section 4.
Figure 9 shows the result of superimposing the hillshade layer with a 60% transparency on the DStretch-LRE orthophotomosaic layer.
Apart from the pigment, DStretch allows documenting other aspects related to the state of the artifact conservation at the time of photo grammetric acquisition. In
Figure 5i, a DStretch-YBG enhancement is applied that shows damaged areas due to different causes or reasons. Dark green shows areas with dirt due to biodeterioration and white areas that have suffered a recent patina (and pigment) loss as a result of bumps, scratches, etc. This last aspect is also very well reflected using the DStretch-LYE enhancement (
Figure 5j).
The last step is to create a mask to extract the areas of interest, using Dstretch’s Hue Mask Panel tool, found within Expert mode.
Figure 5k shows the pigment masked from the DStretch-LRE enhancement, while
Figure 5l shows the overlapping of the hillshade layer with a transparency of 50% on the layer with the pigment, which in turn, overlaps on the high pass layer. This triple superposition will allow us to study in detail the relationship between the painted surface and the horse figure outline engraving.
5. Discussion and Conclusions
The high pass layer has proven to be very efficient in automatically extracting the engraved stroke (
Figure 5b). However, it presents a high level of noise, caused by the surface roughness of the limestone plaquette, which must be carefully eliminated. In this sense, having a previous final tracing of the figure is an advantage when it comes to distinguishing the engraved strokes (
Figure 1b and
Figure 5e). We have found that the most superficial lines with a depth fewer than 10 microns do not appear reflected in the high pass layer. See how profile H shows on the jaw of the horse (
Figure 8). A first groove 250 microns wide is observed with a depth fewer than 10 microns. However, the line to which this groove belongs is not reflected in the image above. In profile G, also belonging to the jaw, we see that the same line presents a groove with a width (0.5 mm) and greater depth (35 microns). In this case, the line is drawn on the image. This leads us to conclude that there will be uncertainty as to defining the beginning and/or end of the lines. In addition, the shallowest etched lines (depth fewer than 20 microns) can be represented in the high pass layer as dashed lines. We consider that the automatically extracted lines constitute a good working base from which to generate the engraved figure final drawing. According to Le Quellec et al. [
12], all recording techniques are flawed, so the level of uncertainty of a plot must be evaluated before any further analysis. This leads us to rely on other methods to validate questionable information and complete automatic traces. In our case, we will rely on other layers of information from our project (
Figure 5). The DStretch-YRE layer has proven to be efficient in obtaining fine and superficial lines (
Figure 5h), allowing us to validate and improve the broken or incomplete lines that we found in the high pass layer. It involves combining the results to create a single recording product. Furthermore, the DStretch-LYE layer makes it possible to distinguish incisions (post engraved strokes) and recent changes thanks to the differences in color caused by loss of patina (
Figure 5j).
The layer with the final tracing published in 1994 makes it possible to compare engraved strokes and a painted surface obtained by two different methods. The first by direct tracing on the piece and the second by indirect methods. In addition, it makes our work easier because it shows us the areas of interest (engraved strokes and pigment) and the conflictive areas to review. We believe that digitizing (and in our case georeferencing) printed graphic documentation produced using conventional techniques allows its review and updating, and its decomposition and adaptation to the various purposes of graphic documentation (research, conservation, and dissemination). Advantages of digital documentation compared to printed graphic documentation in itself constitute a punctual record that is difficult to review [
30].
Combining the hillshade layer with the DStretch-LRE layer implies going from a 2D to a 3D record (see
Figure 9). Allowing users to offer a volumetric reading not only of the support but also the motif. It is important to remark that, to delimit the pigment real extension in the image obtained with DStretch, it is necessary to manually remove those areas in which a false pigment identification occurs, either due to the different colorations of the support, the existence of dirt, or other reasons such as reddening and concretions. In addition, we understand that it is of great help to understand the why of certain lines, maximizing the objectivity. In the same way, combining the hillshade layer with the engravings (high pass layer) (
Figure 8 and
Figure 10) makes it possible to study the relationship between the microrelief of the rock support and the figure. In our case, the surface irregularities also seem to participate in the figure of the horse [
31]. The neck, located in a raised area (
Figure 6), seems modelled thanks to the multiple contour lines (cf. profile I of
Figure 8). We see as possible the fact that the artist took advantage of the plaquette micro-relief to draw/design the motif. The arch that joins the limbs adjusts to an inflexion of the support with a semicircular plan and concave section. The incisions corresponding to the legs are drawn in different planes (
Figure 1b,
Figure 9 and
Figure 10a). It is even possible that the surface irregularity causes the lack of precision of the engraved strokes with respect to the paintings (
Figure 10a). In the area that coincides with the fracturing of the piece into three fragments (
Figure 10b), it is also observed how depression has caused an error in the direction and engravings width and painting lines, resulting in a greater width of the painted line and a variation of the horse contour regularity.
This study can also be supported by the simultaneous visualization of the 3D model. In fact, within the derivative products achieved, we cannot forget the potential that the 3D model has by itself in comparison with the 2D drawing. This potential is used more and more, despite the fact that handling and processing huge bunches of data requires a lot of expertise [
5]. Nevertheless, the 3D model can easily be decimated (or not) and textured (applying photorealistic texture and/or enhanced with, e.g., DStretch) to obtain a virtual 3D replica. The chance of replicating the virtual model onto a touchable analogue model is also feasible with 3D printers. This would involve manipulating the portable art piece without altering the original condition, with a chance of better understanding its non-flat shape (volume). Applications of the 3D model target both research and conservation and dissemination in museums.
The validity of this methodology presented herein to document portable art pieces has been demonstrated. The methodology that allows obtaining a precise, reproducible, and objective documentation without direct contact with the plaquette surface and the pigment has been presented. This article described in detail the recording and documentation techniques followed to enhance the tiny engraving and faint paintings remaining on the surface. However, the ultimate goal is the development of a new reviewed comprehensive survey for documenting accurately, and with state-of-the-art technologies, the previous labor-intensive tracings that were only recorded by Prof. Villaverde in 1994. This study demonstrates that not only engravings but also faint paintings can be properly recorded and documented with minimum low-cost tools (high-resolution photography on a rotating platform plus advanced digital image processing software). In a future manuscript, the final tracing and the conclusions reached thanks to this new graphic archaeological documentation will be shown in terms of stylistic, technological, and traceological analysis.


