Finite Element-Based Simulation for Edgewise Compression Behavior of Corrugated Paperboard for Packaging of Agricultural Products


Abstract
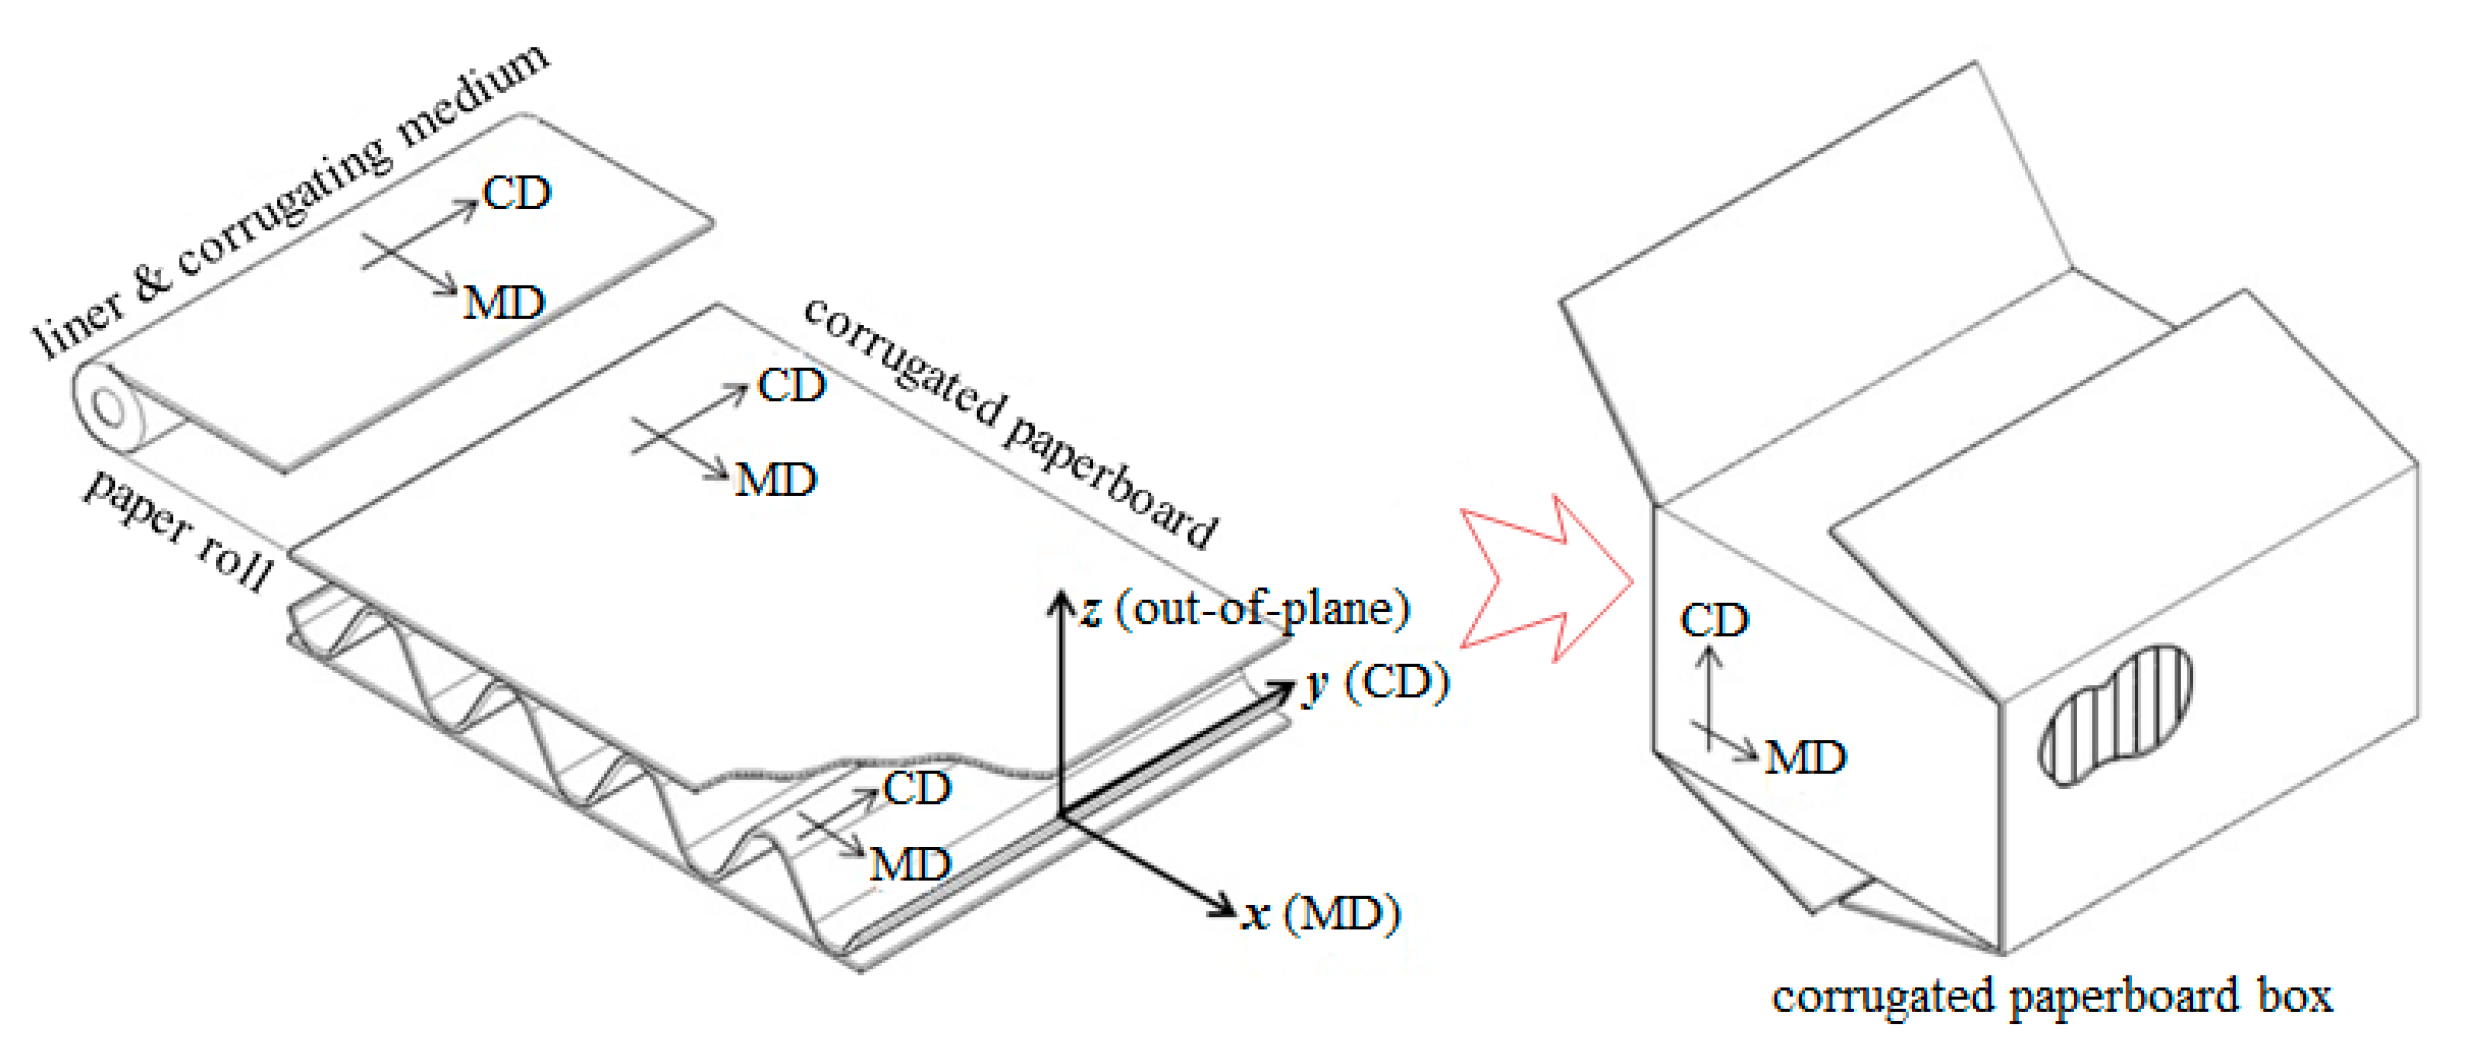
1. Introduction
2. Materials and Methods
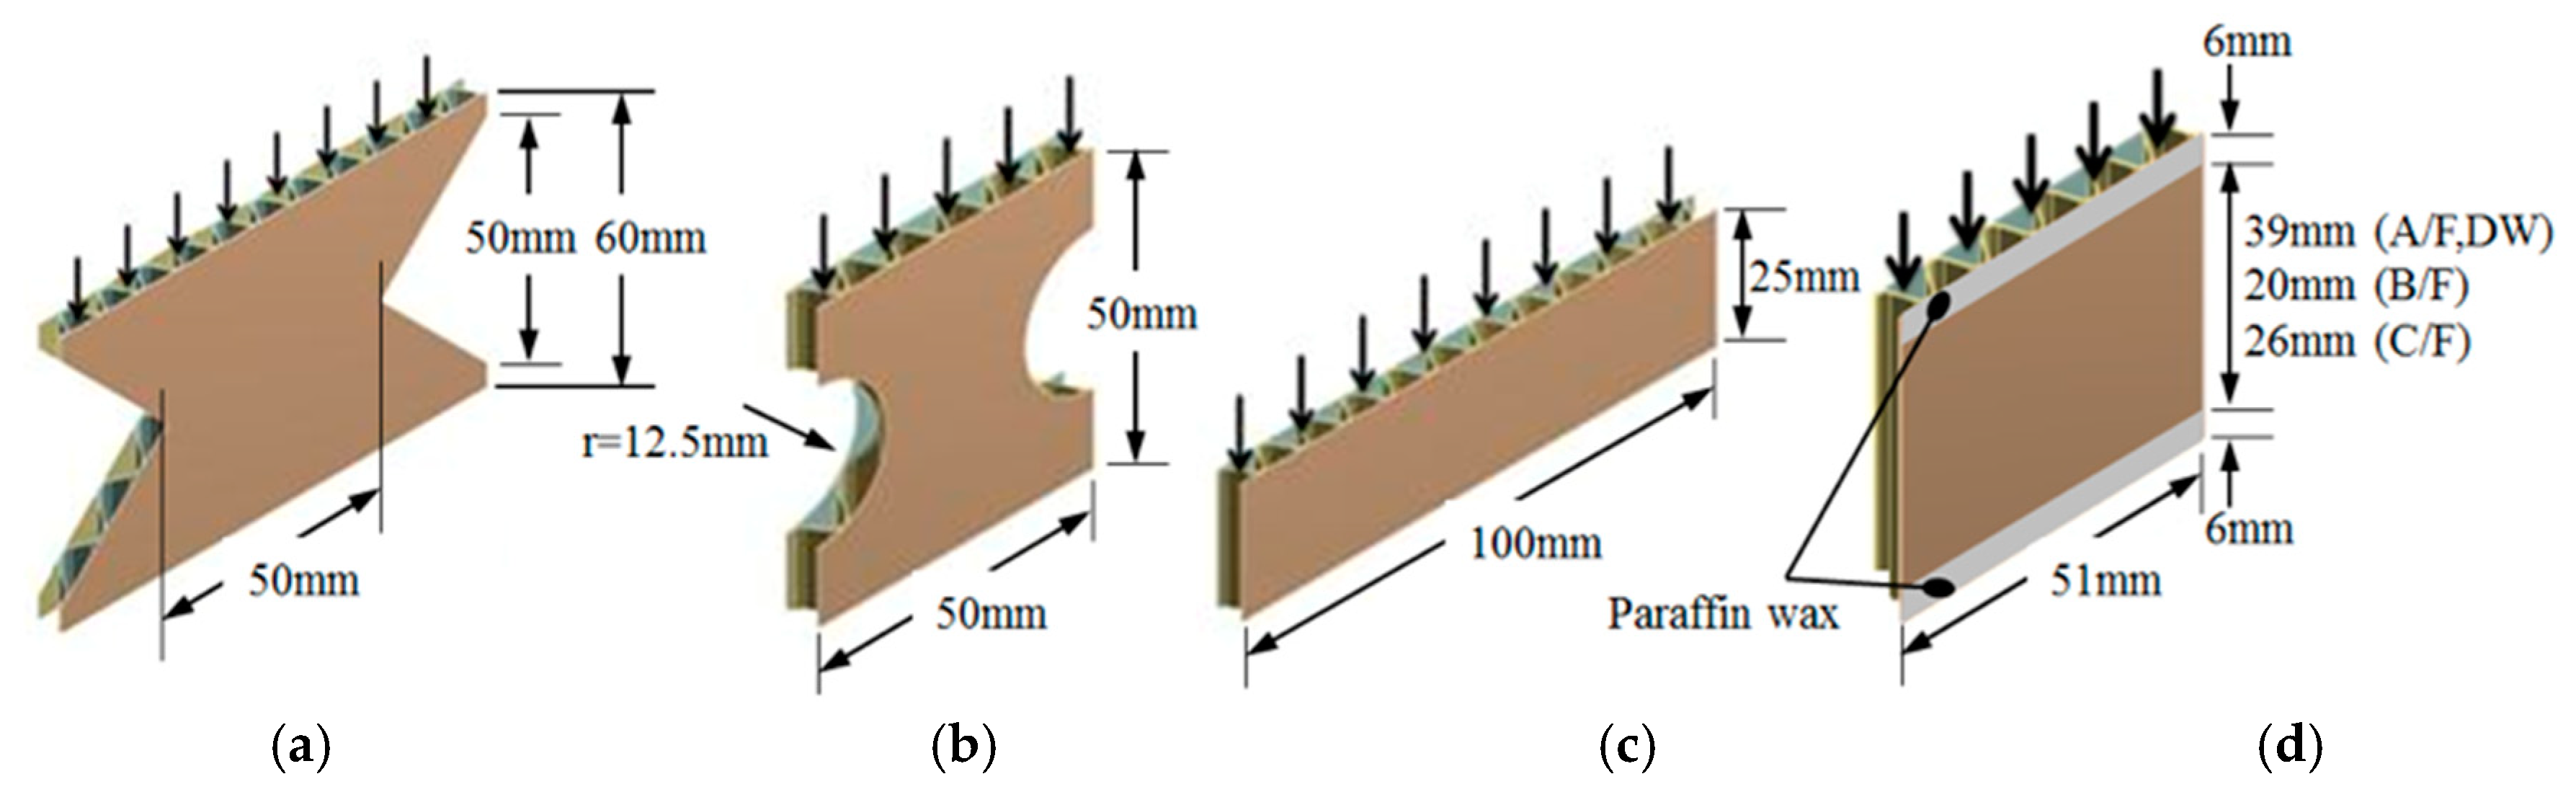
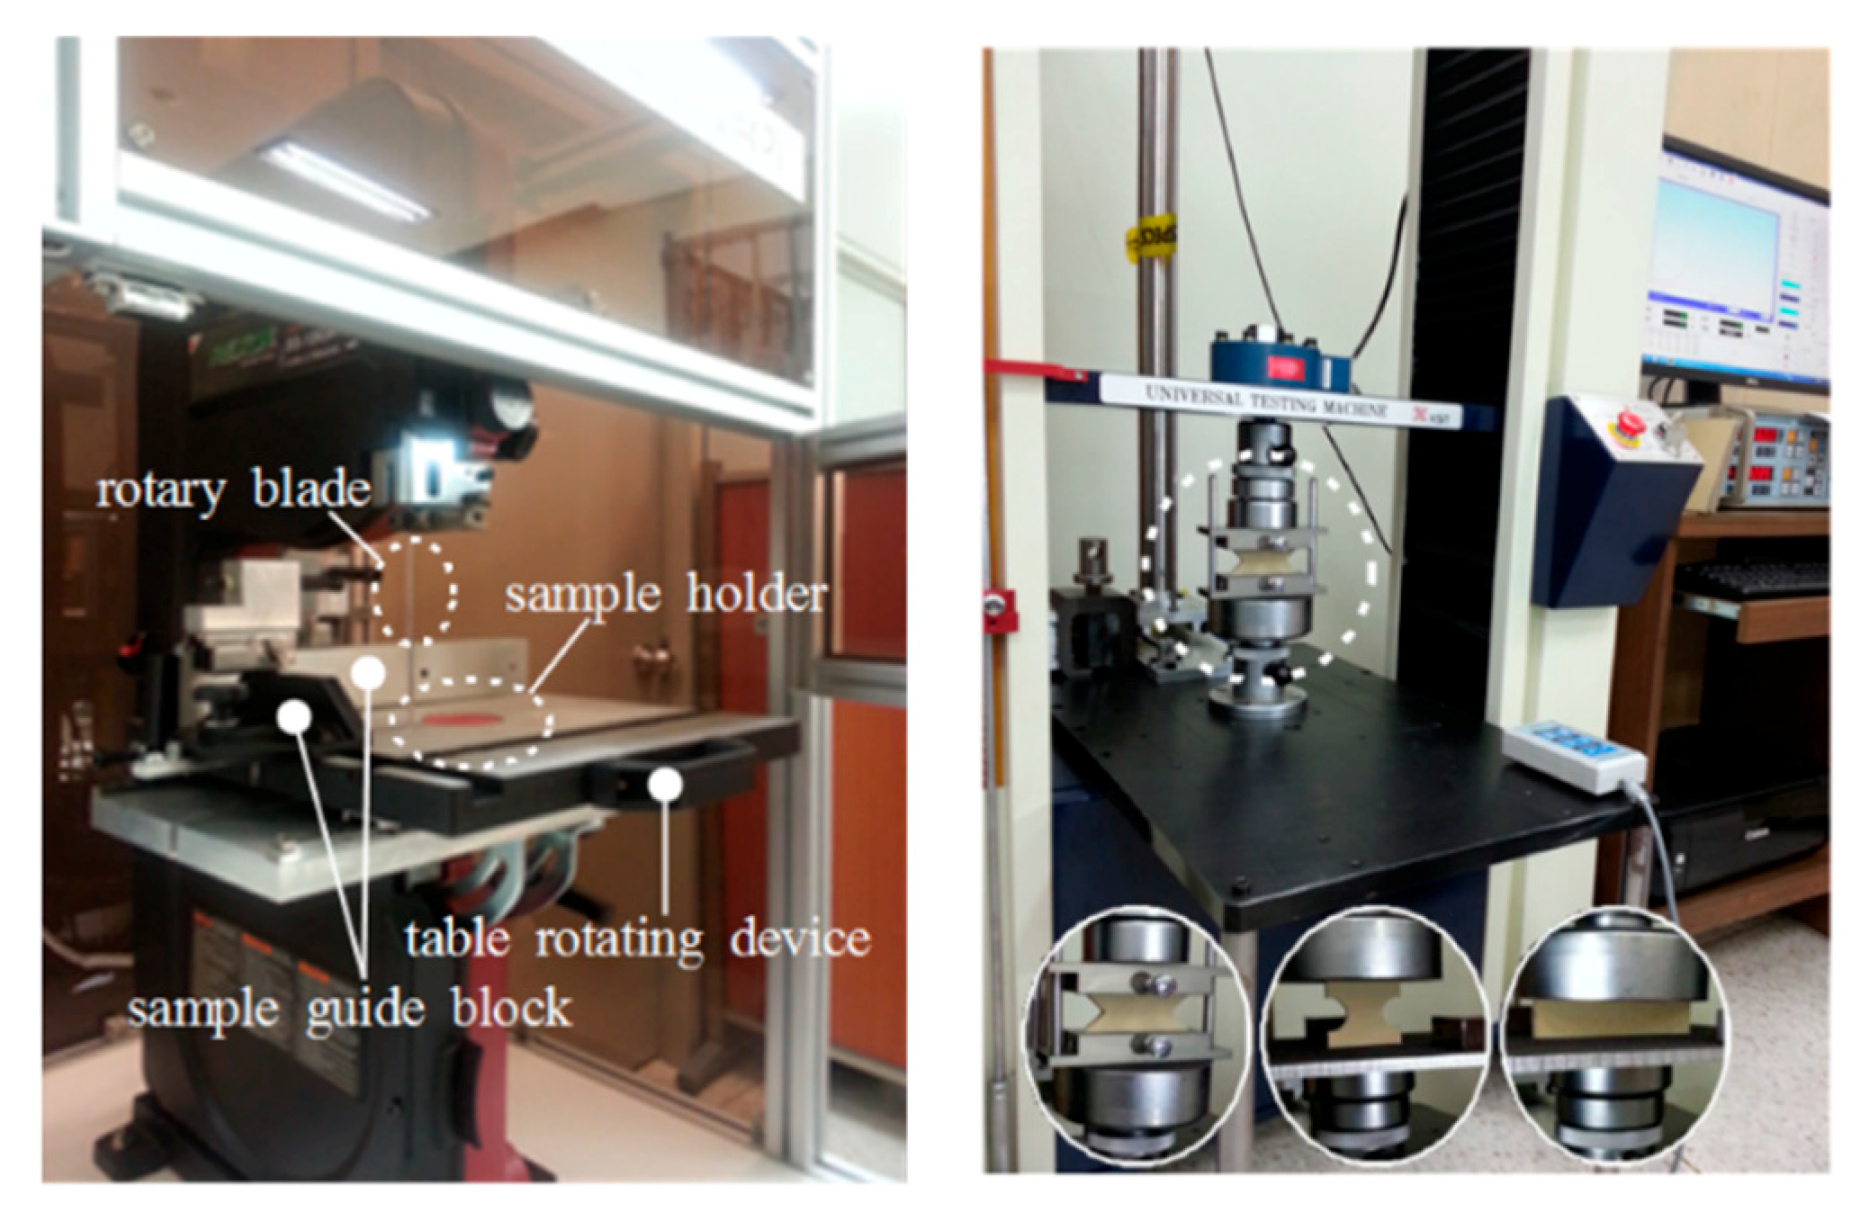
2.1. Edgewise Compression Test
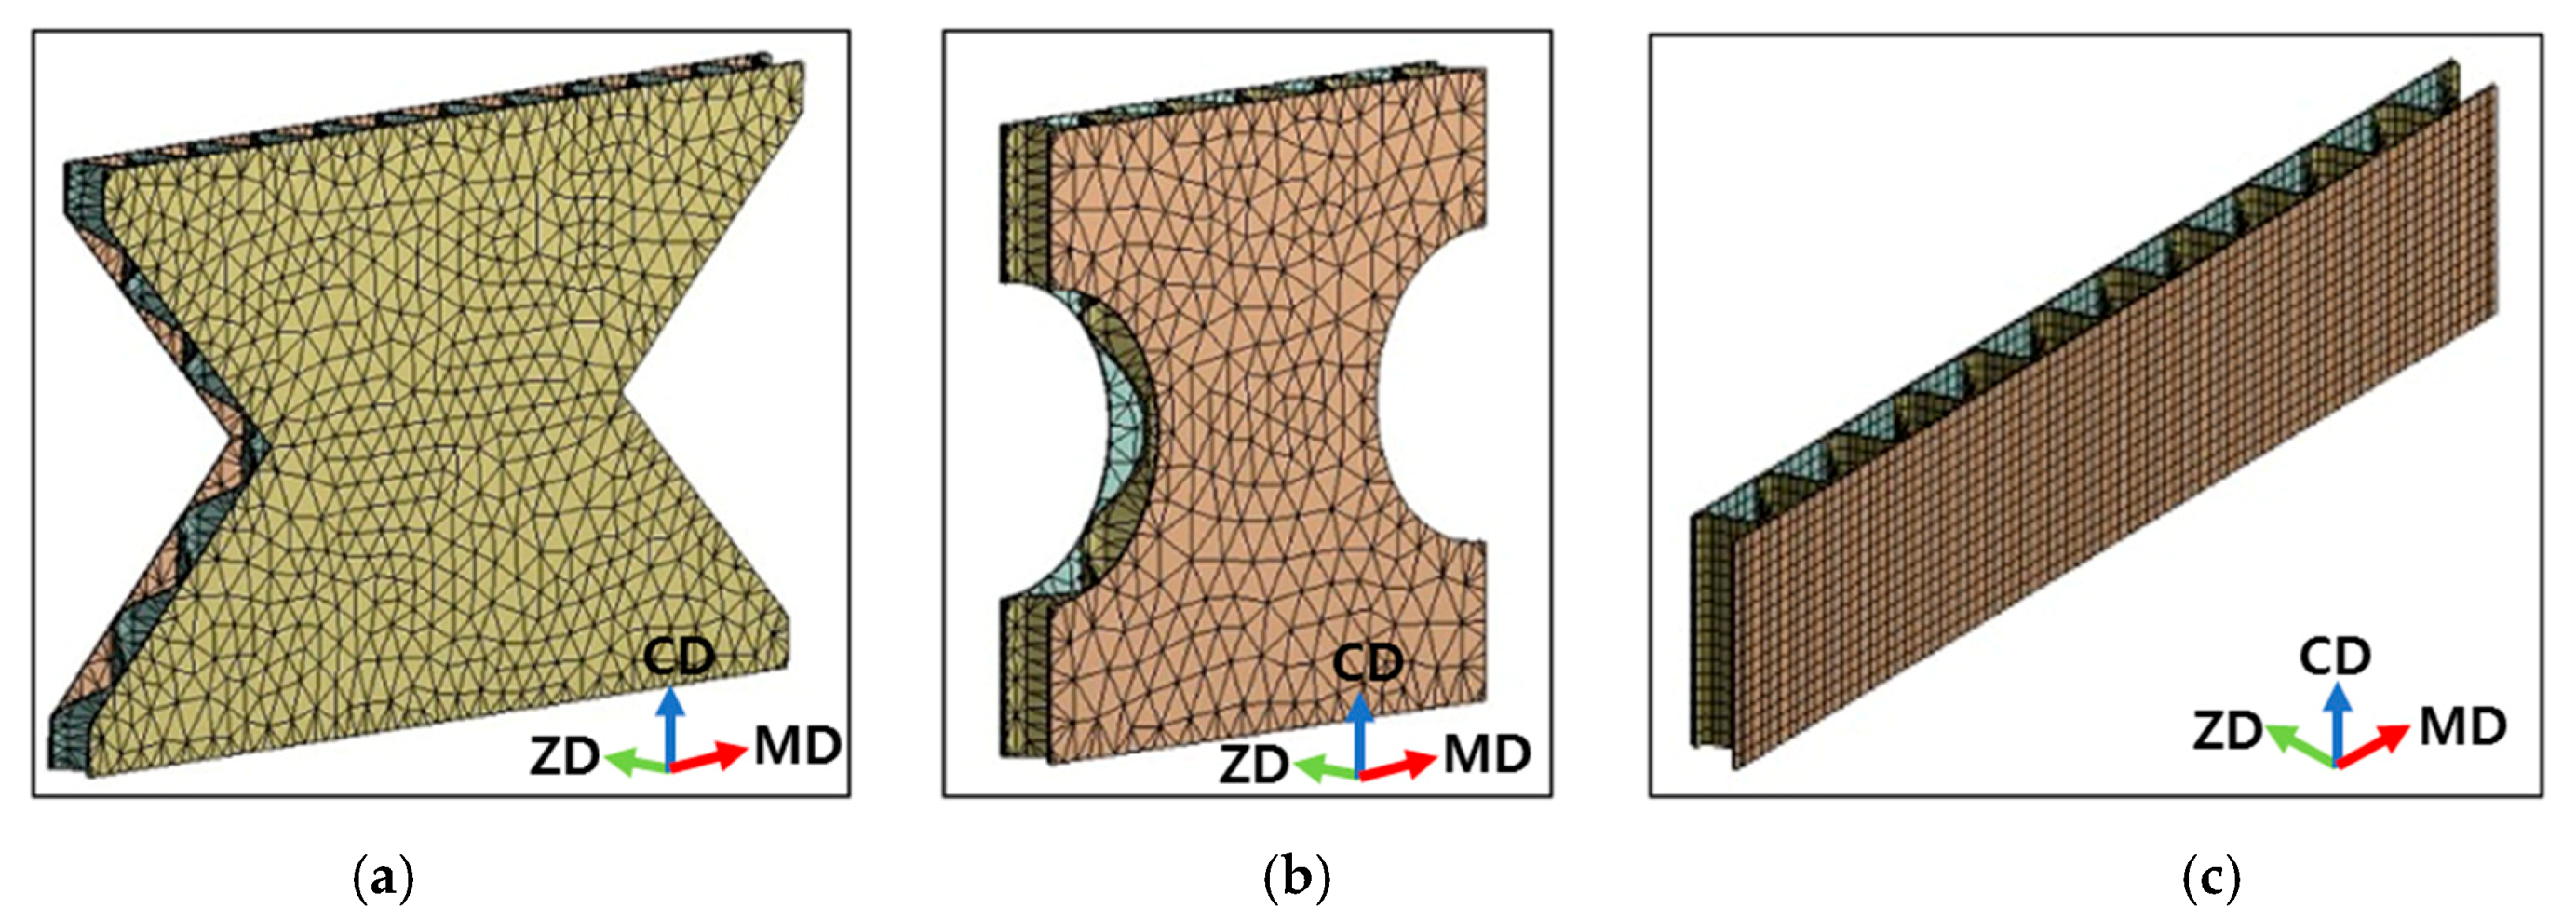
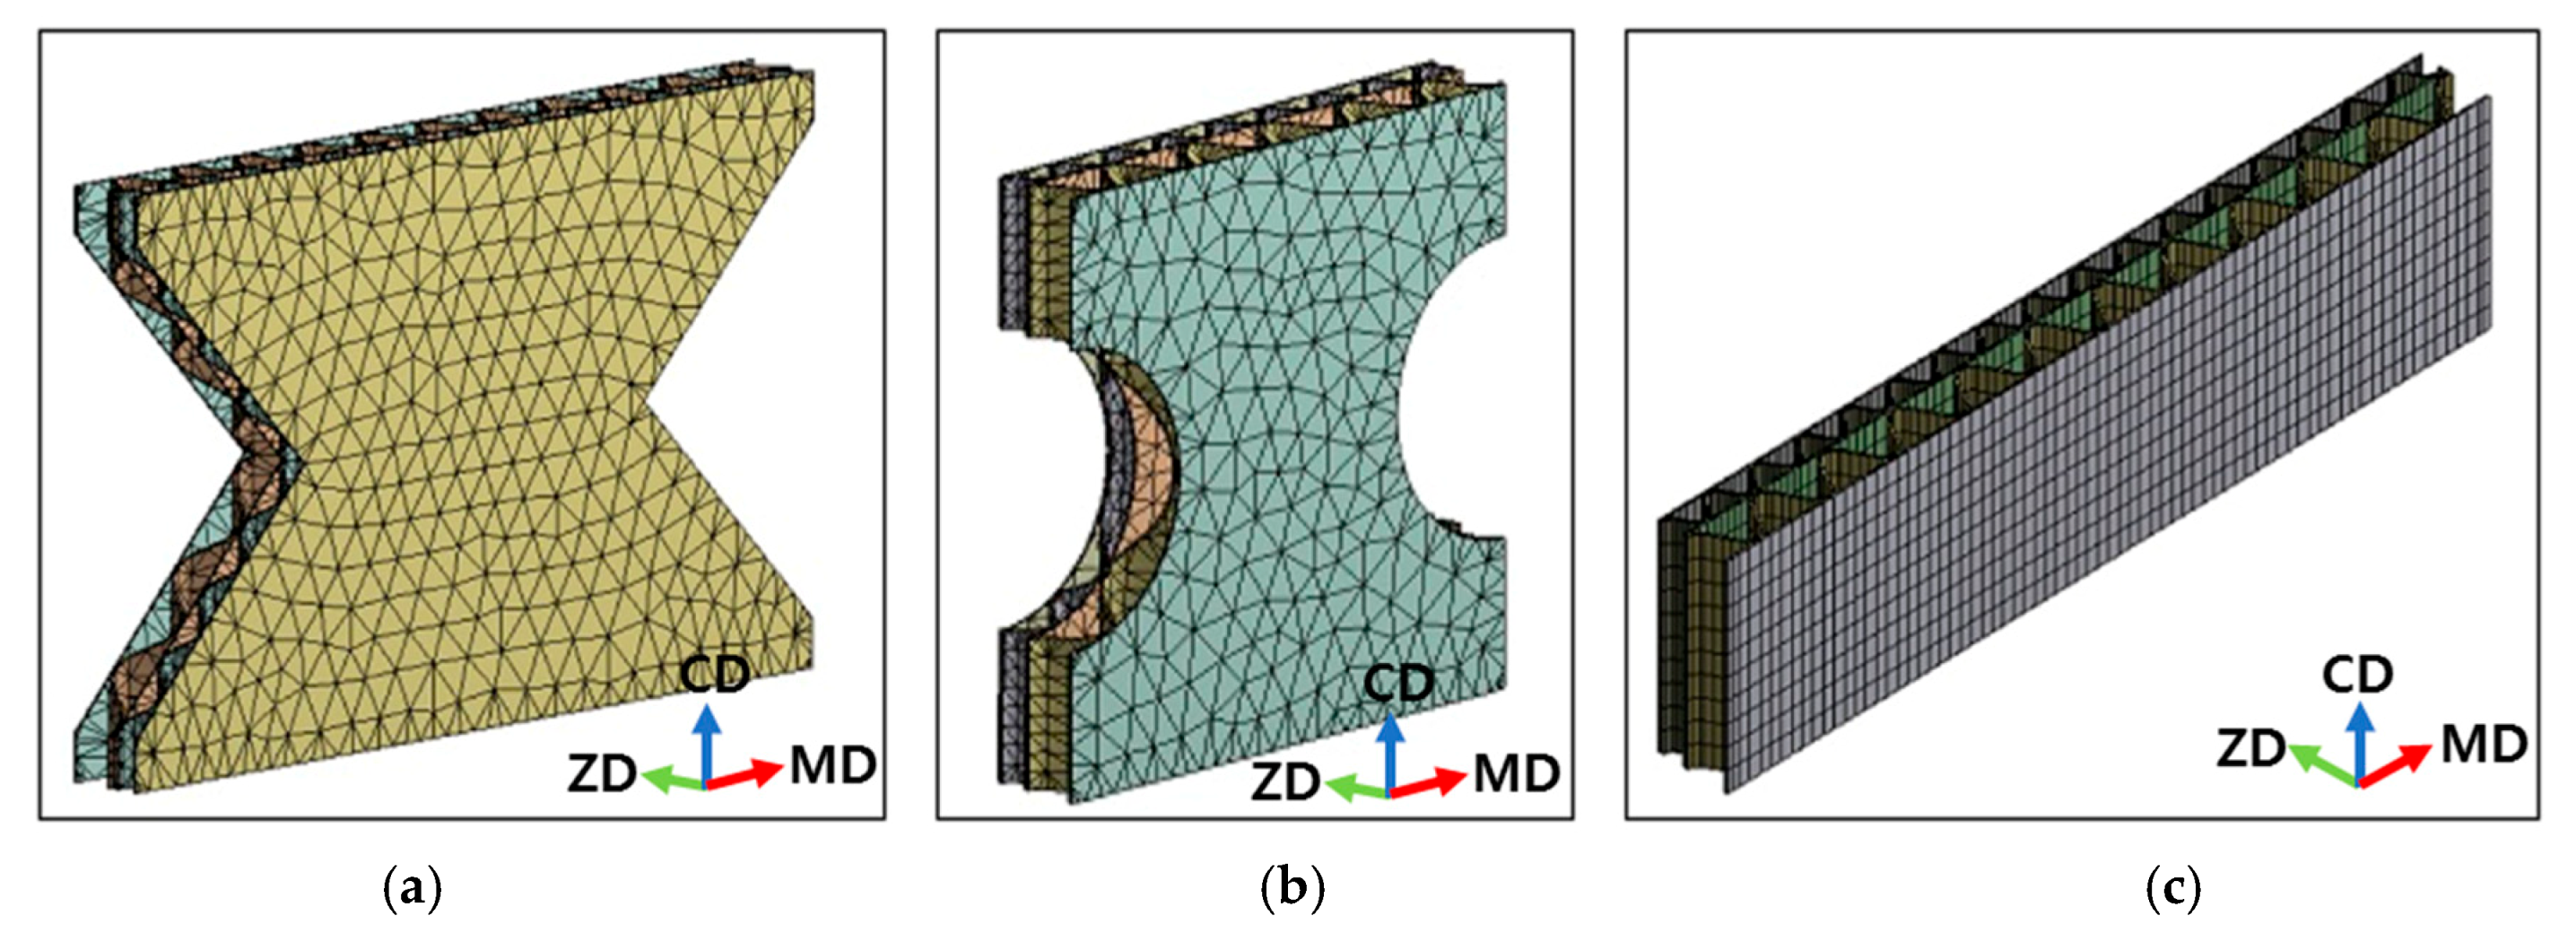
2.2. FE Modeling and Analysis Procedures
2.3. Material Properties
3. Results and Discussion
3.1. FE Simulation for Edgewise Compression Behavior
3.2. Comparison with Experimental Study
4. Conclusions
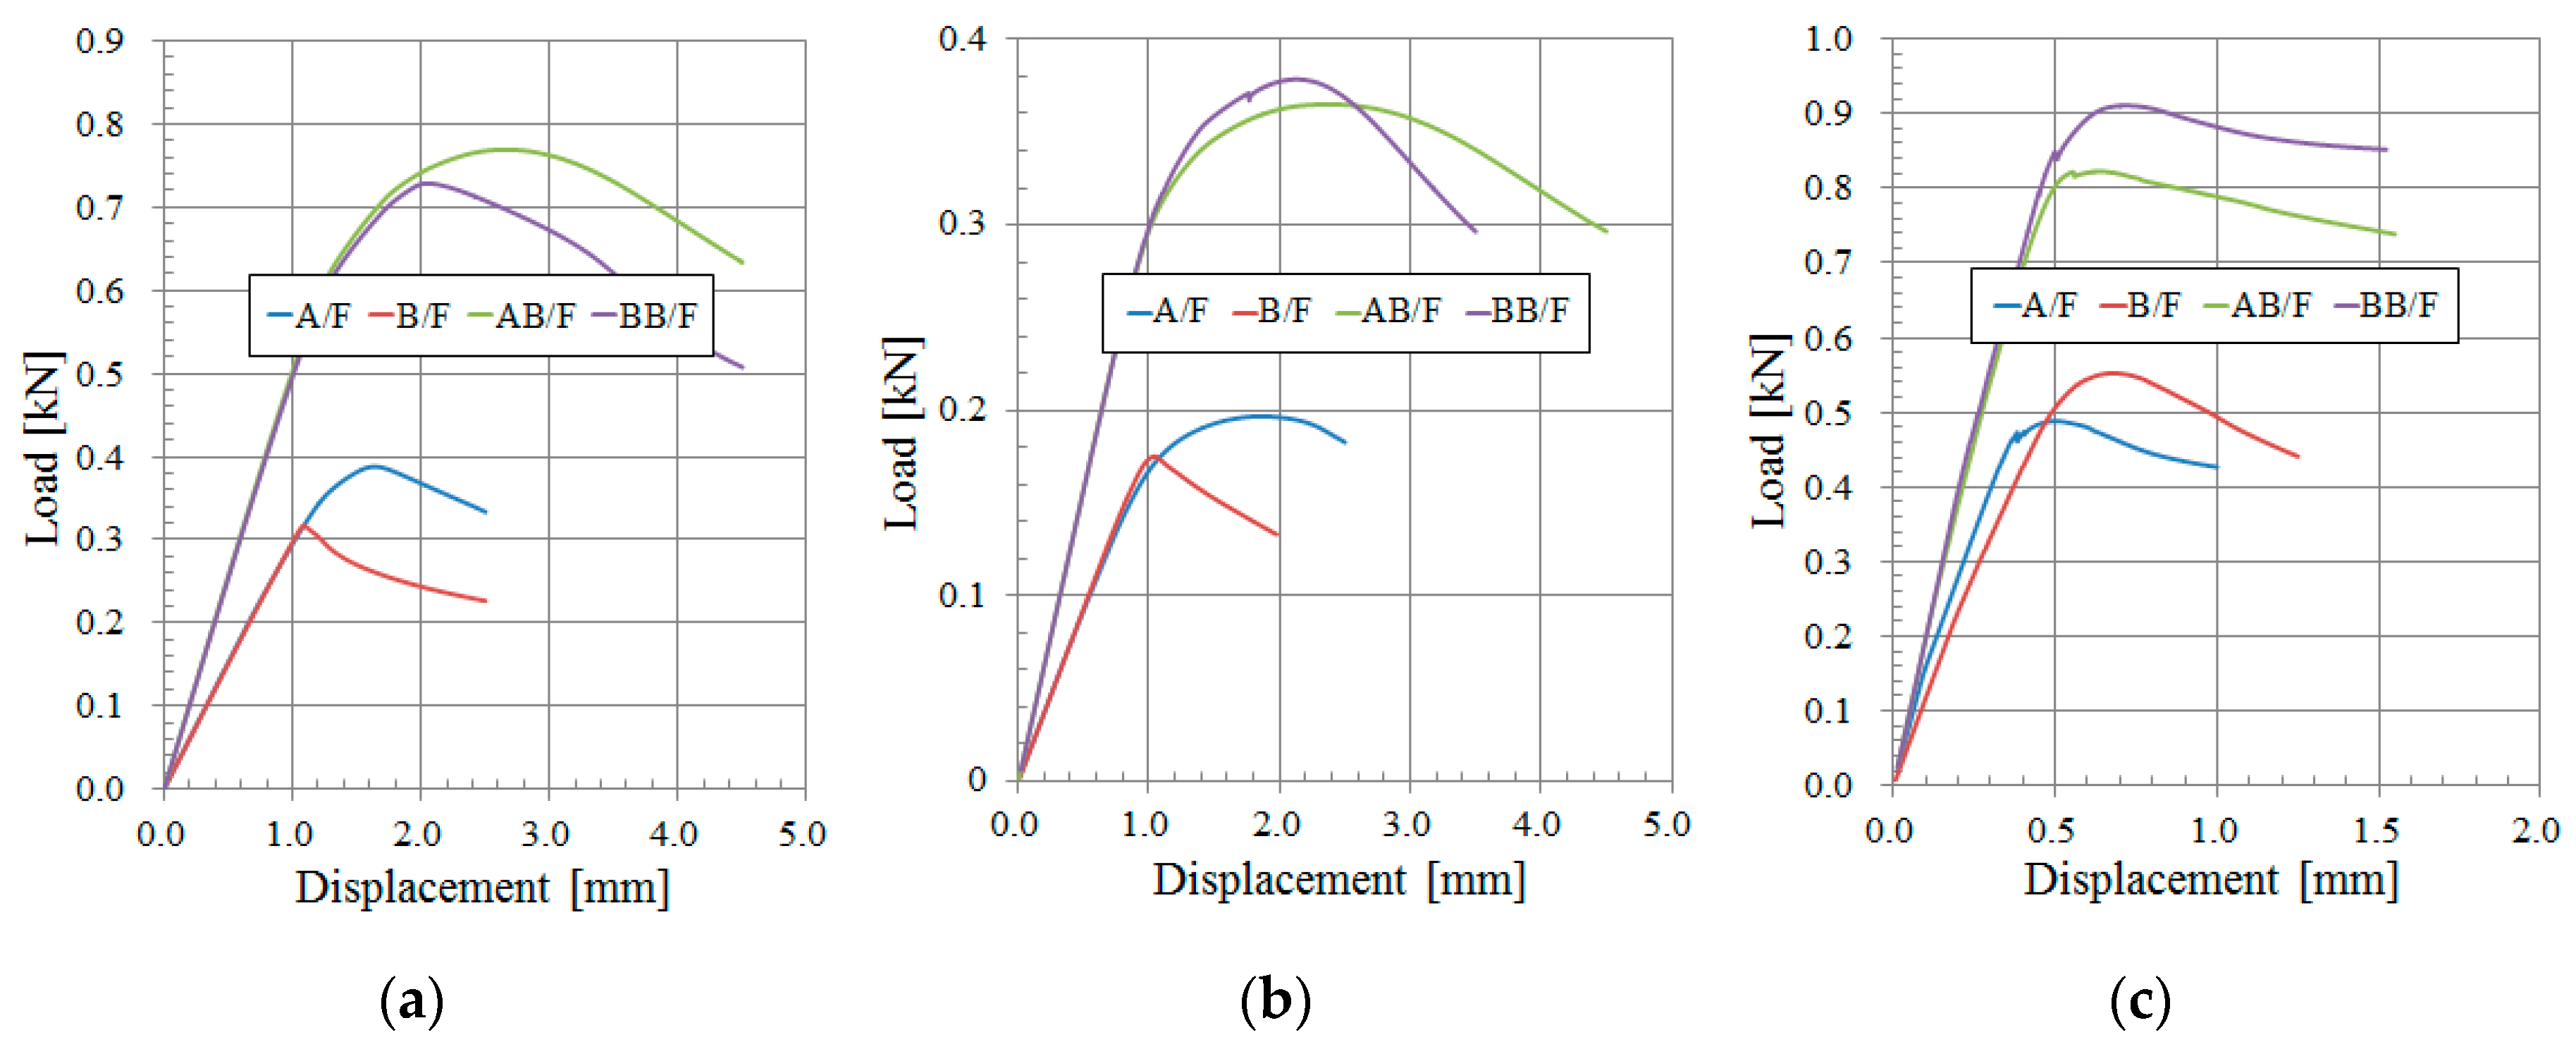
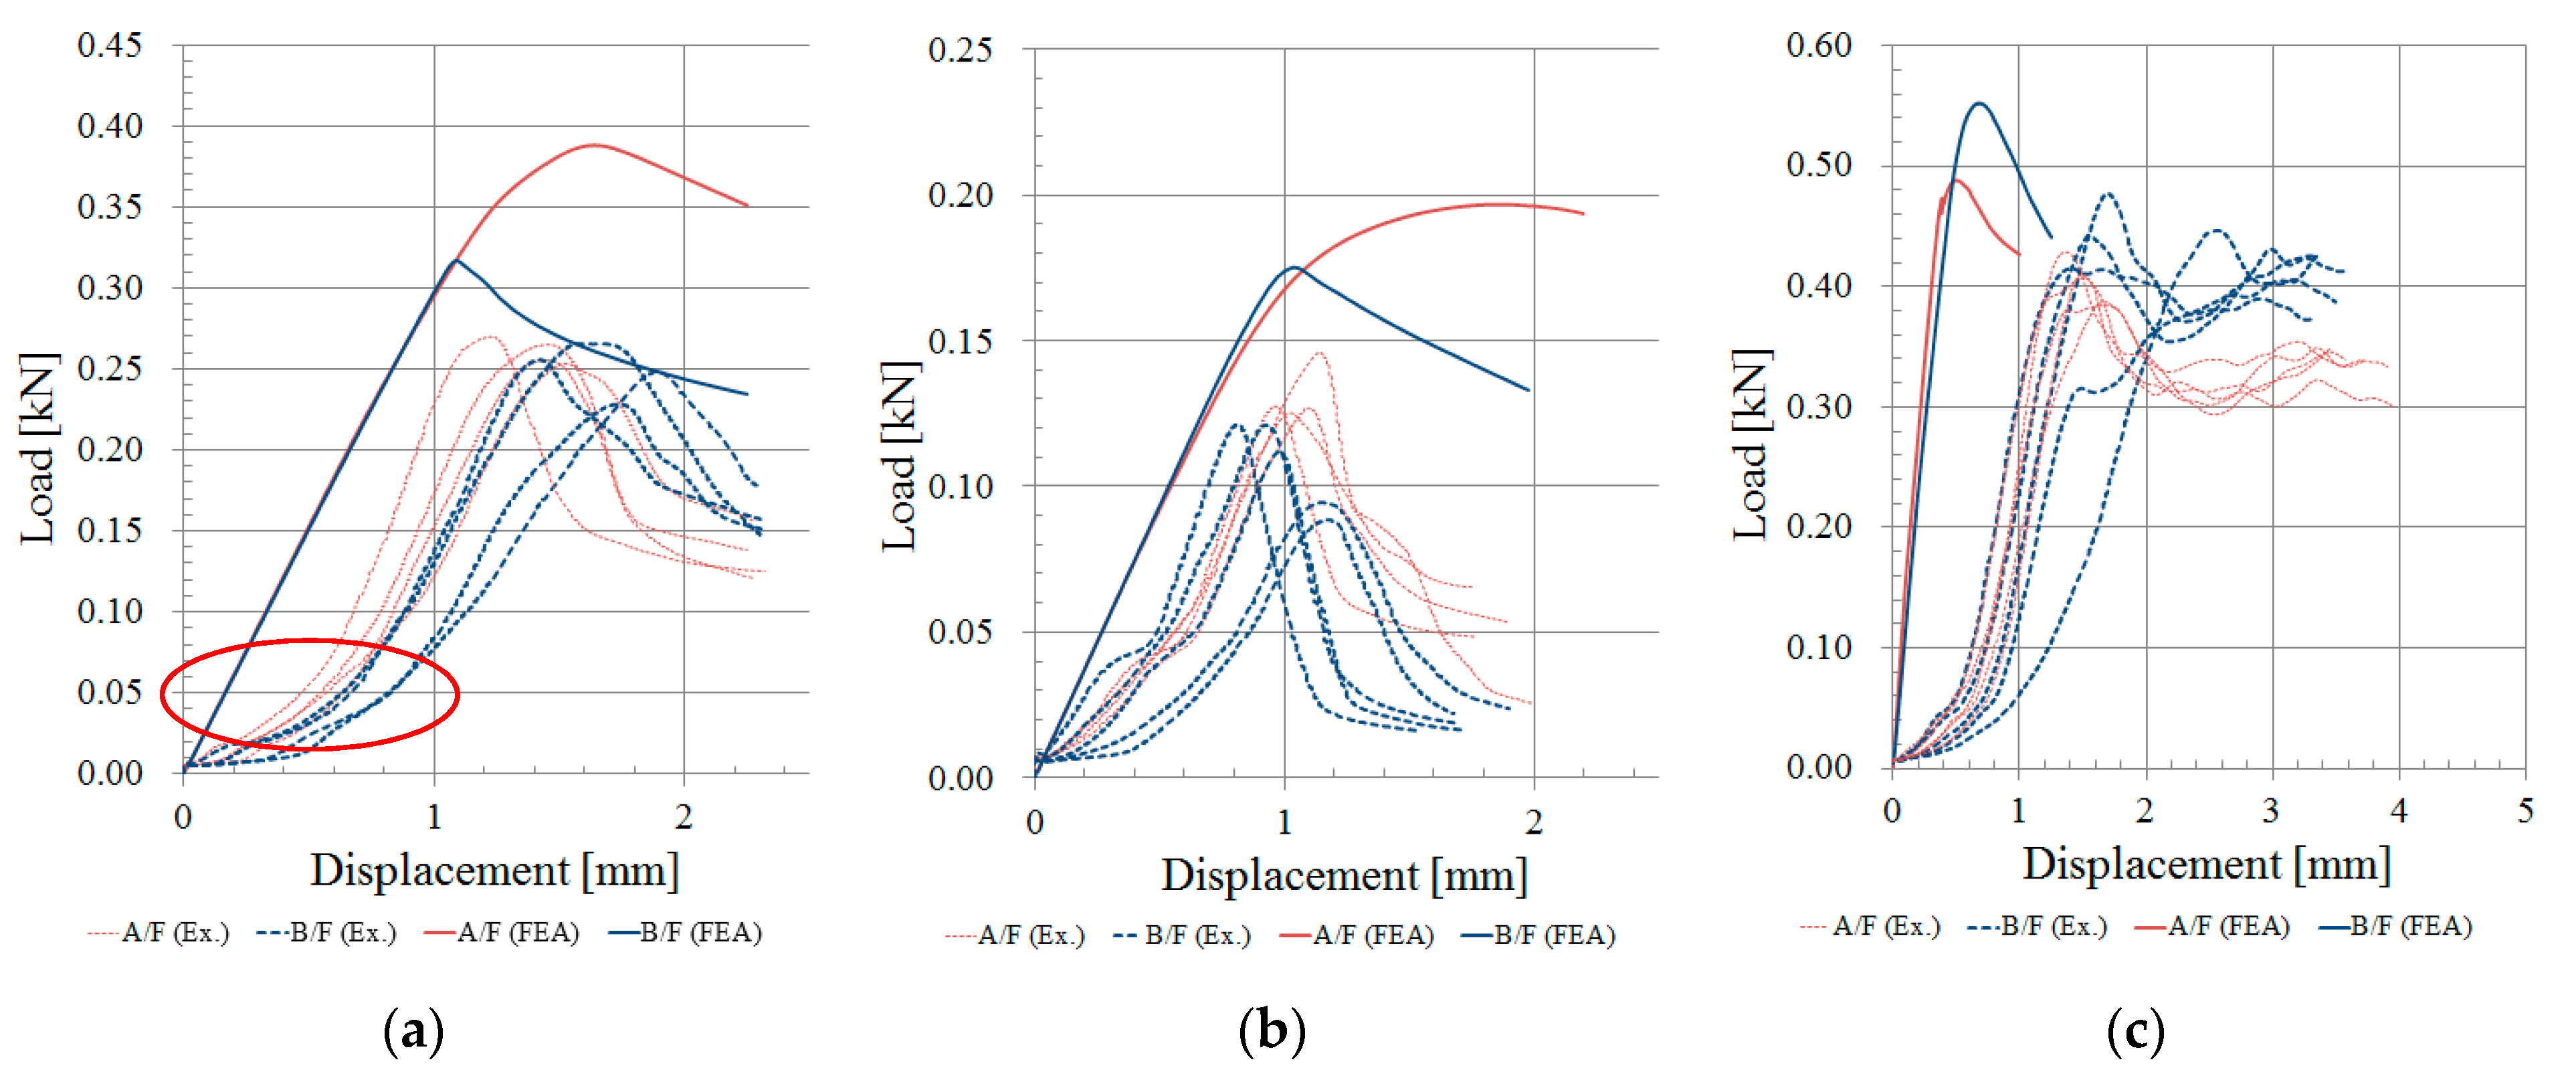
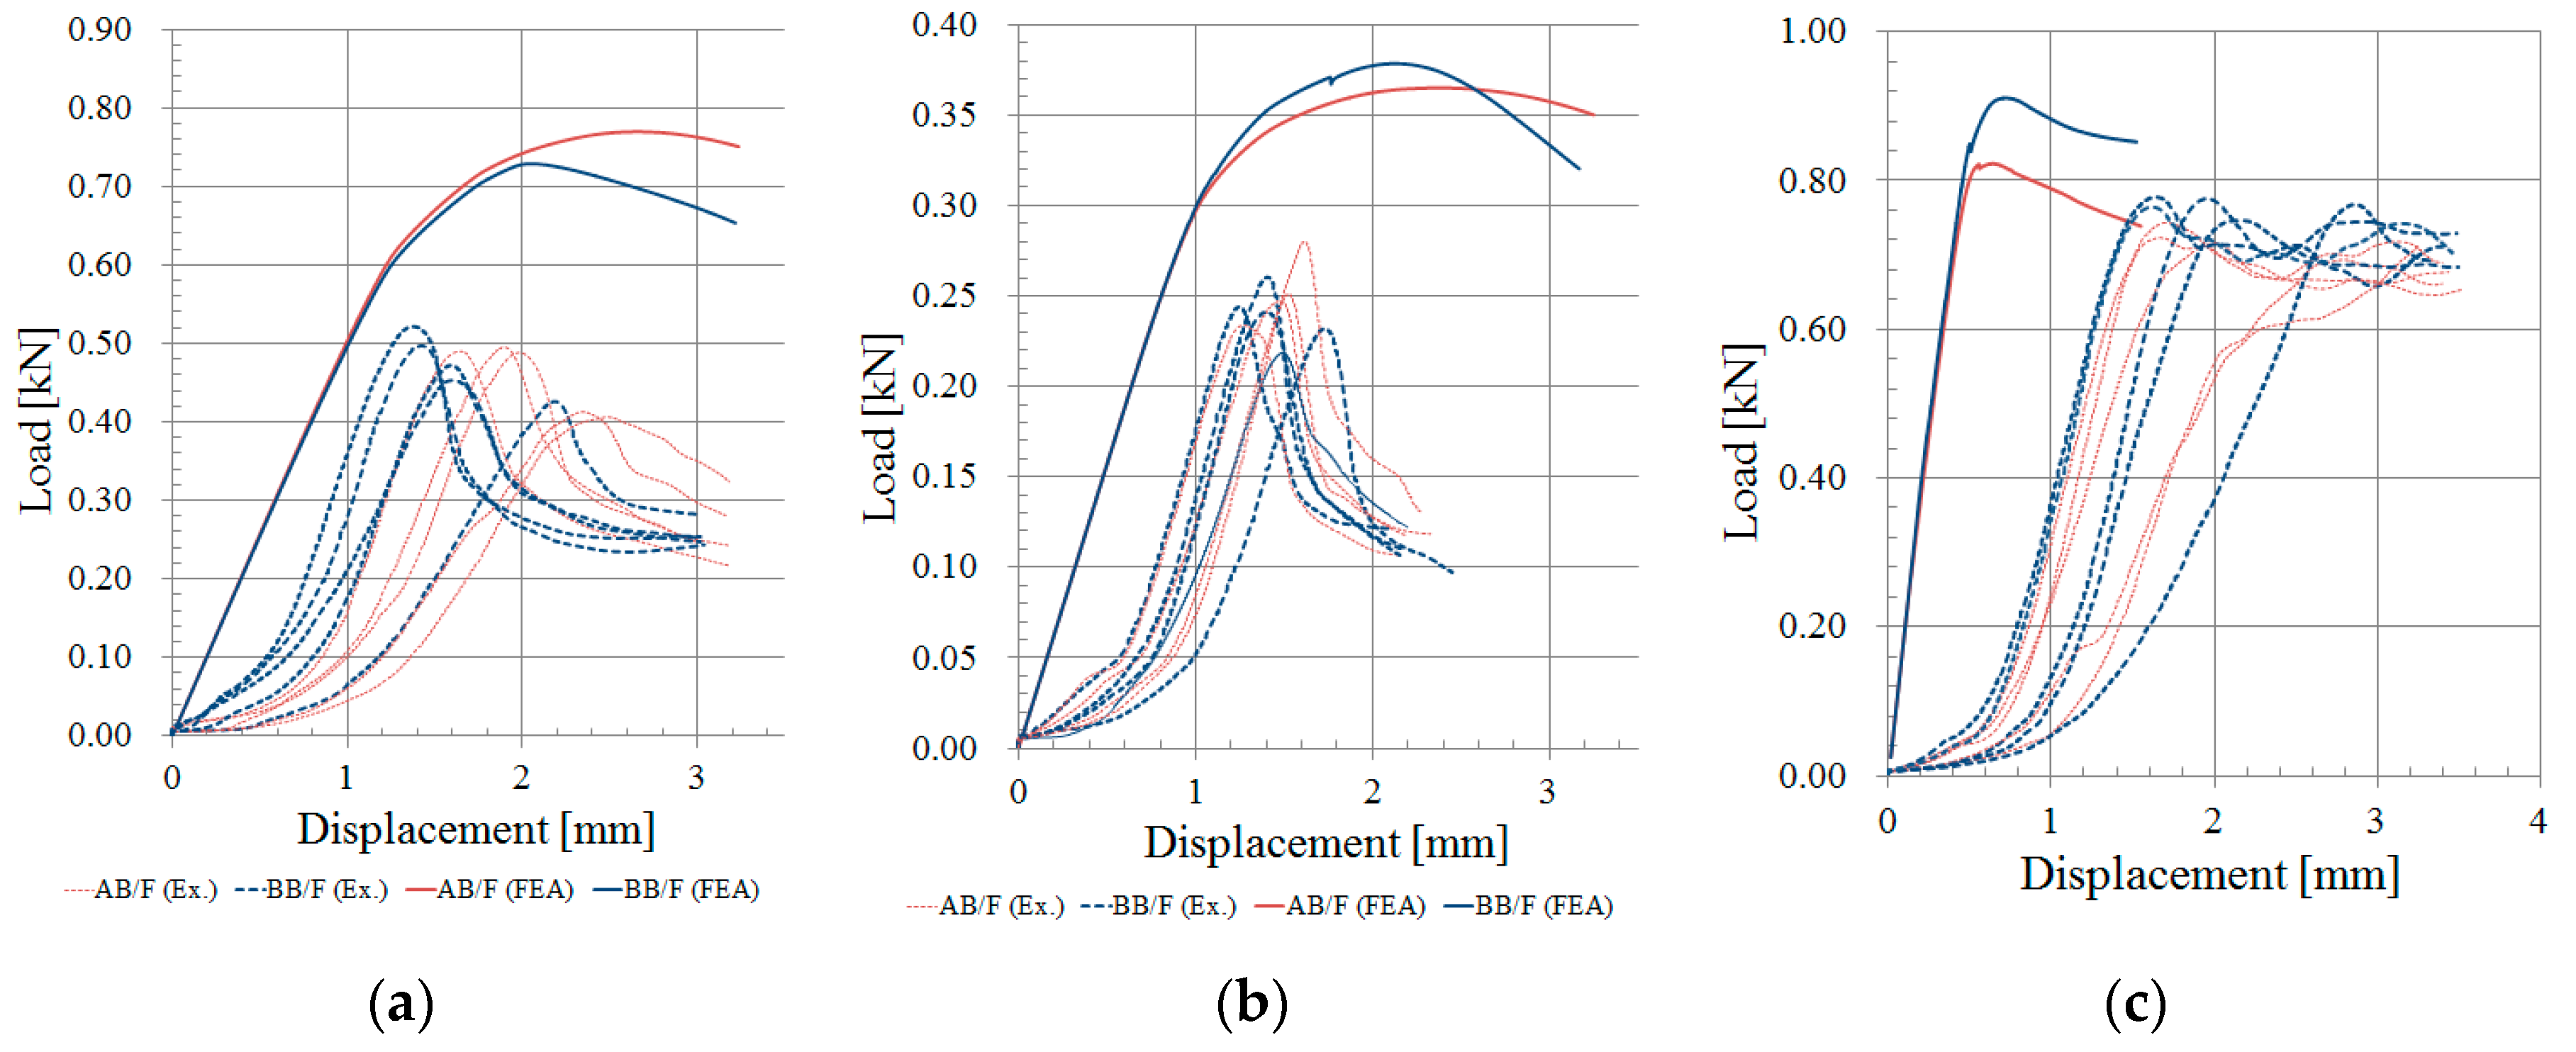
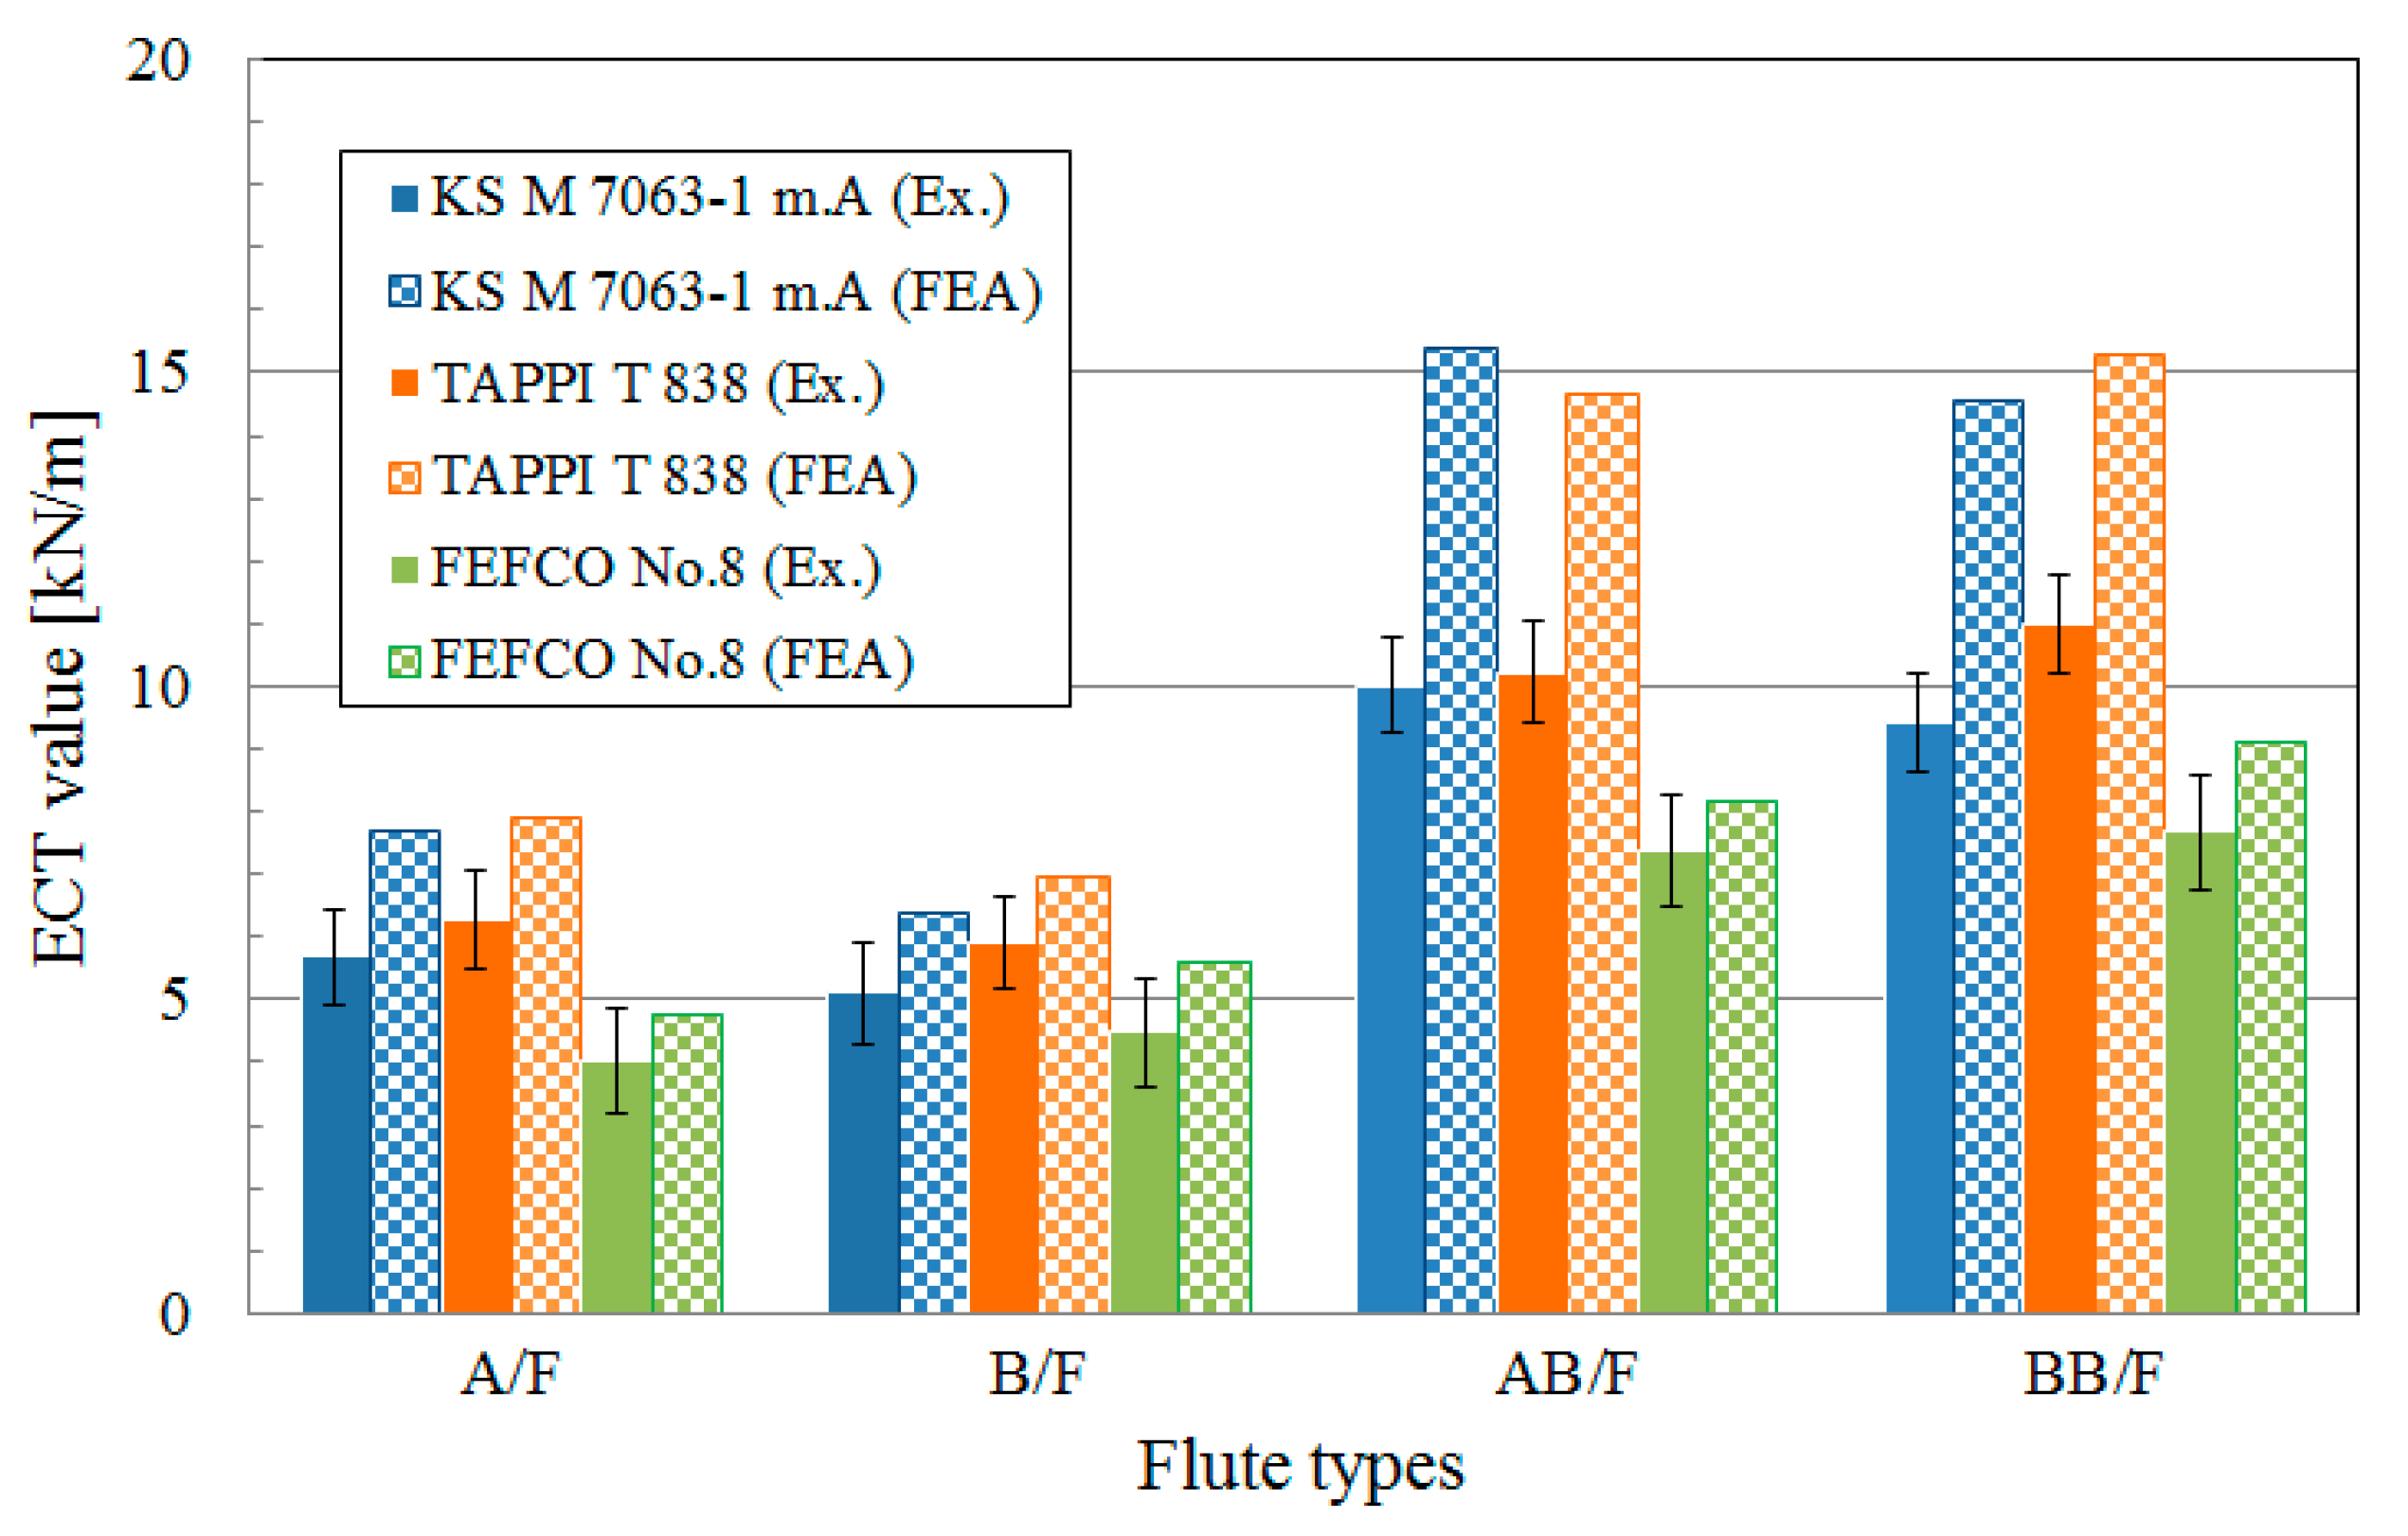
- According to the FEA results, AB/F and A/F had greater ECT values than BB/F and B/F, respectively, for KS M 7063-1 method A. However, FEFCO No.8 had an opposite trend with the KS M 7063-1 method A. For TAPPI T 838, there was a mixed trend compared to the other standards. The experimental results also showed a similar trend for the different flutes as the FEA. The trend change between the A/F and B/F or AB/F and BB/F observed for the FEFCO No. 8 samples was the consequence of the relatively low height compared to the width and small slenderness ratio of the FEFCO No.8 test specimen, leading to the small effect of corrugated paperboard thickness on the edgewise compression behavior.
- The FEA results showed that A/F, B/F, AB/F, and BB/F for FEFCO No.8 had 38% less, 16% less, 45% less, and 39% less ECT values than those values for KS M 7063-1 method A and TAPPI T 838. Meanwhile, the experimental results also showed that the ECT results of FEFCO No.8 were less than those of KS M 7063-1 method A and TAPPI T 838: 33% less (A/F), 19% less (B/F), 27% less (AB/F), and 25% less (BB/F). Though the experimental ECT values were different from the FEA ECT values, there were similar trends of ECT values depending on the standards and flute types. The main cause of the difference between the experimental ECT and FEA ECT values was that the connection between the liner and flute was treated as a shared node instead of the actual condition of the connection using an adhesive.
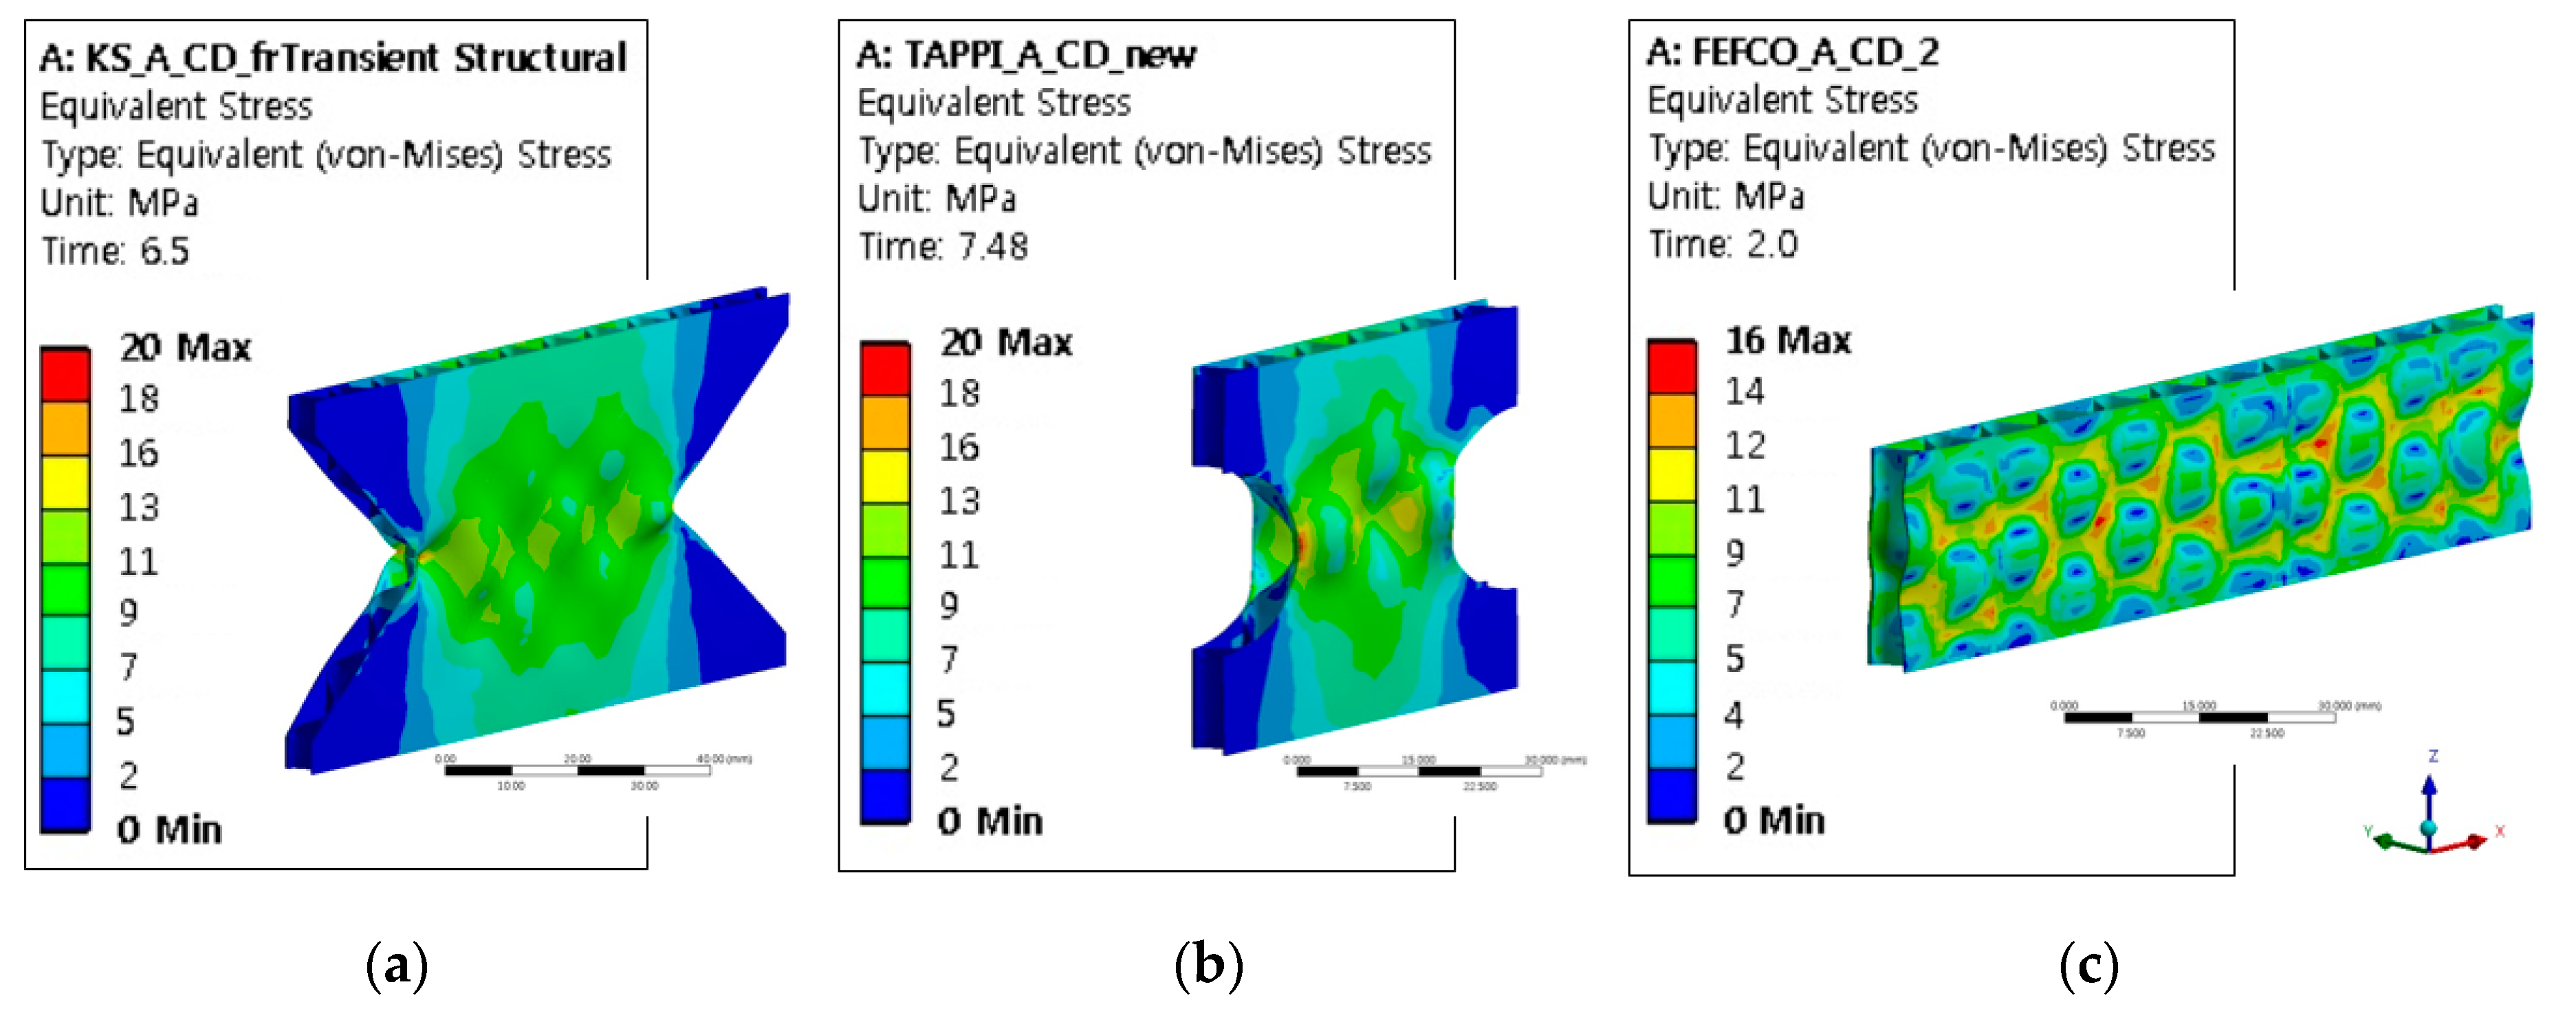
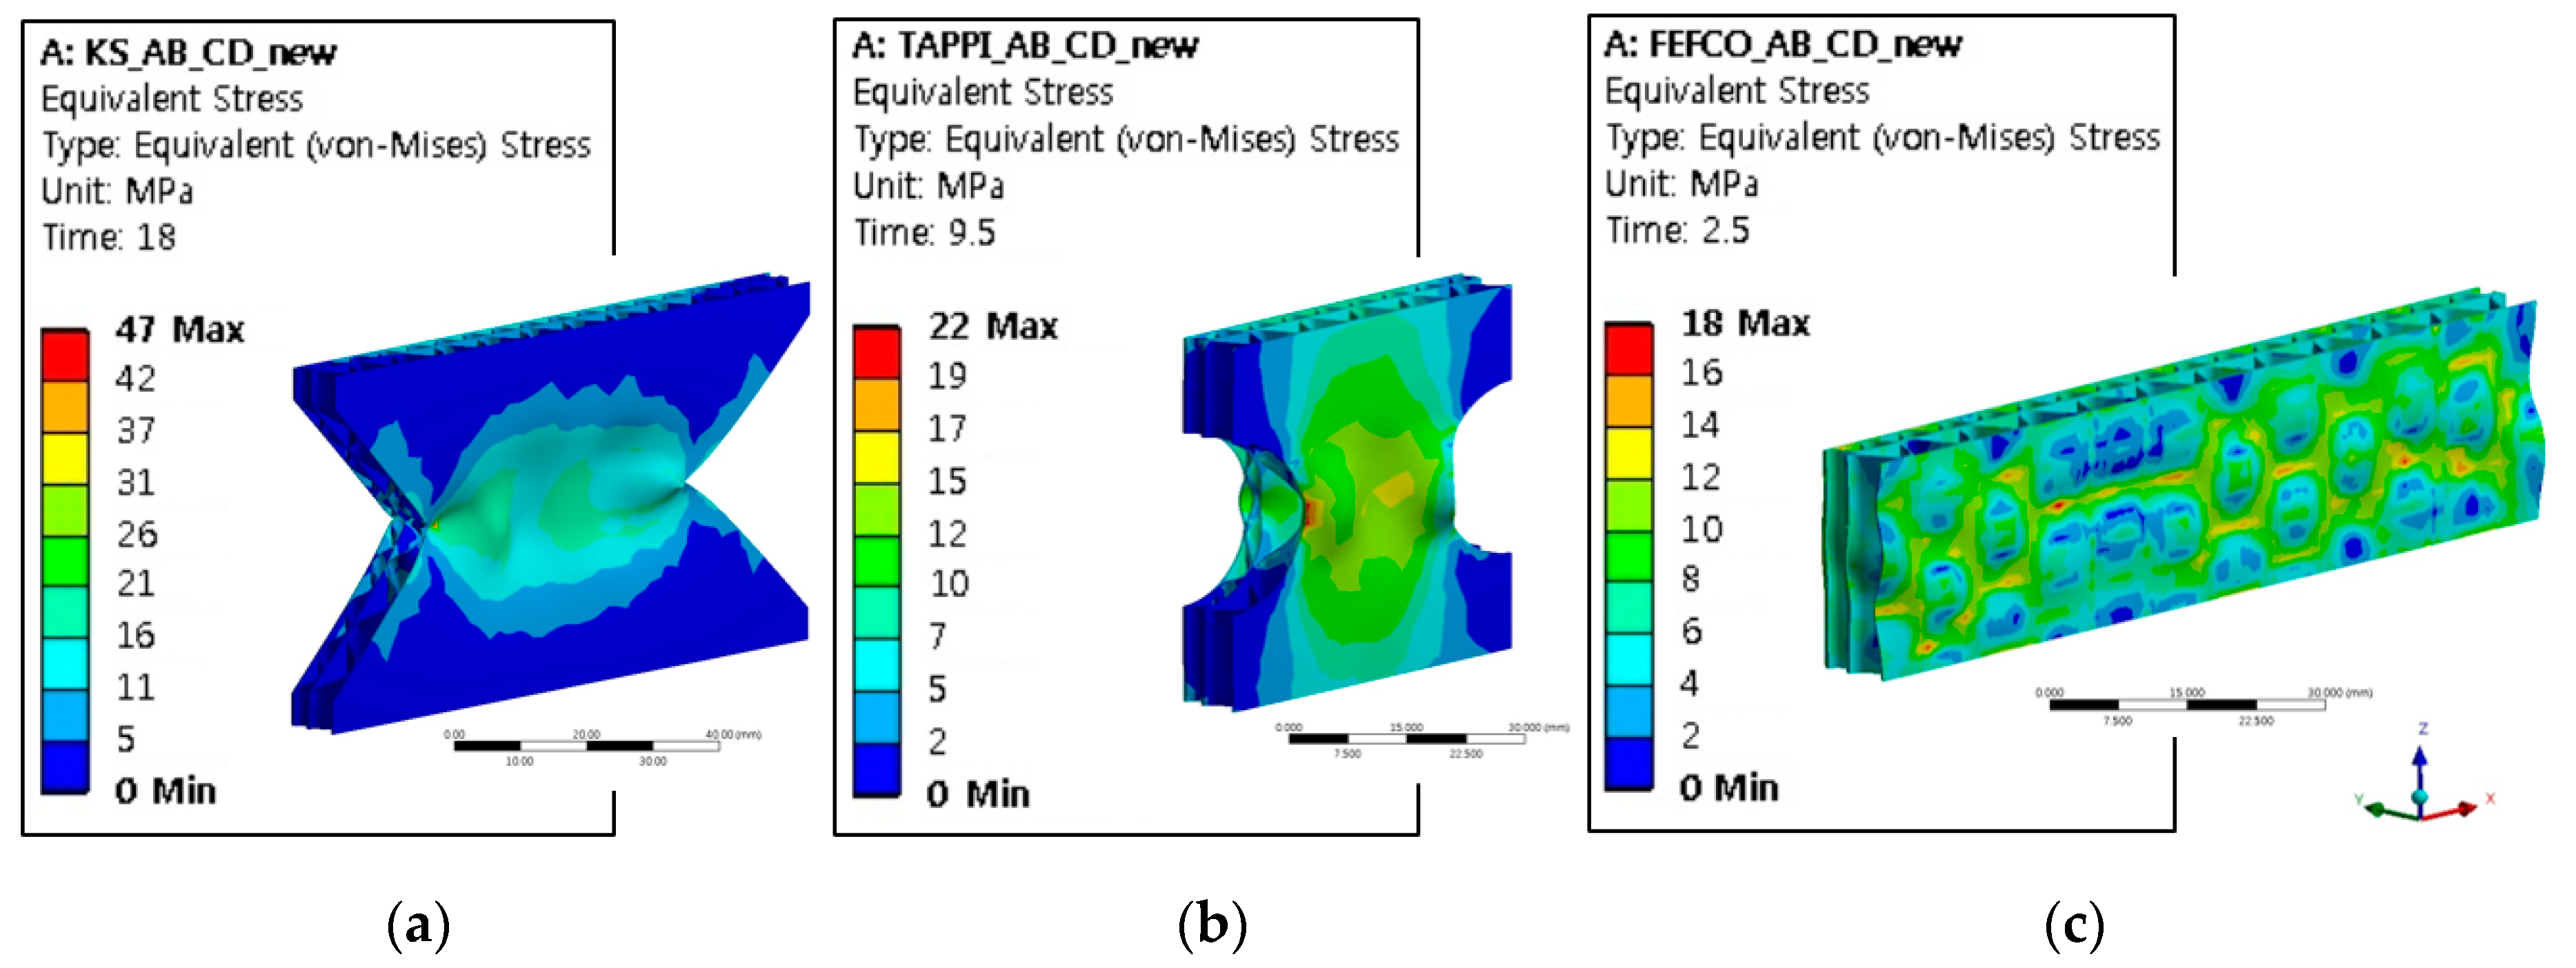
- For the KS M 7063-1 method A and the TAPPI T 838, there was a local buckling of liners around the neck-down section, and the maximum stress generated at the edge of the neck-down section. For FEFCO No.8, however, the local buckling area of the liner was wide due to the uniformly distributed stress over the test specimen surface. Through experimental observation, it was observed that the delamination between the liner and the corrugating medium around the neck-down led to the total destruction of the test specimens for the KS M 7063-1 method A and TAPPI T 838, while it resulted in crushing and delamination at the top and bottom edge of the test specimen for FEFCO No.8.
- Although the FE-based computer simulation technique overpredicted the ECT values of corrugated paperboard, it still can be a useful tool that can replace the ECT of corrugated paperboard if the material properties of the corrugated board components and the FE modeling methods are further investigated.
Author Contributions
Funding
Conflicts of Interest
Appendix A
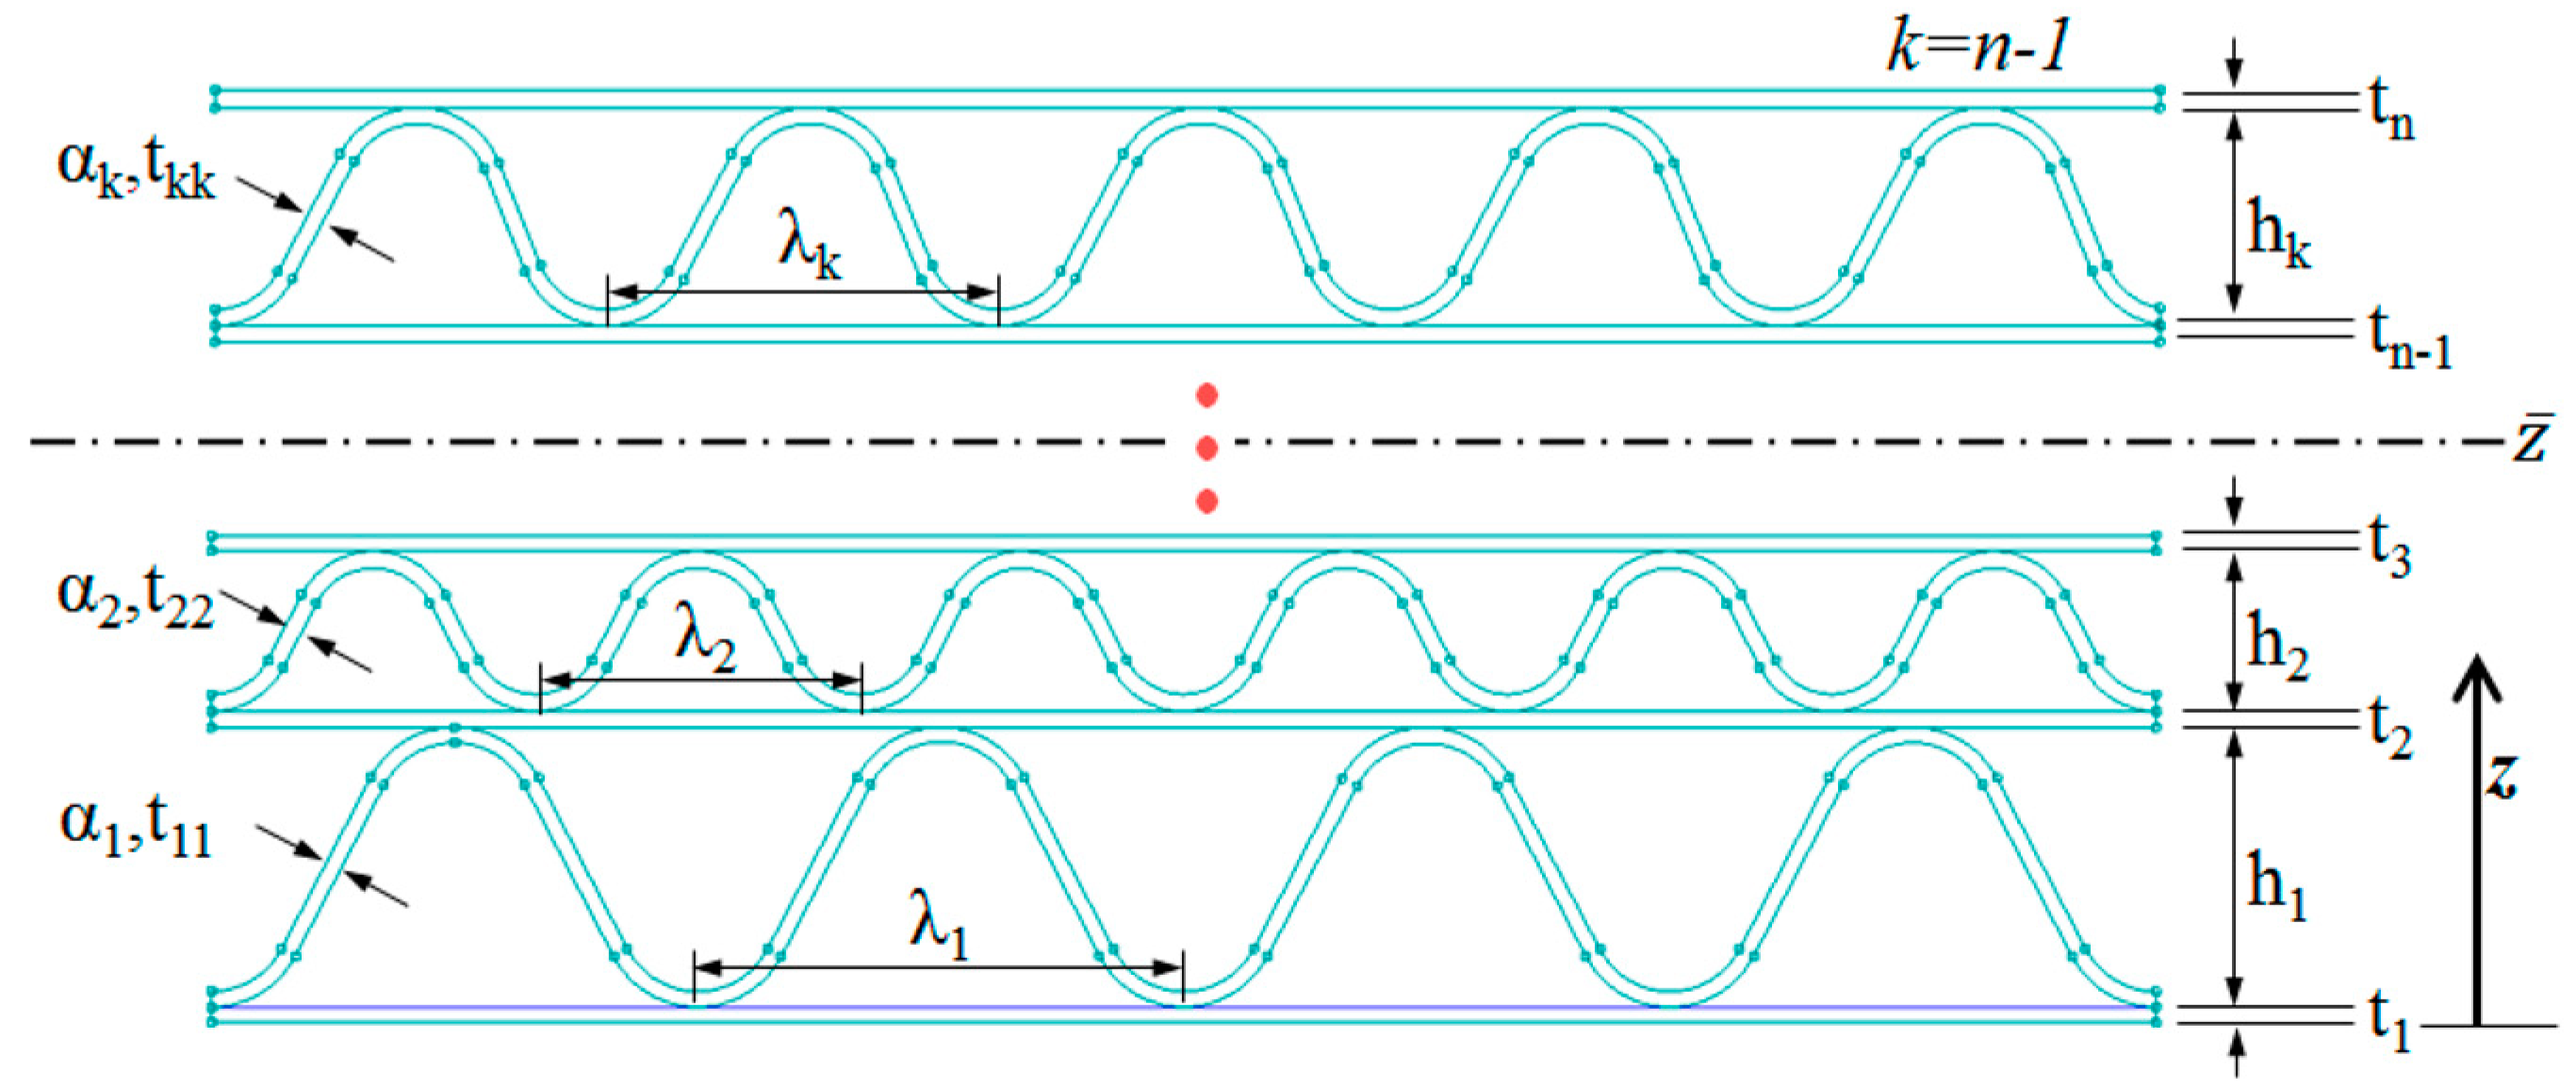
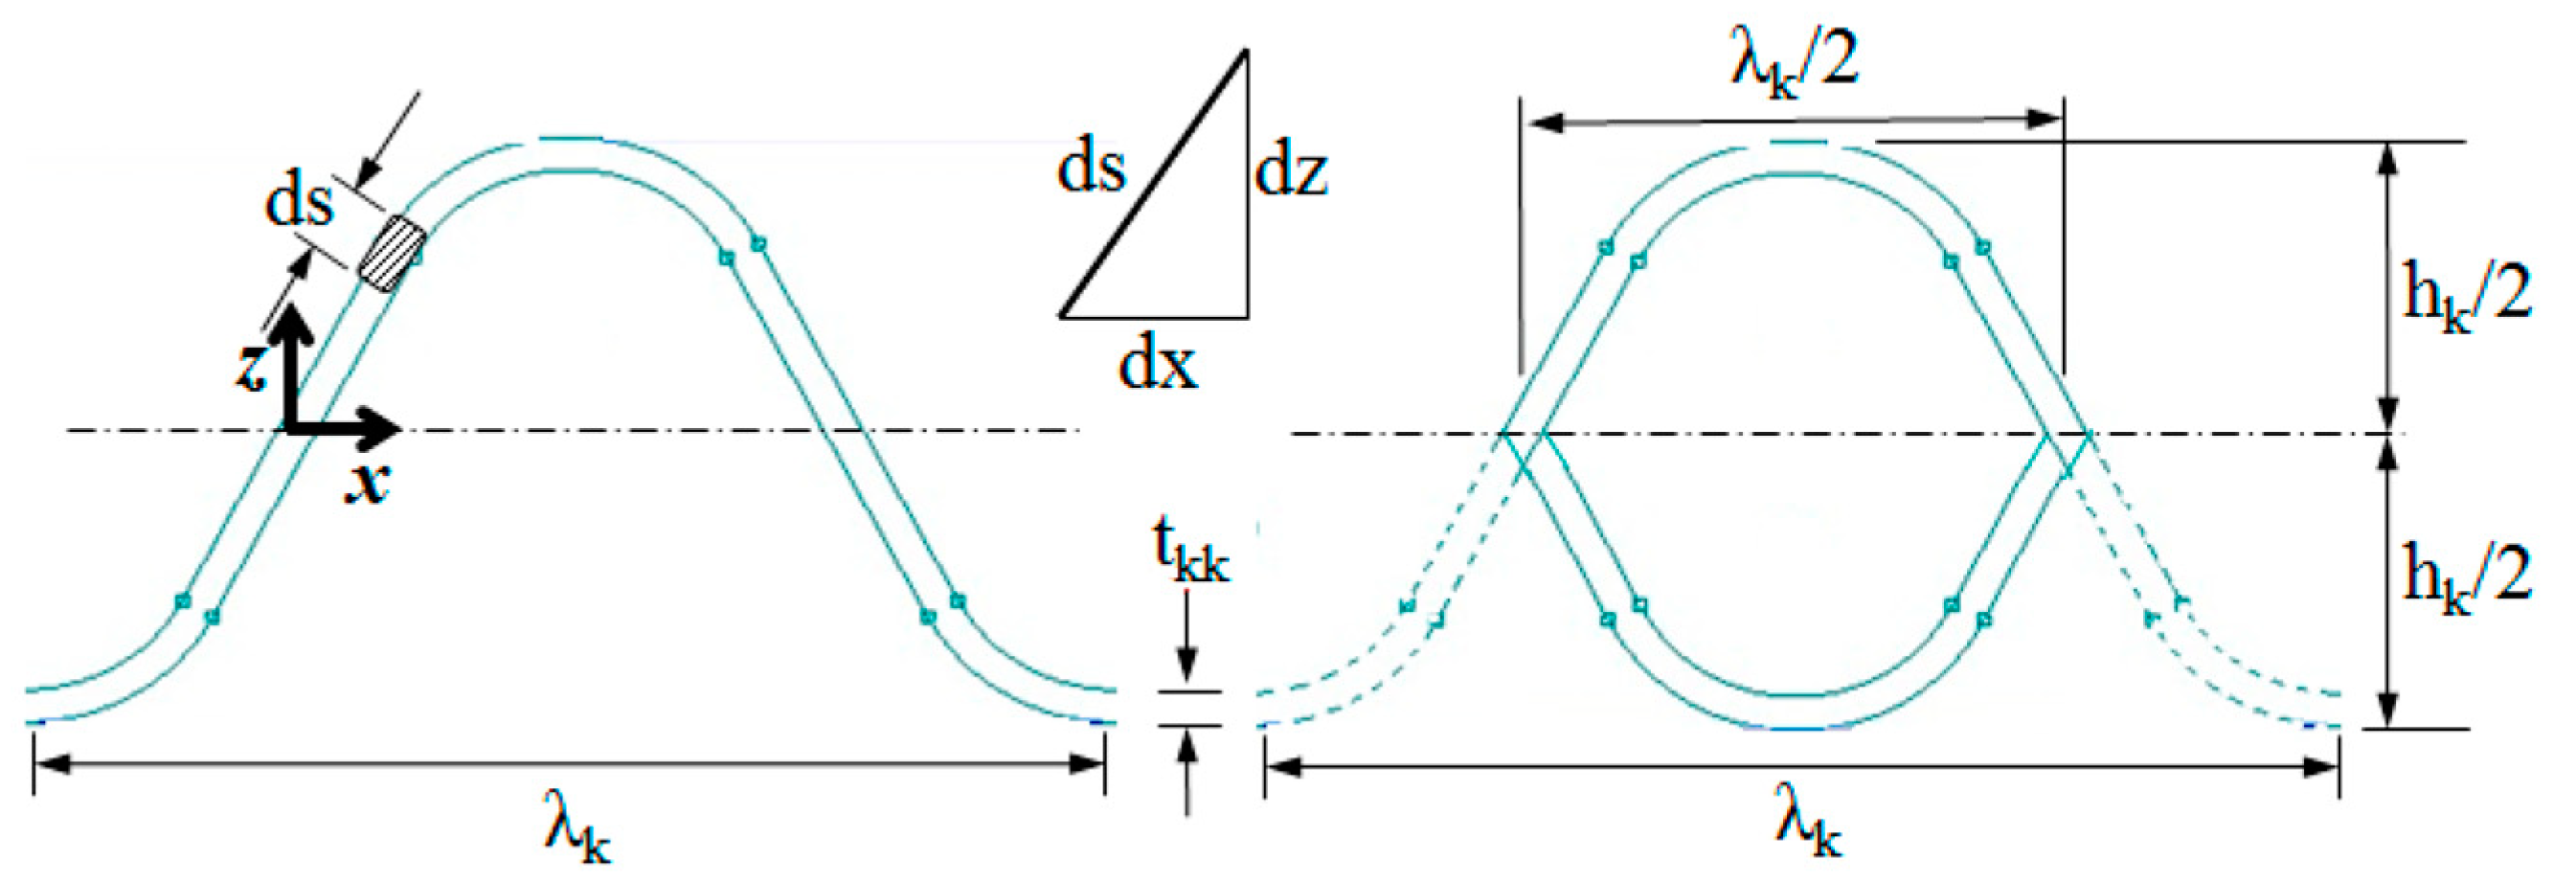
Appendix A.1. Generalized Equation for the Moment of Inertia of the Area of n-Layered Corrugated Paperboard

- The neutral axis of CD cross-section of the n-layered corrugated paperboard:
- Moment of inertia of the area for the neutral axis of CD cross-section of the n-layered corrugated paperboard:
- Moment of inertia of the area for the neutral axis of the CD cross-section of flute:

Appendix A.2. Calculating the Moment of Inertia of the Area of Corrugated Boards Used in This Study
- SW corrugated board (A/F, B/F): n = 2, from Equations (A1), (A2), and (A4):
- DW corrugated board (AB/F, BB/F): n = 3, from Equations (A1), (A2), and (A4):

| Flutes | Specifications | ẑ (mm) | |||
|---|---|---|---|---|---|
| Ω = 25 mm | Ω = 50 mm | Ω = 100 mm | |||
| A/F | t1 = t2 = 0.20, t11 = 0.22, λ1 = 9 mm, h1 = 4.90 m, α1 = 1.560 | 2.65 | 111.18 | 222.37 | 444.74 |
| B/F | t1 = t2 = 0.20, t11 = 0.22, λ1 = 6 mm, h1 = 2.65 m, α1 = 1.424 | 1.52 | 31.87 | 63.73 | 127.47 |
| AB/F | t1 = t3 = 0.20, t2 = 0.22, t11 = t22 = 0.22, λ1 = 9, λ2 = 6 mm, h1 = 4.90, h2 = 2.65 m, α1 = 1.560, α2 = 1.424 | 4.52 | 286.39 | 572.79 | 1145.58 |
| BB/F | t1 = t3 = 0.20, t2 = 0.22, t11 = t22 = 0.22, λ1 = λ2 = 6 mm, h1 = h2 = 2.65 m, α1 = α2 = 1.424 | 2.96 | 137.16 | 274.33 | 548.65 |
Appendix A.3. Calculating the Slenderness Ratio of the Test Specimen for Each Standard
| Kinds | A (mm2) | K (mm) | Le (mm) 1 | γ | ||
|---|---|---|---|---|---|---|
| KS M 7063-1 method A | A/F | 37.16 | 222.37 | 2.45 | 30 | 12.24 |
| B/F | 35.66 | 63.73 | 1.34 | 30 | 22.39 | |
| AB/F | 63.82 | 572.79 | 2.99 | 30 | 10.03 | |
| BB/F | 62.33 | 274.33 | 2.10 | 30 | 14.28 | |
| TAPPI T 838 | A/F | 18.58 | 111.18 | 2.45 | 50 | 20.41 |
| B/F | 17.83 | 31.87 | 1.34 | 50 | 37.31 | |
| AB/F | 31.91 | 286.39 | 2.99 | 50 | 16.72 | |
| BB/F | 31.16 | 137.16 | 2.10 | 50 | 23.81 | |
| FEFCO No.8 | A/F | 74,32 | 444.74 | 2.45 | 25 | 10.20 |
| B/F | 71.32 | 127.47 | 1.34 | 25 | 18.66 | |
| AB/F | 127.64 | 1145.58 | 2.99 | 25 | 8.36 | |
| BB/F | 124.66 | 548.65 | 2.10 | 25 | 11.90 | |
References
- Gilchrist, A.C.; Suhling, J.C.; Urbanik, T.J. Nonlinear finite element modeling of corrugated board. Mech. Cellul. Mater. 1999, 85, 101–106. [Google Scholar]
- Haj-Ali, R.J.; Choi, B.S.; Wei, R. Refined nonlinear finite element models for corrugated fiberboards. Compos. Struct. 2009, 87, 321–333. [Google Scholar] [CrossRef]
- Rahman, A.A.; Abubakr, S. A finite element investigation of the role of adhesive in the buckling failure of corrugated fiberboard. Wood Fiber Sci. 2004, 36, 260–268. [Google Scholar]
- Baum, G.A.; Brennan, D.C.; Habeger, C.C. Orthotropic elastic constants of paper. Tappi 1981, 64, 97–101. [Google Scholar]
- Jiménez-Caballero, M.A.; Conde, I.; Garcia, B. Design of different types of corrugated board packages using finite element tools. In Proceedings of the SIMULIA Customer Conference, London, UK, 18–21 May 2009. [Google Scholar]
- Lorentzen & Wettre. Lorentzen & Wettre Handbook; Pulp and Paper Testing; Lorentzen & Wettre: Kista, Sweden, 2013. [Google Scholar]
- Armentani, E.; Caputo, F.; Esposito, R. FE analyses of stability of single and double corrugated boards. In Proceedings of the 4th International Conference on Axiomatic Design, Firenze, Italy, 13–16 June 2006; pp. 13–16. [Google Scholar]
- Maltenfort, G.G. Performance and Evaluation of Shipping Containers; Jelmar Publishing, Co.: New York, NY, USA, 1989; p. 475. [Google Scholar]
- McKee, R.C.; Gander, J.W.; Wachuta, J.R. Compression strength formula for corrugated boxes. Paperboard Pack 1963, 48, 149–159. [Google Scholar]
- Park, J.M.; Kim, G.S.; Kwon, S.H. Finite element analysis of corrugated board under bending stress. J. Fac. Agric. Kyushu Univ. 2012, 57, 181–188. [Google Scholar]
- Popil, R.E. Overview of recent studies at IPST on corrugated board edge compression strength: Testing methods and effects of interflute buckling. BioResources 2012, 7, 2553–2581. [Google Scholar] [CrossRef]
- TAPPI T 839 om-12. Edge Compression Test for Strength of Corrugated Fiberboard Using the Clamp Method (Short Column Test); TAPPI: Peachtree Corners, GA, USA, 2009. [Google Scholar]
- Korean Standard Association (KSA). Corrugated Fiberboard-Determination of Edgewise Crush Resistance; KS M 7063; KSA: Seoul, Korea, 2015. [Google Scholar]
- TAPPI T 838 cm-12. Edge Crush Test Using Neckdown; TAPPI: Peachtree Corners, GA, USA, 2009. [Google Scholar]
- FEFCO NO.8. Edgewise Crush Resistance of Corrugated Fiberboard; FEFCO: Brussel, Belgium, 1997. [Google Scholar]
- ISO 3037: 2013. Corrugated Fibreboard—Determination of Edgewise Crush Resistance (Unwaxed Edge Method). Available online: https://www.iso.org/obp/ui/#iso:std:iso:3037:ed-5:v1:en (accessed on 3 September 2020).
- Korean Standard Association (KSA). Corrugated Fiberboard—Determination of Edgewise Crush Resistance (Unwaxed Edge Method); KS M ISO 3037; KSA: Seoul, Korea, 2014. [Google Scholar]
- TAPPI T 811 om-11. Edgewise Compressive Strength of Corrugated Fiberboard (Short Column Test); TAPPI: Peachtree Corners, GA, USA, 2009. [Google Scholar]
- ISO 13821:2002. Corrugated Fibreboard—Determination of Edgewise Crush Resistance—Waxed Edge Method; American National Standards Institute (ANSI): New York, NY, USA, 2007. [Google Scholar]
- Korean Standard Association (KSA). Corrugated Fiberboard—Determination of Edgewise Crush Resistance (Waxed Edge Method); KS M ISO 13821; KSA: Seoul, Korea, 2014. [Google Scholar]
- Markström, H. Testing Methods and Instruments for Corrugated Board; Lorentzen & Wettre: Kista, Sweden, 1999; p. 104. [Google Scholar]
- Jiménez, M.A.; Liarte, E. Simulation of the edge crush test of corrugated paperboard using ABAQUS. In Proceedings of the ABAQUS World Users Conference 2003, Munich, Germany, 4–6 June 2003. [Google Scholar]
- Biancolini, M.E. Evaluation of equivalent stiffness properties of corrugated board. Compos. Struct. 2005, 69, 322–328. [Google Scholar] [CrossRef]
- Aboura, Z.; Talbi, N.; Allaoui, S.; Benzeggagh, M.L. Elastic behavior of corrugated cardboard—Experiments and modelling. Compos. Struct. 2004, 63, 53–62. [Google Scholar] [CrossRef]
- Hallbäck, N.; Korin, C.; Barbier, C. Finite element analysis of hot melt adhesive joints in carton board. Packag. Technol. Sci. 2014, 27, 701–712. [Google Scholar] [CrossRef]
- Han, J.G.; Park, J.M. Finite element analysis of vent/hand hole designs for corrugated fiberboard boxes. Packag. Technol. Sci. 2007, 20, 39–47. [Google Scholar] [CrossRef]
- Urbanik, T.J.; Saliklis, E.P. Finite element corroboration of buckling phenomena observed in corrugated boxes. Wood Fiber Sci. 2003, 35, 322–333. [Google Scholar]
- Nordstrand, T.M. Parametric study of the post-buckling strength of structural core sandwich panels. Compos. Struct. 1995, 30, 441–451. [Google Scholar] [CrossRef]
- Gospodinov, D.; Stefanov, S.; Hadjiiski, V. Use of the finite element method in studying the influence of different layers on mechanical characteristics of corrugated paperboard. Tech. Gaz. 2011, 18, 357–361. [Google Scholar]
- Korea Corrugated Packaging Case Industry Association (KCCA). 2013 production status of corrugated package. Corrugat. Packag. Logist. 2014, 114, 50–54. [Google Scholar]
- D’auria, A.; Marchese, P. Influence of the cutting procedure of specimens on the ECT test on corrugated board. Cartotec. Imball. 1982, 6, 15. [Google Scholar]
- Korean Standard Association (KSA). Corrugated Fiberboards for Shipping Containers; KS T 1034; KSA: Seoul, Korea, 2014. [Google Scholar]
- ANSYS Inc. ANSYS Design Xplorer 14.5, Workbench User Guide; ANSYS Inc.: Canonsburg, PA, USA, 2014. [Google Scholar]
- Pilkey, W.D. Formulas for Stress, Strain and Structure Matrices; John Wiley & Sons, Inc.: New York, NY, USA, 1994; p. 1536. [Google Scholar]
- ISO. Paper and Board-Determination of Tensile Properties-Part 2: Constant Rate of Elongation Method (20 mm/min); ISO 1924-2:2008; British Standard Institute (BSI) and International Electrotechnical Commission (IEC): London, UK, 1995. [Google Scholar]
- Persson, K. Material Model for Paper: Experimental and Theoretical Aspects; Diploma Report; Lund University: Lund, Sweden, 1991. [Google Scholar]
- Mann, R.W.; Baum, G.A.; Habeger, C.C. Determination of all nine orthotropic elastic constants for machine-made paper. Tappi 1980, 63, 163–166. [Google Scholar]
- International Organization for Standardization (ISO). Paper and Board—Determination of the Static and Kinetic Coefficients of Friction—Horizontal Plane Method; ISO 15359; ISO: Geneva, Switzerland, 1999. [Google Scholar]
- Park, J.M.; Kim, J.S.; Park, J.H. Computer simulation and modeling of optimum clamping pressure in carton clamp handling for heavy corrugated package. Mech. Ind. 2020. under publication. [Google Scholar]
- R Core Team. R Core Team: A Language and Environment for Statistical Computing; R Foundation for Statistical Computing: Vienna, Austria, 2013; Available online: http://www.R-project.org/ (accessed on 28 June 2016).
- Gudavičius, D. Finite Element Analysis of e-Commerce Corrugated Board Cushioning. Master’s Thesis, KTH, Stockholm, Sweden, 2018. [Google Scholar]
- Lee, M.H.; Park, J.M. Flexural stiffness of selected corrugated structures. Packag. Technol. Sci. 2004, 17, 275–286. [Google Scholar] [CrossRef]


| Components | Thickness (mm) | Wavelength (λ) (mm) | Height of Flute (h) (mm) | Take-Up Factor | Flutes per 300 mm Liner | |
|---|---|---|---|---|---|---|
| Flute | A/F | 0.22 | 9.00 (8.33~9.38) | 4.90 (4.5~4.8) | 1.560 (1.6) | 33 (34 ± 2) |
| B/F | 0.22 | 6.00 (5.27~6.25) | 2.65 (2.5~2.8) | 1.424 (1.4) | 50 (50 ± 2) | |
| Liner | Inner & outer | 0.20 | BB/F-DW:  | |||
| Middle | 0.22 | |||||
| Mesh Size (mm) | von Mises Stress (MPa) |
|---|---|
| 1.3 | 20.3 |
| 1.4 | 20.9 |
| 1.5 | 19.8 |
| 1.6 | 19.2 |
| 1.7 | 18.3 |
| Paperboards | Young’s Modulus (GPa) | Poisson’s Ratio 1 | Shear Modulus (GPa) | Yield Strength (MPa) | |||||||
|---|---|---|---|---|---|---|---|---|---|---|---|
| Ex(EMD) | Ey(ECD) | Ez | μxy | μxz | μyz | Gxy | Gxz | Gyz | σy-MD | σy-CD | |
| K180 | 2.20 (±0.02) | 0.37 (±0.01) | 0.011 | 0.34 | 0.01 | 0.01 | 0.349 | 0.040 | 0.010 | 29.09 (±0.8) | 12.12 (±0.1) |
| SK180 | 3.16 (±0.07) | 0.40 (±0.01) | 0.016 | 0.34 | 0.01 | 0.01 | 0.435 | 0.057 | 0.011 | 42.50 (±0.8) | 19.50 (±0.5) |
| Flute Type | Mean ECT Values (KN/m) | ||
|---|---|---|---|
| KS M 7063-1 | TAPPI T 838 | FEFCO No.8 | |
| A/F | 5.69 (±0.76) A | 6.29 (±0.79) A | 4.04 (±0.85) B |
| B/F | 5.10 (±0.80) A | 5.90 (±0.74) A | 4.47 (±0.88) B |
| AB/F | 10.01 (±0.77) A | 10.22 (±0.81) A | 7.36 (±0.89) B |
| BB/F | 9.42 (±0.79) A | 11.00 (±0.78) A | 7.66 (±0.90) B |
© 2020 by the authors. Licensee MDPI, Basel, Switzerland. This article is an open access article distributed under the terms and conditions of the Creative Commons Attribution (CC BY) license (http://creativecommons.org/licenses/by/4.0/).
Share and Cite
Park, J.; Park, M.; Choi, D.S.; Jung, H.M.; Hwang, S.W. Finite Element-Based Simulation for Edgewise Compression Behavior of Corrugated Paperboard for Packaging of Agricultural Products. Appl. Sci. 2020, 10, 6716. https://doi.org/10.3390/app10196716
Park J, Park M, Choi DS, Jung HM, Hwang SW. Finite Element-Based Simulation for Edgewise Compression Behavior of Corrugated Paperboard for Packaging of Agricultural Products. Applied Sciences. 2020; 10(19):6716. https://doi.org/10.3390/app10196716
Chicago/Turabian StylePark, Jongmin, Minjung Park, Dong Soo Choi, Hyun Mo Jung, and Sung Wook Hwang. 2020. "Finite Element-Based Simulation for Edgewise Compression Behavior of Corrugated Paperboard for Packaging of Agricultural Products" Applied Sciences 10, no. 19: 6716. https://doi.org/10.3390/app10196716
APA StylePark, J., Park, M., Choi, D. S., Jung, H. M., & Hwang, S. W. (2020). Finite Element-Based Simulation for Edgewise Compression Behavior of Corrugated Paperboard for Packaging of Agricultural Products. Applied Sciences, 10(19), 6716. https://doi.org/10.3390/app10196716