Article

Evaluation and Optimization of the Annual Performance of a Novel Tri-Generation System Driven by Geothermal Brine in Off-Design Conditions

by
Mehri Akbari Kordlar
*,
Florian Heberle
and
Dieter Brüggemann
Chair of Engineering Thermodynamics and Transport Processes (LTTT), Center of Energy Technology (ZET), University of Bayreuth, 95440 Bayreuth, Germany
*
Author to whom correspondence should be addressed.
Appl. Sci. 2020, 10(18), 6532; https://doi.org/10.3390/app10186532
Submission received: 25 August 2020 / Revised: 11 September 2020 / Accepted: 17 September 2020 / Published: 18 September 2020
(This article belongs to the Special Issue New Trends in Enhanced, Hybrid and Integrated Geothermal Systems)

Abstract

:
The difference in heating or cooling to power ratio between required demands for district networks and the proposed tri-generation system is the most challenging issue of the system configuration and design. In this work, an adjustable, novel tri-generation system driven by geothermal resources is proposed to supply the thermal energies of a specific district network depending on ambient temperature in Germany. The tri-generation system is a combination of a modified absorption refrigeration cycle and a Kalina cycle using NH3-H2O mixture as a working fluid for the whole tri-generation system. A sensitive analysis of off-design conditions is carried out to study the effect of operational parameters on the system performances prior to optimizing its performance. The simulation show that the system is able to cover required heating and cooling demands. The optimization is applied considering the maximum exergy efficiency (scenario 1) and minimum total exergy destruction rate (scenario 2). The optimization results show that the maximum mean exergy efficiency in scenario 1 is achieved as 44.67% at the expense of 14.52% increase in the total exergy destruction rate in scenario 2. The minimum mean total exergy destruction rate in scenario 2 is calculated as 2980 kW at the expense of 8.32% decrease in the exergy efficiency in scenario 1.

1. Introduction

Due to the non-fluctuating renewable and environmentally friendly nature of geothermal heat sources, it is inevitable to utilize these sources to reduce the consumption of fossil fuels and environmental pollution [1]. For applying geothermal sources to produce power, cooling and heating in different seasons, various multi-generation systems are investigated [2]. It has been observed that co-generation [3] and multi-generation systems [4,5] attract the interest not only of researchers but also of operators and energy suppliers because of their substantial energy conservation [6,7] and economic aspects [8]. Recently, some studies have been carried out to examine co-generation systems for producing power/cooling or power/heating using geothermal heat sources. In addition, some configurations of tri-generation systems have been presented to provide the demand of power, cooling and heating [9,10] with low-grade heat sources like geothermal heat sources. Coskun et al. [11] investigated a tri-generation system driven by geothermal heat source of 173 °C. The system was studied on two different main groups for hot and cold seasons. The exergy efficiency in winter with an ambient temperature of 10.1 °C was calculated as 52.8%. In summer with an ambient temperature of 22.3 °C the exergy efficiency of the system was 49.5%. In addition, in comparison to the single power generation system, the exergy efficiency was increased by 1.12 and 1.25 times for summer and winter days, respectively. Zare [12] proposed and optimized two various designs of tri-generation systems utilizing geothermal heat source of 173 °C. The main difference in two introduced designs related to the power production system. An organic Rankine cycle was applied in one system while Kalina cycle was utilized in the other system. The author reported that the maximum exergy efficiency of tri-generation systems based on ORC and Kalina cycles were 46.51% and 50.36%, respectively. The multi-generation energy system driven by geothermal heat source of 185−215 °C to produce electricity, heating, cooling and hydrogen was introduced by Akrami et al. [13]. Their results revealed that energy and exergy efficiencies of the system were about 34.9% and 49.2%, respectively.
Based on the abovementioned studies and due to the increased attention paid to systems producing power, heating and cooling in recent years, the literature lacks any mention of the application of a one energy system using the same working fluid for tri-generation purposes. Mostly, in the previous proposed tri-generation systems, there are two different working fluids in each power and cooling section [11,12,13]. Generally, the organic Rankine cycle (ORC) in the power block utilizes natural hydrocarbons or fluorinated refrigerants as a working fluid. As well, the absorption refrigeration system with LiBr-water is used in the cooling block. It is important to note that using different working fluids can lead to significant higher investment costs for safety and environmental issues. Therefore, there is room for more work to investigate systems using one working fluid in tri-generation systems. In this context, an extension of the Kalina cycle by a cooling part also using ammonia-water as working fluid is a promising approach. The Kalina cycle is a proven technology for power generation based on low-temperature heat sources. The first geothermal application of the Kalina cycle in Europe was the Orkuveita Húsavíkur (Iceland) power plant [14]. This power plant began to operate in July 2000. The net electrical output of the plant is 1.7 MW [15]. The thermal efficiency of this power Kalina cycle was calculated to be between 12.3−17.1% depending on the cooling water temperature [16]. In Unterhaching (Germany) a combined heat and power system was realized at a geothermal temperature of 122 °C [17]. This Kalina cycle is designed for an electrical power of 3.35 MW. In addition, the thermal power of the district heating system is about 40 MW [18]. Another example for an existing geothermal application is the power plant in Bruchsal (Germany). This system started to operate in 2012 and is driven by a geothermal heat source of 122 °C. The electrical capacity of the power plant in Bruchsal is 550 kW [19].
In addition, existing studies of low-grade heat sources only pay small attention to tri-generation systems. On the other hand, previous analyses are based on constant ambient temperature with fixed values of power, cooling and heating generation without paying attention to heating and cooling periods as well as corresponding frequency demands. In this context, tri-generation systems are mostly studied under design conditions. However, it is obvious that changing the operating parameters due to the different geometry, characteristics and performance curves of the component, mainly heat exchangers and turbine, have been affected by the system performances corresponding off-design behavior [20,21]. Therefore, the off-design evaluation of the system is inevitable and should be considered in the system design in order to annual simulation.
The present works addresses all issues mentioned above by introducing a novel configuration of the tri-generation system driven by geothermal water. The system works only by one working fluid as ammonia-water solution. Due to the variable boiling temperature of an ammonia-water solution during the heat transfer process, the irreversibilities of heat exchangers decrease as well as the efficiency of the system increases [22,23]. In this context, the main objectives in this work are:
  • to define heating and cooling demand in winter and summer conditions (different ambient temperatures) to evaluate the system performance using operational data of an existing geothermal district heating network in the German Molasse basin [24]. In particular, the geothermal source, mean ambient temperatures and heating/cooling demands are based on this case;
  • to validate the power part (Kalina cycle) and to verify the cooling part in order to confirm the validity of the simulation model;
  • to determine the main operational parameters to analyze the system;
  • to develop and apply an off-design model of the tri-generation system;
  • to apply the quasi-stationary simulation of a tri-generation system in different weather conditions to fulfill the heating and cooling demands;
  • to obtain mean annual system performances;
  • to optimize the system considering two criteria, maximum exergy efficiency and minimum total exergy destruction rate.

2. Methodology

2.1. Description of the System

The schematic diagram of the proposed tri-generation system is shown in Figure 1. The system is able to simultaneously generate heating, power and cooling for various purposes in different seasons. The system consists of three parts: the power section which produces electricity, the adaptable cooling part which is applied as absorption refrigeration in summer days and heat pump in winter days (by switching the evaporator) and the domestic heat exchanger (DHE) is used to supply heat demand. As shown in Figure 1, the geothermal hot water (state 21) is divided into two parts; one part provides the required heat input to satisfy the heat demand (state 24) via the DHE. The other part is coupled to the power section by the boiler (BOI) (state 22). The required heat for the generator (GEN) is supplied by stream 26 which is the combination of the two returning geothermal water streams coming from DHE (state 25) and BOI (state 23). The description of the tri-generation system is started with the ammonia-water solution in the power section. A saturated liquid ammonia-water solution (state 4) is pumped through pump 2 (PU2) (state 8) to the high pressure of the system. The stream is delivered to separator (SEP) after heating in the boiler via geothermal water (state 9). In the SEP, the liquid-vapor stream is separated to saturated liquid (state 10) and saturated vapor phases (state 11). The stream 12 is expanded via the turbine (TUR) and is mixed with the stream leaving the solution heat exchanger (SHE) via expansion valve 2 (EX2). This stream (stream 15) is led through CON2 and then to absorber (ABS) (stream 17) through PU3. The ammonia-water solution at the outlet of the ABS (state 1) is forced to the medium pressure level (state 2) by PU1 and is led to SHE. This stream at the outlet of the SHE (stream 3) which is heated in the SHE via saturated liquid (state 11) from SEP. The stream 3 goes to GEN to heat with the geothermal water following to divide into two saturated liquid and vapor streams (stream 4 and 5). The vapor stream coming from the GEN (state 5) is cooled through rectifier (REC) and again the stream is divided into liquid and vapor phase to provide a strong ammonia solution (stream 7). The pure ammonia is saturated in the CON1 (stream 18) and is led through the evaporator (EVA) via EX1. In the EVA, the pure ammonia solution is heated by absorbing heat and can produce a cooling demand in the summer condition (stream 39–40). The stream coming from EVA (stream 20) leads to ABS and is mixed with stream 17 via PU3 and the proposed system is completed. The heat sink streams (streams 31–36) are used as coolant and the water- ethylene glycol streams 39 and 40 are utilized to cover the cooling demand. The water streams 29 and 30 are used to produce heating demand. Moreover, it is worthwhile to indicate that in the proposed system, two different evaporators are applied in summer and winter. In summer days, when the tri-generation mode is required, the evaporator for cooling is applied to the system. In winter days, when no cooling demand is required, the geothermal fluid coming from GEN (stream 27) is led through the evaporator for heating. In this regard, the useful productions in the tri-generation system are outlined as follows:
-
heating via domestic heat exchanger
-
power generation via turbine
-
cooling via evaporator

2.2. Assumption

For a process simulation and a detailed analysis of the proposed system, each component of the cogeneration cycle is considered as a control volume and a mathematical model is established by applying the conservation of mass and energy balances as well as the exergy principle. Simulation is carried out by the software Engineering Equation Solver (EES) [25]. The fluid properties of ammonia-water solution and water are estimated in EES by implementing correlations of Ibrahim [26] and Wagner [27], respectively. In addition, the thermodynamic and transport properties of water-ethylene glycol are applied in EES by adapting the correlations of Fujuita [28] and Lee [29].
Some assumptions are made to simplify the mathematical model [30]:
-
Pressure and heat losses in the heat exchangers and pipelines are neglected.
-
The isotropic efficiency for pumps is considered as constant.
-
The changes of kinetic and potential energies are negligible.
-
The state of leaving streams of absorber, condenser, generator and rectifier is saturated.
-
In the cold season when heating demand is required, the extracted stream of geothermal fluid from the generator is used in the evaporator to supply the needed heat (stream 27–28) in the evaporator in the absorption heat pump cycle. In the summer days, the stream 27 goes to reinjection well and the cooling demand is produced in the evaporator for cooling.
The basic assumption and assumed boundary conditions for the simulation are summarized in Table 1.

2.3. Off-Design Model

The operating conditions of the system are influenced by the performance of the heat exchangers and turbine [33,34]. In this regard, the different steps of off-design calculation are indicated in Figure 2. As shown, the first step in off-design process calculation is related to obtain the heat transfer capacity (UA) of heat exchangers in the design mode which is outlined in Table 1. The heat transfer rate ( Q ˙ ) in the heat exchangers is expressed as [35]:
Q ˙ = U A   Δ T L M T D
where U is the overall heat transfer coefficient, the area of the heat exchanger is A and Δ T L M T D represents the logarithmic mean temperature difference between the hot and cold streams in the heat exchanger. In the next step, the off-design behavior of the heat exchangers is considered according to the method presented by Manente [34]. In off-design conditions, the variations in mass flow rates from the design conditions bring about a change in the UA. The heat exchange capacity is modified considering the actual mass flow rate:
( U A ) o f f d e s i g n ( U A ) d e s i g n = ( m ˙ o f f d e s i g n m ˙ d e s i g n ) m
The heat exchanger configuration determines the exponent m . The exponent m is set to 0.44 for the air-cooled condenser, 0.66 for the generator, solution heat exchanger and evaporators, 0.15 for the boiler [36]. After obtaining the off-design characteristics such as UA for the considered heat exchangers, calculation of the turbine isentropic efficiency is the next step. The isentropic efficiency of the turbine is considered as a function of enthalpy drop and volumetric flow rate at the outlet of the turbine. The off-design behavior of the isentropic efficiency of the turbine depends on two coefficients r h and r v according to [37]. The coefficients depend on the outlet volume flow rate and the enthalpy drop in the turbine:
r T = h T u r b i n e   i n l e t h T u r b i n e   o u t l e t ( h T u r b i n e   i n l e t h T u r b i n e   o u t l e t ) d e s i g n
r h = ( [ ( 1.39 r T 5.425 ) × r T + 6.274 ] × r T 1.866 ) × r T + 0.619
where h is the enthalpy and exponents design means the calculated value at design [37]:
r V T = ( V ˙ ) ( V ˙ ) d e s i g n
r v = ( [ ( 0.21 r V T + 1.117 ) × r V T 2.533 ] × r V T + 2 , 588 ) × r V T + 0.038
where V ˙ shows the volumetric flow rate at the outlet of the turbine. Therefore, the isentropic efficiency of the turbine in off-design can be calculated as [32]:
η s , t u r = η t u r × r v × r h
It is important to note that the off-design values of η s , t u r and r V T can take a value higher than the design mode values. In addition, the UA value and turbine isentropic efficiency, the thermodynamic properties of different states have been calculated. The whole off-design case is calculated in an iterative process which ends when the simulation shows convergence. The main criteria of convergence are related to the equality of the thermodynamic properties such as temperature, pressure and ammonia concentration in the outlet of different heat exchangers and the inlet of other heat exchangers. The convergence is obtained within 1%. The proposed system is designed under operational parameters under base case which is presented in Table 1. The design case results are calculated for the heating demand of 11.66 MW in the ambient temperature of −5.67 °C.
The heat exchange capacities (UA) and mass flow rates of all heat exchangers in the system for design case are shown in Table 2. In addition, in design conditions the volumetric flow rate at the turbine outlet is calculated to be 3.376 m 3 / s .

2.4. Heating and Cooling Demand Profiles

In order to analyze the proposed cycle, real heating data of an existing geothermal district heating network in the German Molasse Basin [24] and estimated cooling demand are applied. The VDI 4655 method [38] is applied to estimate the annual system performance. In this method, 10 typical days are analyzed. This procedure is distinguished from seasonal, i.e., summer (S), winter (W) and transition (T), and from the typical days, i.e., workdays (W) and Sundays (S). In this category, Saturdays are selected as the workday. Furthermore, fine (F) and cloudy (C) days are differentiated to reach acceptable results. However, in the summer days, no distinction between fine and cloudy days (X) is made. These 10 typical days categories are; WWF, WWC, WSF, WSC, TWC, TSC, TSF, TWF, SWX, SSX.
According to the test reference years (TRY), Germany is divided into various climate zones. As shown in Table 3, according to this climate zones in the mentioned category “VDI 4655”, the number of typical days during the year changes. In this work, for the purpose of the annual simulation, the 10 typical days are simulated for TRY13 which is associated to the southern German Molasse Basin. The annual performances of the system are calculated by weighting these typical days considering their frequency.
In order to conduct a quasi-stationary simulation, the heating and cooling demands for each typical day category are required. The profiles of corresponding heating demand for different typical days categories are developed depending on operational data of a real geothermal heat plant in the German Molasse Basin. The corresponding mean values of heating demands and the ambient temperatures for different typical days categories are illustrated in Table 4, respectively [18]. It is seen that the ambient temperature takes the lowest values in winter days and the highest values occur in the summer days. It is clear that the ambient temperature in cloudy days is basically lower than the fine days. For heating demand values which are listed in Table 4, it is observed that the heating demand has higher values in winter days in comparison to the summer and transition days. In addition, the heating demand in cloudy days, especially in the afternoon is considerably higher than the one in fine days. Furthermore, comparing the heat demand on Sundays and workdays shows that the heating demand is generally lower on Sundays and has a small variation.
The cooling demand is not available for specific real application; therefore, it is calculated with the following assumption. The cooling demand for an ambient temperature higher than 13 °C in four typical days according to some available real data in public buildings is assumed to be 0.33–0.85 times of the corresponding heating demand which is depending on the ambient temperature. It is noteworthy to note that this value is based on the ambient temperature in which with increasing of the ambient temperature, the corresponding value increases. Referring to Table 4, it is shown that the cooling demand takes higher values on workdays in comparison to Sundays. In addition, the cooling demand on all 4 typical days in the morning is lower than the one in the afternoon.

2.5. Exergetic Evaluation

In order to evaluate the cycle performance, the second law efficiency and exergy destruction rate are considered as main evaluation criteria. In general, in the absence of magnetic, electrical, nuclear and surface tension effects as well as ignoring the kinetic and potential exergies, the exergy rate consists of two physical and chemical exergy rates as [39]:
E ˙ = E ˙ p h + E ˙ c h
Physical exergy can be obtained from [33]:
E ˙ p h = m ˙ [ ( h h 0 ) T 0 ( s s 0 ) ]
and the chemical exergy for ammonia-water solution is expressed as [40]:
E ˙ c h ( N H 3 / H 2 O ) = m ˙ [ ( X M N H 3 ) e c h , N H 3 0 + ( 1 X M H 2 O ) e c h , H 2 O 0 ]
The subscript 0 in Equation (3) indicates the dead state and T 0 shows its temperature. The standard chemical exergy for ammonia and water is set to 336.684 and 45 kJ/kmol [40].
For a detailed analysis, the exergy destruction rate is calculated. The exergy destruction rate is defined as the difference between the product exergy ( E ˙ P ), loss exergy ( E ˙ L ) and fuel exergy ( E ˙ F ) for each component of the proposed system [41]:
E ˙ D , k = E ˙ F , k E ˙ P , k E ˙ L , k
For parametric analysis, the energy and exergy efficiencies are calculated to be [42]:
η energy = W ˙ n e t + Q ˙ h e a t i n g / c o o l i n g Q ˙ i n
η exergy = W ˙ n e t + E ˙ h e a t i n g / c o o l i n g E ˙ i n
It is evident that the energy or thermal efficiency is the ratio of the net available products (net product power, heating and cooling rates) to the rate of thermal energy, which is absorbed from the geothermal heat source. In addition, the exergy efficiency is the ratio of the net available products exergy (net product power, heating and cooling exergies) to the rate of input exergy from the geothermal heat source. In Equations (12) and (13) W ˙ n e t is the net output power of the system, Q ˙ c o o l i n g is the cooling capacity in the summer condition, the heating capacity and the total heat input are Q ˙ h e a t i n g and Q ˙ i n , respectively. E ˙ c o o l i n g is the generated exergy rate for cooling purpose used in the summer days, the heating exergy and the total input exergy are E ˙ h e a t i n g and E ˙ i n , respectively. These parameters are defined as:
W ˙ n e t = W ˙ T u r   W ˙ P
Q ˙ c o o l i n g = m ˙ 39 ( h 39 h 40 )
Q ˙ h e a t i n g = m ˙ 30 ( h 30 h 29 )
Q ˙ i n = { m ˙ 21 ( h 21 h 28 ) for   winter   condition m ˙ 21 ( h 21 h 27 ) for   summer   condition
E ˙ c o o l i n g = E ˙ 40 E ˙ 39
E ˙ h e a t i n g = E ˙ 30 E ˙ 29
E ˙ i n = { E ˙ 21 E ˙ 28 for   winter   condition E ˙ 21 E ˙ 27 for   summer   condition
The total exergy destruction rate of the system is calculated to be:
  • on winter days:
    E ˙ D , t o t = E ˙ i n ( W ˙ n e t + E ˙ h e a t i n g ) ( E ˙ L , A B S + E ˙ L , C O N 1 + E ˙ L , C O N 2 + E ˙ L , R E C )
  • on summer days:
    E ˙ D , t o t = E ˙ i n ( W ˙ n e t + E ˙ h e a t i n g + E ˙ c o o l i n g ) ( E ˙ L , A B S + E ˙ L , C O N 1 + E ˙ L , C O N 2 + E ˙ L , R E C )
The corresponding parameters are:
E ˙ L , A B S = ( E ˙ 17 + E ˙ 20 E ˙ 1 )   ( E ˙ 32 E ˙ 31 )  
E ˙ L , C O N 1 = ( E ˙ 7 E ˙ 18 )   ( E ˙ 36 E ˙ 35 )  
E ˙ L , C O N 2 = ( E ˙ 15 E ˙ 16 )   ( E ˙ 38 E ˙ 37 )  
E ˙ L , R E C = ( E ˙ 5 E ˙ 6 E ˙ 7 )   ( E ˙ 34 E ˙ 33 )

3. Results and Discussion

The system is analyzed in off-design conditions by considering mass, energy and exergy balances as well as off-design model equations for each component as a control volume. In this regard, by adapting the geothermal mass flow division ratio   ( r geo = m ˙ 24 / m ˙ 21 ) , the heating demand is totally covered by the geothermal resource. In addition, the sensitive analysis is applied to each typical day category displayed in Table 4 to find the operational parameters prior to optimization.

3.1. Validation and Verification

In Table 5, the real power plant parameters given in Ogriseck [16] are compared to the conducted simulations. The represented results display a good agreement between the present work and real data of the existing Kalina power plant with a deviation of less than 0.9%. The percentage of relative deviation between available data in the literature and obtained data from simulation in the present work is calculated as follows:
Deviation   ( % ) = | X r e f e r e n c e   d a t a X s i m u l a t i o n   d a t a | X r e f e r e n c e   d a t a × 100
The cooling system (absorption refrigeration system) is verified using available data reported in literature [43]. In the absorption system, the verification results are obtained with some main design parameters such as absorber, condenser and generator temperatures and ammonia concentration. Figure 3 represents the data obtained in the present work and the data by Adewusi [43] for the absorption refrigeration ammonia-water cycle. The represented results display a good agreement between the present work and literature with a deviation of less than 1%.

3.2. Parametric Analysis

A parametric study is applied to investigate the influences of decision parameters such as the turbine inlet pressure ( TIP ) , the generator temperature ( T gen ) , the temperature differences at the Absorber ( δ T ABS ) and condensers exit ( δ T CON 1 = T 18 T 35   ,   δ T CON 2 = T 16 T 37 ) on the system performance prior to optimization. It is noteworthy to mention that, in parametric analysis for off-design conditions only one parameter, among the ones outlined in Table 1, is changed and the other parameters are calculated in off-design conditions. The ammonia concentration in the power section is kept constant as 0.5   kg ( NH 3 ) / kg ( solution ) .
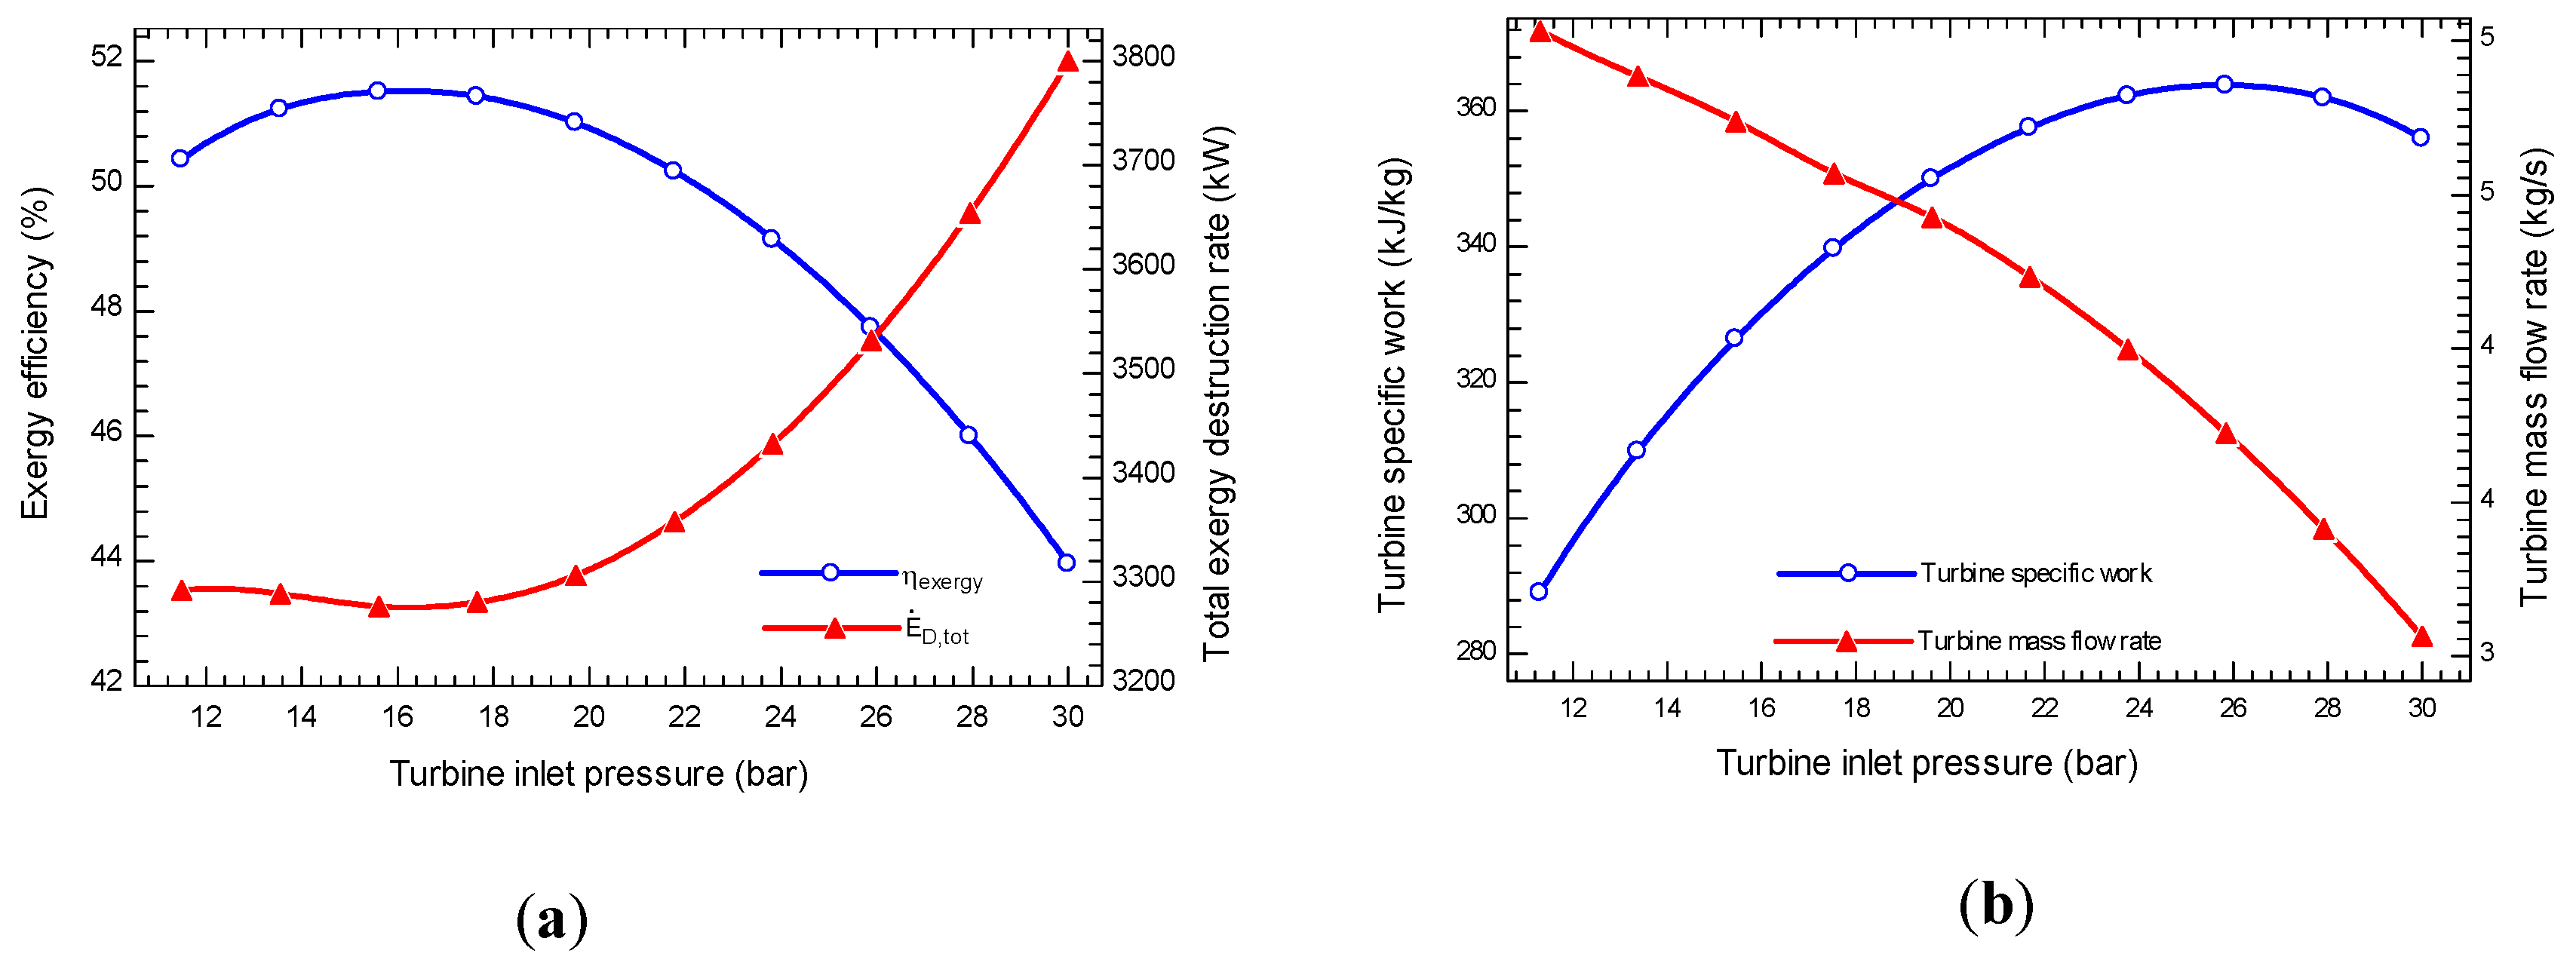
The variations of exergy efficiency as well as total exergy destruction rate with the turbine inlet pressure are shown in Figure 4a in off-design conditions. As shown, the exergy efficiency and E ˙ D , tot take a local maximum and minimum values, respectively. The trends of these variations can be justified by representing the variation in power production, input exergy and loss exergy in some components with the TIP. Due to the reduction in reinjection geothermal temperature, the E ˙ in is increased with an increase in TIP. In addition, changes in TIP has no effect on the produced heating capacity and the heating exergy of the system. On the other side, the power production is maximized locally at specific values of TIP. With an increase in TIP, the turbine mass flow rate decreases, however the turbine specific work has been optimized locally. As presented in the Figure 4b, the contrary effect of these parameters occurs in a way that leads to a local optimum for the produced net power output and the exergy efficiency. Furthermore, with an increase in TIP, the loss exergy rate in the ABS, REC, CON1, CON2 is increased. According to Equation (21), the total exergy destruction rate takes locally minimum values.
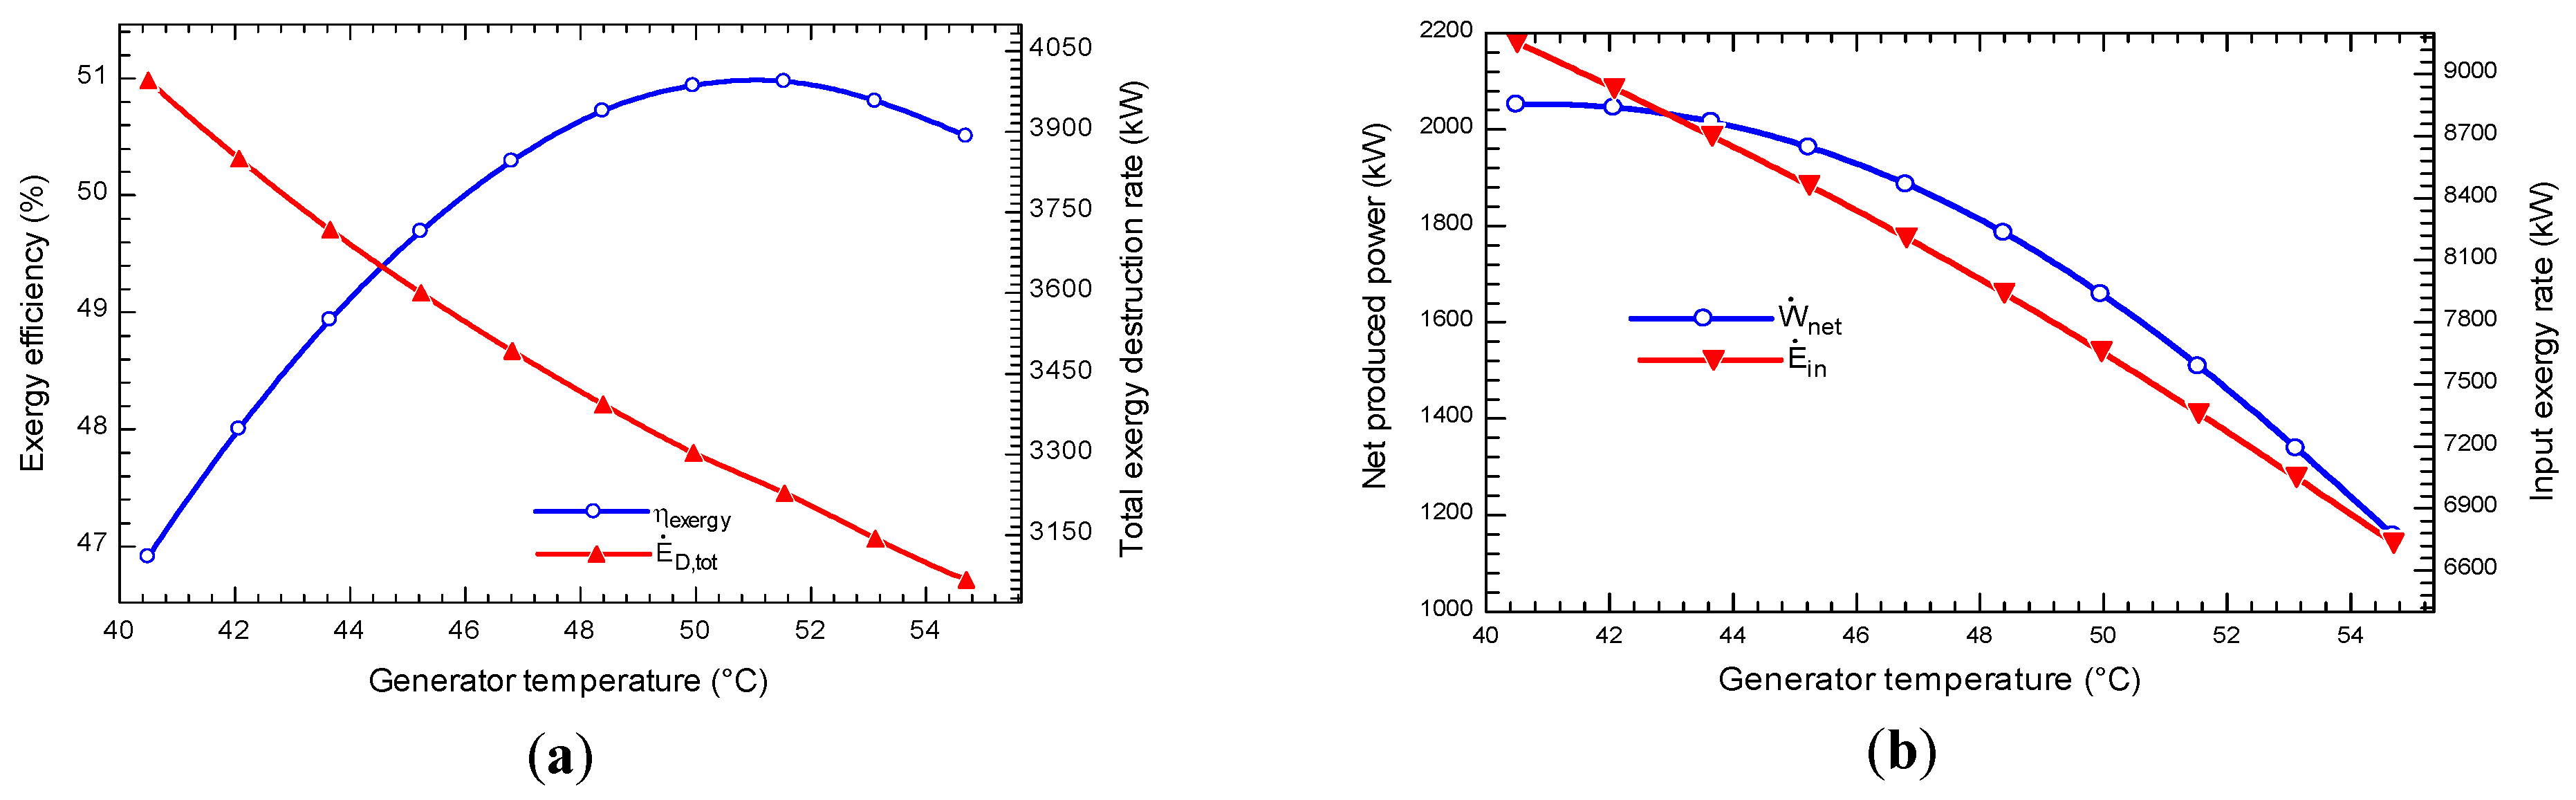
The influence of the generator temperature on the exergy efficiency and total exergy destruction rate in off-design mode is presented in Figure 5a. It is seen that as the T gen increases, the exergy efficiency is locally maximized as well as the E ˙ D , tot is increased. With an increase in T gen , the E ˙ in and W ˙ net are decreased as shown in Figure 5b. The reduction rate of these two parameters occur in such a way that leads to a local maximum value for the exergy efficiency. The loss exergy which occurs in ABS, REC, CON1, CON2, is decreased by increasing T gen . In this regard, according to Equation (21) the total exergy destruction rate decreases with an increase in T gen .
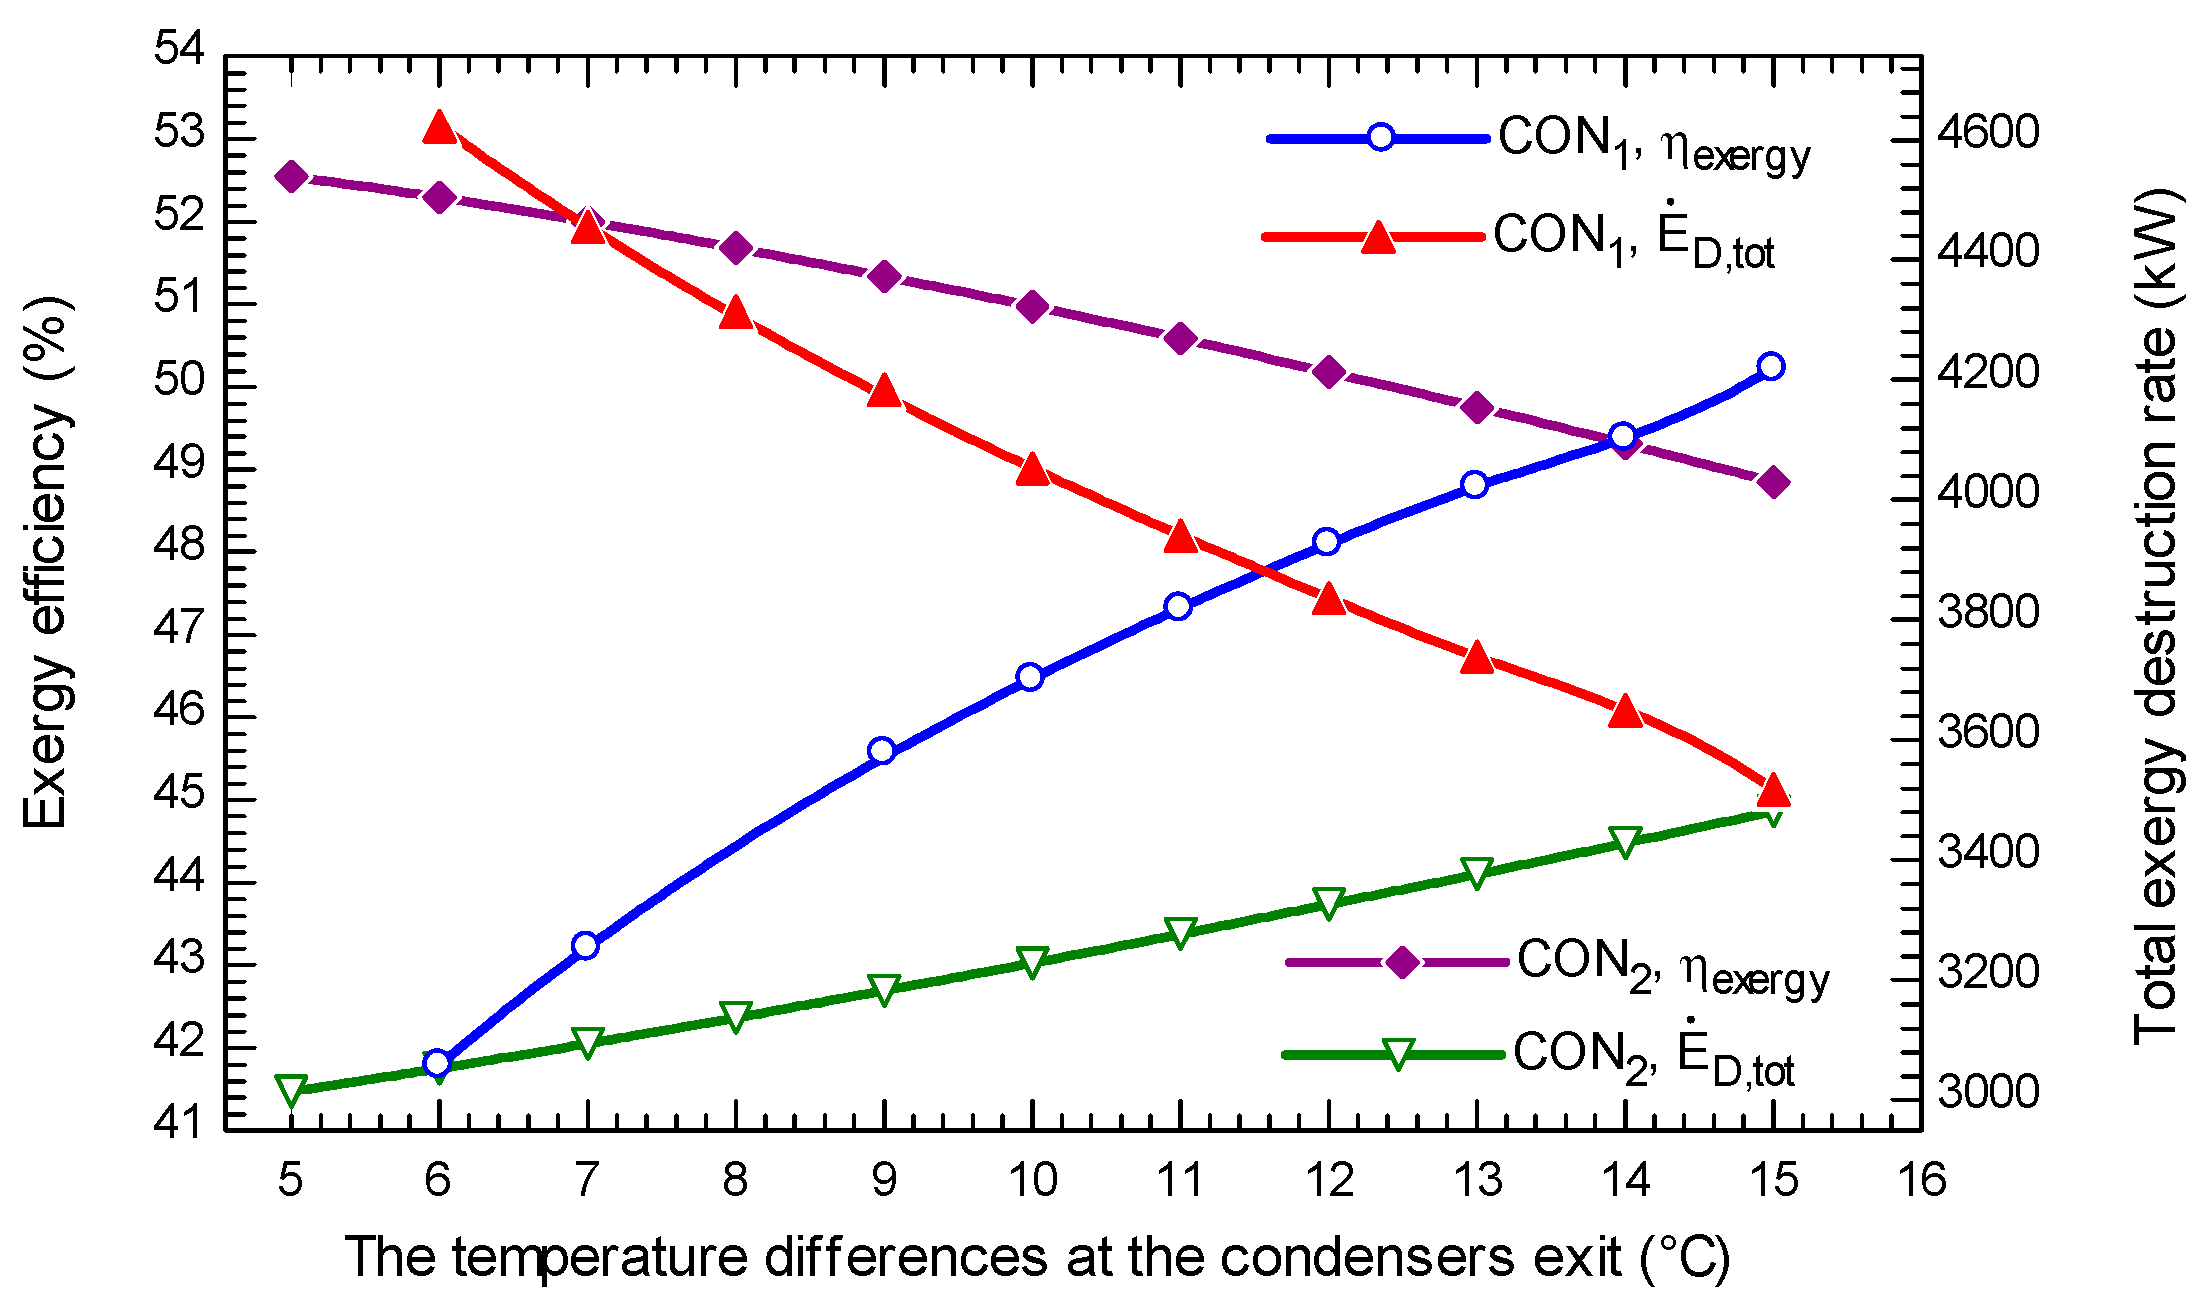
The influence of the temperature differences at the exit of the condensers on exergy efficiency and total exergy destruction rate in off-design mode is depicted in Figure 6. It is seen that with an increase in δ T CON 1 , the η exergy and E ˙ D , tot are increased and decreased, respectively. In addition the η exergy is decreased and E ˙ D , tot increased as the δ T CON 2 changes. The net produced power is decreased with an increase in both δ T CON 1 and   δ T CON 2 . However, the input exergy to the system is kept constant in changing δ T CON 2 and is decreased in variation δ T CON 1 .

3.3. Discussion of Parametric Analysis

The general behavior of the system on the selected parameters may be summarized as follows:
-
There is a local optimum value in the exergy efficiency at the specific value of TIP = 16.3   bar and T gen = 51.5 °C in the typical day of WWC. In the other typical day categories, the exergy efficiency has local optimum at the different values of TIP and T gen in comparison to typical day of WWC.
-
The total exergy destruction rate in minimized locally at the specific values of TIP = 16.53   bar in the typical day of WWC. This value of TIP is changed in the other typical day categories in order to minimize locally the total exergy destruction rate.
-
The general behavior of operational parameters for all typical days categories is almost the same of the typical day of WWC as shown in Figure 5, Figure 6 and Figure 7.
-
In the hot days; TSF, TWF, SWX and SSX, with an increase in the δ T CON 1 the exergy efficiency decreases which is in reverse for other category days.
-
The values of δ T CON 1 and δ T CON 1 are limited by the ambient temperature and take different range in different typical day categories.

3.4. The Optimized Quasi-Steady State Results For Different Typical Days

The quasi-steady state study under off-design conditions is calculated for the proposed system to examine the system performance. Then the system is optimized based on two main criteria, exergy efficiency and total exergy destruction rate. In the first scenario, the optimization is performed for the maximum exergy efficiency. The minimizing of the total exergy destruction rate is considered in the second scenario. According to the sensitive analysis, parameters such as: the turbine inlet pressure, the generator temperature, the temperature differences at the Absorber and condensers affect the system performance. The possible range of these parameters for optimization purpose is considered as follows:
maximize   η exergy   and   minimize   E ˙ D , tot   ( TIP ,   T gen ,   δ T CON 1 ,   δ T CON 2 , δ T ABS )
11 TIP   ( bar ) 32
40 T gen ( ° C ) 67
5 δ T CON 1 ( ° C ) 25
5 δ T CON 2 ( ° C ) 15
5 δ T ABS ( ° C ) 17
11 TIP   ( bar ) 32
It is noteworthy to mention that in all annual calculations for 10 typical days, the ammonia concentration in the power section is kept constant as 0.5   kg ( NH 3 ) / kg ( solution ) . The other operational parameters (pinch point temperature difference in the boiler, hot outlet-cold inlet temperature difference in the boiler, heat sink outlet temperature at the absorber, rectifier and condensers, reinjection geothermal hot water temperature) are calculated in off-design conditions for each 10 typical days category. The optimization results are presented in 
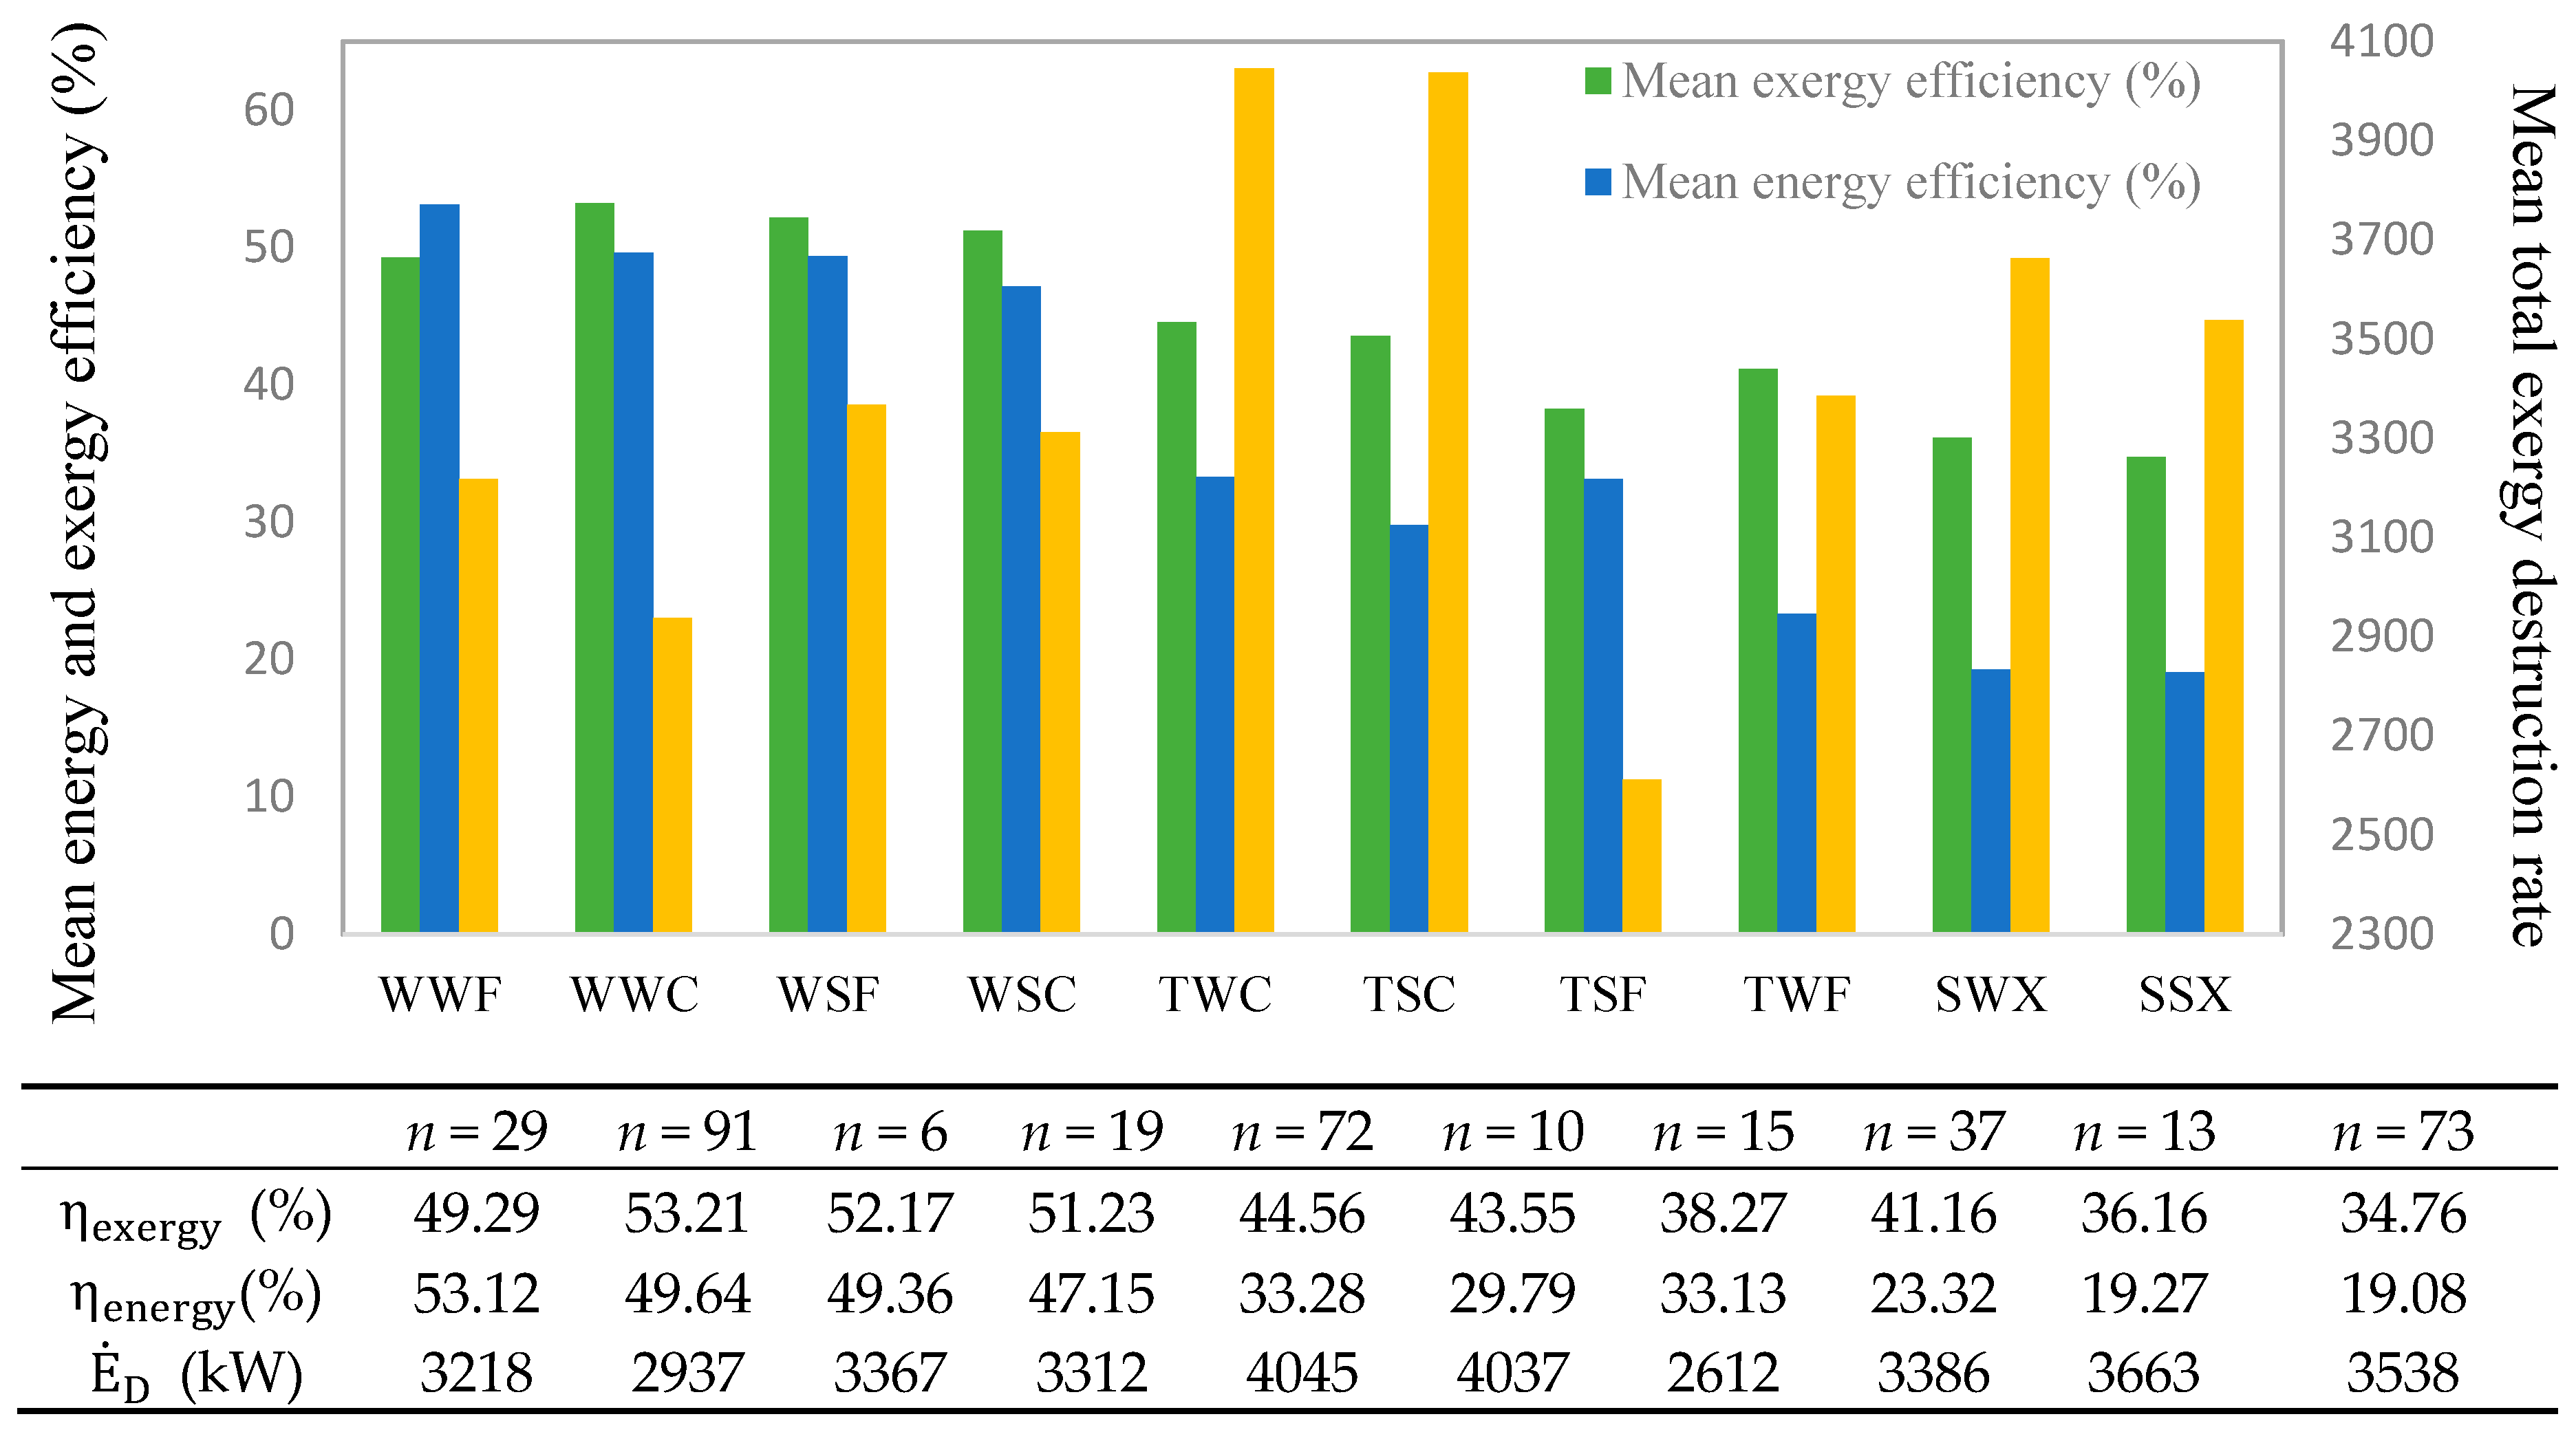
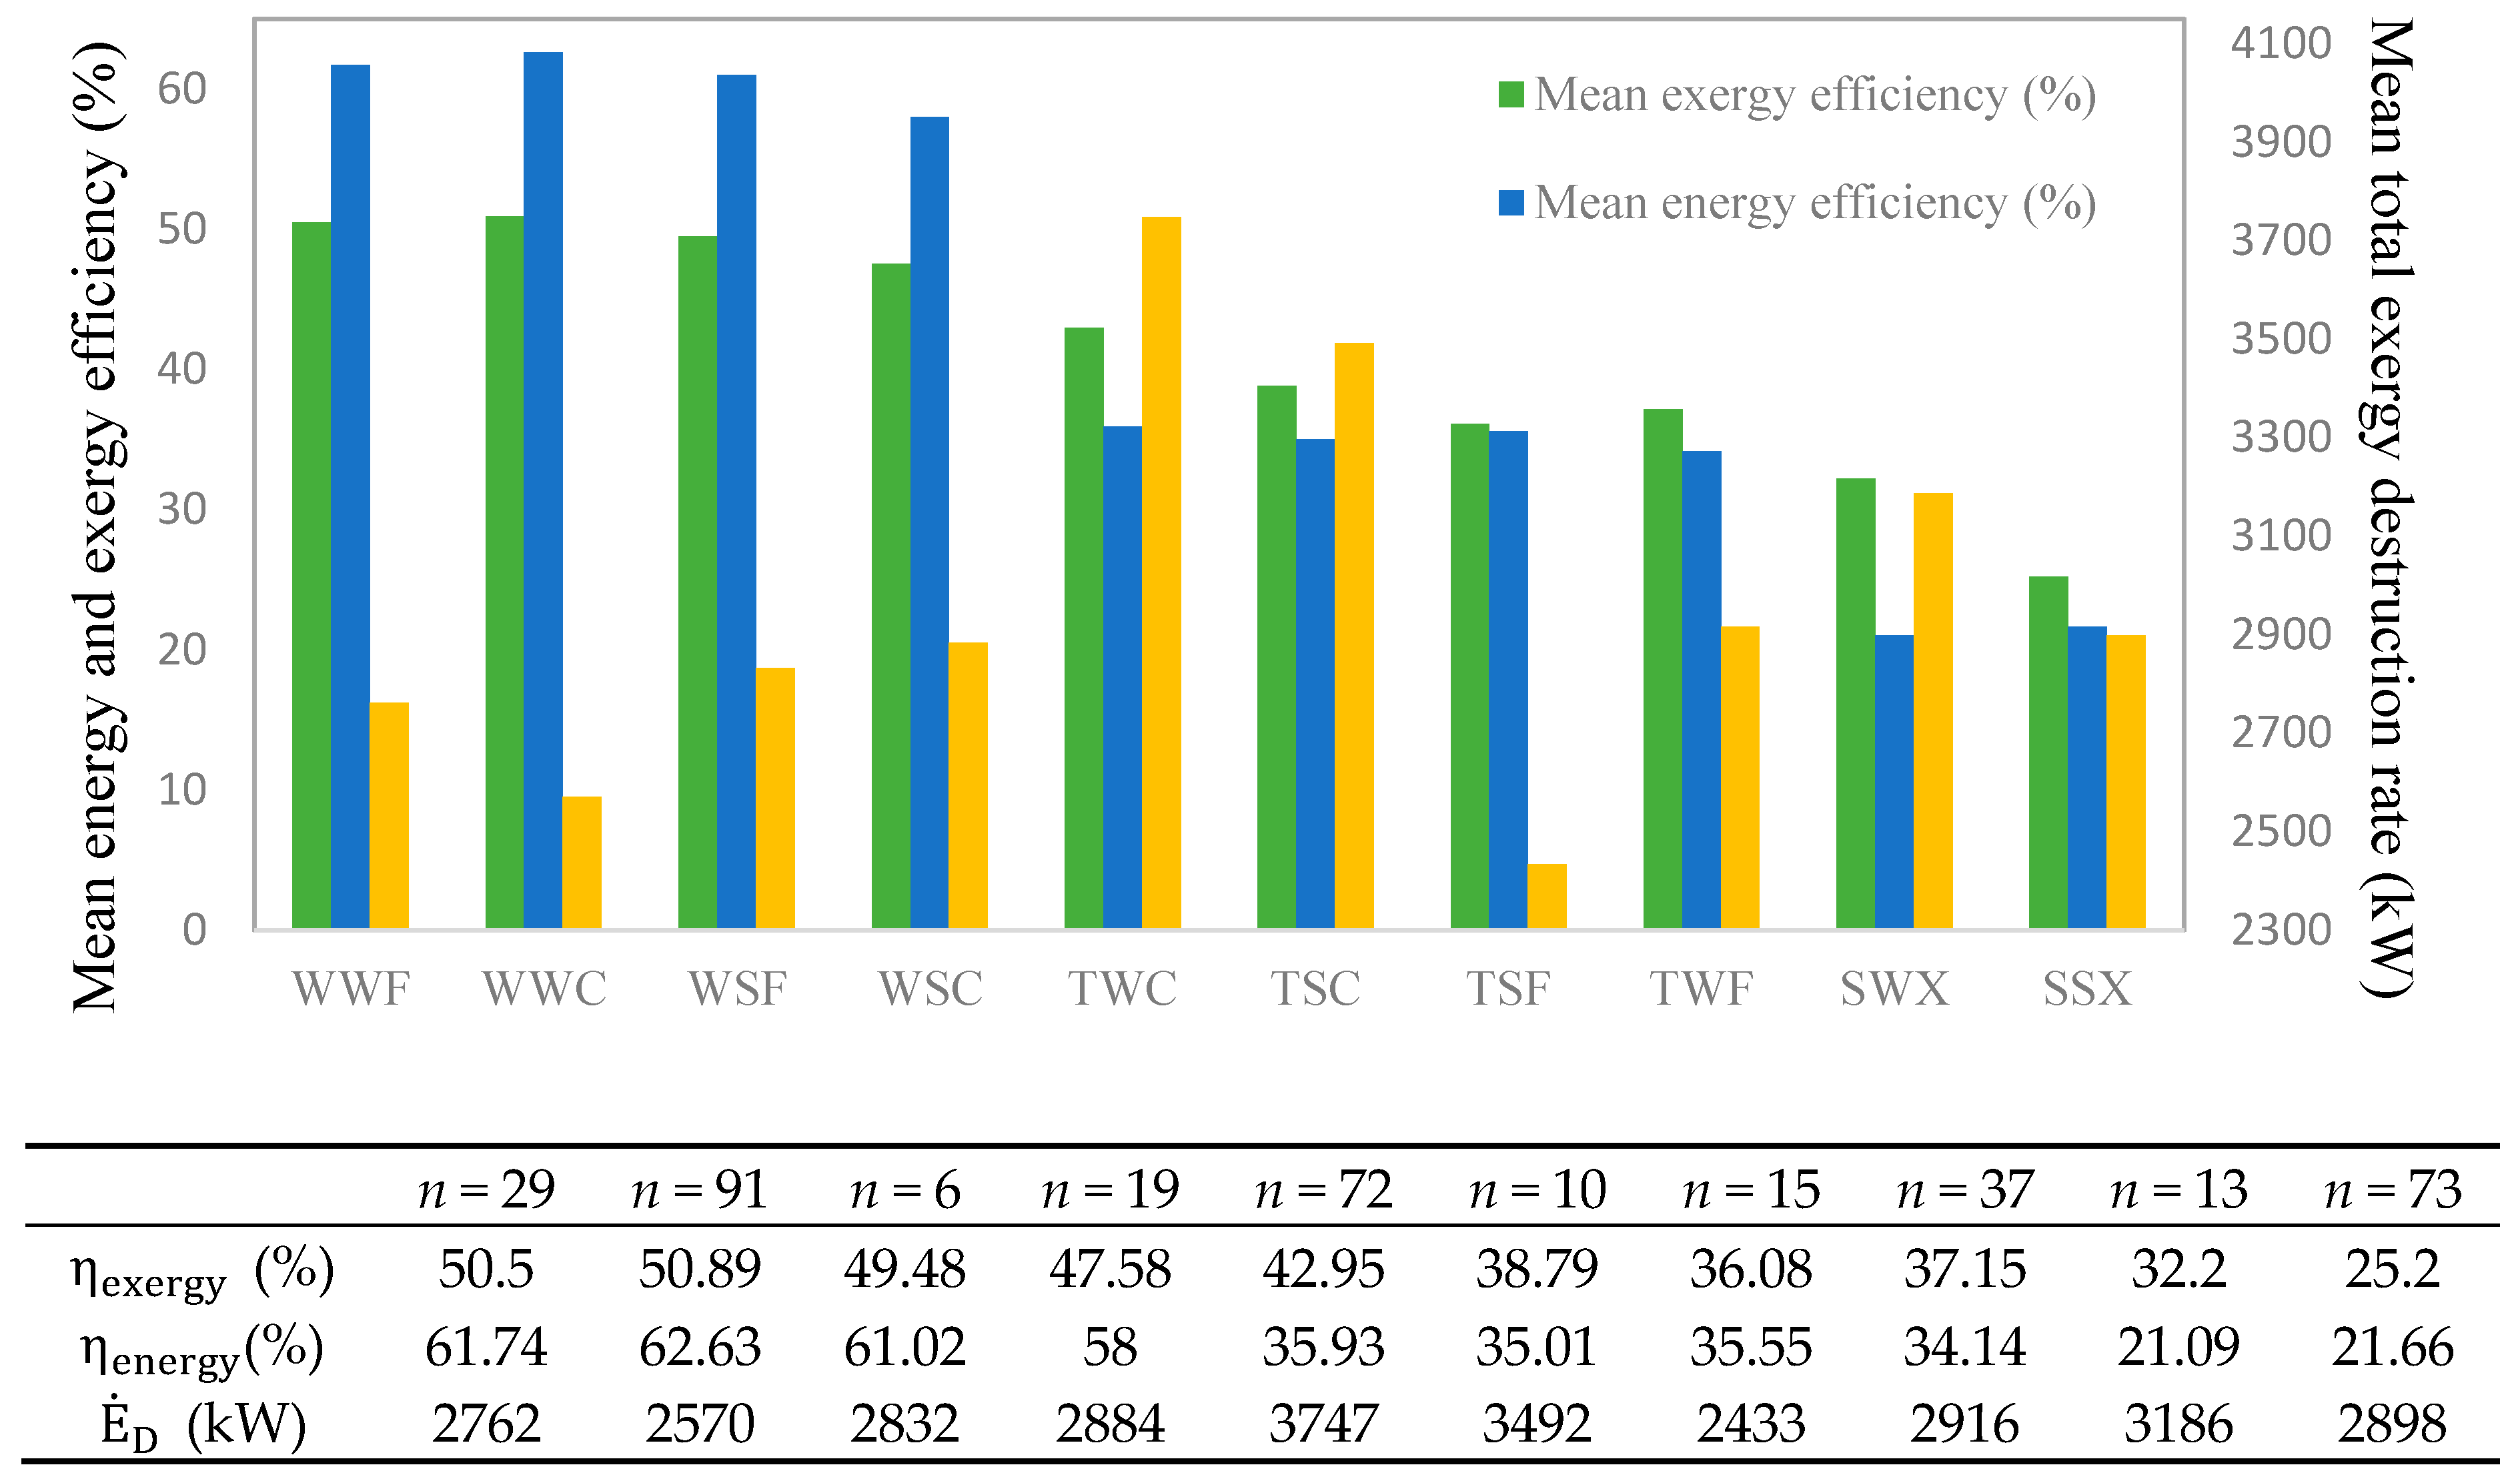
Figure 7 for maximum mean exergy efficiency and in Figure 8 for minimum mean total exergy destruction rate. In addition, the values of different operational parameters as well as the other parameters, which are obtained to optimize the system, are underlined in Table A1 for winter conditions and Table A2 for summer conditions in Appendix A.
In order to maximize the exergy efficiency based on yearly calculation in the proposed system, the δ T CON 2 and δ T ABS take their highest values, the δ T CON 1 is considered its lowest value and the TIP and T gen are selected as the variable parameters. In the first scenario, the mean annual exergy and energy efficiencies are calculated to be 44.67% and 35.47%, respectively due to the weighting according to the frequency of typical days. The mean total exergy destruction rate in the first scenario is calculated to be 3412.83 kW. As indicated in Figure 7, due to the high values of heating demand in winter days in comparison to the transition and summer days, the exergy efficiency in winter days is higher. In the weather category of WWC, the higher mean exergy efficiency (53.21%) happens. In addition, the mean exergy efficiency in summer days takes the lowest value because of the lower values of heating demand. The lowest decrease of the mean exergy efficiency takes place at SSX due to the lowest value of required heating demand. The cooling demand in summer days is higher; however, the cooling exergy takes lower values in comparison to heating exergy. Besides, in the first scenario the highest and lowest mean energy efficiency occurs in the WWF and SSX with values of 53.12% and 19.07%, respectively. The lower mean energy efficiency in hot days happens due to the lower values of heat input to the system. The higher reinjection geothermal temperature brings about reduction in heat input. In the typical day of WSF, in the first scenario the system is run under part load of 90% with net produced power of 1517 kW. However, in the typical day of TSF with the net produced power of 986.1 kW the system is run under part load of 58%.
In minimizing the total exergy destruction rate, the δ T CON 1 , δ T ABS and   δ T CON 2 select their lowest values. The TIP and T gen are considered as the variable parameters. In this regard, in the second scenario the annual mean exergy destruction rate is 2980.32 kW. In addition, the annual mean exergy and energy efficiencies in the second scenario are calculated to be 40.95% and 42.59%, respectively. It is observed that the highest mean exergy destruction rate occurs in the typical day TWC of 3747 kW. The lowest mean exergy achieves a value of 2433 kW in the typical day TSF. In the winter days, the total exergy destruction rate in the work days is lower than the one in the Sundays, however, in the transient and summer days this value in the workdays is higher than the one in the Sundays. In addition, a comparison between cloudy and fine days in the winter days shows that in the fine days the total exergy destruction rate takes higher value than the one in the cloudy days in the winter conditions. In the transient condition, this value in cloudy days in lower than the one in the fine days. In this regard, the performances of tri-generation system have been changed with variation in the weather conditions. The system works under part load of 35.35% and 70.32% in the typical day of WWF and SWX, respectively.
Comparing two optimization cases, the reduction in the total exergy destruction rate in the second scenario is achieved at the expense of 8.32% decrease in the exergy efficiency. In addition, the higher mean exergy efficiency in the first scenario is obtained at the expense of 14.52% increase in the total exergy destruction rate. In this regard, the optimization results for minimizing the total exergy destruction rate bring about a better performance enhancement.
In detail discussion, the on-design exergy efficiency in [17] driven by geothermal heat source of 173 °C was 52.8% in winter days, however it was calculated to be 49.5% in summer days. However as seen in the Figure 7 and Figure 8, the exergy efficiency in the winter days is varied between 38.79−53.21%. In the summer days, it varies between 25.2−36.16%. In addition, in the transient conditions, it is in the range of 36.08−41.16%. Furthermore, in Ref. [17] the ambient temperature was taken constant values of in summer and winter days 22.3 °C and 10.1 °C, respectively. However, in the present study it varies in different typical day categories according to an existing geothermal district heating network in the German Molasse basin, which makes the investigation more practical.
Referring to Table A1 and Table A2 in the Appendix, the turbine isotropic efficiency in the off- design mode in different typical day categories varies between 56−85%, however it took almost in the previous works constant value of 85%. It is important to mention that the turbine isotropic efficiency in the off-design calculation in the second scenario is almost 5−20% lower than the one in the first scenario. In addition, the pinch point difference temperature in the boiler in previous works always took a constant value of 10 °C. However, as shown in Table A1 and Table A2, it varies between 14.22−25.47 °C for maximizing the exergy efficiency. It is obvious that the pinch point difference temperature in the boiler takes higher values in order to minimizing the total destruction rate in comparison to maximizing the exergy efficiency. On the other hand, the temperature difference of the heat sink streams ( δ T air ) in the previous studies almost was taken 10 °C. These values in the present work and referring to Table A1 and Table A2, are calculating in the off-design conditions and vary in the range of 3.5−19.2 °C. It is shown that the heat sink temperature difference in the REC ( δ T air , REC ) is decreases with a reduction in the heating demand rate. Additionally, these values in the second scenario are higher than the ones in the first scenario. The heat sink temperature difference of the ABS ( δ T air , ABS ) and CON1 ( δ T air , CON 1 ) in maximizing the exergy efficiency is almost higher than the one in minimizing the total destruction rate. However, the heat sink temperature difference in the CON2 ( δ T air , CON 2 ) in the first scenario is lower than the one in the second one.

4. Conclusions

A novel tri-generation system using ammonia-water solution as working fluid driven by geothermal heat source is studied with the aim to fulfill corresponding heating and cooling demand in winter and summer conditions in Germany. The sensitive analyses are performed to study the influence of various optional parameters on the system performance. In addition, the result of parametric analysis for 10 different typical days is investigated in off-design modes.
The following main conclusions can be drawn according to the corresponding issues mentioned in the introduction:
  • The required heating demand is covered by the geothermal mass flow division ratio in both winter and summer conditions. This value is decreased with a reduction in heating demand.
  • There is a local optimum for the exergy efficiency and the total destruction rate at specific values of Turbine inlet pressure.
  • With an increase in generator temperature, there is a local maximum in exergy efficiency, however, the total exergy destruction rate is decreased.
  • Under optimization condition, the maximum annual exergy efficiency is obtained as 44.67% at the expense of 14.52% increase in the total exergy destruction rate in comparison to second scenario.
  • The ooptimization results show the minimum mean total exergy destruction rate of the system is calculated as 2980 kW at the expense of 8.32% decrease in the exergy efficiency in the first scenario.
  • Considering both exergy efficiency and total exergy destruction rate in off-design condition, the best enhancement through the optimization process is achieved on the typical day WWC with 53.21% of exergy efficiency and 2570 kW of total exergy destruction rate.
  • Comparing the optimization results for maximum exergy efficiency and minimum total exergy destruction rate depicts a better performance improvement obtained in the second scenario.
In future studies, designing the heat exchangers will be applied to compare the off-design results. In addition, the annual economic analysis will be considered, as well.

Author Contributions

All authors contributed to this work by collaboration. M.A.K. is the main author of this manuscript. F.H. had the initial idea and assisted in the conceptual design of the study as well as in the writing of the manuscript. D.B. supervised the whole project. All authors have read and agreed to the published version of the manuscript.

Funding

The funding from the Bavarian State Ministry for Education, Science and the Arts in the framework of the project “Geothermie-Allianz Bayern” is gratefully acknowledged. This publication was funded by the German Research Foundation (DFG) and the University of Bayreuth in the funding programme Open Access Publishing.

Conflicts of Interest

The authors declare no conflict of interest.

Nomenclature

ABSabsorberTIPturbine inlet pressure
BOIboilerTURturbine
CONcondenser W ˙ power ( kW )
DEPdephlepmator X ammonia concentration
DHEdomestic heat exchanger
EVAevaporatorSubscripts and abbreviations
e ch 0 standard chemical exergy0ambient
EXexpansion valveCDcooling demand
E ˙ exergy rate chchemical
e Specific exergy Ddestruction
GENgeneratorgeoGeothermal hot water
h specific enthalpy HDheating demand
M Molar weightLloss
m ˙ mass flow rate pproduct
P pressure phphysical
Pupumppppinch point
r geo Geothermal mass flow division ratioGreek symbols
s specific entropy η Ι Ι Exergy efficiency
SHEsolution heat exchanger η is isentropic efficiency
SEPseparator ζ Ammonia concentration
T temperature Y D , k * ratio of exergy destruction for a certain component

Appendix A

Table A1. Detailed parameters of the optimization calculation (a) maximum exergy efficiency (b) minimum exergy.destruction rate.
WWFWWCWSFWSCTWCTSC
T a m b i e n t (°C)−0.13−5.682.271.17.374.81
Q ˙ h e a t i n g   ( M W ) 11.811.6611.810.,796.36.15
Q ˙ c o o l i n g   ( M W ) ------
(a)(b)(a)(b)(a)(b)(a)(b)(a)(b)(a)(b)
Decision operational variables
TIP (bar)16.415.717.5171717.518.420.320.521.919.522.5
T gen (°C)57.6662.0252.6557.557.3261.825861.4858.257.945558.9
δ T ABS (°C)15.89.811.25.512.66.4145.6158.66.8975.2
δ T CON 1 (°C)19.6923.417.6725.11720.8318.7521.7113.7213.512.4815.81
δ T CON 2 (°C)555.25555.255555
Calculated parameters in the off-design conditions
η s , tur   ( % ) 846885708464856485818476
δ T pp (°C)17.9934.519.1635.316.853317.6729.613.2816.6615.8622.32
T eva (°C)------------
δ T air , ABS = T 32 T 31 (°C)17.8314.712.619.7714.1310.115.549.0115.436.55128.1
δ T air , CON 1 = T 36 T 35 (°C)16.4815.4517.6816.5216.5615.4916.415.5713.558.612.4415.8
δ T air , CON 2 = T 40 T 39 (°C)7.0618.077.9819.27.06216.276.8814.263.6713.53.7517.45
δ T air , REC = T 34 T 33 (°C)10.8114.511.8116.349.48512.479.3711.595.145.35.4265.7
Table A2. Detailed parameters of the optimization calculation (a) maximum exergy efficiency (b) minimum exergy destruction rate.
TSFTWFSWXSSX
T a m b i e n t (°C) 13.8115.4215.6717.24
Q ˙ h e a t i n g   ( M W ) 4.795.692.992.9
Q ˙ c o o l i n g   ( M W ) 1.781.92.582.5
(a)(b)(a)(b)(a)(b)(a)(b)
Decision operational variable
TIP (bar)2021.719.525.22026.0620.229.6
T gen (°C)67.6267.6261.0264.758.966560.8166.85
δ T ABS (°C)12.117.8112.717.6911.6111.5112.017.55
δ T CON 1 (°C)14.214.27.0210.124.9910.12510.12
δ T CON 2 (°C)55555555
Calculated parameters in the off-design conditions
η s , tur (%)71600796680717956
δ T pp (°C)25.4726.0114.6515.1414.2212.4614.8411.78
T eva (°C)10.5810.149.77.111.576.52214.8915.5
δ T air , ABS = T 32 T 31 (°C)13.649.2912.767.710.744.0711.387.13
δ T air , CON 1 = T 36 T 35 (°C)14.1314.136.559.373.837.793.98.11
δ T air , CON 2 = T 40 T 39 (°C)7.2158.93.35.232.53.712.713.11
δ T air , REC = T 34 T 33 (°C)4.3114.53.13.222.452.432.42.42

References

  1. Wanga, X.; Levya, E.K.; Pana, C.; Romeroa, C.E.; Banerjeeb, A.; Rubio-Mayac, C.; Pand, L. Working fluid selection for organic Rankine cycle power generation using hot produced supercritical CO2 from a geothermal reservoir. Appl. Therm. Eng. 2019, 149, 1287–1304. [Google Scholar] [CrossRef]
  2. Feng, P.H.; Zhao, B.C.; Wang, R.Z. Thermophysical heat storage for cooling, heating, and power generation: A review. Appl. Therm. Eng. 2020, 166, 114728. [Google Scholar] [CrossRef]
  3. Cao, L.; Lou, J.; Wang, J.; Dai, Y. Exergy analysis and optimization of a combined cooling and power system driven by geothermal energy for ice-making and hydrogen production. Energy Convers. Manag. 2018, 174, 886–896. [Google Scholar] [CrossRef]
  4. Seyfouri, Z.; Ameri, M.; Mehrabian, M.A. Exergo-economic analysis of a low-temperature geothermal-fed combined cooling and power system. Appl. Therm. Eng. 2018, 145, 528–540. [Google Scholar] [CrossRef]
  5. Moharamian, A.; Soltani, S.; Rosen, M.A.; Mahmoudi, S.M.S.; Morosuk, T. Exergoeconomic analysis of natural gas fired and biomass post-fired combined cycle with hydrogen injection into the combustion chamber. J. Clean. Prod. 2018, 180, 450–465. [Google Scholar] [CrossRef]
  6. Eller, T.; Heberle, F.; Brüggemann, D. Thermodynamic and economic analysis of geothermal combined heat and power based on a double-stage Organic Rankine Cycle. In Proceedings of the 5th International Seminar on ORC Power Systems, Athens, Greece, 9–11 September 2019. [Google Scholar]
  7. Erdeweghe, S.V.; Bael, J.V.; Laenen, B.; D’haeseleer, W. Optimal combined heat-and-power plant for a low-temperature geothermal source. Energy 2018, 150, 396–409. [Google Scholar] [CrossRef]
  8. AMosaffa, H.; Mokarram, N.H.; Farshi, L.G. Thermoeconomic analysis of a new combination of ammonia/water power generation cycle with GT-MHR cycle and LNG cryogenic exergy. Appl. Therm. Eng. 2017, 124, 1343–1353. [Google Scholar] [CrossRef]
  9. Rostamzadeha, H.; Gargarib, S.G.; Naminb, A.S.; Ghaebib, H. A novel multigeneration system driven by a hybrid biogas-geothermal heat source, Part I: Thermodynamic modeling. Energy Convers. Manag. 2018, 177, 535–562. [Google Scholar] [CrossRef]
  10. Zhang, Z.; Guo, Z.; Chen, Y.; Wua, J.; Hua, J.A. Power generation and heating performances of integrated system of ammonia–water Kalina–Rankine cycle. Energy Convers. Manag. 2015, 92, 517–522. [Google Scholar] [CrossRef]
  11. Coskun, C.; Oktay, Z.; Dincer, I. Thermodynamic analyses and case studies of geothermal based multi-generation systems. J. Clean. Prod. 2012, 32, 71–80. [Google Scholar] [CrossRef]
  12. Zare, V. A comparative thermodynamic analysis of two tri-generation systems utilizing low-grade geothermal energy. Energy Convers. Manag. 2016, 118, 264–274. [Google Scholar] [CrossRef]
  13. Akrami, E.; Chitsaz, A.; Nami, H.; Mahmoudi, S.M.S. Energetic and exergoeconomic assessment of a multi-generation energy system based on indirect use of geothermal energy. Energy 2017, 124, 625–639. [Google Scholar] [CrossRef]
  14. Mlcak, H.; Mirolli, M. Notes from the North: A Report on the Debut Year of the 2 MW Kalina Cycle Geothermal Power Plant in Húsavík, Iceland. In Transactions-Geothermal Resources Council; Geothermal Resources Council: Olympia, WI, USA, 2002; Available online: http://powerengineers.jobs/wp-content/uploads/2002/08/HusavikGRC2002.pdf (accessed on 26 March 2002).
  15. Hjartarson, H.; Maack, R.; Jóhannesson, S.R. Húsavík Energy Multiple Use of Geothermal Energy. 2005. Available online: https://www.oh.is/static/files/Skyrslur_og_greinar/Enskar/OH_energy_multiple_use_grein_f_radstefnu.pdf (accessed on 30 January 2005).
  16. Ogriseck, S. Integration of Kalina cycle in a combined heat and power plant, a case study. Appl. Therm. Eng. 2009, 29, 2843–2848. [Google Scholar] [CrossRef] [Green Version]
  17. Dawo, F.; Wieland, C.; Spliethoff, H. Kalina power plant part load modeling: Comparison of different approaches to model part load behavior and validation on real operating data. Energy 2019, 174, 625–637. [Google Scholar] [CrossRef]
  18. Knapek, E.; Kittl, G. Unterhaching Power Plant and Overall System. In Proceedings of the European Geothermal Congress, Unterhaching, Germany, 30 May–1 June 2007. [Google Scholar]
  19. Mergner, H.; Schaber, K. Performance analysis of an evaporation process of plate heat exchangers installed in a Kalina power plant. Energy 2018, 145, 105–115. [Google Scholar] [CrossRef]
  20. Schuster, S.; Markides, C.N.; Whitea, A.J. Design and off-design optimisation of an organic Rankine cycle (ORC) system with an integrated radial turbine model. Appl. Therm. Eng. 2020, 115192. [Google Scholar] [CrossRef]
  21. Ibarra, M.; Rovira, A.; Alarcón-Padillac, D. Performance of an Organic Rankine Cycle with two expanders at off-design operation. Appl. Therm. Eng. 2019, 149, 688–701. [Google Scholar] [CrossRef]
  22. Eller, T.; Heberle, F.; Brüggemann, D. Techno-economic analysis of novel working fluid pairs for the Kalina cycle. Energy Procedia 2017, 129, 113–120. [Google Scholar] [CrossRef]
  23. Heberle, F.; Eller, T.; Brüggemann, D. Thermoeconomic evaluation of one-and double-stage ORC for geothermal combined heat and power production. In Proceedings of the European Geothermal Congress, Strasbourg, France, 19–23 September 2016. [Google Scholar]
  24. Eller, T.; Heberle, F.; Brüggemann, D. Transient Simulation of Geothermal Combined Heat and Power Generation for a Resilient Energetic and Economic Evaluation. Energies 2019, 12, 894. [Google Scholar] [CrossRef] [Green Version]
  25. Klein, K.A.; Alvarado, F.L. EES-Engineering Equation Solver; Version 6.648 ND; F-Chart Software: Middleton, WI, USA, 2004. [Google Scholar]
  26. Ibrahim, O.M.; Klein, S.A. Thermodynamic Properties of Ammonia-Water Mixtures. In ASHRAE Transactions, Symposia; ASHRAE Transactions: Atlanta, GA, USA, 1993; pp. 1495–1502. [Google Scholar]
  27. Wagner, W.; Pruß, A. The IAPWS Formulation 1995 for the Thermodynamic Properties of Ordinary Water Substance for General and Scientific Use. J. Phys. Chem. Ref. Data 2002, 31. [Google Scholar] [CrossRef] [Green Version]
  28. Fujuita, T.; Kikuchi, S. Vapor pressure of Aqueous Solutions of Ethylene Glycol. Trans. Jpn. Soc. Refrig. Air Cond. Eng. 2011, 6, 183–186. [Google Scholar]
  29. Lee, D.J.; Huang, W.H. Enthalpy-entropy compensation in micellization of sodium dodecyl sulphate in water/methanol, water/ethylene glycol and water/glycerol binary mixtures. Colloid Polym. Sci. 1996, 274, 160–165. [Google Scholar] [CrossRef]
  30. Kordlar, M.A.; Mahmoudi, S.M.S. Exergeoconomic analysis and optimization of a novel cogeneration system producing power and refrigeration. Energy Convers. Manag. 2017, 134, 208–220. [Google Scholar] [CrossRef]
  31. McQuiston, F.C.; Spitler, D.P.J.; Jeffrey, D. Heating, Ventilating and Azir Conditioning: Analysis and Design, 6th ed.; Wilely: Hoboken, NJ, USA, 2004. [Google Scholar]
  32. Zare, V.; Moalemian, A. Parabolic trough solar collectors integrated with a Kalina cycle for high temperature applications: Energy, exergy and economic analyses. Energy Convers. Manag. 2017, 151, 681–692. [Google Scholar] [CrossRef]
  33. SeopKim, I.; Kim, T.S.; Lee, J.J. Off-design performance analysis of organic Rankine cycle using real operation data from a heat source plant. Energy Convers. Manag. 2017, 133, 284–291. [Google Scholar] [CrossRef]
  34. Cao, Y.; Dai, Y. Comparative analysis on off-design performance of a gas turbine and ORC combined cycle under different operation approaches. Energy Convers. Manag. 2017, 135, 84–100. [Google Scholar] [CrossRef]
  35. Manente, G.; Toffolo, A.; Lazzaretto, A.; Paci, M. An Organic Rankine Cycle off-design model for the search of the optimal control strategy. Energy 2013, 58, 97–106. [Google Scholar] [CrossRef]
  36. Heberlea, F.; Hofera, M.; Brüggemanna, D.R. A Retrofit for Geothermal Organic Rankine Cycles based on Concentrated Solar Thermal Systems. Energy Procedia 2017, 129, 692–699. [Google Scholar] [CrossRef]
  37. Ghasemi, H.; Sheu, E.; Tizzanini, A.; Paci, M.; Mitsos, A. Hybrid solar–geothermal power generation: Optimal retrofitting. Appl. Energy 2014, 131, 158–170. [Google Scholar] [CrossRef]
  38. Energietechnik, G.; Ingenieure, V.D. Referenzlastprofile von Ein-und Mehrfamilienhäusern für den Einsatz von KWK-Anlagen; Beuth: Berlin, Germany, 2008. (In German) [Google Scholar]
  39. Heberle, F.; Brüggemann, D. Exergy based fluid selection for a geothermal Organic Rankine Cycle for combined heat and power generation. Appl. Therm. Eng. 2010, 30, 1326–1332. [Google Scholar] [CrossRef]
  40. Mahmoudi, S.M.S.; Kordlar, M.A. A new flexible geothermal based cogeneration system producing power and refrigeration. Renewe Energy 2018, 123, 499–512. [Google Scholar] [CrossRef]
  41. Misraa, R.D.; Sahoob, P.K.; Guptab, A. Thermoeconomic evaluation and optimization of an aqua-ammonia vapour-absorption refrigeration system. Int. J. Refrig. 2009, 29, 47–59. [Google Scholar] [CrossRef]
  42. Akbari, A.D.; Mahmoudi, S.M.S. Thermoeconomic performance and optimization of a novel cogeneration system using carbon dioxide as working fluid. Energy Convers. Manag. 2017, 145, 265–277. [Google Scholar] [CrossRef]
  43. Adewusi, S.A.; Zubair, S.M. Second law based thermodynamic analysis of ammonia–water absorption systems. Energy Convers. Manag. 2004, 45, 2355–2369. [Google Scholar] [CrossRef]
Figure 1. Schematic diagram of the proposed tri-generation system.
Applsci 10 06532 g001
Figure 2. Off-design calculation procedure.
Applsci 10 06532 g002
Figure 3. Verification results for absorption refrigeration cycle for the present work and with previously published data by [43].
Applsci 10 06532 g003
Figure 4. The effect of the TIP (a) on exergy efficiency and total exergy destruction rate (b) on the turbine specific work and mass flow rate.
Applsci 10 06532 g004
Figure 5. The influence of the T gen (a) on exergy efficiency and total exergy destruction (b) on the net produced power and input exergy to the system.
Applsci 10 06532 g005
Figure 6. The variation of exergy efficiency and the total exergy destruction rate with the temperature differences at the condensers exit.
Applsci 10 06532 g006
Figure 7. The mean energy and exergy efficiencies as well as the mean total exergy destruction rate of each typical day under optimization condition based on maximum exergy efficiency.
Applsci 10 06532 g007
Figure 8. The mean energy and exergy efficiencies as well as the mean total exergy destruction rate of each typical day under optimization condition based on minimum total exergy destruction rate.
Applsci 10 06532 g008
Table 1. Input data and boundary conditions used for design the system and process the simulation.
ParameterSymbolValue
Dead state pressure ( b a r ) p 0 1
Dead state temperature (°C) T 0 T 0 + 5
Geothermal hot water temperature (°C) [24] T in , geo 138
Geothermal hot water mass flow rate (kg/s) [24] m ˙ geo 120
Ambinet temperature (°C) [24] T amb −5.68
Heating demand ( M W ) [24] Q ˙ heating 11.8
Evaporator temperature (°C) [24] T eva 5
Turbine inlet pressure (bar) [31] TIP 20
Ammonia concentration in the boiler (%) [32] ζ B 50
Supply heating temperature (°C) [24] T 33 90
Return heating temperature (°C) [24] T 32 60
Turbine isentropic efficiency   ( % ) [12] η is , tur 85
Pump isentropic efficiency ( % ) [22] η is , pump 75
Table 2. The calculated parameters of heat exchangers in design mode.
( U A ) d e s i g n   ( k W / K ) ( m ˙ ) d e s i g n ( k g / s )
Domestic heat exchanger313.292.64
Boiler723.513.37
Generator71.2417.11
Solution heat exchanger37.1117.11
Absorber343.9263.8
Condenser 1128.6110.4
Condenser 2514.41110
Dephlegmator3.06612.39
Evaporator for heating24.181.74
Evaporator for cooling10142.082
Table 3. Test reference years according to VDI 4655 [38].
Climate ZoneNumber of Typical Days (Frequency of the Different Typical Days)
WWFWWCWSFWSCTWCTSCTSFTWFSWXSSX
TRY122357216911882710419
TRY132991619721015377313
TRY142211552581151142427
Table 4. Corresponding mean values of heating, cooling and ambient temperature for different typical days categories.
WWFWWCWSFWSCTWCTSCTSFTWFSWXSSX
n = 29n = 91n = 6n = 19n = 72n = 10n = 15n = 37n = 13n = 73
T ambient (°C) [24]−0.13−5.682.271.17.374.8113.8115.4215.6717.24
Q ˙ heating   ( MW ) [24]11.6811.6611.810.796.36.154.795.692.992.9
Q ˙ cooling   ( MW ) ------1.781.92.432.48
Table 5. Validation results of the power ammonia-water Kalina cycle operating conditions gained from present work (a) with reported data for the existing power plant in Húsavík [16] (b).
Point Temperature   ( K ) Pressure   ( k P a ) Ammonia Concentration ( k g N H 3 k g s o l u t i o n )
(a)(b)(a)(b)(a)(b)
1281.15281.154.64.60.820.82
2281.20281.1535.335.30.820.82
3314.26314.1534.334.30.820.82
4336.10336.1533.333.30.820.82
5389.15389.1532.332.30.820.82
6389.15389.1532.332.30.9730.97
7389.15389.1532.332.30.4980.5
8316.21316.156.66.60.9730.97
9319.11319.1531.331.30.4980.5
10319.18319.156.66.60.820.82
11303.16303.155.65.60.820.82

