Abstract
Icing phenomenon is an important problem in helicopter rotor design. Conducting experiments in a cold chamber is one of the main methods used to study the law of rotor icing. The purpose of this paper was to analyze the influence of different parameters on the ice shapes of rotor blade and to obtain the relationship between the ice shapes and the input parameters. The icing experimental platform of rotation blade in a cold chamber was set up, and the rotor icing experiments under various conditions were carried out. The ice shapes on the blade were obtained, and the influence of different icing temperatures, rotation speeds, liquid water content, icing times, number of blades on the rotor, and blade materials on the ice shapes were analyzed. The results showed that the ice thickness on the leading edge increased with the increase of liquid water content, rotation speed, and icing time, and the number and material of blades had little effect on icing. The conclusions of this paper can provide a reference for the rotor numerical simulation and future experimental research.
1. Introduction
With the development of modern helicopters, all-weather flight is one of the most important goals that is being pursued by the new generation of helicopters worldwide. All-weather flight requires that the helicopter rotor can work normally under icing weather conditions. Therefore, icing phenomenon is one of the major problems in rotor design [1,2]. The main methods of helicopter rotor icing research include experimental research and numerical simulation [3,4], and the experimental research includes flight experiments and ground experiments. Although the experimental research needs a large amount of money and time, the experimental results are more intuitive. The experimental results can verify the numerical simulation method, which is helpful to improve the calculation accuracy of the rotor numerical method. Some phenomena that cannot be simulated in the numerical method can be observed during the experimental process. In icing airworthiness certification, experimental verification is also an important part [5,6].
Flight experiment is the main method to research the rotor icing problem in the early stage [7]. Its disadvantage is that it needs to search for natural icing weather conditions, which has high risk coefficient and poor repeatability. Nowadays, flight experiment is generally used as the last method in airworthiness certification to verify the performance of rotor anti-icing and de-icing systems. Because the rotor blades rotate around the axis, icing wind tunnels used for fixed wing is difficult to meet the space size requirements of rotor test. If the rotor model is reduced to a suitable size to match the small icing wind tunnel, the three-dimensional rotation effect will be greatly affected [8,9]. In order to overcome the shortcomings of flight experiment and icing wind tunnel experiment, the rotor icing experimental platform is usually built in the cold environment, such as McKinley climate laboratory in the United States, where full-scale helicopter rotor icing experiments can be carried out [10,11].
Many rotor icing experimental results have been obtained. The U.S. military has carried out a comparative test of rotor icing under artificial icing conditions and natural icing conditions. The results show that the outcomes of artificial icing tests and natural icing tests are very similar [12]. Office National d’Etudesetde Recherzhes Aerospatiales (ONERA) has carried out several icing tests of rotor model in Snow & Ice Management Association (SIMA) icing wind tunnel and compared them with flight test results. The flight and icing wind tunnel test data were collected and sorted out, and a database was established [13]. Tsao et al. [14] studied the scaling method of helicopter rotor icing and verified it with the NACA 0012 airfoil model. The results show that the ice shapes before and after scaling are in good agreement. Palacios et al. [15,16] built an icing experimental platform in the cold environment of Penn State University and studied the measurement method of liquid water content in the cold environment. The icing process of wind turbine is similar to that of rotor blade. Li et al. [17] carried out the icing experiment of a wind turbine blade in an icing wind tunnel, measuring the ice shapes under different wind speeds and angles of attack. Shu et al. [18] studied wind turbine blade icing under natural icing conditions and discussed the dynamic response of the short-term power loss of wind turbine.
In this paper, in order to study the effects of different parameters on the rotor icing, we studied the method of rotor icing experiment. The small-scale rotor icing experimental platform in the cold chamber was built, and the related devices were introduced. The rotor icing experiments under various conditions were carried out. The experimental results were analyzed and the effects of different parameters on rotor icing were obtained. The research results of this paper can be compared with the numerical simulation of rotor icing, providing support for further research and verification of anti-icing and de-icing systems design.
2. Experimental Environment and Equipment
In this paper, an icing cold chamber was built on the ground, and a rotor icing experimental platform was installed in the cold chamber to simulate rotor blade icing. In order to ensure the smooth operation of the experiment and that the related parameters can be measured, it was necessary to equip the refrigeration system, spray system, rotor system, and related measuring equipment in the cold chamber.
2.1. Refrigeration System
Considering the blade rotor size and wall effect, the environmental chamber, as shown in Figure 1, was made. The size of the environmental chamber was 3 m long, 3 m wide, and 2 m high, and the outer wall material was phenolic foam insulation board with better adiabatic property. In order to detect the temperature distribution inside the environmental chamber, we installed several temperature sensors on the inner wall. The temperature sensor adopts thermocouple, and its measurable temperature range can reach −40 °C. In the experiment, liquid nitrogen was put into the environmental chamber to achieve the purpose of refrigeration. The input quantity of liquid nitrogen was controlled by the control valve to keep the temperature inside the environmental chamber at the expected value. The icing temperature was controlled within ±1 °C in the icing process.
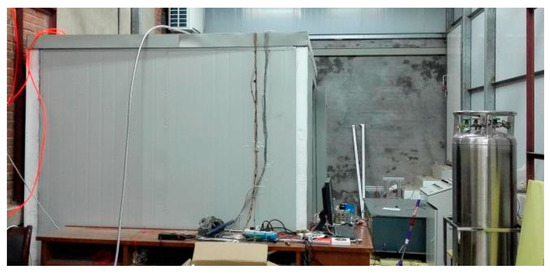
Figure 1.
Environmental chamber and refrigeration system used in the experiment.
2.2. Spray System
Twin fluid nozzles were used to atomize water. The air and water were supplied to the nozzle through the compressor, and the internal structure of the nozzle could mix water and air evenly to produce fine droplet spray. The average diameter of water droplet is directly related to the water pressure and air pressure. By adjusting the pressure of air and water, the droplet diameter can be changed to meet the experimental requirements. A plurality of nozzles were installed on a spray rack, and the spray rack was placed in front of the rotor blades. The liquid water content (LWC) was affected by controlling the number of nozzles used. In the process of the experiment, rotor blades should be placed in the spray range of nozzles to ensure atomization uniformity.
In the study of aircraft icing, the mean volume diameter of droplets (MVD) is usually used to represent the droplet diameter. In the experiment, a relatively simple and reliable statistical method was used to measure the droplet diameter. A thin layer of silicone oil was applied on the surface of glass slide, as shown in Figure 2. The glass slide coated with silicone oil was placed in the spray range of nozzles to collect a certain number of droplets. Due to the incompatibility between oil and water, the droplets were wrapped in silicone oil and keep original shapes for a short time. The droplets on the glass slide were observed and photographed under a high-power microscope; the observation results are shown in Figure 3. The MVD can be obtained by statistical calculation of droplet diameters.
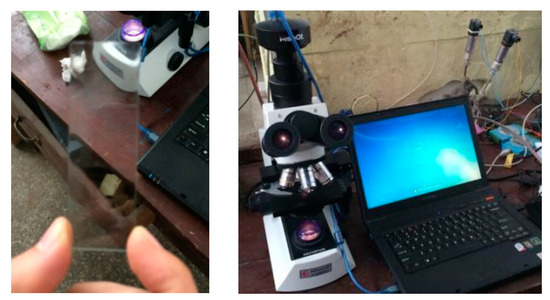
Figure 2.
Glass slide coated with silicone oil and high-power microscope.
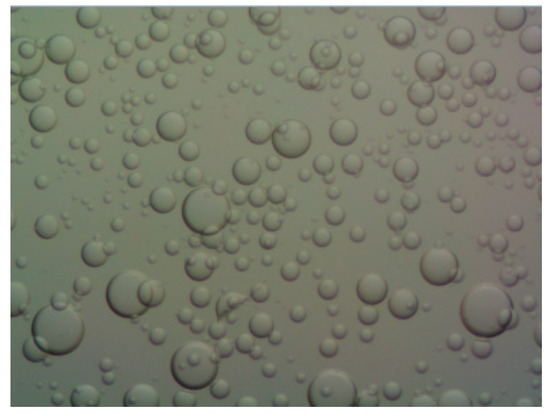
Figure 3.
Droplet diameter distribution observed under high-power microscope.
The measurement method of LWC in the cold chamber mainly used the ice thickness at the stagnation point of blade to calculate LWC. Its principle is that under the influence of aerodynamic force, the liquid water collected at the stagnation point only flows to both downstream sides, and no liquid water flows in. Therefore, the icing rate at the stagnation point can be calculated directly without iterative calculation. In this paper, the method in [15] was adopted. In the experiment, it was necessary to measure the ice thickness at the stagnation point for a certain icing time, and input parameters needed to be determined, including characteristic length, MVD, icing temperature, rotation speed, icing time, etc. According to the relevant calculation formula, we can calculate LWC in the cold chamber.
On the basis of the MVD and rotation speed, we can obtain the droplet collection efficiency at the stagnation point of the rotor blade by using the calculation method of our research results in [19]. The droplet collection efficiency is a dimensionless parameter, and its calculation result does not depend on the LWC. The droplet collection efficiency at the stagnation point can also be calculated by the following simplified formula:
where is the modified inertia factor, which can be expressed as
where is the inertia factor; is the droplet density; is the droplet diameter, which is equal to MVD; is the far field velocity; is the characteristic length; is the dynamic viscosity; is the air density; and is the dimensionless droplet range.
When the droplet collection efficiency is obtained, it is necessary to determine the freezing coefficient at the stagnation point. The freezing coefficient is the ratio of the amount of liquid water frozen into ice and the total amount of liquid water. When , there is no water freezing into ice. When , it means that the droplets collected are immediately frozen into ice; when , it means that part of the water is frozen and the other part remains liquid.
According to the energy balance of liquid water, the expression of freezing coefficient can be given as follows:
where is the specific heat capacity of water, is the latent heat of freezing of water, is the energy exchange coefficient of droplets, is the energy exchange coefficient of air, is the freezing temperature of water, is the surface temperature of water, is the specific heat capacity of air, is the heat conduction coefficient of air, is the vapor pressure of water at the frozen surface, is the vapor pressure of water in the atmosphere, is the static pressure, is the latent heat of evaporation of water, and is convective heat transfer coefficient.
The relative thermal coefficient can be calculated as follows:
The convective heat transfer coefficient can be obtained by Nusselt number :
where is the thermal conductivity of the air and is the droplet diameter.
When , has the following approximate formula:
When , can be expressed as
According to Anderson and Tsao’s suggestion [20], the freezing coefficient in the experiment and the calculated freezing coefficient can be modified by a linear relationship:
where is the modified value, and is the theoretical analysis value of freezing coefficient.
After obtaining the droplet collection efficiency and freezing coefficient at the stagnation point, we can calculate the LWC on the basis of the ice thickness. It was assumed that the droplet collection efficiency and ice density at the stagnation point remained unchanged with the change of ice shape, and thus the mass flux of liquid water collected can be calculated as follows:
The ice thickness at the stagnation point can be expressed as
By integrating the above formulas, the following relation can be obtained:
where the ice density is constant, the ice thickness and icing time can be measured in the experiment, and the far field velocity can be calculated by rotation speed and blade radius. It can be seen that the relationship between ice thickness and LWC is monotonic, and the average LWC in the icing process can be obtained by programming. According to [15,16,20], the measurement results of LWC and MVD have uncertainty, and the error is less than 15% in most cases. In the current situation, this uncertainty is difficult to solve effectively.
2.3. Rotor System
As shown in Figure 4, the blade diameter was 85 cm and chord length was 5 cm. The blade section was NACA0012 airfoil and the blade shape was rectangular without torsion. The blade materials included steel and composite material, and the number of blades on the rotor was four. As shown in Figure 5, the blade and rotating mechanism were driven by an alternating current motor. During the experiment, the rotation speed was controlled by adjusting the motor frequency. In order to accurately obtain the rotation speed, we installed a Hall switch element on the blade hub to measure the rotation speed.
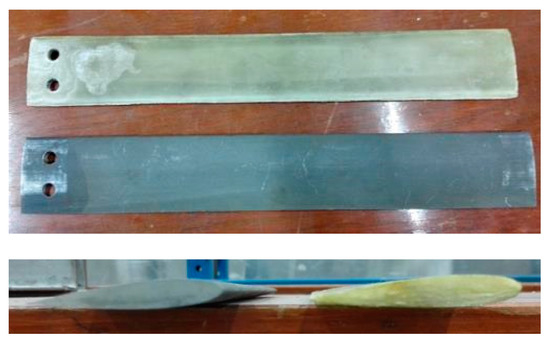
Figure 4.
Geometry of rotor blade, including different materials.
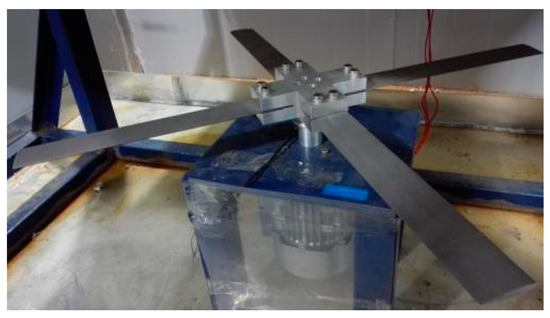
Figure 5.
Rotating mechanism with rotor blades installed.
3. Experimental Results and Analysis
After the rotor icing experimental platform was built, the rotor icing experiment can be carried out according to the experimental process. The main process of the experiment was as follows: first, the motor was turned on and the rotation speed was adjusted to the preset value. The environmental chamber was closed and the control valve of liquid nitrogen was opened to make the temperature inside the environmental chamber reach the icing temperature. The spray system was opened and the air pressure and water pressure of the nozzles were regulated to ensure the diameter of the spray droplets. At the same time, liquid nitrogen delivery capacity was adjusted to keep the temperature in the environmental chamber constant. After the icing process was completed, the control valve of spray system and the motor were closed, and the ice shapes of the rotor blade were recorded. Finally, the refrigeration system was shut down.
After obtaining the photos of rotor icing, we traced the ice profiles by hand. On the basis of the size of the rotor blade shape, we could determine the original coordinate system. According to the relative position of ice shapes and blade profile, we could record the different points. By connecting these data points, we could obtain the ice shapes. One of the rotor icing characteristics is that the ice shapes of each rotor blade are the same under the same condition. Therefore, the ice shapes of one blade are shown in this paper.
In order to study the influence of flight conditions, environmental parameters, and other conditions on ice shapes of a rotor blade, we designed different icing experimental cases and carried out related icing experiments. The parameters such as rotation speed, LWC, icing temperature, and icing time were changed, and the effects of blade number and blade material on icing were explored. The experimental conditions are shown in Table 1. At the end of the experiments, the effects of different parameters on icing were obtained by comparing the shape and overall trend of rotor blade icing.

Table 1.
Icing experimental conditions.
3.1. Basic Rules of Rotor Blade Icing
In this paper, icing experiments under various conditions were carried out. Although the different experimental conditions led to change of the ice shapes, a large number of experimental results showed that there were some general rules for the icing of rotor blades. As an example, in Figure 6 it can be seen that icing mainly occurred in the leading edge of the rotor blade, which was similar to that of the fixed wing. However, the distribution of ice thickness on the surface of the rotor blade was different from the fixed wing. The ice shapes of the fixed wing with no swept angle were almost the same, while that of rotor blades varied with different section positions. The ice thickness increased with the increase of distance from the rotor hub. When the icing position was close to the blade root, the amount of ice was small, and sometimes even no icing occurred. This was because the relationship between the linear velocity and the blade spanwise length is linear. The closer the position to the blade tip, the more liquid water collects on the surface per unit time, and the greater the icing content. Therefore, in the design of anti-icing and de-icing systems, the heat load demand increases with the increase of blade spanwise position.
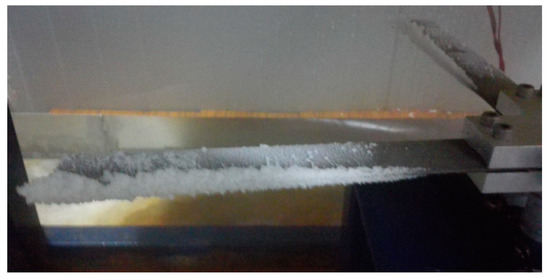
Figure 6.
Ice shape of rotor blade.
At the same time, it can also be seen that there was ice formation at the blade tip beyond the blade span. This was because the surface liquid water flowed along the spanwise direction under the action of centrifugal force in the icing process, resulting in ice formation along the spanwise direction. There were more droplets impinging on the icing surface, which led to further ice formation. There was a part of pinnate ice behind the blade, and its direction was pointing to the blade tip, which showed the effect of centrifugal force on icing process during the rotation. Although the ice behind the blade had little effect on the aerodynamic shape, the increase of surface roughness would also lead to the decrease of aerodynamic characteristics.
3.2. Effect of Icing Temperature on Ice Shape
In order to study the effect of icing temperature on rotor blade icing, we compared the experimental results of cases 1, 2, and 3. Figure 7 shows the ice shapes under cases 1, 2, and 3. It can be seen that different icing temperatures led to different ice types. Figure 7b shows the ice shape at −5 °C. This is known as glaze ice, and the ice shape was typical horn ice. The amount of ice near the stagnation point was relatively small, while the icing on the upper and lower sides was thicker. This was because when the icing temperature is high, the liquid water collected on the blade surface flows to upper and lower sides under the action of surrounding airflow and freezes gradually. The ice shape at −15 °C is shown in Figure 7c. The icing mainly accumulated near the leading edge, and the ice thickness was the largest near the stagnation point. This was a case of rime ice, which is white and opaque in appearance. The droplets froze rapidly after impacting on the surface, and there was no liquid water flowing on the surface. Figure 7a shows the rotor icing at −10 °C. Although icing also occurred near the leading edge, it was more transparent in terms of its appearance. This ice type has the common characteristics of glaze ice and rime ice, and is known as mixed ice. It can be seen that the trend of experimental results was the same as the theoretical analysis, which indicates that there are different ice types in rotor blade icing under different temperature conditions, which should be considered in the design of rotor anti-icing and de-icing systems.
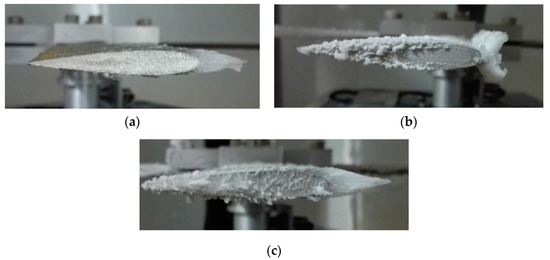
Figure 7.
Ice shapes under different icing temperatures: (a) case 1: icing temperature was −10 °C, mixed ice; (b) case 2: icing temperature was −5 °C, glaze ice; (c) case 3: icing temperature was −15 °C, rime ice.
3.3. Effect of Rotation Speed on Ice Shape
The experimental results of cases 4, 5, and 6 were compared to study the effect of rotation speed on blade icing. In Figure 8, the experimental results under three conditions are given, and the comparison of ice shapes is shown in Figure 9. It can be seen that under the conditions of similar LWC, with the gradual increase of rotation speed, the ice thickness at the leading edge of the blade increased. This was because the increase of rotation speed led to the increase of linear velocity at the same position of the blade, and the number of droplets impacting on the surface increased in unit time. At the same time, the impact velocity of droplets had a corresponding growth relationship with the droplet collection efficiency. Therefore, the amount of ice increased with the increase of rotation speed.
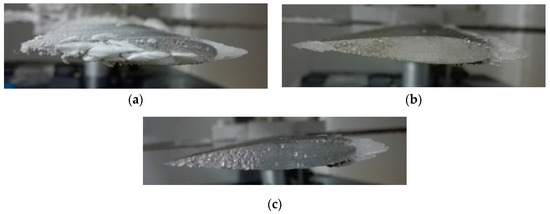
Figure 8.
Ice shapes under different rotation speeds: (a) case 4, rotation speed was 450 Revolutions Per Minute (RPM); (b) case 5, rotation speed was 600 RPM; (c) case 6, rotation speed was 750 RPM.
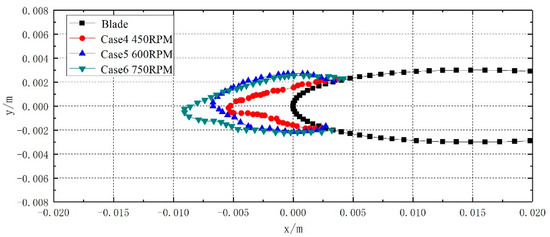
Figure 9.
Comparison of ice shapes under different rotation speeds.
3.4. Effect of LWC on Ice Shape
The change of LWC had an obvious influence on the amount of ice. The ice shapes of cases 1 and 4 were compared, as shown in Figure 10. The result showed that with the increase of LWC, the amount of ice also increased. This was because the increase of LWC led to the increase of the mass of collected water and frozen ice at the same time. From a quantitative point of view, the amount of ice was almost proportional to the LWC under different conditions. Therefore, the most severe icing conditions with the most LWC should be considered in the design of an ice protection system to ensure the effectiveness of the system.
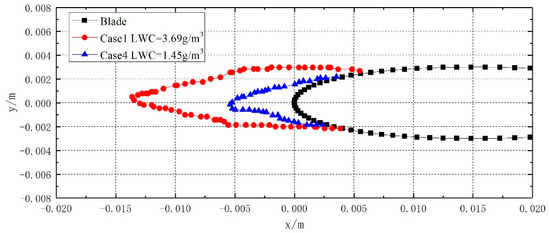
Figure 10.
Comparison of ice shapes under different liquid water content (LWC).
3.5. Effect of Icing Time on Ice Shape
The icing experiments were carried out under cases 1 and 7, including different icing times. The icing times were 3 min and 6 min, respectively, and the comparison of ice shape is shown in Figure 11. With the increase of icing time, the ice shape and ice thickness increased. When the icing time was longer, the ice thickness of the upper and lower sides changed little, but the ice thickness of the stagnation point clearly increased. This may have been due to the change of the original blade shape by icing, resulting in the change of droplet impingement area and icing range. For the iced rotor blade, the ice thickness near the stagnation point of the leading edge increased, while the droplets collected on the upper and lower sides decreased. The liquid water on the surface flow may have been affected by gravity, and thus there was more liquid water flowing along the lower surface, resulting in the ice thickness of the lower surface being greater than the upper surface, as shown in Figure 11. This also explained how it was necessary to use a multi-time step method to simulate rotor icing in numerical calculations. In the multi-time step method, the changes of air flow field, droplet field, and icing rate can be considered during the process of ice accretion, and the icing can be simulated more accurately.
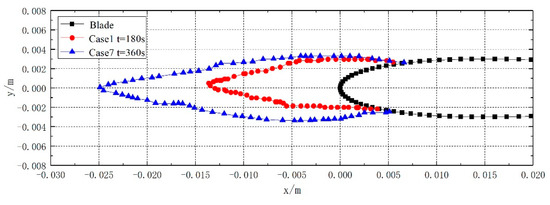
Figure 11.
Comparison of ice shapes under different icing times.
3.6. Effect of Blade Number on Ice Shape
The number of main rotor blades of different helicopters is not the same. In order to study the influence of blade number on rotor icing, we selected experimental cases 1 and 8 for comparison. Both four blades and two blades were used in the experiment. Figure 12 shows the ice shapes in the experiment, and Figure 13 shows the comparison of the ice shapes. It can be seen from the results that the blade number had little effect on the ice shape. This was because the Mach number at the blade tip was relatively small in the experiment. At this time, the blade number had a certain influence on the airflow field and droplet field, but the influence range was relatively small. As a result, the droplet impingement characteristics and icing characteristics had little change. A similar conclusion was obtained in our previous papers on numerical simulation analysis of rotor icing [21]. Therein, in the low-speed rotor icing experiment, the blade number had little effect on the ice shape.
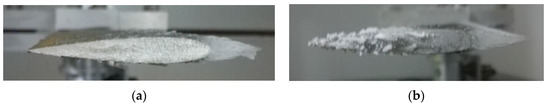
Figure 12.
Ice shapes under different blade numbers: (a) case 1, four blades; (b) case 8, two blades.

Figure 13.
Comparison of ice shapes under different blade numbers.
3.7. Effect of Blade Material on Ice Shape
In experiments, different materials are often used to make rotor blades. In this paper, the influence of blade materials on the ice shape was studied. In order to ensure the same icing conditions, we installed two blades of steel and composite material on the rotating mechanism, which were cross-distributed, as shown in Figure 14. The experiment was carried out under case 9. The icing situation of rotor blade is shown in Figure 15, and the comparison of ice shape is given in Figure 16. It can be seen that the icing of rotor blades of different materials was similar. For the whole rotor blade, there was more ice at the tip and less at the root. The overflow liquid water was frozen into ice at the blade tip, and its shape was similar. The ice shapes on the cross-section were almost the same, and the ice thickness and icing range were not different, which indicated that the influence of blade material on icing was relatively small. This was because the blade material had a certain influence on the ice accretion at the initial time, but the ice accretion in the subsequent time gradually increased on the basis of the ice accretion at the initial time. The influence of material on icing process was gradually weakened. Therefore, the material properties may have had little effect on the ice shape. However, the chord length was small and the Mach number of the blade tip was low in this experiment, and thus the liquid water flow may not have been significant. More large-scale experiments can be carried out to verify the conjecture in this paper.
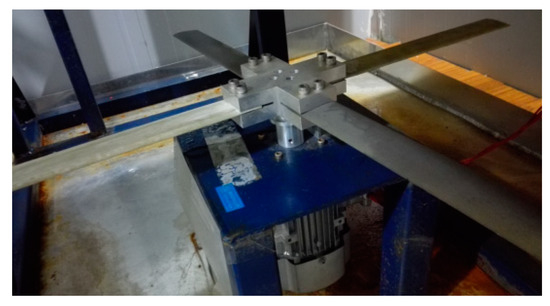
Figure 14.
Blade distribution of different materials.
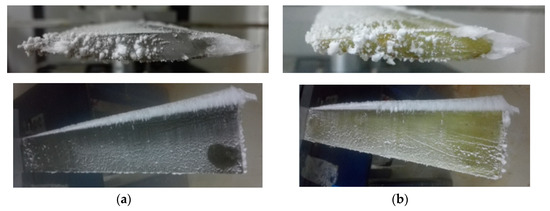
Figure 15.
Ice shapes under different blade materials: (a) steel material; (b) composite material.
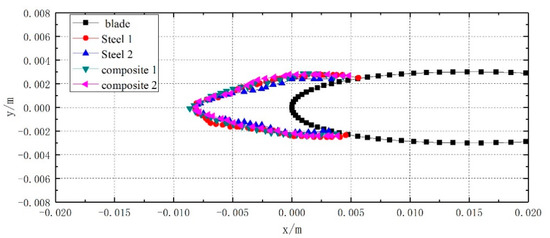
Figure 16.
Comparison of ice shapes under different blade materials.
4. Conclusions
The effects of different parameters on the ice shapes of rotor blade were studied in this paper. An icing experimental platform for rotor blades was built in a cold chamber. The components of the experimental platform and the measurement method of related parameters were introduced. The icing experiments of rotor blade under different conditions were carried out, and the change rules of rotor blade icing under different parameters were analyzed. The main conclusions of the experiments are as follows:
- (1)
- The icing phenomenon of a rotor blade mainly occurred at the leading edge. It was observed that the amount of ice increased with the increase of blade spanwise length.
- (2)
- The icing temperature had a great influence on the ice type. When the temperature was high, glaze ice accumulated, and at a low temperature, rime ice accumulated.
- (3)
- With an increase of LWC, rotation speed, and icing time, the ice thickness of the leading edge of rotor blade increased.
- (4)
- Under the condition of low rotation speed and small rotor size used in this paper, the blade number had little effect on the ice shapes.
- (5)
- At the scale of the rotor model in this paper, the effect of blade material on ice accretion can be ignored.
The research content of this paper can provide the basis for de-icing system design conditions and provide reference for the protection range of anti-icing and de-icing systems of rotating machinery such as helicopter and wind turbine.
The experiments in this paper were limited by the experimental conditions, and thus the rotor size and the range of experimental parameters were small. In the future, icing experiments of different large-scale high-speed rotors can be carried out to verify the correctness of the expansion of conclusions.
Author Contributions
Methodology, C.Z.; experiment and analysis, Z.W.; writing—original draft preparation, Z.W.; writing—review and editing, N.Z.; funding acquisition, Z.W. All authors have read and agreed to the published version of the manuscript.
Funding
This research was funded by the National Natural Science Foundation of China (grant no. 51806105), the Natural Science Foundation of Jiangsu Province (grant no. BK20180442), and Open Fund of Rotor Aerodynamics Key Laboratory (grant no. RAL20190401).
Conflicts of Interest
The authors declare no conflict of interest.
References
- Korkan, K.D.; Dadone, L.; Shaw, R.J. Performance degradation of helicopter rotor in forward flight due to ice. J. Aircraft. 1985, 22, 713–718. [Google Scholar] [CrossRef]
- Coffman, H.J. Helicopter rotor icing protection methods. J. Am. Helicopter Soc. 1985, 32, 34–39. [Google Scholar] [CrossRef]
- Zhao, G.Q.; Zhao, Q.J.; Chen, X. New 3-D ice accretion method of hovering rotor including effects of centrifugal force. Aerosp. Sci. Technol. 2016, 48, 122–130. [Google Scholar] [CrossRef]
- Chen, X.; Zhao, Q.J. Numerical simulations for ice accretion on rotors using new three-dimensional icing model. J. Aircr. 2017, 54, 1428–1442. [Google Scholar] [CrossRef]
- Simpson, M.P.; Render, P.M. Certification and operation of helicopters in icing environments. J. Aircr. 1998, 35, 936–941. [Google Scholar] [CrossRef]
- Simpson, M.P.; Render, P.M. Investigation into the Effectiveness of Certification and Operational Icing Procedures for Helicopters; AIAA-98-0750; AIAA: Reno, NV, USA, 1998. [Google Scholar] [CrossRef]
- Belte, D. In-flight Ice Accretion Characteristics of Rotor Blade Airfoil Sections; AIAA-1987-176; AIAA: Reno, NV, USA, 1987. [Google Scholar] [CrossRef]
- Fortin, G.; Perron, J. Spinning Rotor Blade Tests in Icing Wind Tunnel; AIAA-2009-4260; AIAA: Reno, NV, USA, 2009. [Google Scholar] [CrossRef]
- Britton, R.K.; Bond, T.H.; Flemming, R.J. An Overview of a Model Rotor Icing Test in the NASA Lewis Icing Research Tunnel; AIAA-1994-716; AIAA: Reno, NV, USA, 1994. [Google Scholar] [CrossRef]
- Bell, D. Icing at the McKinley Climatic Laboratory; AIAA-2004-735; AIAA: Reno, NV, USA, 2004. [Google Scholar] [CrossRef]
- Flemming, R.J.; Alldridge, P.; Doeppner, R. Artificial Icing Tests of the S-92A Helicopter in the McKinley Climatic Laboratory; AIAA-2004-737; AIAA: Reno, NV, USA, 2004. [Google Scholar] [CrossRef]
- Shaw, R.J.; Richter, G.P. The UH-1H Helicopter Icing Flight Test Program: An Overview; AIAA-885-338; AIAA: Reno, NV, USA, 1985. [Google Scholar] [CrossRef]
- Guffond, D. Icing and De-icing tTest on a 1/4 Scale Rotor in the ONERA S1MA Wind Tunnel; AIAA-86-0480; AIAA: Reno, NV, USA, 1986. [Google Scholar] [CrossRef]
- Tsao, J.C.; Kreeger, R. Further Evaluation of Scaling Methods for Rotorcraft Icing; NASA/TM-2012-217418; NASA: Washington, DC, USA, 2012. [Google Scholar] [CrossRef]
- Palacios, J.L.; Han, Y.Q.; Brouwers, E.W.; Smith, E.C. Icing environment rotor test stand liquid water content measurement procedures and ice shape correlation. J. Am. Helicopter Soc. 2012, 57, 29–40. [Google Scholar] [CrossRef]
- Han, Y.Q.; Palacios, J.L.; Schmitz, S. Scaled ice accretion experiments on a rotating wind turbine blade. J. Wind Eng. Ind. Aerodyn. 2012, 109, 55–67. [Google Scholar] [CrossRef]
- Li, Y.; Tagawa, K.; Feng, F.; Li, Q.; He, Q.B. A wind tunnel experimental study of icing on wind turbine blade airfoil. Energy Convers. Manag. 2014, 85, 591–595. [Google Scholar] [CrossRef]
- Shu, L.C.; Li, H.T.; Hu, Q.; Jiang, X.L.; Qiu, G.; Mcclure, G.; Yang, H. Study of ice accretion feature and power characteristics of wind turbines at natural icing environment. Cold Reg. Sci. Technol. 2018, 147, 45–54. [Google Scholar] [CrossRef]
- Wang, Z.Z.; Zhao, N.; Zhu, C.L. Numerical simulation for three-dimensional rotor icing in forward flight. Adv. Mech. Eng. 2018, 10, 1–12. [Google Scholar] [CrossRef]
- Anderson, D.; Tsao, J. Evaluation and Validation of the Messinger Freezing Fraction; AIAA 2003-1218; AIAA: Reno, NV, USA, 2003. [Google Scholar] [CrossRef]
- Wang, Z.Z.; Zhu, C.L. Numerical simulation of three-dimensional rotor icing in hovering flight. Proc. Inst. Mech. Eng. Part G J. Aerosp. Eng. 2016, 232, 545–555. [Google Scholar] [CrossRef]
© 2020 by the authors. Licensee MDPI, Basel, Switzerland. This article is an open access article distributed under the terms and conditions of the Creative Commons Attribution (CC BY) license (http://creativecommons.org/licenses/by/4.0/).