Semantic Traffic Sensor Data: The TRAFAIR Experience

 ,
,  ,
,  ,
,  and
and 
Abstract
1. Introduction
2. Related Work
2.1. Sharing Smart City Traffic Data
2.2. Analysis of Traffic-Related Ontologies
- The Vocabulary to Represent Data About Traffic Ontology [23], developed by Óscar Corcho (a member of the Ontology Engineering Group at the Polytechnic University of Madrid) has been proposed for the representation of the situation of traffic in a city. It extends the Sensor Network Ontology (SSN) [24,25,26] to represent the intensity of traffic on the different road segments of a city. It represents road segments (concept escjr:TramoVia), traffic observations (concept estrf:TrafficObservation, which for the moment is specialized only in the subconcept estrf:TrafficIntensityObservation, but other subconcepts could be added in the future to represent other types of traffic observations), the sensor or sensing system used to obtain a given measurement (concept estrf:TrafficIntensitySensor, which is considered optional), the result of an observation (concept TrafficIntensitySensorOutput, which has a value-concept estrf:TrafficIntensityObservationValue, linked to TrafficIntensitySensorOutput through the property ssn:hasValue and is produced by a specific sensor or sensing system identified by a specific URI and linked to TrafficIntensitySensorOutput through the property ssn:isProducedBy), and finally an instance estrf:TrafficIntensity that represents the type of property being measured (in this case, the intensity of the traffic).This vocabulary is still work in progress, developed in the context of the working group on transport of AENOR [27]. The authors recommend using this vocabulary in conjunction with the vocabulary proposed to represent city road maps (particularly, road segments) [28]. This proposal does not currently contemplate the modeling of traffic properties other than traffic intensities (estrf:TrafficIntensityObservation), but they can be easily added by extending estrf:TrafficObservation.
- The work presented in [29] presents an ontology-driven architecture that enables performing several automatic tasks to increase traffic safety and improve the comfort of the drivers. The ontology layer is described as composed of three groups of interrelated concepts: concepts related to vehicles, concepts related to roads, and concepts related to sensors. The concepts related to vehicles describe a taxonomy of vehicles of different types, including commercial vehicles, public vehicles (buses and taxis), private vehicles (cars, bicycles, and motorbikes) and priority vehicles (ambulances, police cars, and fire trucks), and also allow representing information about their routes and locations. The concepts related to the infrastructure include a taxonomy of different types of roads (local roads, prefectural roads, national highways, and national expressways), as well as the representation of other parts of the infrastructure, such as the road segments, traffic lights and traffic signs, lanes, road markings (e.g., painted arrows), and other infrastructure elements (tunnels, parkings, roundabouts, bridges, gas stations, and toll stations). Finally, the concepts related to sensors are based on the use of the SSN ontology. Besides, a mapping schema is proposed to map the sensor data to semantic data, as in [30], in such a way that the sensor data can be automatically represented as instances of the SSN ontology; the property observed is Car_flow property.This is a relevant work that proposes an ontological layer covering different aspects of traffic. Still, it mainly focuses on the development of an architecture that exploits such a layer to perform various actions through an agent layer. Some use case scenarios are presented: regulating the air conditioning of a car, traffic light adjustment based on the traffic flow and the weather conditions, and traffic congestion control for GPS navigators. Regarding the representation of traffic sensor data, the focus is only on the traffic flow, and, rather than proposing a new ontology or extending an existing one, the SSN ontology is directly adopted.
- The Open511 specification [31] has been proposed as an open format for publishing road event data. Information about the road events can be provided by publishing an XML file or by allowing access to the data through a dynamic API. It supports representing elements such as events and geographic areas (places represented in GeoNames [32,33]); examples of events are constructions, special events (such as the celebration of a sport event), incidents (including accidents and other unexpected events), weather conditions, and road conditions (such as snow, ice, or fire on the road).This work currently covers event data rather than traffic information. Nevertheless, some additional resources have also been proposed (currently as drafts that may be included in the Open511 specification in the future) to represent average historical speeds and the current speed of road segments.
- The Road Accident Ontology [34] focuses on the representation of information about accidents (vehicles affected, location of the accident) and the parties involved (persons involved in the accident and their insurance companies). This proposal is a draft, submitted by Daniel Dardailler for the W3C Geek Week celebrated in July 2012.This ontology does not represent traffic, but we have included it because accidents can affect traffic and even lead to traffic jams.
- As another work focusing on accidents, the work in [35] proposes a lightweight Car Accident Ontology for VANETs (CAOVA), that includes information about vehicles, accidents, occupants and the environment. The goal is to facilitate information about an accident to emergency vehicles.
- It is also relevant to mention the Transportation Planning Suite of Ontologies (TPSO) [36], which is a set of ontologies proposed for transportation planning. More specifically, eight ontologies are proposed to cover concepts related to time, meteorology, spatial locations, units of measure, changes, activities, recurring events, resources, and observations. Among these, we can highlight here the Observation Ontology [37], which reuses the SSN Ontology to capture the concepts related to sensors, but also extends it by adding a few classes and properties for the organization of terms. Specific traffic properties (such as the traffic flow or speed) are not explicitly modeled in the proposed ontology.
- The KM4City [38] is an ontology for smart cities developed by the University of Florence (Italy) as a support for a platform that collects and integrates data related to the Tuscany region in Italy. It includes concepts regarding streets (Road, Node, RoadElement, AdministrativeRoad, Milestone, StreetNumber, RoadLink, Junction, Entry, EntryRule, Maneuver, Lanes, and Restriction), local public transportation (Ride, Route, RouteSection, BusStop, etc.), and sensors of traffic and different types of events (e.g., SensorSite, TrafficObservation, TrafficSpeed, TrafficConcentration, TrafficHeadway, etc.).
- Finally, some ontologies support modeling energy consumption data. Although they are not explicitly focused on traffic, they could be used as an input for traffic estimation. On the one hand, the Smart Appliances REFerence (SAREF) ontology [39] allows the representation of information related to devices (e.g., a washing machine, a temperature sensor, etc.) in a smart appliances domain as well as their functions and profiles (e.g., for energy optimization). On the other hand, the FIEMSER ontology [40] models the organization of building spaces (using concepts such as Building, BuildingPartition, BuildingSpace, and BuildingZone) and the devices used in the building (defining concepts such as Device, HomeEquipment, ControlledDevice, and also more specific types such as Boiler and Radiator). Based on data provided by smart appliances, it could be possible to estimate the occupancy levels in households and buildings and thus indirectly estimate information about the traffic of vehicles outside (e.g., expected traffic variations along the day).
3. Traffic Modelling in TRAFAIR
3.1. Scope and Purpose of the TRAFAIR Project
- The provision of real-time estimations of air pollution in a city on an urban scale. For this purpose, low-cost air quality sensors are deployed, combining their measures with measures provided by official air quality stations to build informative maps of the different levels of pollution in different urban areas.
- The development of a service to predict the urban air quality based on meteorological prediction and traffic flow, using High-Performance Computing (HPC) technologies to estimate the dissemination of pollutants. A traffic flow model is used to simulate new circulation hypothesis (e.g., changes regarding the types of vehicles and their proportions in the float of vehicles in the city, increments in the number of low-emission vehicles used, the definition of areas with restricted circulation in a city, etc.) and their impact on the air quality.
- The publication, in catalogs collected by the European Data Portal, of open datasets describing urban air quality maps of six European cities of diverse size where the service will be deployed: Zaragoza (Spain), with about 600,000 inhabitants, Florence (Italy), with about 382,000 inhabitants, Modena (Italy), with about 185,000 inhabitants, Livorno (Italy), with about 160,000 inhabitants, Santiago de Compostela (Spain), with about 95,000 inhabitants, and Pisa (Italy), with about 90,000 inhabitants.
3.2. Modeling of Data Provided by Traffic Sensors
3.2.1. Traffic Sensors in Two Representative Cities
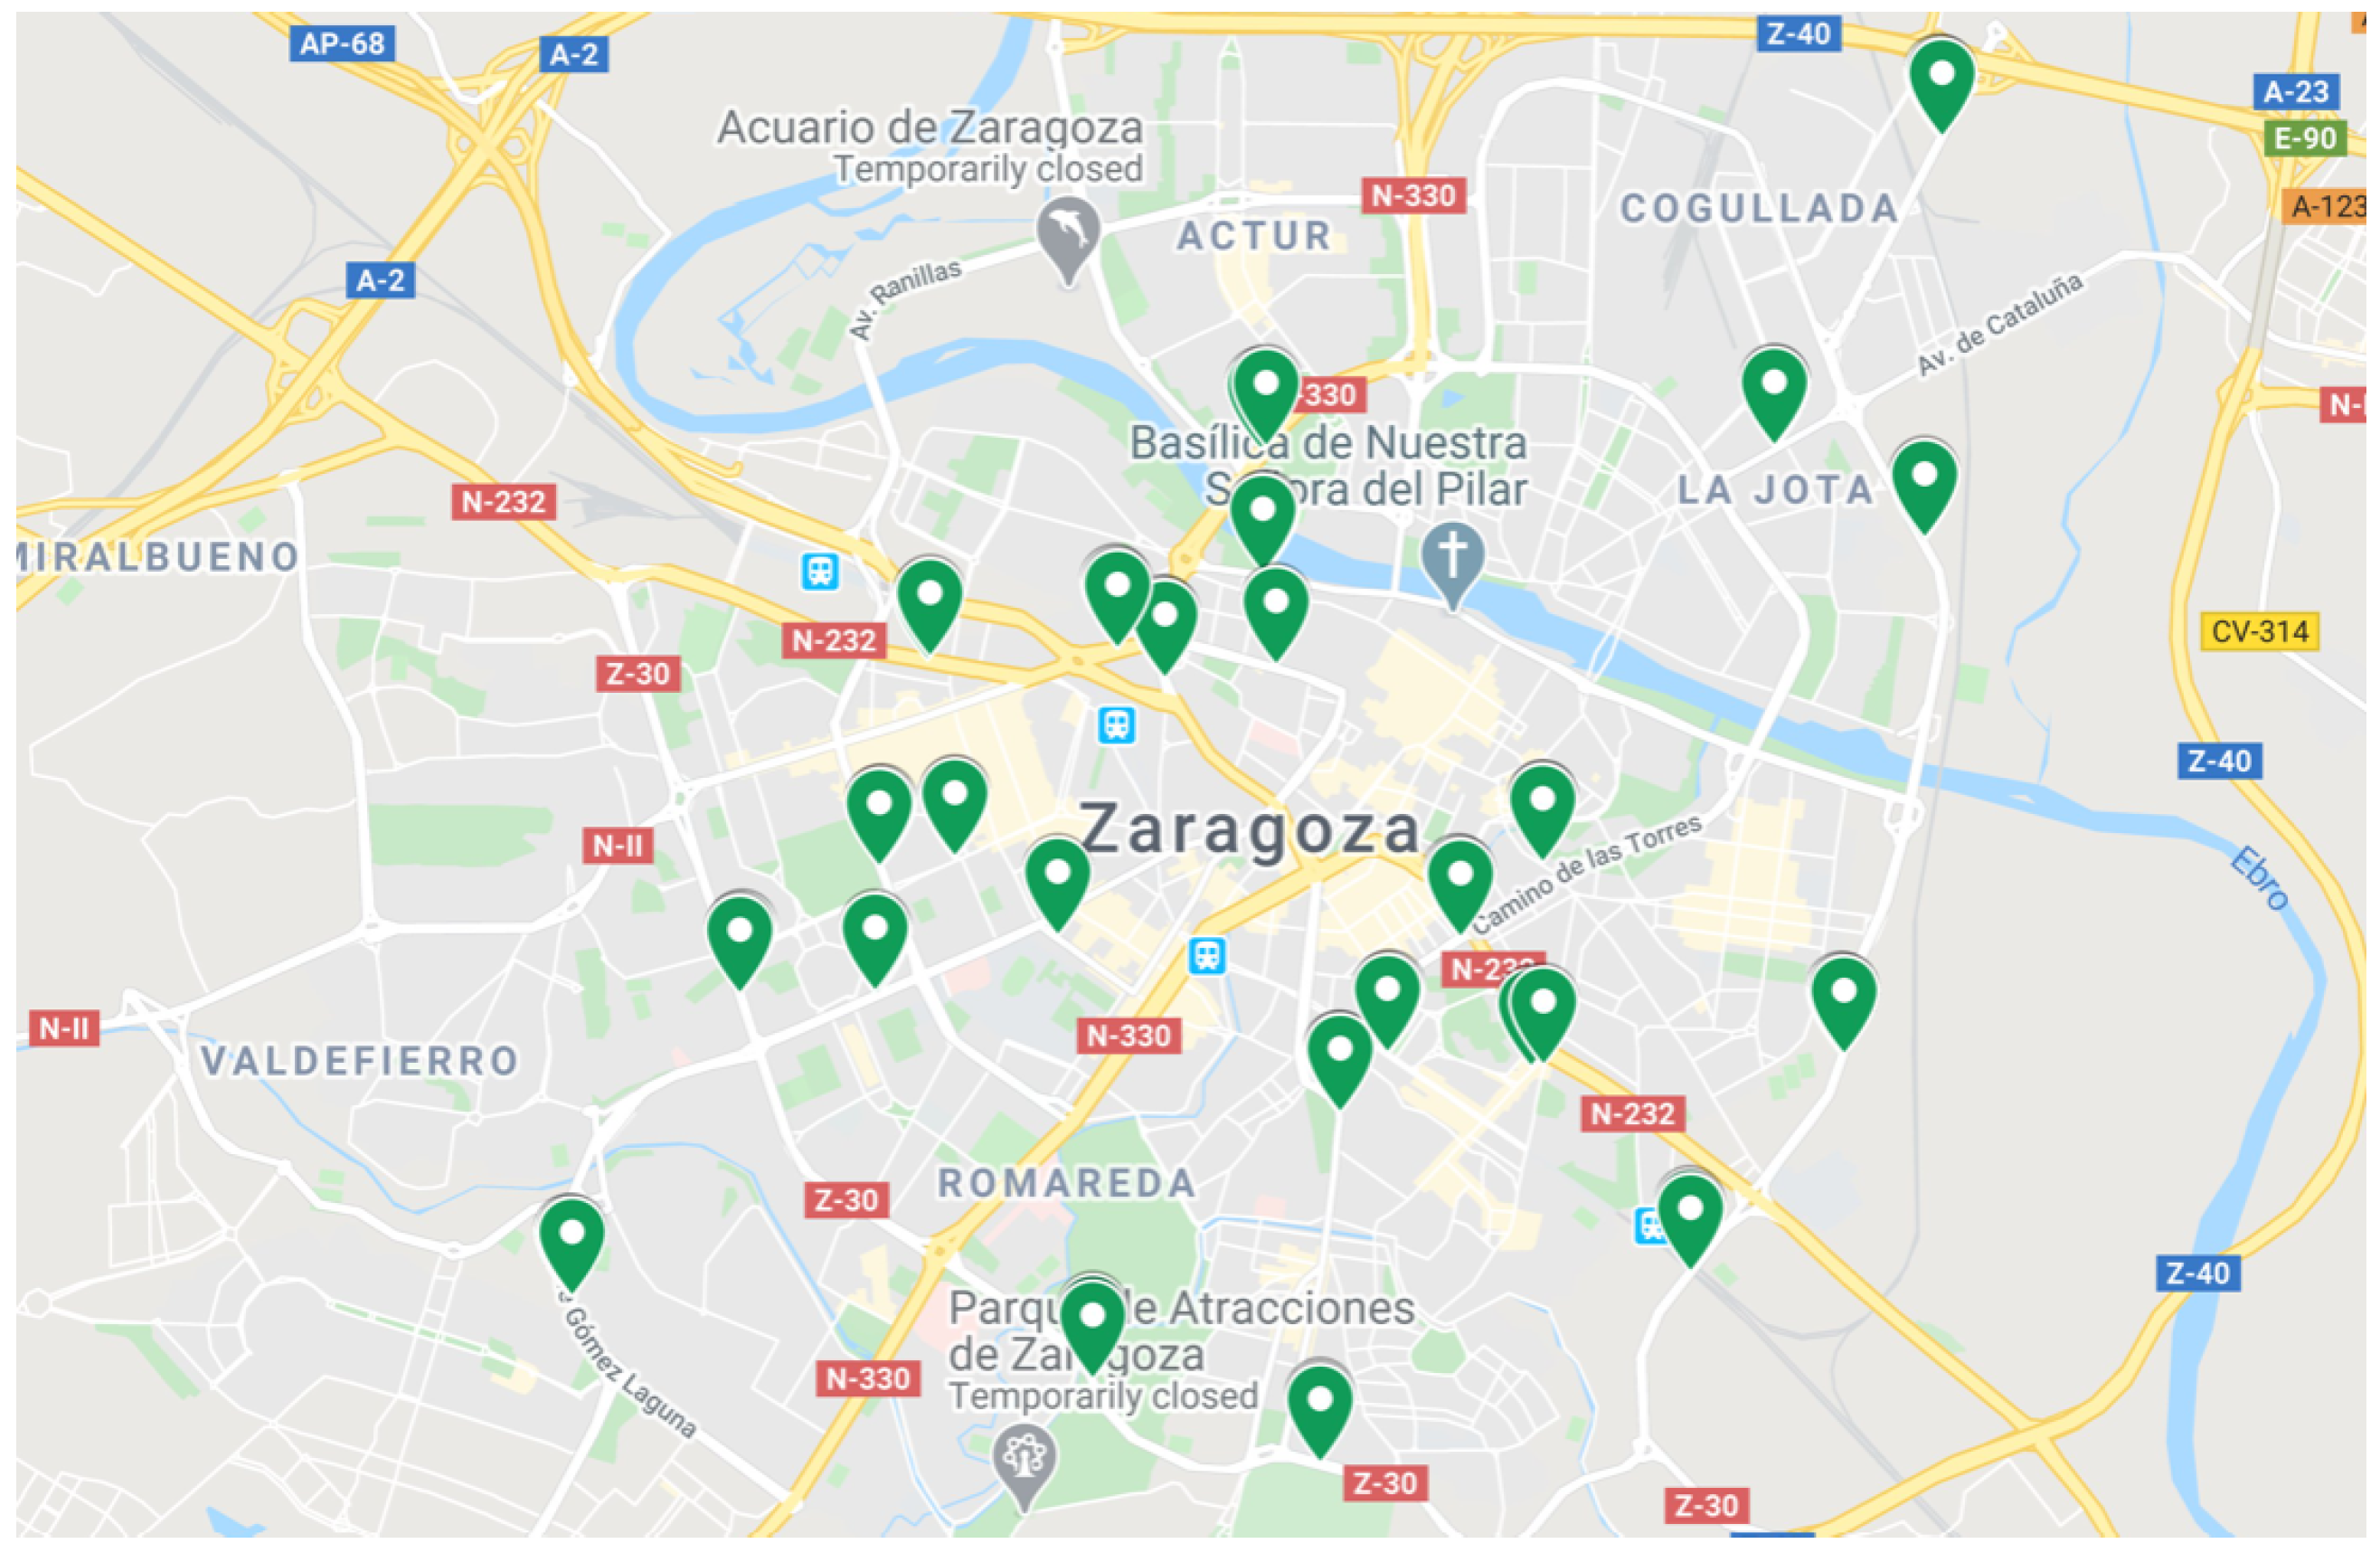
- Traffic static devices, which are 46 devices installed in different positions of the city of Zaragoza. More specifically, they are inductive coils located under the asphalt. These devices provide data about the traffic for 24 h a day for all the days in a year. Usually, there are two devices on the same road, one for each direction of circulation. However, in a few exceptions (specifically, for two cases), there is only one device measuring the traffic in just one direction. In Figure 2, a representation of the positions of these sensors is provided (shown with green markers).
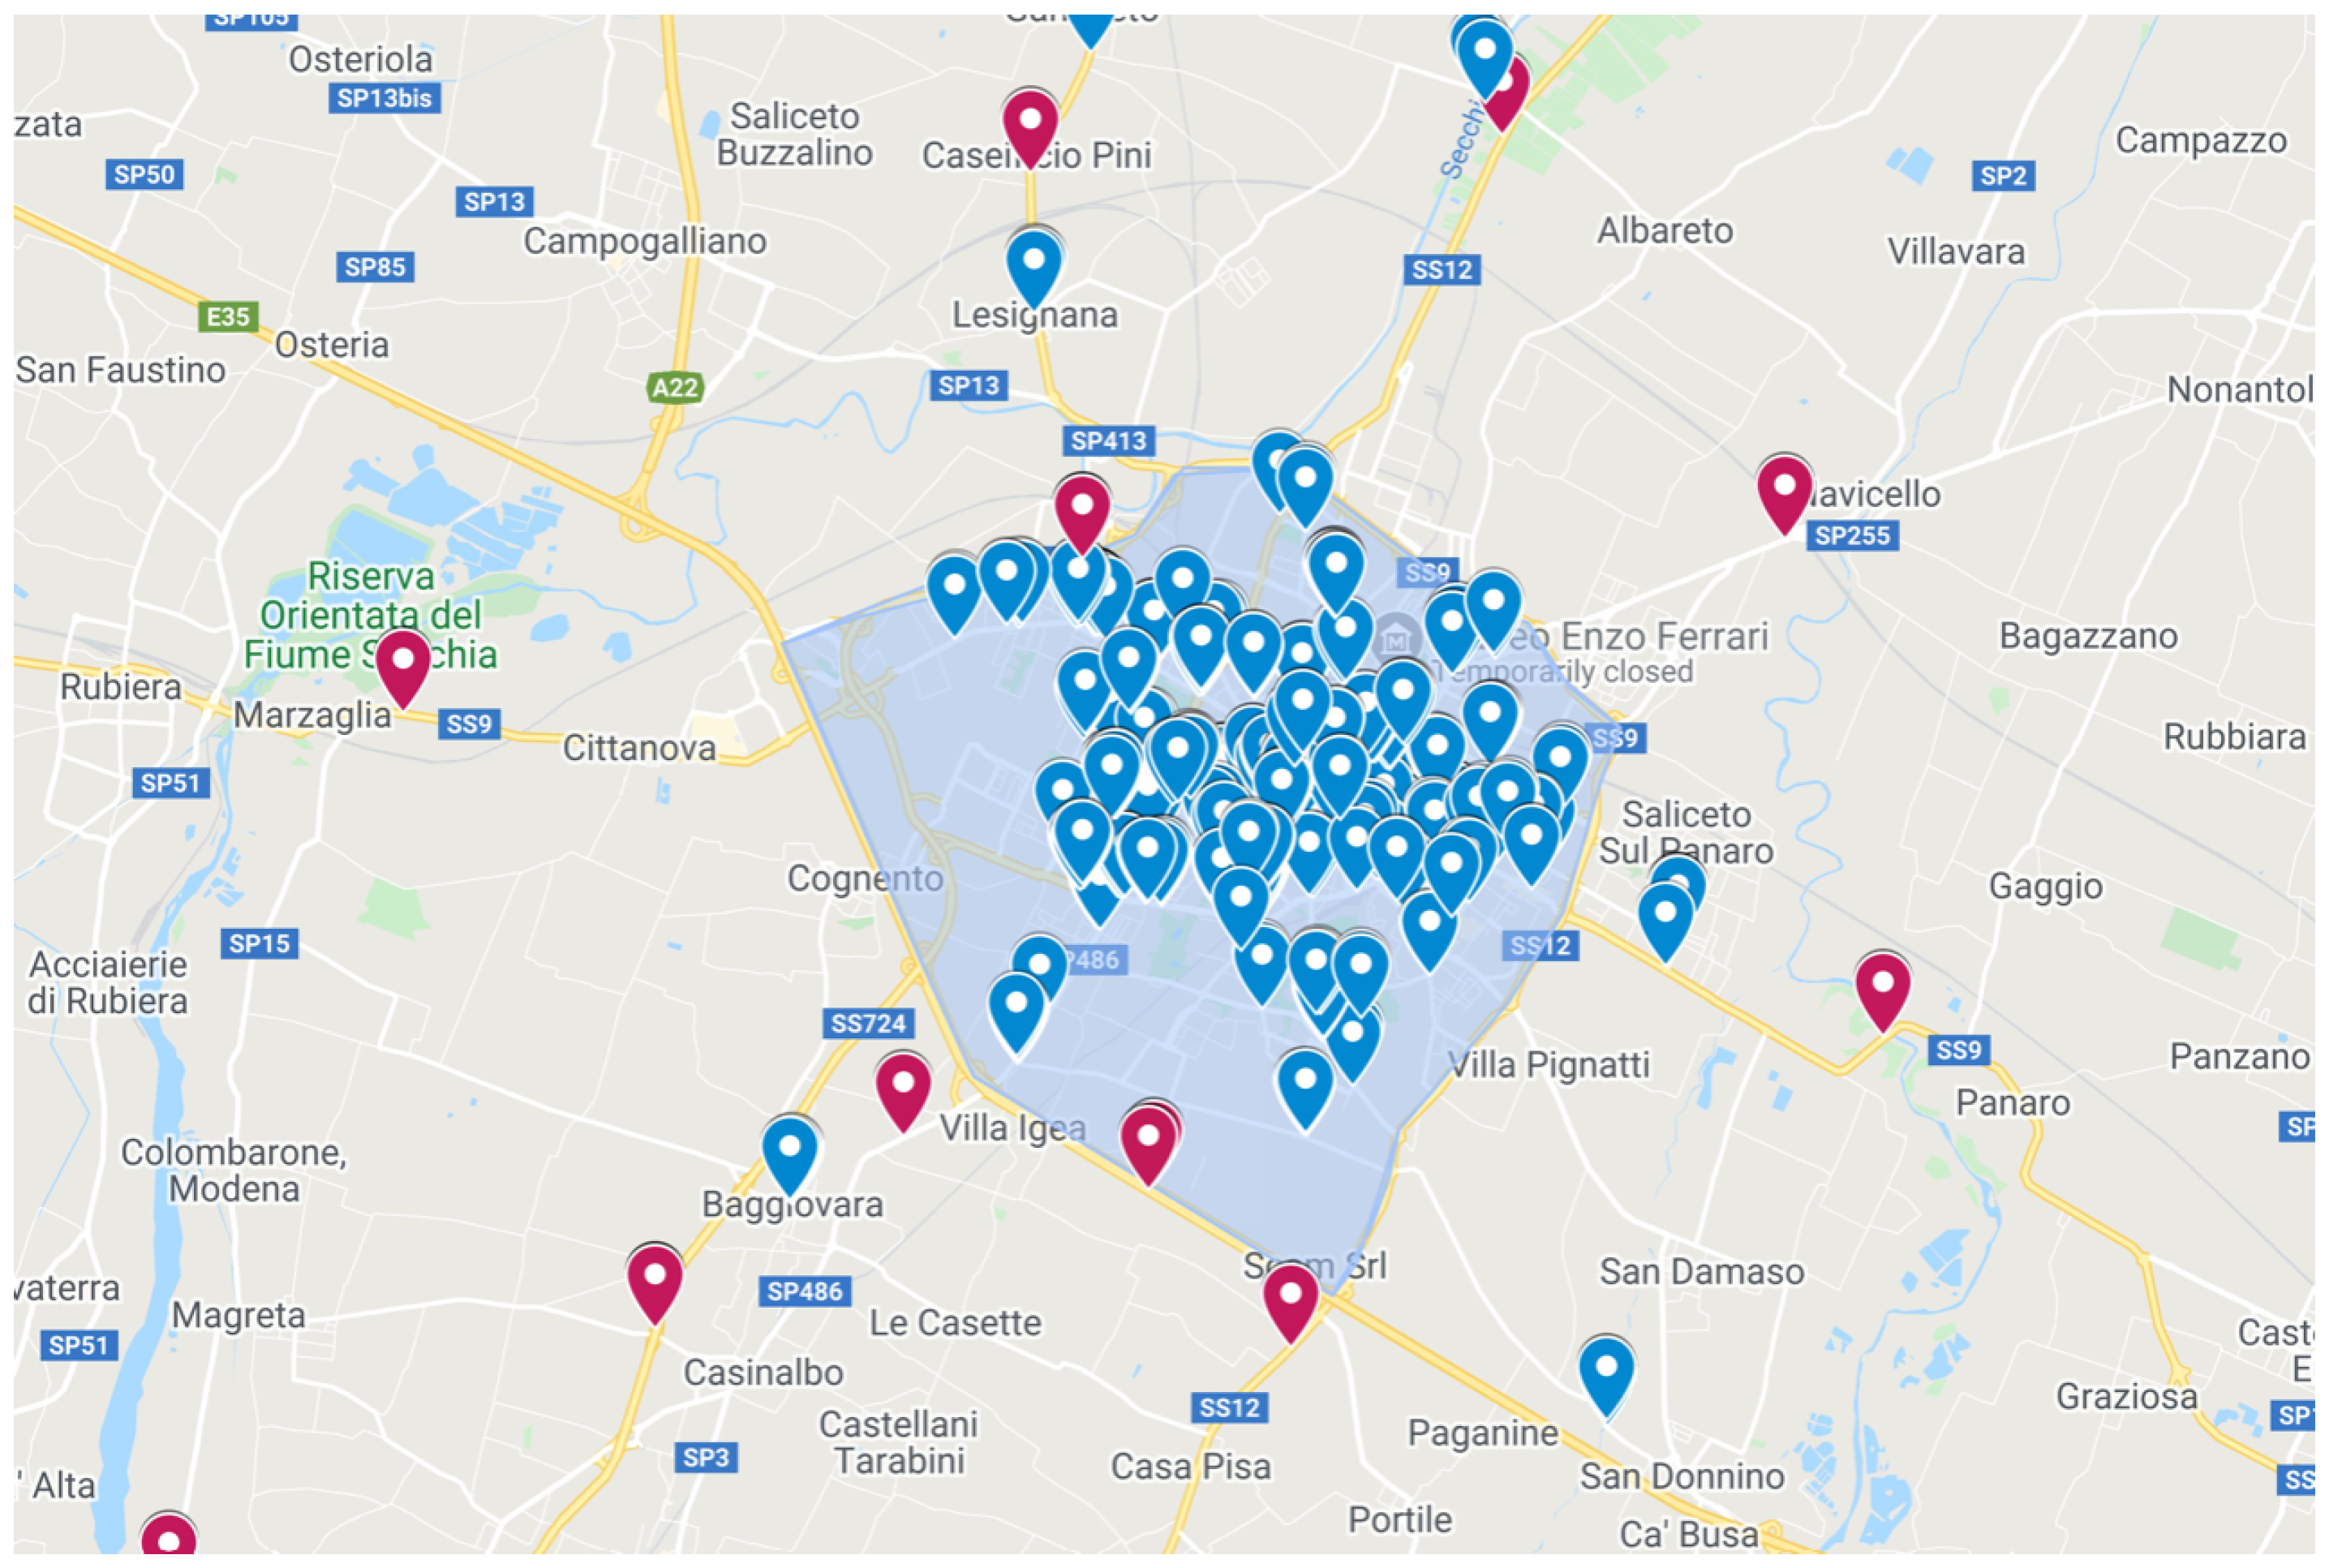
- Traffic mobile devices, which are mobile traffic-detecting devices installed in 594 different points of the city throughout the year. Usually, there are also two devices on the same traffic road (one for each direction of circulation), as it is also the case for static devices. With these devices, data about the traffic measured during 24 h can be obtained (usually during only one or two days in a year, as these devices are located at fixed positions only for a few days).
3.2.2. Database Model for Traffic Data
4. Data Annotation and Publishing
4.1. Identification of Relevant Concepts and Properties
4.2. Data Integration
4.3. Data Publication and Exploitation
4.4. Technological Choices
- Karma allows to import data from a variety of sources other than a PostgreSQL database, and therefore our approach can be exploited even if the input data are available in other types of sources.
- Karma allows to export the data model in R2RML format, which can be applied to transform a huge amount of data in RDF. Besides, the model can be easily shared with other researchers interested in our mapping to make the same transformation; the model is independent of the data sources. In [75], Karma is compared to other tools and it is the only one that supports exporting models in R2RML.
- Karma enables importing multiple ontologies in the same project. This feature is crucial in our case since a unique ontology which includes all the classes and properties needed was not available.
- Karma offers a batch mode procedure that can be exploited for automating the conversion process given the R2RML model and a set of similar data sources. Furthermore, it is able to interact with a Virtuoso instance and directly load the RDF data into the Virtuoso instance instead of using RDF files.
- Virtuoso is a popular tool that exposes a SPARQL endpoint for performing SPARQL queries, thus covering our fundamental need.
- Karma provides functionalities for operating with instances of Virtuoso. So, these two tools complement each other and can be easily used in conjunction.
- Virtuoso provides an open source version that is constantly being updated and improved.
- It features a backend authentication system which supports setting different privileges for different users. In this way, it is possible, for example, to block potential DELETE statements that can be sent from the Internet.
- It is open-source and can be easily customized.
- It provides a simple and tabular visualization that is easy to understand.
- It is able to navigate and display the resources connected through the owl:sameAs relation.
- It is able to navigate and display inverse relations.
- It provides a connection with LodLive [93]. Therefore, our resources can also be visualized through the online version of LodLive, since it is able to explore the resources of a remote SPARQL endpoint. By exploiting the online version of LodLive, it was not necessary to set up a personalized instance.
5. Experimental Evaluation
6. Conclusions and Future Work
Author Contributions
Funding
Acknowledgments
Conflicts of Interest
Abbreviations
| AENOR | Spanish Association for Standardization and Certification |
| API | Application programming interface |
| CAOVA | Car Accident Ontology for VANETs |
| CKAN | Comprehensive Knowledge Archive Network |
| CPU | Central Processing Unit |
| CSV | Comma Separated Values |
| E/R | Entity/Relationship |
| EDP | European Data Portal |
| ETL | Extract, Transform, Load |
| FAIRMODE | Forum for Air quality Modelling |
| GPS | Global Positioning System |
| GRAL | Graz Lagrangian Model |
| HPC | High-Performance Computing |
| HTML | Hypertext Markup Language |
| IRI | Internationalized Resource Identifier |
| JSON | JavaScript object notation |
| JSP | JavaServer Pages |
| LOD | Linked Open Data |
| OGC | Open Geospatial Consortium |
| OSM | OpenStreetMap |
| PROV-O | PROV Ontology |
| R2RML | RDB to RDF Mapping Language |
| RAM | Random-Access Memory |
| RDB2RDF | Relational Database to RDF |
| RDBMS | Relational Database Management Systems |
| RDF | Resource Description Framework |
| SAREF | Smart Appliances REFerence |
| ShEx | Shape Expressions |
| ShExC | Shape Expressions Compact Syntax |
| SPARQL | SPARQL Protocol and RDF Query Language |
| SQL | Structured Query Language |
| SSN | Sensor Network Ontology |
| TCI | Traffic Congestion Index |
| TPSO | Transportation Planning Suite of Ontologies |
| TRAFAIR | Understanding Traffic Flows to Improve Air quality |
| URI | Uniform Resource Identifier |
| VGI | Volunteered Geographical Information |
| WGS84 | World Geodetic System 1984 |
| XML | Extensible Markup Language |
Appendix A. Data Model
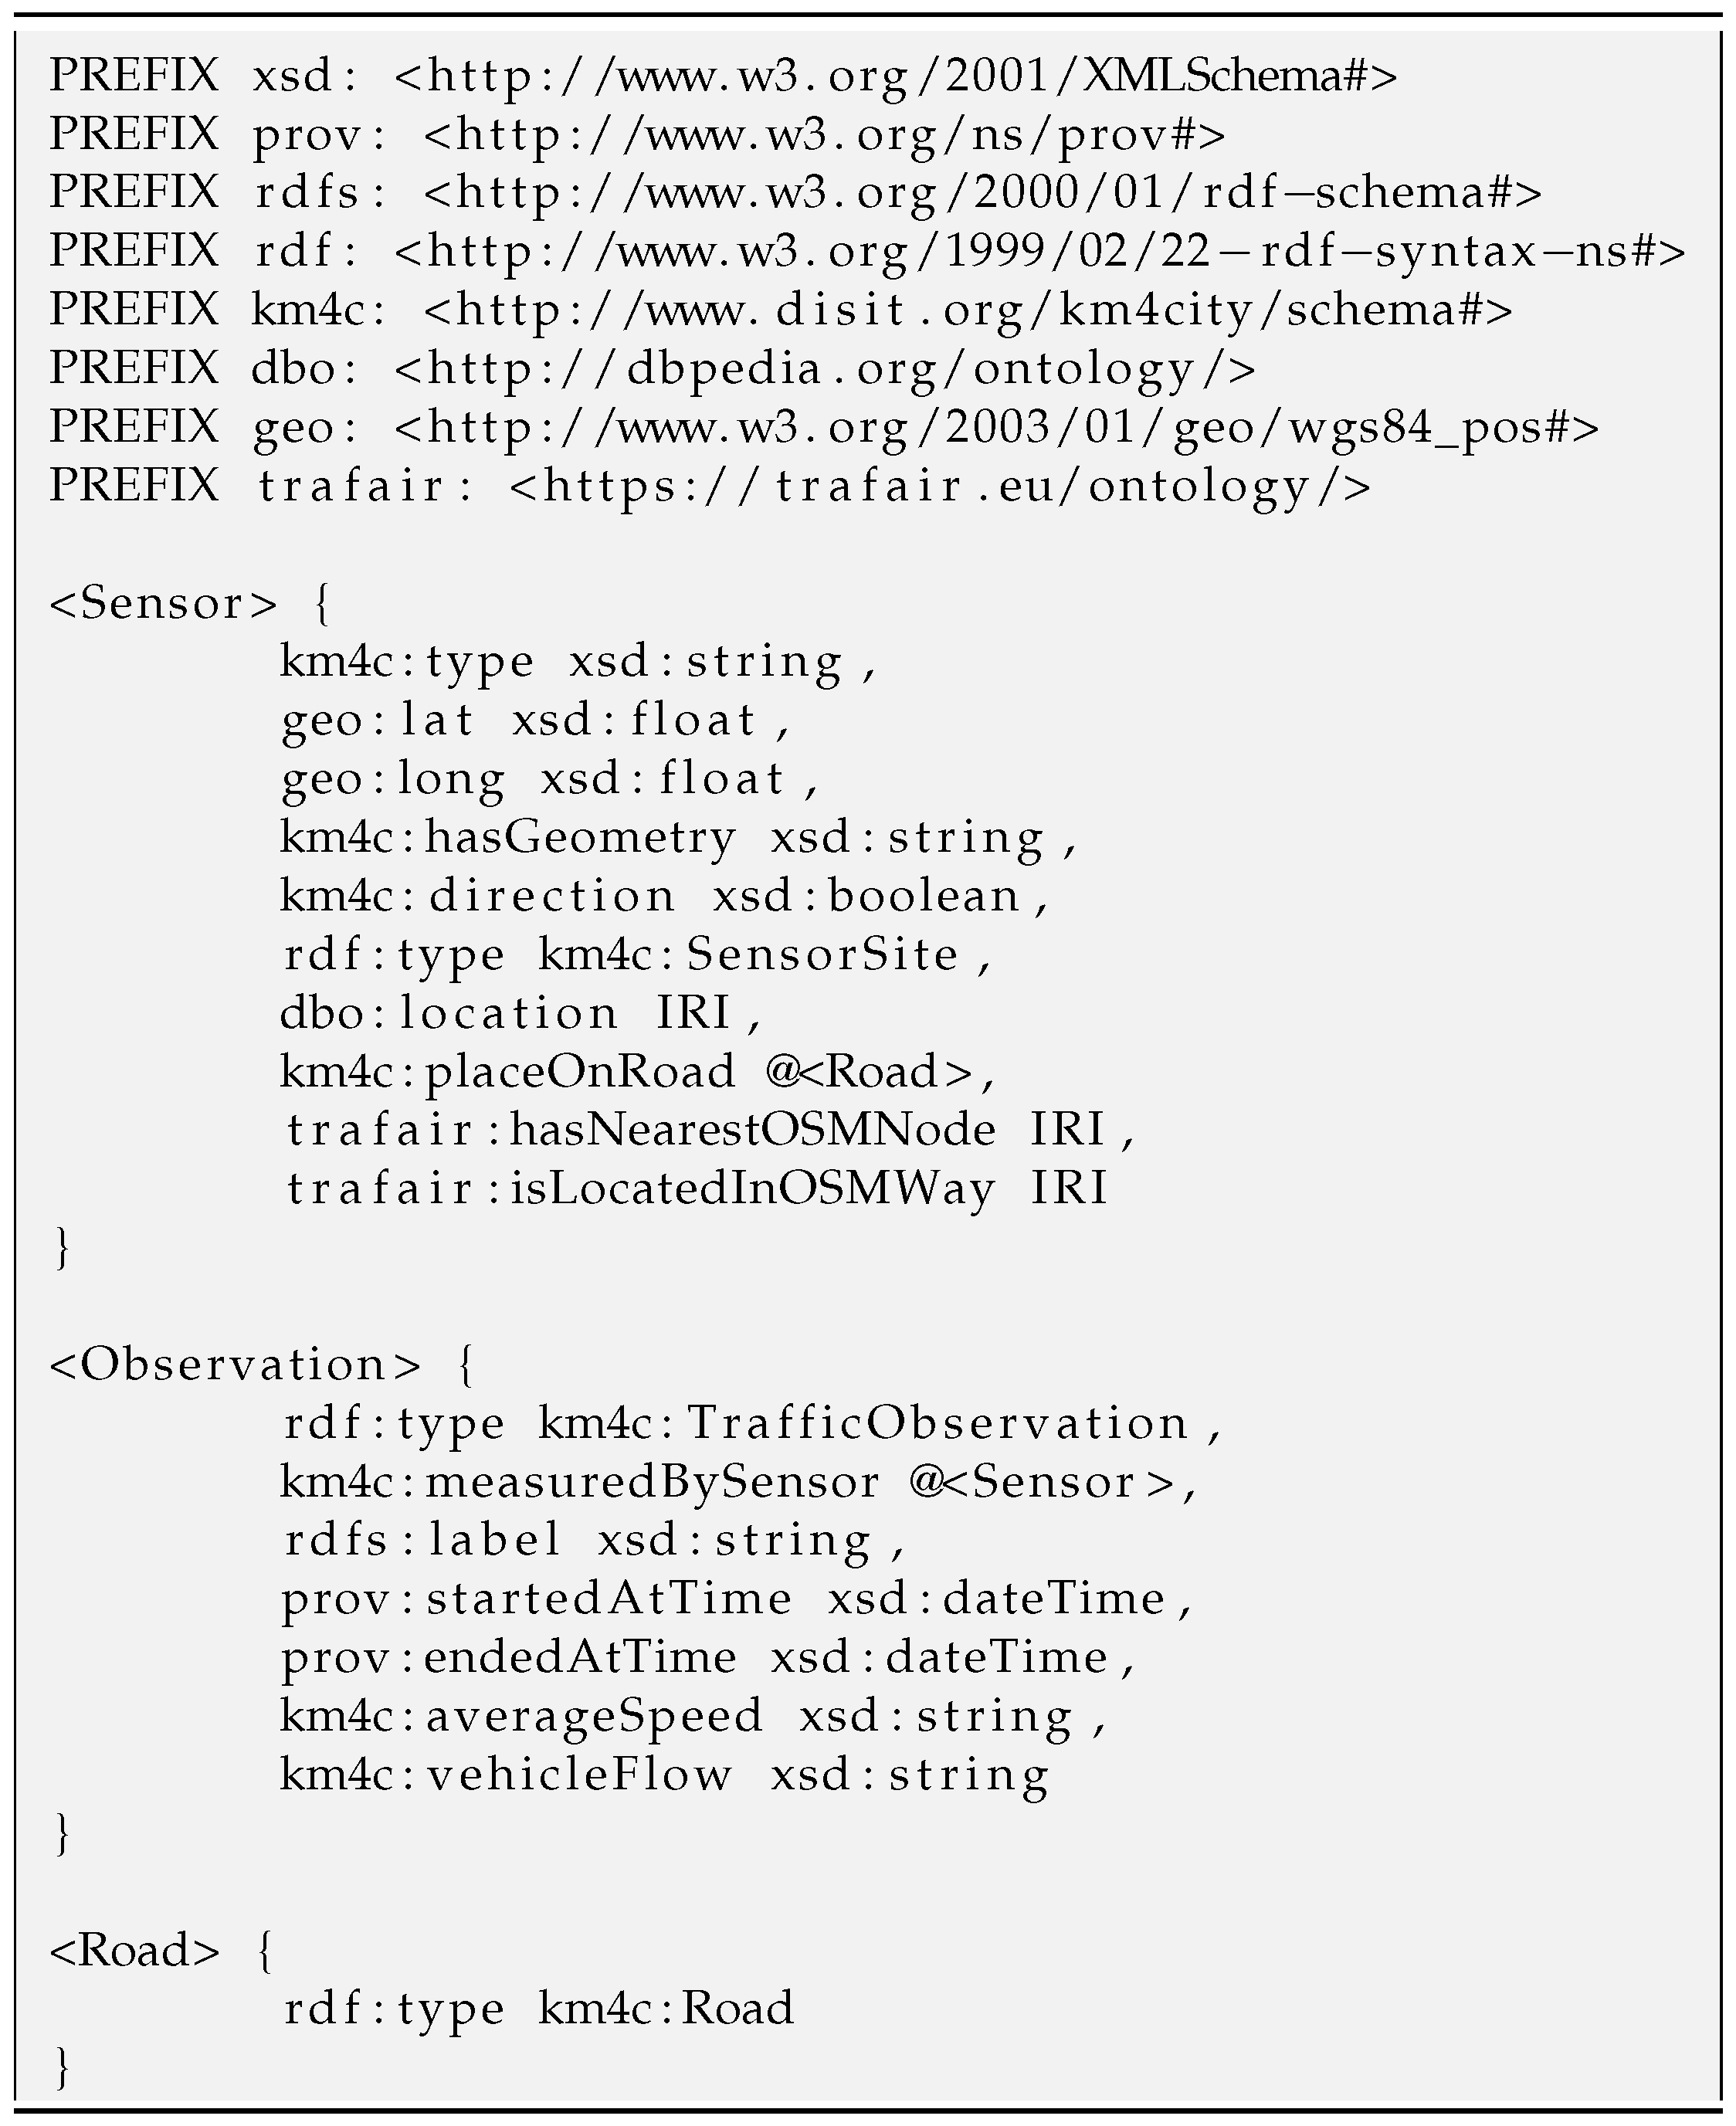
Appendix A.1. ShEx Data Model

Appendix A.2. Structure of the URIs Employed
- Instances of the class km4c:Road have the following URI structure: https://trafair.eu/road/<<city>>/<<road_name>>. It is the concatenation of the strings https://trafair.eu/road, the name of the city, and the road name (e.g., https://trafair.eu/road/modena/Viale_Italia).
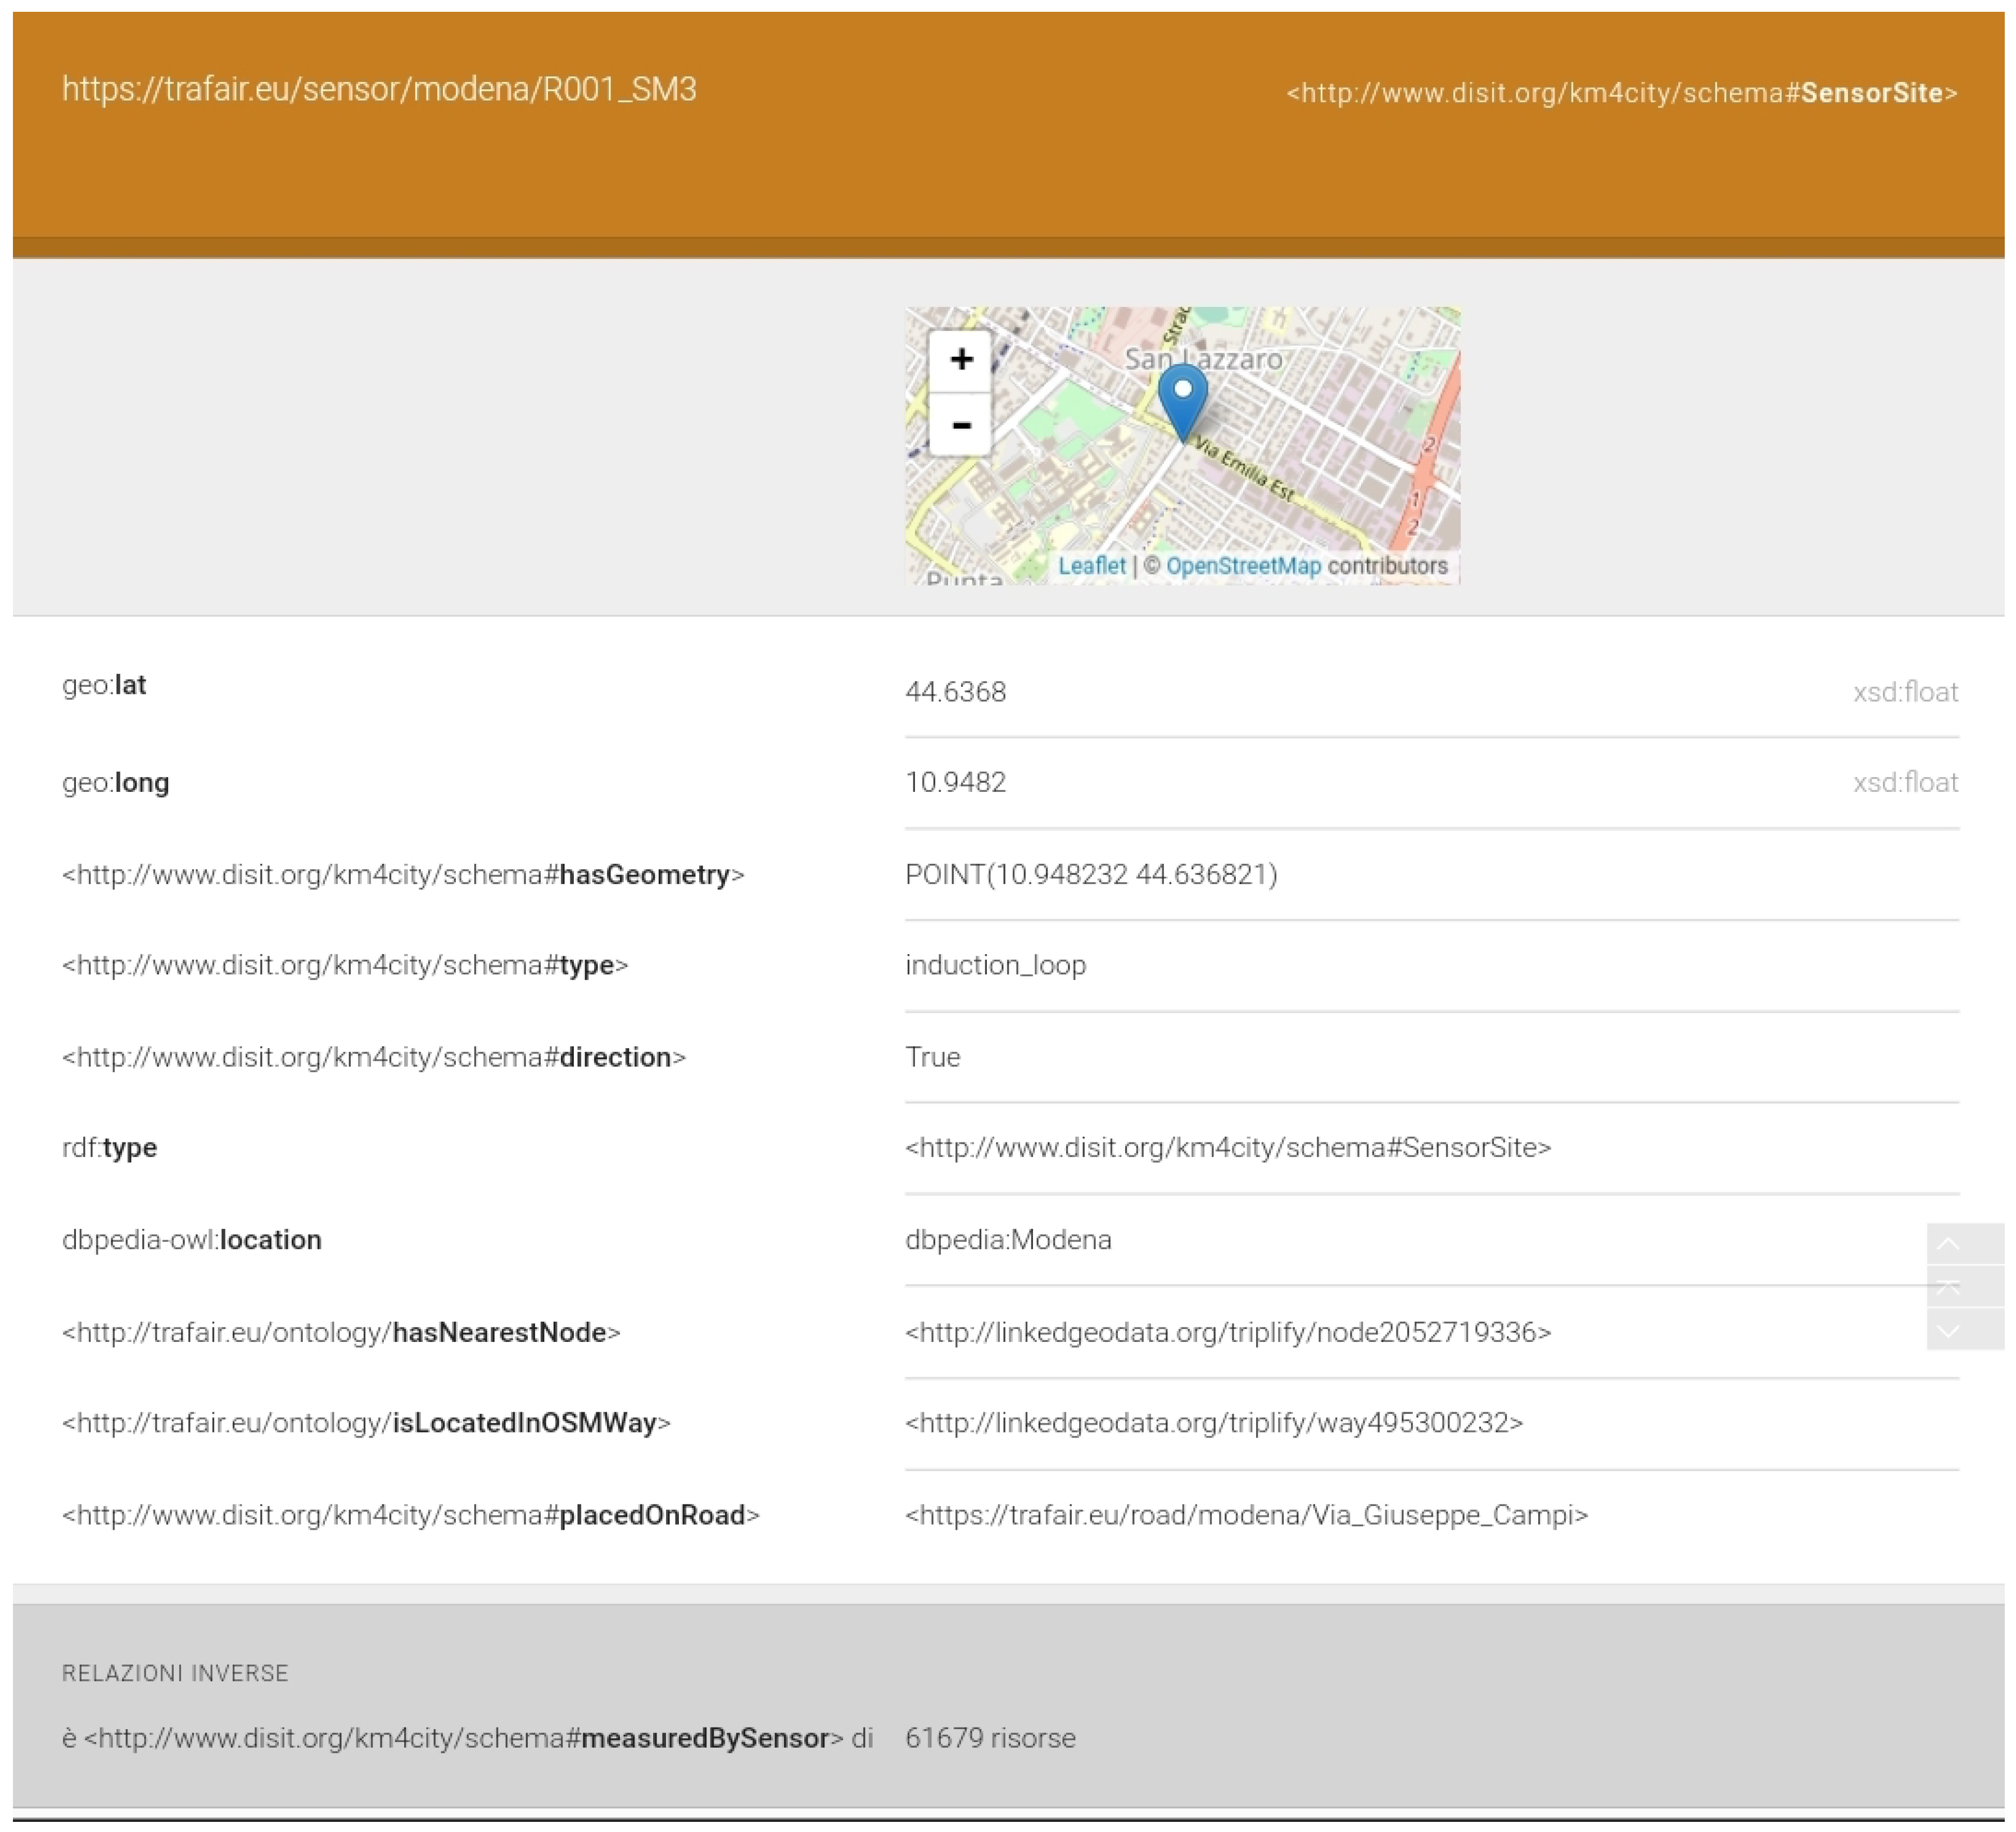
- Instances of the class km4c:SensorSite have the following URI structure: https://trafair.eu/sensor/<<city>>/<<sensor_code>>. It is the concatenation of the strings https://trafair.eu/sensor, the name of the city, and the identifier of the sensor (e.g., https://trafair.eu/sensor/modena/LP1).
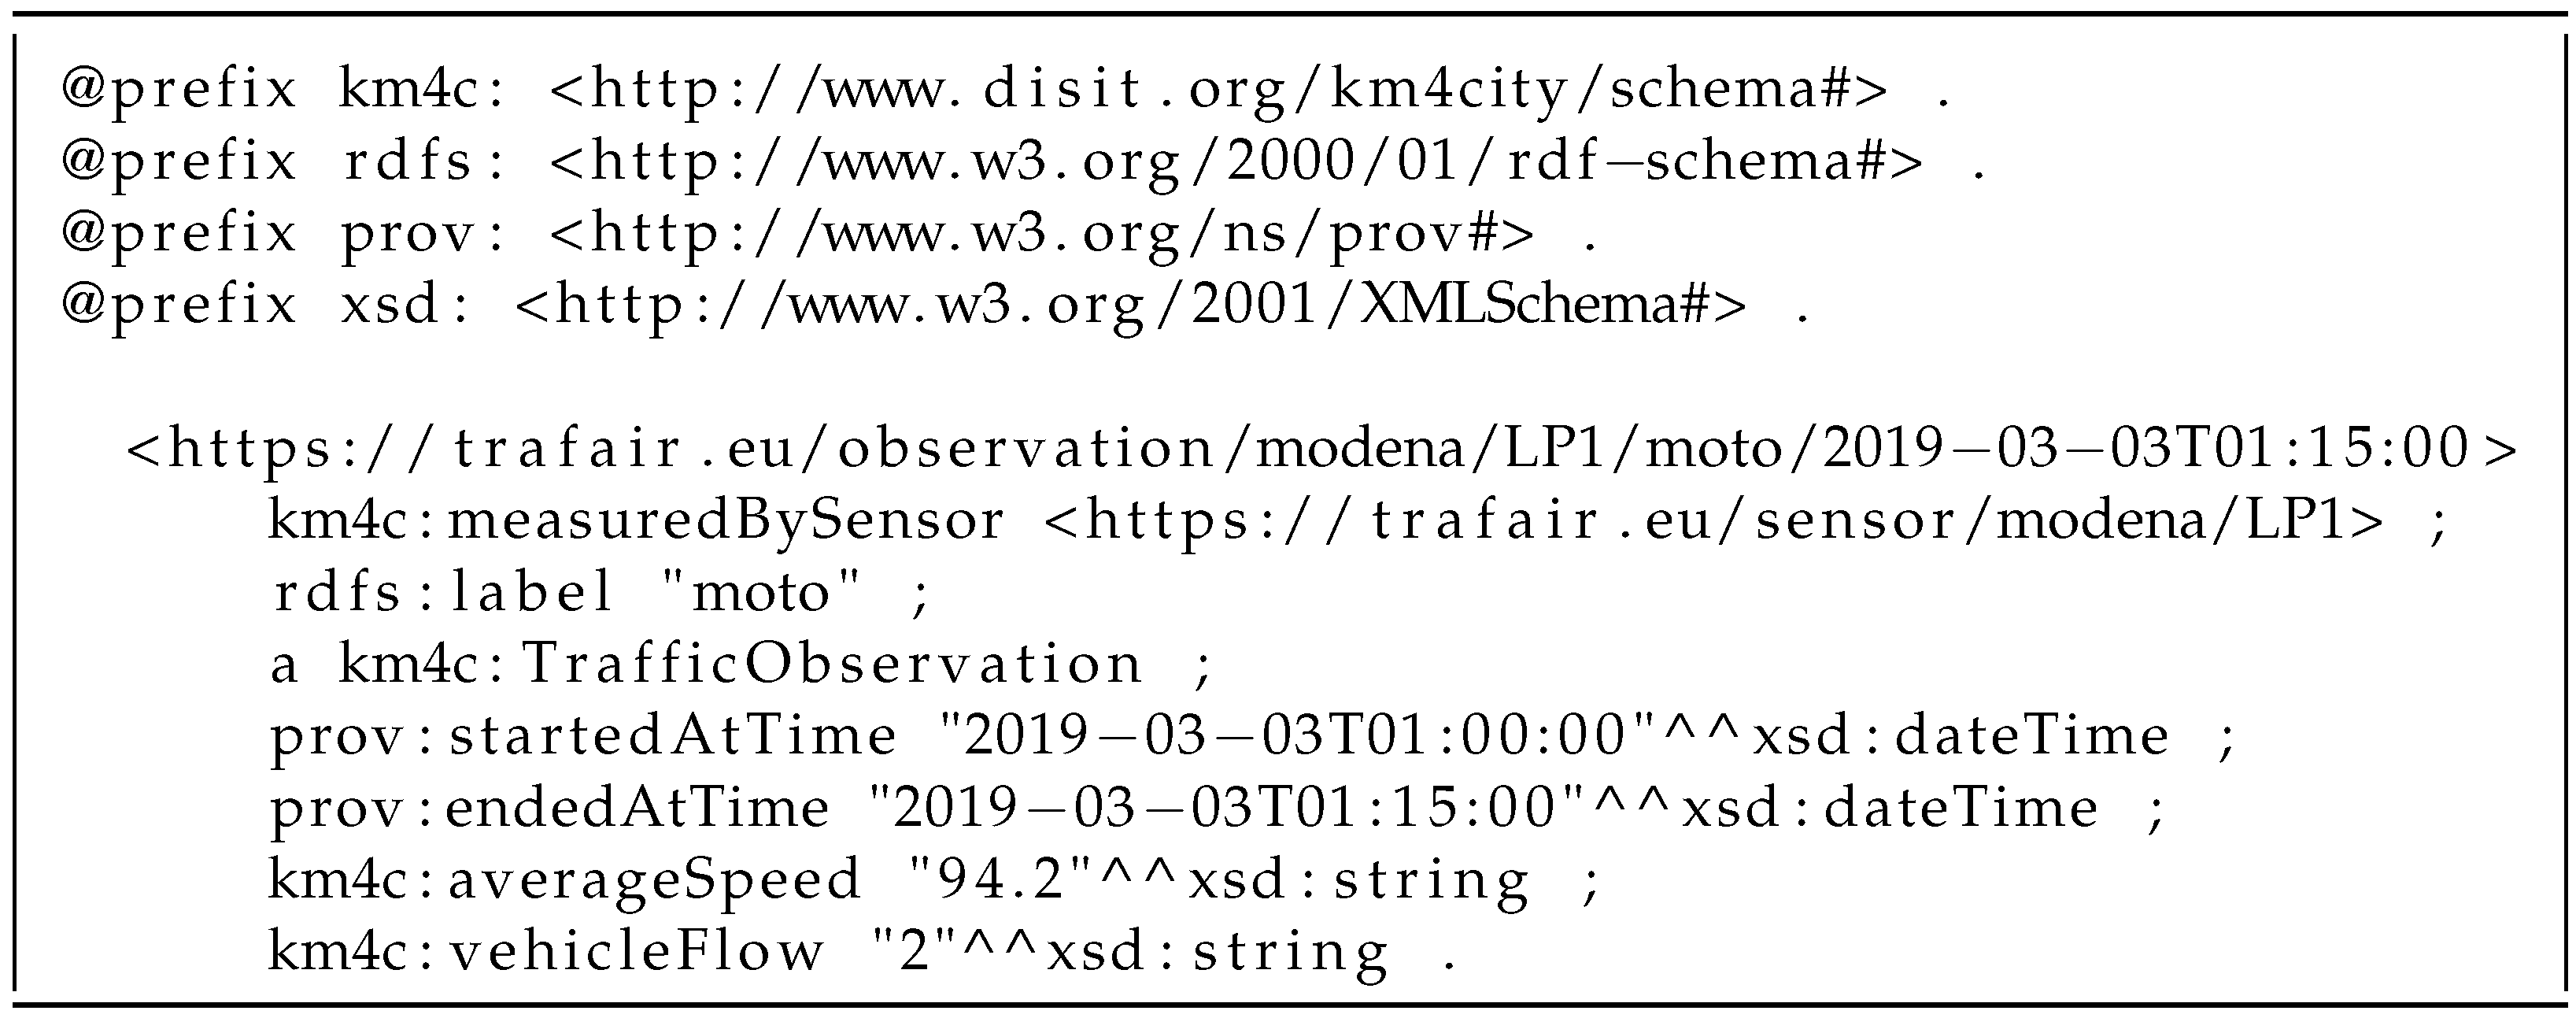
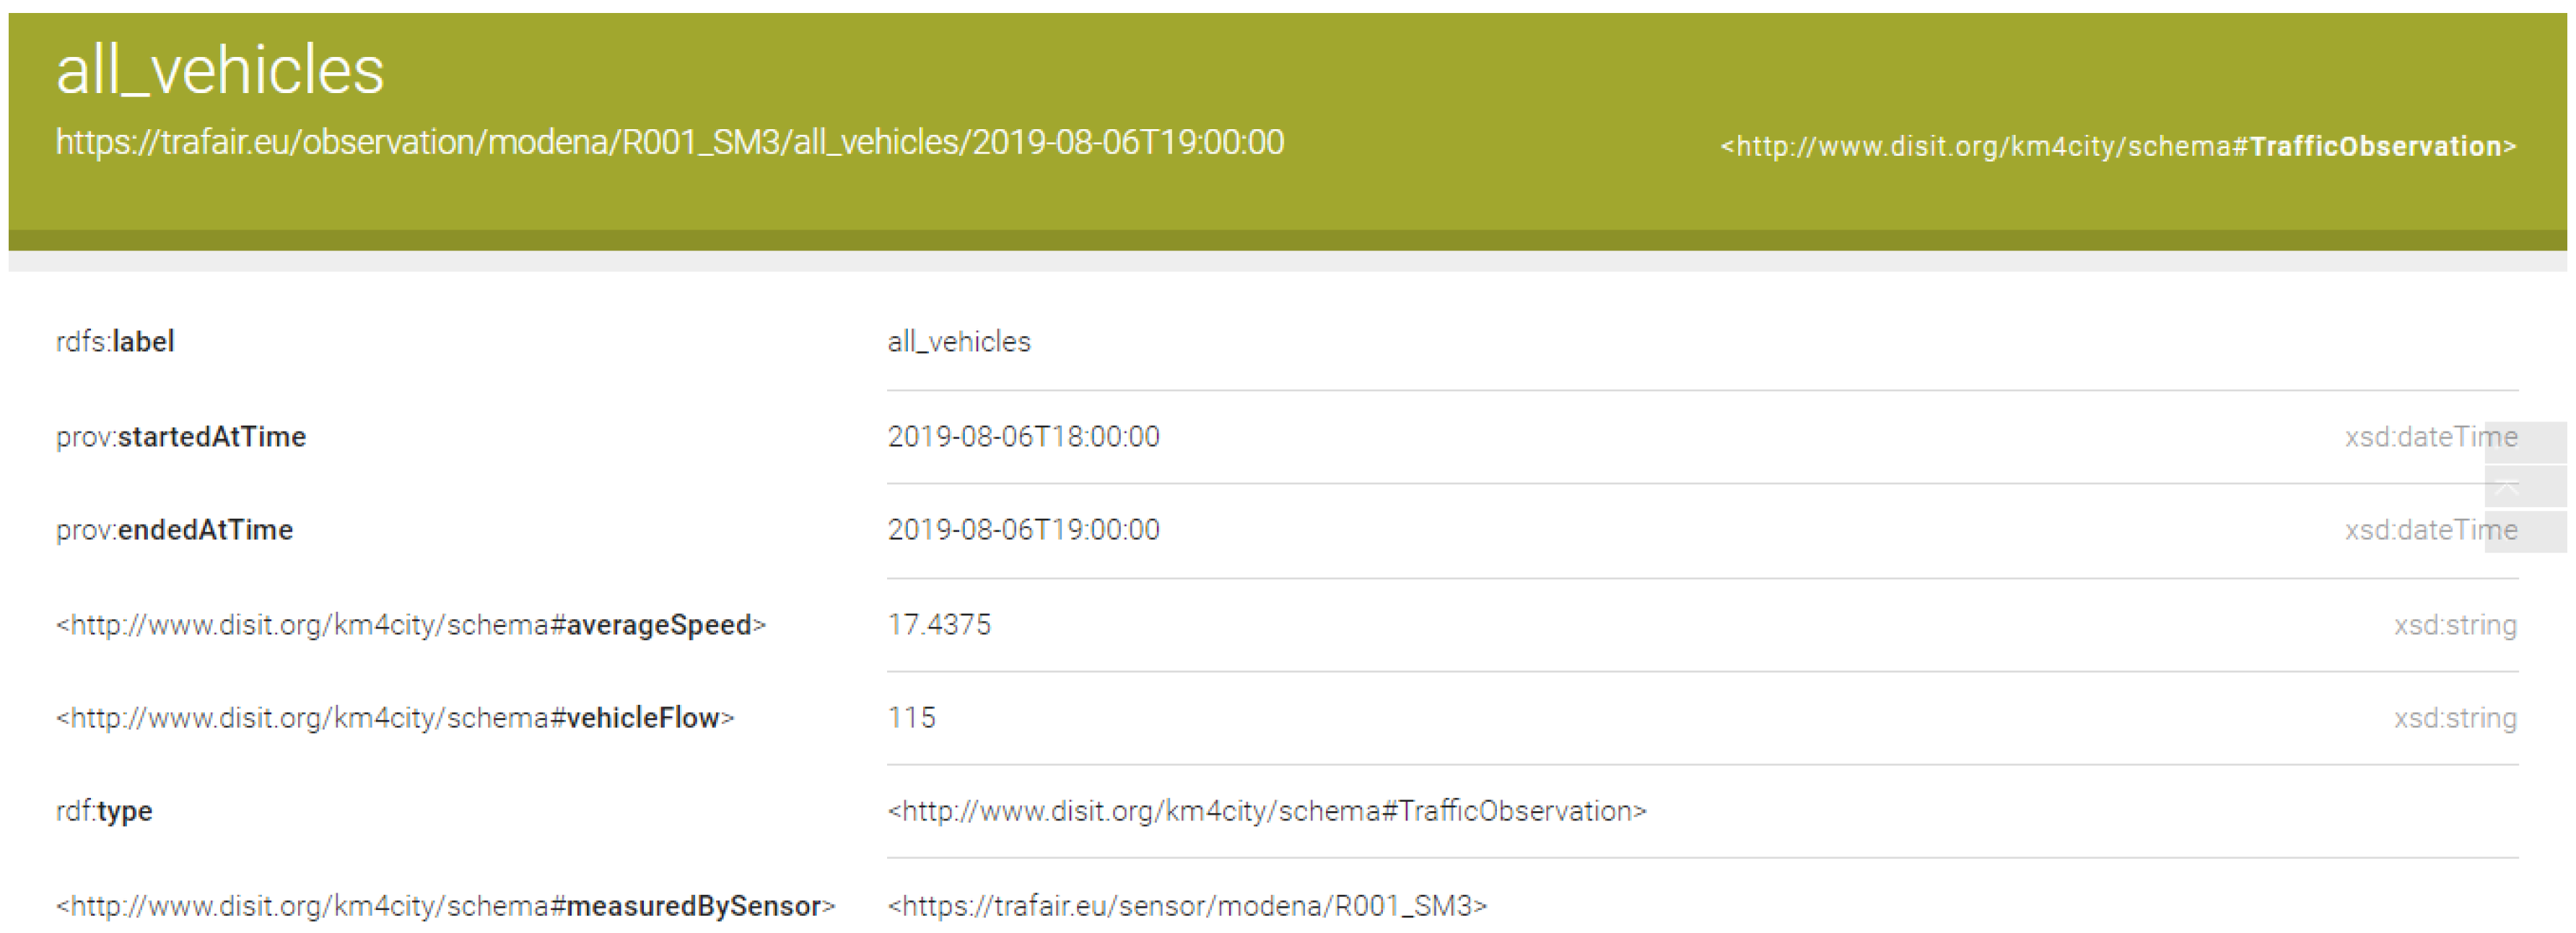
- Instances of the class km4c:TrafficObservation have the following URI structure: https://trafair.eu/observation/<<city>>/<<sensor_code>>/<<vehicle_type>>/<<end_date_of_the_observation>>. It is composed by the concatenation of the following items: the string https://trafair.eu/observation, the name of the city, the identifier of the sensor, the type of vehicles observed, and the timestamp indicating the ending of the observation (e.g., https://trafair.eu/lodview/observation/modena/LP1/autobus/2019-03-04T15:00:00).
Appendix B. Additional SPARQL Queries


References
- Open Data Charter Principles—International Open Data Charter. Available online: https://opendatacharter.net/principles (accessed on 2 August 2020).
- European Union. European Data Portal. Available online: https://www.europeandataportal.eu (accessed on 6 June 2020).
- Sharif, A.; Li, J.; Khalil, M.; Kumar, R.; Sharif, M.I.; Sharif, A. Internet of Things — Smart traffic management system for smart cities using Big Data analytics. In Proceedings of the 14th International Computer Conference on Wavelet Active Media Technology and Information Processing, ICCWAMTIP 2017, Chengdu, China, 15–17 December 2017; pp. 281–284. [Google Scholar] [CrossRef]
- Colacino, V.G.; Po, L. Managing road safety through the use of linked data and heat maps. In Proceedings of the 7th International Conference on Web Intelligence, Mining and Semantics, WIMS 2017, Amantea, Italy, 19–22 June 2017; Akerkar, R., Cuzzocrea, A., Cao, J., Hacid, M., Eds.; ACM: New York, NY, USA, 2017; pp. 18:1–18:8. [Google Scholar] [CrossRef]
- European Commission (2019) EU Road Safety Policy Framework 2021–2030. Available online: https://ec.europa.eu/transport/sites/transport/files/legislation/swd20190283-roadsafety-vision-zero.pdf (accessed on 6 June 2020).
- The 2030 Agenda for Sustainable Development. Available online: https://sustainabledevelopment.un.org/post2015/transformingourworld (accessed on 6 June 2020).
- Mayer, H. Air pollution in cities. Atmos. Environ. 1999, 33, 4029–4037. [Google Scholar] [CrossRef]
- Samet, J.M. Traffic, Air Pollution, and Health. Inhal. Toxicol. 2007, 19, 1021–1027. [Google Scholar] [CrossRef] [PubMed]
- Laña, I.; Ser, J.D.; Padró, A.; Vélez, M.; Casanova-Mateo, C. The role of local urban traffic and meteorological conditions in air pollution: A data-based case study in Madrid, Spain. Atmos. Environ. 2016, 145, 424–438. [Google Scholar] [CrossRef]
- Curtis, L.; Rea, W.; Smith-Willis, P.; Fenyves, E.; Pan, Y. Adverse health effects of outdoor air pollutants. Environ. Int. 2006, 32, 815–830. [Google Scholar] [CrossRef] [PubMed]
- Anenberg, S.C.; Henze, D.K.; Tinney, V.; Kinney, P.L.; Raich, W.; Fann, N.; Malley, C.S.; Roman, H.; Lamsal, L.; Duncan, B.; et al. Estimates of the Global Burden of Ambient PM2.5, Ozone, and NO2 on Asthma Incidence and Emergency Room Visits. Environ. Health Perspect. 2018, 126, 107004–1–107004–14. [Google Scholar] [CrossRef]
- Bizer, C.; Heath, T.; Berners-Lee, T. Linked Data: Principles and State of the Art. Talk at the 17th International World Wide Web Conference W3C Track, at the WWW 2008. Available online: https://www.w3.org/2008/Talks/WWW2008-W3CTrack-LOD.pdf (accessed on 12 June 2020).
- Poggi, A.; Lembo, D.; Calvanese, D.; Giacomo, G.D.; Lenzerini, M.; Rosati, R. Linking Data to Ontologies. J. Data Semant. 2008, 10, 133–173. [Google Scholar] [CrossRef]
- Meléndez, J.A.R.; de Vyvere, B.V.; Gevaert, A.; Taelman, R.; Colpaert, P.; Verborgh, R. A Preliminary Open Data Publishing Strategy for Live Data in Flanders. In Proceedings of the Web Conference 2018, WWW 2018, Lyon, France, 23–27 April 2018; Champin, P., Gandon, F.L., Lalmas, M., Ipeirotis, P.G., Eds.; ACM: Geneva, Switzerland, 2018; pp. 1847–1853. [Google Scholar] [CrossRef]
- Xu, X.; Sheng, Q.Z.; Zhang, L.J.; Fan, Y.; Dustdar, S. From Big Data to Big Service. Computer 2015, 48, 80–83. [Google Scholar] [CrossRef]
- Ahmed, S.; Adnan, M.; Janssens, D.; Brattich, E.; ul Haque Yasar, A.; Kumar, P.; di Sabatino, S.; Shakshuki, E.M. Estimating pro-environmental potential for the development of mobility-based informational intervention: A data-driven algorithm. Pers. Ubiquitous Comput. 2018, 23, 653–668. [Google Scholar] [CrossRef]
- Soriano, F.R.; Samper-Zapater, J.J.; Martinez-Dura, J.J.; Cirilo-Gimeno, R.V.; Plume, J.M. Smart Mobility Trends: Open Data and Other Tools. IEEE Intel. Transport. Syst. Magaz. 2018, 10, 6–16. [Google Scholar] [CrossRef]
- De Vyvere, B.V.; Colpaert, P.; Mannens, E.; Verborgh, R. Open traffic lights: A strategy for publishing and preserving traffic lights data. In Proceedings of the Web Conference 2019, WWW 2019, San Francisco, CA, USA, 13–17 May 2019; Amer-Yahia, S., Mahdian, M., Goel, A., Houben, G., Lerman, K., McAuley, J.J., Baeza-Yates, R., Zia, L., Eds.; ACM: New York, NY, USA, 2019; pp. 966–971. [Google Scholar] [CrossRef]
- Lv, M.; Chen, T.; Li, Y.; Li, Y. Urban Traffic Congestion Index Estimation With Open Ubiquitous Data. J. Inf. Sci. Eng. 2018, 34, 781–799. [Google Scholar]
- Pollhammer, K.; Novak, T.; Raich, P.; Kastner, W.; Treytl, A.; Kovacs, G. Open traffic data platform for scenario-based control. In Proceedings of the 42nd Annual Conference of the IEEE Industrial Electronics Society, IECON 2016, Florence, Italy, 23–26 October 2016; pp. 4677–4682. [Google Scholar] [CrossRef]
- Consoli, S.; Presutti, V.; Recupero, D.R.; Nuzzolese, A.G.; Peroni, S.; Mongiovi’, M.; Gangemi, A. Producing Linked Data for Smart Cities: The Case of Catania. Big Data Res. 2017, 7, 1–15. [Google Scholar] [CrossRef]
- Janssen, M.; Matheus, R.; Zuiderwijk, A. Big and Open Linked Data (BOLD) to Create Smart Cities and Citizens: Insights from Smart Energy and Mobility Cases. In Proceedings of the International Conference on Electronic Government, EGOV 2015, Thessaloniki, Greece, 30 August–2 September 2015; Lecture Notes in Computer Science. Springer: Berlin/Heidelberg, Germany, 2015; Volume 9248, pp. 79–90. [Google Scholar] [CrossRef]
- Óscar Corcho (Ontology Engineering Group Universidad Politécnica de Madrid, L. Vocabulary to Represent Data about Traffic (Vocabulario para la representación de datos sobre tráfico). Available online: http://vocab.linkeddata.es/datosabiertos/def/transporte/trafico (accessed on 6 June 2020).
- Semantic Sensor Network Ontology. W3C Recommendation. 19 October 2017. Available online: https://www.w3.org/TR/vocab-ssn (accessed on 12 June 2020).
- Compton, M.; Barnaghi, P.; Bermudez, L.; García-Castro, R.; Corcho, O.; Cox, S.; Graybeal, J.; Hauswirth, M.; Henson, C.; Herzog, A.; et al. The SSN ontology of the W3C Semantic Sensor Network incubator group. J. Web Semant. 2012, 17, 25–32. [Google Scholar] [CrossRef]
- Janowicz, K.; Haller, A.; Cox, S.J.; Phuoc, D.L.; Lefrançois, M. SOSA: A lightweight ontology for sensors, observations, samples, and actuators. J. Web Semant. 2019, 56, 1–10. [Google Scholar] [CrossRef]
- AENOR (Spanish Association for Normalization). Available online: https://www.aenor.com (accessed on 6 June 2020).
- Vera, J.; Tobarra, M.; Fernández, M.J.; Corcho, Ó.; Morlán, V. Vocabulary to Represent Data of a City Roadmap (Vocabulario para la representación de datos de un callejero). Available online: http://vocab.linkeddata.es/datosabiertos/def/urbanismo-infraestructuras/callejero (accessed on 6 June 2020).
- Fernandez, S.; Hadfi, R.; Ito, T.; Marsa-Maestre, I.; Velasco, J. Ontology-Based Architecture for Intelligent Transportation Systems Using a Traffic Sensor Network. Sensors 2016, 16, 1287. [Google Scholar] [CrossRef]
- Zhang, X.; Zhao, Y.; Liu, W. A Method for Mapping Sensor Data to SSN Ontology. Int. J. e-Service Sci. Technol. 2015, 8, 303–316. [Google Scholar] [CrossRef]
- Open North. Open511 Specification. Available online: http://www.open511.org (accessed on 6 June 2020).
- GeoNames. Available online: https://www.geonames.org (accessed on 6 June 2020).
- Ahlers, D. Assessment of the Accuracy of GeoNames Gazetteer Data. In Proceedings of the Seventh Workshop on Geographic Information Retrieval, GIR 2013, Orlando, FL, USA, 5 November 2013; Association for Computing Machinery: New York, NY, USA, 2013; pp. 74–81. [Google Scholar]
- Dardailler, D. Road Accident Ontology—Draft. Available online: https://www.w3.org/2012/06/rao.html (accessed on 6 June 2020).
- Barrachina, J.; Garrido, P.; Fogue, M.; Martinez, F.J.; Cano, J.C.; Calafate, C.T.; Manzoni, P. CAOVA: A Car Accident Ontology for VANETs. In Proceedings of the IEEE Wireless Communications and Networking Conference, WCNC 2012, Paris, France, 1–4 April 2012; pp. 1864–1869. [Google Scholar]
- Katsumi, M.; Fox, M. An Ontology-Based Standard for Transportation Planning. In Proceedings of the Joint Ontology Workshops, JOWO 2019, Graz, Austria, 23–25 September 2019; CEUR Workshop Proceedings: Aachen, Germany, 2019; Volume 2518. [Google Scholar]
- Enterprise Integration Lab, University of Toronto. Observations Ontology. Available online: http://ontology.eil.utoronto.ca/icity/Observations/1.0 (accessed on 6 June 2020).
- Bellini, P.; Nesi, P.; Soderi, M. Km4City—The Knowledge Model 4 the City Smart City Ontology. 2018. Available online: http://www.disit.org/5606, http://www.disit.org/km4city/schema (accessed on 6 June 2020).
- Villalón, M.P.; García-Castro, R. Smart Appliances REFerence (SAREF). Available online: https://ontology.tno.nl/saref (accessed on 6 June 2020).
- Daniele, L. FIEMSER Ontology. Available online: https://sites.google.com/site/smartappliancesproject/ontologies/fiemser-ontology (accessed on 6 June 2020).
- European Environmental Agency. Air Quality in Europe—2019 Report; Technical Report; European Environmental Agency: Copenhagen, Denmark, 2019. [Google Scholar] [CrossRef]
- Website of TRAFAIR—Understanding Traffic Flows to Improve Air Quality. INEA CEF-TELECOM Project co-funded by European Union. Grant Agreement n. INEA/CEF/ICT/A2017/1566782 of 7 August 2018. Available online: https://trafair.eu (accessed on 6 June 2020).
- Po, L.; Rollo, F.; Viqueira, J.R.R.; Lado, R.T.; Bigi, A.; López, J.C.; Paolucci, M.; Nesi, P. TRAFAIR: Understanding Traffic Flow to Improve Air Quality. In Proceedings of the 2019 IEEE International Smart Cities Conference, ISC2 2019, Casablanca, Morocco, 14–17 October 2019; pp. 36–43. [Google Scholar] [CrossRef]
- Joint Research Centre (JRC) of the European Commission. FAIRMODE—The Forum for Air Quality Modelling in Europe. Available online: https://fairmode.jrc.ec.europa.eu (accessed on 6 June 2020).
- Viqueira, J.R.R.; Villarroya, S.; Mera, D.; Taboada, J.A. Smart Environmental Data Infrastructures: Bridging the Gap between Earth Sciences and Citizens. Appl. Sci. 2020, 10, 856. [Google Scholar] [CrossRef]
- Coleri, S.; Cheung, S.Y.; Varaiya, P. Sensor networks for monitoring traffic. In Proceedings of the Allerton Conference on Communication, Control and Computing, Monticello, IL, USA, 29 September–1 October 2004; pp. 32–40. [Google Scholar]
- Ilarri, S.; Wolfson, O.; Delot, T. Collaborative Sensing for Urban Transportation. IEEE Data Eng. Bull. 2014, 37, 3–14. [Google Scholar]
- The PostgreSQL Global Development Group. PostgreSQL. Available online: https://www.postgresql.org (accessed on 6 June 2020).
- PostGIS Team. PostGIS. Available online: https://postgis.net (accessed on 6 June 2020).
- OpenStreetMap Foundation (OSMF). OpenStreetMap. Available online: https://www.openstreetmap.org (accessed on 22 July 2020).
- Google. Google Maps. Available online: http://maps.google.com/ (accessed on 22 July 2020).
- Apple. Apple Maps. Available online: https://maps.apple.com/ (accessed on 22 July 2020).
- HERE Technologies. HERE. Available online: https://www.here.com/ (accessed on 22 July 2020).
- TomTom International BV. TomTom. Available online: https://www.tomtom.com (accessed on 22 July 2020).
- Haklay, M. How Good is Volunteered Geographical Information? A Comparative Study of OpenStreetMap and Ordnance Survey Datasets. Environ. Plan. B Plan. Des. 2010, 37, 682–703. [Google Scholar] [CrossRef]
- Camboim, S.; Bravo, J.; Sluter, C. An Investigation into the Completeness of, and the Updates to, OpenStreetMap Data in a Heterogeneous Area in Brazil. ISPRS Int. J. Geo Inf. 2015, 4, 1366–1388. [Google Scholar] [CrossRef]
- Almendros-Jiménez, J.; Becerra-Terón, A. Analyzing the Tagging Quality of the Spanish OpenStreetMap. ISPRS Int. J. Geo Inf. 2018, 7, 323. [Google Scholar] [CrossRef]
- Brovelli, M.; Zamboni, G. A New Method for the Assessment of Spatial Accuracy and Completeness of OpenStreetMap Building Footprints. ISPRS Int. J. Geo Inf. 2018, 7, 289. [Google Scholar] [CrossRef]
- Alhamwi, A.; Medjroubi, W.; Vogt, T.; Agert, C. OpenStreetMap data in modelling the urban energy infrastructure: A first assessment and analysis. Energy Procedia 2017, 142, 1968–1976. [Google Scholar] [CrossRef]
- Chen, P.P.S. The Entity-Relationship Model—Toward a Unified View of Data. ACM Trans. Database Syst. 1976, 1, 9–36. [Google Scholar] [CrossRef]
- Elmasri, R.; Navathe, S.B. Fundamentals of Database Systems, 7th ed.; Pearson: London, UK, 2015. [Google Scholar]
- University of Southern California (USC). Karma—A Data Integration Tool. Available online: https://usc-isi-i2.github.io/karma (accessed on 6 June 2020).
- Gupta, S.; Szekely, P.; Knoblock, C.A.; Goel, A.; Taheriyan, M.; Muslea, M. Karma: A System for Mapping Structured Sources into the Semantic Web. In The Semantic Web: ESWC 2012 Satellite Events; Simperl, E., Norton, B., Mladenic, D., Della Valle, E., Fundulaki, I., Passant, A., Troncy, R., Eds.; Springer: Berlin/Heidelberg, Germany, 2015; pp. 430–434. [Google Scholar]
- Agile Knowledge Engineering and Semantic Web (AKSW) Research Group—University of Leipzig, Institute for Applied Informatics (InfAI). The Linked GeoData Knowledge Base. Available online: http://linkedgeodata.org (accessed on 22 August 2020).
- LodLive Team. LodView. Available online: https://lodview.it/, https://github.com/LodLive/LodView (accessed on 6 June 2020).
- OpenLink Software. Virtuoso. Available online: https://virtuoso.openlinksw.com (accessed on 6 June 2020).
- Erling, O.; Mikhailov, I. RDF Support in the Virtuoso DBMS. In Studies in Computational Intelligence; Springer: Berlin/Heidelberg, Germany, 2009; pp. 7–24. [Google Scholar] [CrossRef]
- W3C Semantic Web Interest Group. Basic Geo (WGS84 lat/long) Vocabulary. Available online: https://www.w3.org/2003/01/geo (accessed on 6 June 2020).
- DBpedia. The DBpedia Ontology. Available online: https://wiki.dbpedia.org/services-resources/ontology (accessed on 6 June 2020).
- W3C. PROV-O: The PROV Ontology. W3C Recommendation. 30 April 2013. Available online: https://www.w3.org/TR/prov-o (accessed on 12 June 2020).
- Vassiliadis, P. A Survey of Extract–Transform–Load Technology. Int. J. Data Warehous. Min. 2009, 5, 1–27. [Google Scholar] [CrossRef]
- Vassiliadis, P.; Simitsis, A.; Baikousi, E. A Taxonomy of ETL Activities. In Proceedings of the ACM Twelfth International Workshop on Data Warehousing and OLAP, DOLAP 2009, Hong Kong, China, 6 November 2009; ACM: New York, NY, USA, 2009; pp. 25–32. [Google Scholar] [CrossRef]
- W3C. R2RML: RDB to RDF Mapping Language. W3C Recommendation. 27 September 2012. Available online: https://www.w3.org/TR/r2rml (accessed on 12 June 2020).
- University of Southern California (USC). Karma RDF Generation Service. Available online: https://github.com/usc-isi-i2/Web-Karma/tree/master/karma-web-services/web-services-rdf (accessed on 6 June 2020).
- Kokolaki, A.; Tzitzikas, Y. Facetize: An Interactive Tool for Cleaning and Transforming Datasets for Facilitating Exploratory Search. arXiv 2018, arXiv:1812.10734. [Google Scholar]
- Metaweb Technologies, Inc. OpenRefine. Created by Metaweb Technologies, Inc. and Originally Written and Conceived by David Huynh, OpenRefine Is Now an Open Source Project with Several Contributors. Available online: https://openrefine.org (accessed on 21 July 2020).
- Anastasia Dimou and Miel Vander Sande. RDF Mapping Language (RML). W3C, Unofficial Draft 15 July 2020. Ghent University–iMinds–Multimedia Lab. Available online: https://rml.io/specs/rml (accessed on 21 July 2020).
- García, H. ShExML. WESO Research Group, University of Oviedo. Available online: http://shexml.herminiogarcia.com (accessed on 21 July 2020).
- Heyvaert, P.; Meester, B.D.; Dimou, A. YARRML. imec—Ghent University—IDLab. Available online: https://rml.io/yarrrml (accessed on 21 July 2020).
- Franz Inc. AllegroGraph. Available online: https://allegrograph.com/products/allegrograph (accessed on 21 July 2020).
- Eclipse Foundation, Inc. RDF4J. Available online: https://rdf4j.org (accessed on 21 July 2020).
- Neo4j, Inc. Neo4J. Available online: https://neo4j.com (accessed on 21 July 2020).
- DataStax. Titan. Available online: https://titan.thinkaurelius.com/ (accessed on 21 July 2020).
- Ontotext. GraphDB. Available online: http://graphdb.ontotext.com (accessed on 21 July 2020).
- Stardog Union. Stardog. Available online: https://www.stardog.com (accessed on 21 July 2020).
- Thakkar, H.; Keswani, Y.; Dubey, M.; Lehmann, J.; Auer, S. Trying Not to Die Benchmarking: Orchestrating RDF and Graph Data Management Solution Benchmarks Using LITMUS. In Proceedings of the 13th International Conference on Semantic Systems, Semantics 2017, Amsterdam, The Netherlands, 11–14 September 2017; ACM: New York, NY, USA, 2017; pp. 120–127. [Google Scholar] [CrossRef]
- De Lleida, U. Rhizomer. Rhizomik Initiative, GRIHO (Human-Computer Interaction and Data Integration) Research Group. Available online: http://rhizomik.net/html/rhizomer/ (accessed on 21 July 2020).
- Brunetti, J.M.; García, R.; Auer, S. From Overview to Facets and Pivoting for Interactive Exploration of Semantic Web Data. Int. J. Semant. Web Inf. Syst. 2013, 9, 1–20. [Google Scholar] [CrossRef]
- Micsik, A. LODMilla. 2016. Available online: https://github.com/dsd-sztaki-hu/LODmilla-frontend (accessed on 22 August 2020).
- Micsik, A.; Tóth, Z.; Turbucz, S. LODmilla: Shared Visualization of Linked Open Data. In Theory and Practice of Digital Libraries (TPDL)–Selected Workshops; Springer: Berlin, Germany, 2014; Volume 416, pp. 89–100. [Google Scholar] [CrossRef]
- José Negrão. LODGVis. Available online: https://github.com/joseolimpio/LODBrowser (accessed on 6 June 2020).
- Coimbra, D.B.; Negrão, J.O.M.; Durão, F.A. LODGVis: An Interactive Visualization for Linked Open Data Navigation. In Proceedings of the 25th Brazillian Symposium on Multimedia and the Web, WebMedia 2019, Rio de Janeiro, Brazil, 29 October–1 November 2019; ACM: New York, NY, USA, 2019; pp. 433–440. [Google Scholar] [CrossRef]
- Camarda, D.V.; Mazzini, S.; Antonuccio, A. LodLive, exploring the web of data. In Proceedings of the 8th International Conference on Semantic Systems, I-SEMANTICS 2012, Graz, Austria, 5–7 September 2012. [Google Scholar]
- Faye, D.C.; Curé, O.; Blin, G. A survey of RDF storage approaches. Rev. Afr. Rech. Inform. Math. Appl. 2012, 15, 11–35. [Google Scholar]
- Modoni, G.E.; Sacco, M.; Terkaj, W. A survey of RDF store solutions. In Proceedings of the 2014 International Conference on Engineering, Technology and Innovation (ICE), Bergamo, Italy, 23–25 June 2014; pp. 1–7. [Google Scholar]
- Ma, Z.; Capretz, M.A.M.; Yan, L. Storing massive Resource Description Framework (RDF) data: A survey. Knowl. Eng. Rev. 2016, 31, 391–413. [Google Scholar] [CrossRef]
- Nitta, K.; Savnik, I. Survey of RDF Storage Managers. In Proceedings of the Sixth International Conference on Advances in Databases, Knowledge, and Data Applications (DBKDA), Chamonix, France, 20–25 April 2014; pp. 148–153. [Google Scholar]
- Özsu, M.T. A survey of RDF data management systems. Front. Comp. Sci. 2016, 10, 418–432. [Google Scholar] [CrossRef]
- Dadzie, A.S.; Rowe, M. Approaches to Visualising Linked Data: A Survey. Semant. Web 2011, 2, 89–124. [Google Scholar] [CrossRef]
- Jacksi, K.; Dimililer, N.; Zeebaree, S.R.M. State of the Art Exploration Systems for Linked Data: A Review. Int. J. Adv. Comp. Sci. Appl. 2016, 7, 155–164. [Google Scholar] [CrossRef]
- Antoniazzi, F.; Viola, F. RDF Graph Visualization Tools: A Survey. In Proceedings of the 23rd Conference of Open Innovations Association (FRUCT), Bologna, Italy, 13–16 November 2018; pp. 25–36. [Google Scholar]
- Desimoni, F.; Po, L. Empirical evaluation of Linked Data visualization tools. Future Gener. Comput. Syst. 2020, 112, 258–282. [Google Scholar] [CrossRef]
- Graz University of Technology. GRAL (Graz Lagrangian Model). Available online: http://lampz.tugraz.at/~gral (accessed on 6 June 2020).
- CKAN Association. CKAN (Comprehensive Knowledge Archive Network). Available online: https://ckan.org (accessed on 6 June 2020).
- Bauer, F.; Kaltenböck, M. Linked Open Data: The Essentials; Edition Mono/Monochrom; DGS: Vienna, Austria, 2012. [Google Scholar]
- Martin, S.; Foulonneau, M.; Turki, S. 1-5 Stars: Metadata on the Openness Level of Open Data Sets in Europe. In Communications in Computer and Information Science; Springer: Berlin/Heidelberg, Germany, 2013; pp. 234–245. [Google Scholar] [CrossRef]
- Dell’Aglio, D.; Della Valle, E.; van Harmelen, F.; Bernstein, A. Stream reasoning: A survey and outlook. Data Sci. 2017, 1, 59–83. [Google Scholar] [CrossRef]


| City | #Sensors | #Triples | Loading Time |
|---|---|---|---|
| Zaragoza | 46 | 506 | ~0.75 s |
| Modena | 400 | 4400 | ~5 s |
| City | #Sensors | Period | #Observations | #Triples | Loading Time |
|---|---|---|---|---|---|
| Zaragoza | 46 | 1 January 2019–31 December 2019 | 383 K | M | min |
| Modena | 400 | 1 January 2019–31 December 2019 | 6.5 M | 46 M | 1 h |
| Granularity of Data | Window Lenght | #Iterations Required | #Observations for Each Iteration | #Generated Triples | Loading Time of a Single Iteration | Total Time | Result |
|---|---|---|---|---|---|---|---|
| 1-h data | 1 day | 365 | 17,500 | 122.5K | 14 s (avg) | 1.25 h | success |
| 15-min data | 1 day | 365 | 70,000 | 490K | - | - | failure |
| 15-min data | 12 h | 730 | 35,000 | 245K | 30 s (avg) | 6 h | success |
| 1-min data | 1 day | 365 | 430,000 | 3M | - | - | failure |
| 1-min data | 12 h | 730 | 215,000 | 1.5M | - | - | failure |
| 1-min data | 3 h | 2920 | 54,000 | 378K | 45 s (avg) | 36 h | success |
| 1-min data | 1 h | 8760 | 18,000 | 126K | 14 s (avg) | 34 h | success |
| 1-min data | 1 min | 525,600 | 200 | 1400 | 0.375 s (avg) | 55 h | success |
| Query | Short Description | Response Time | Notes |
|---|---|---|---|
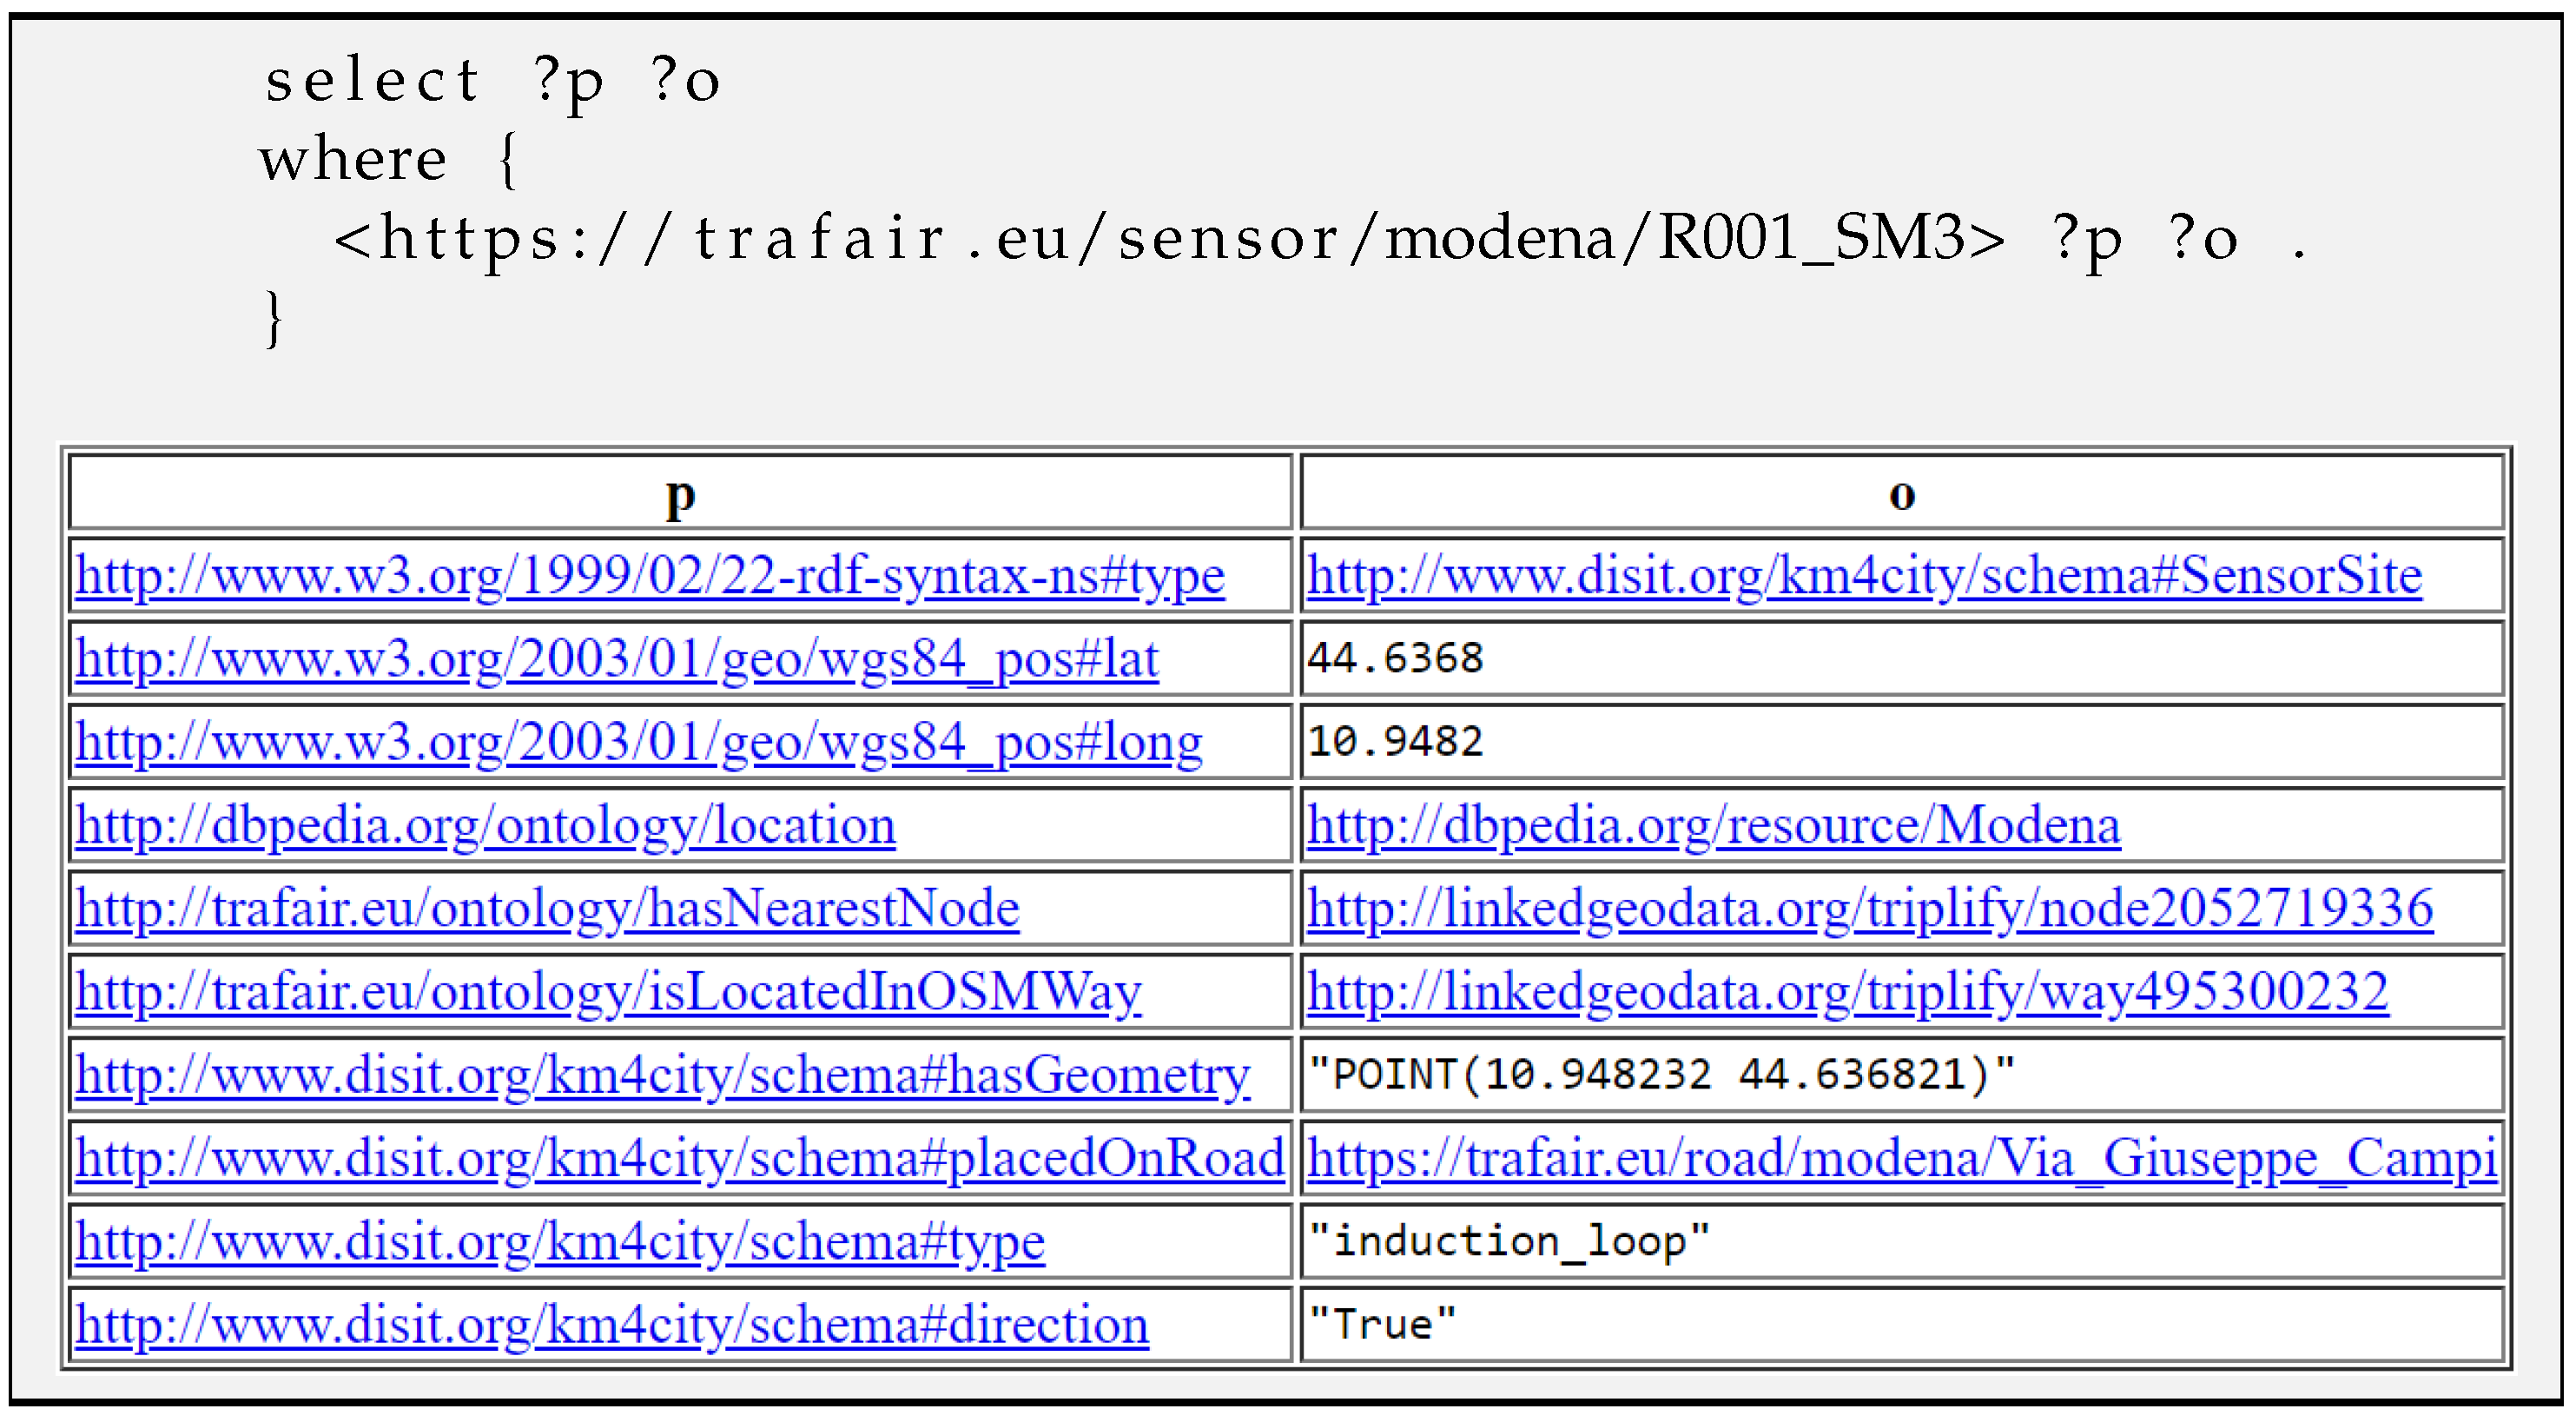
| Query Figure 11 | Data of the sensor “R001_SM3” | 300 ms | |
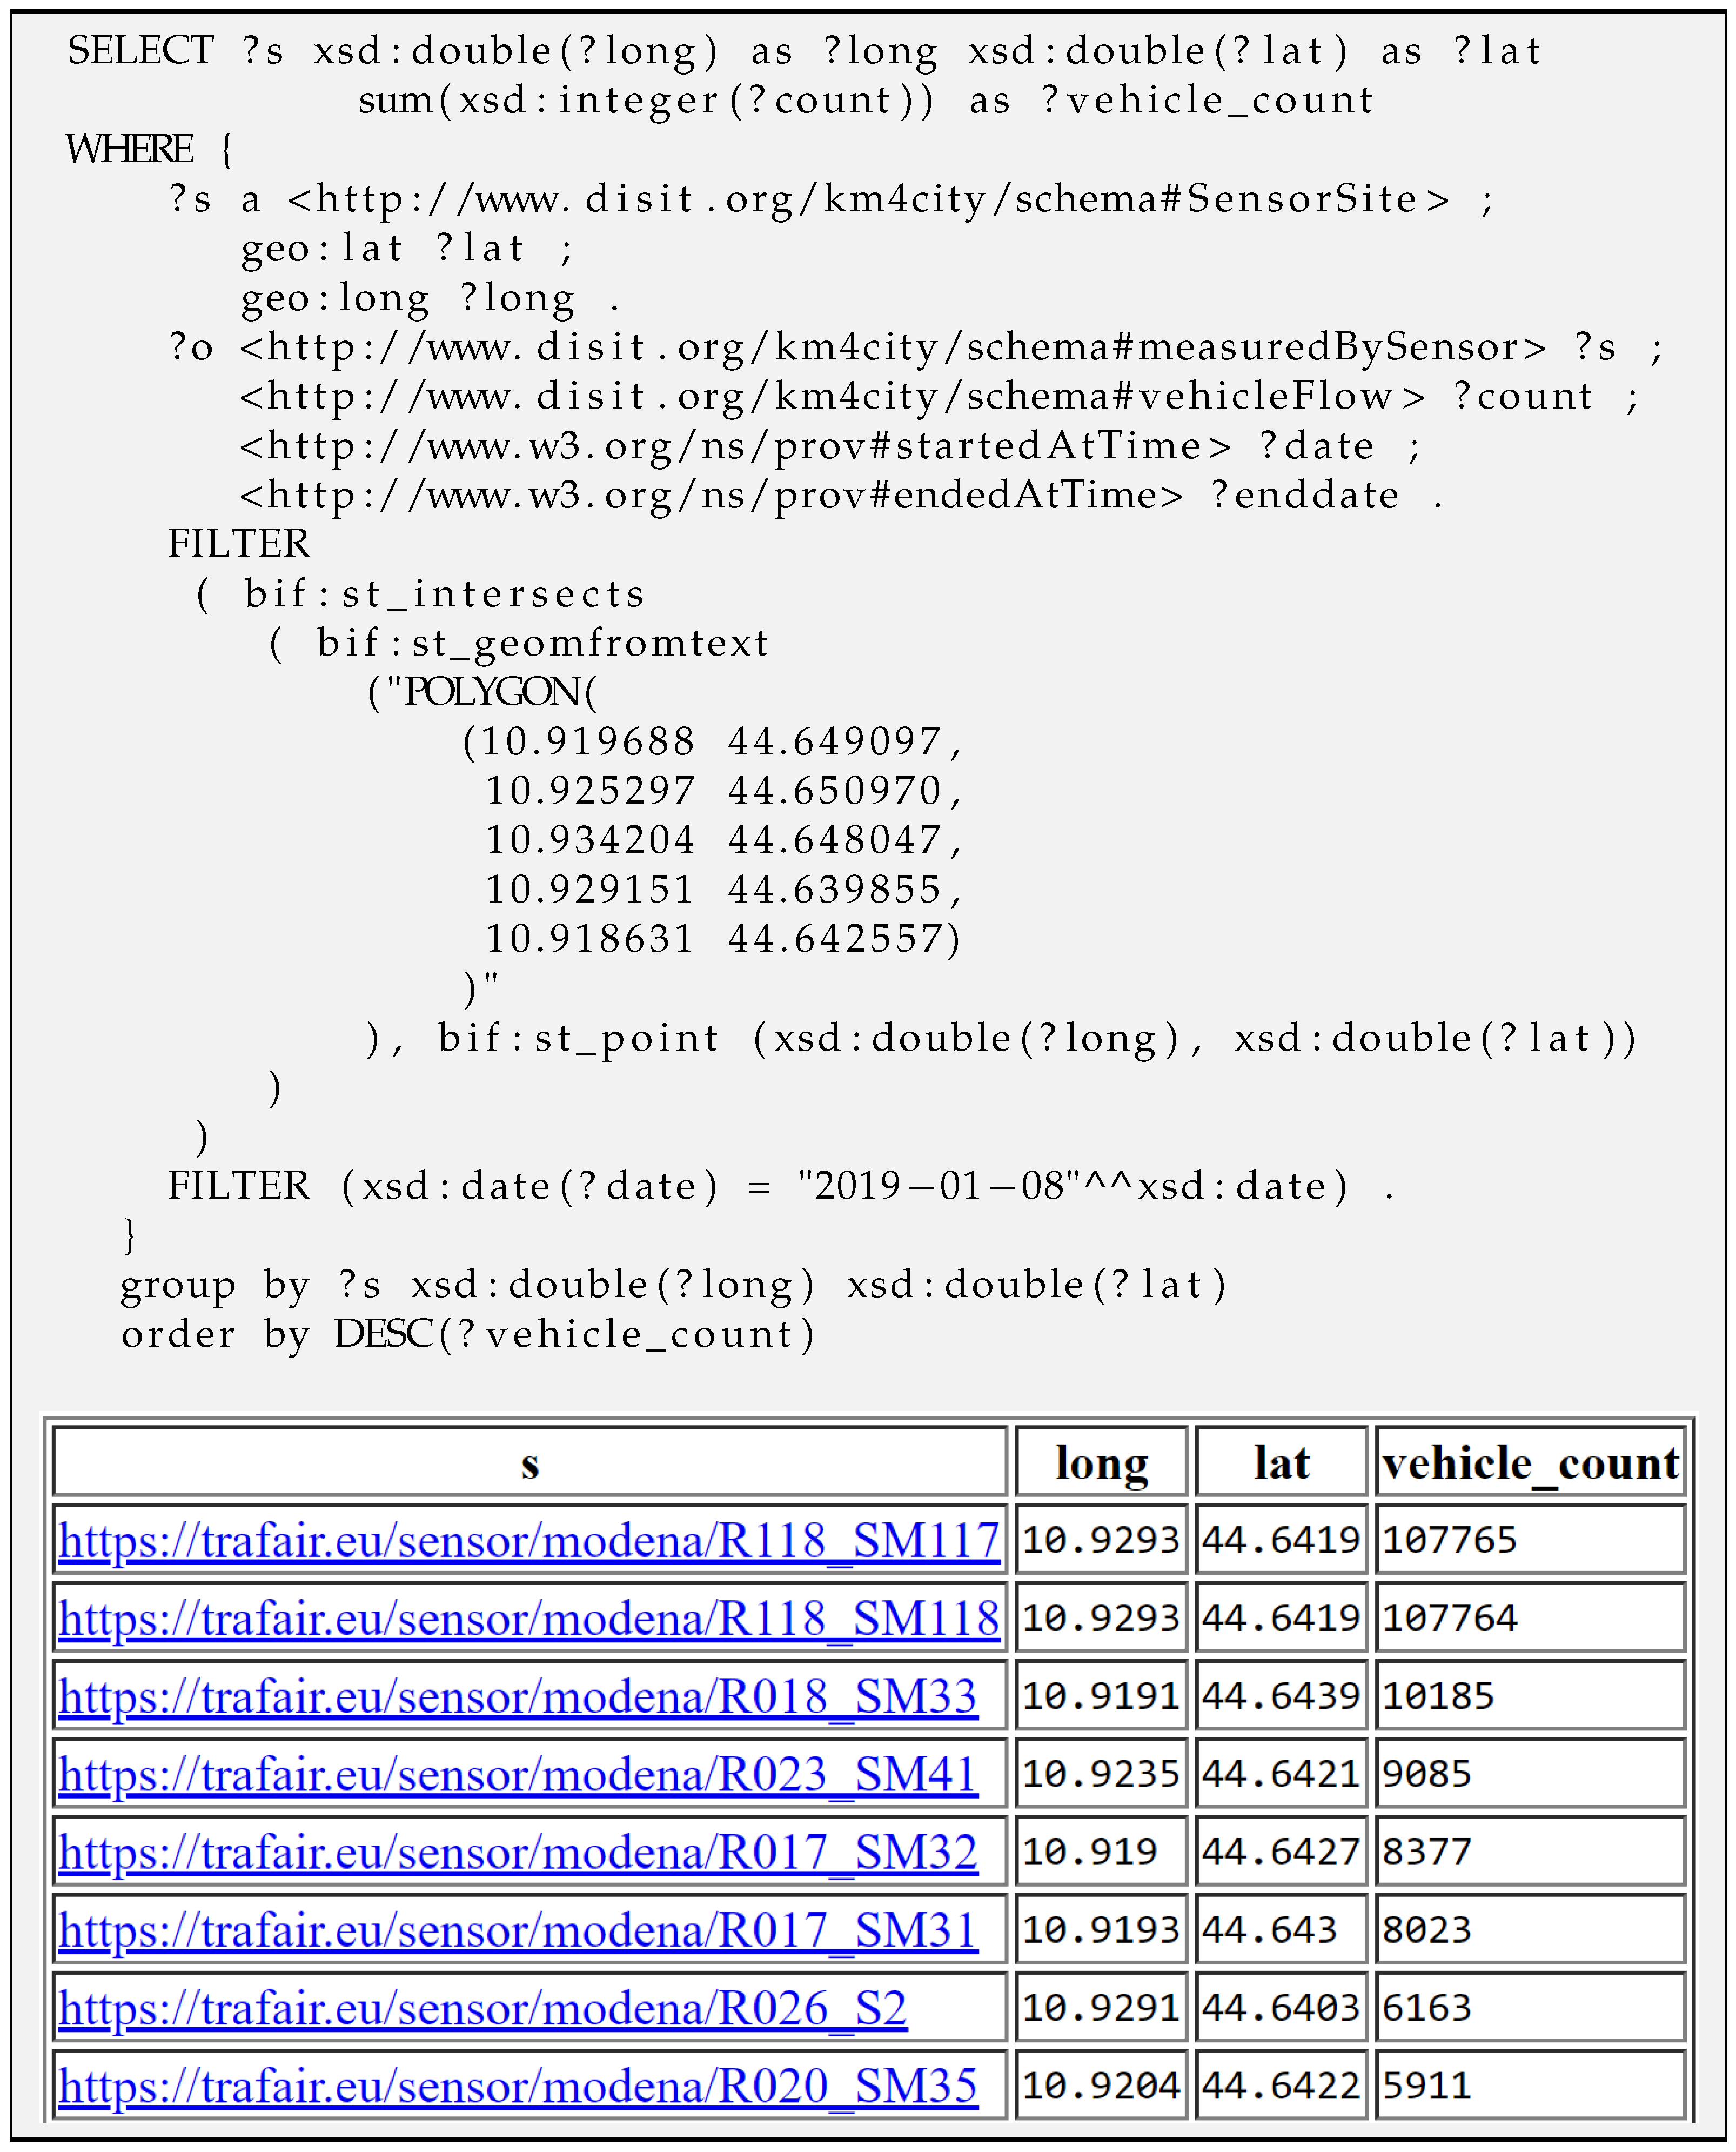
| Query Figure 12 | Number of vehicles counted by sensors in Modena’s square | 2.6 s | GeoSpatial |
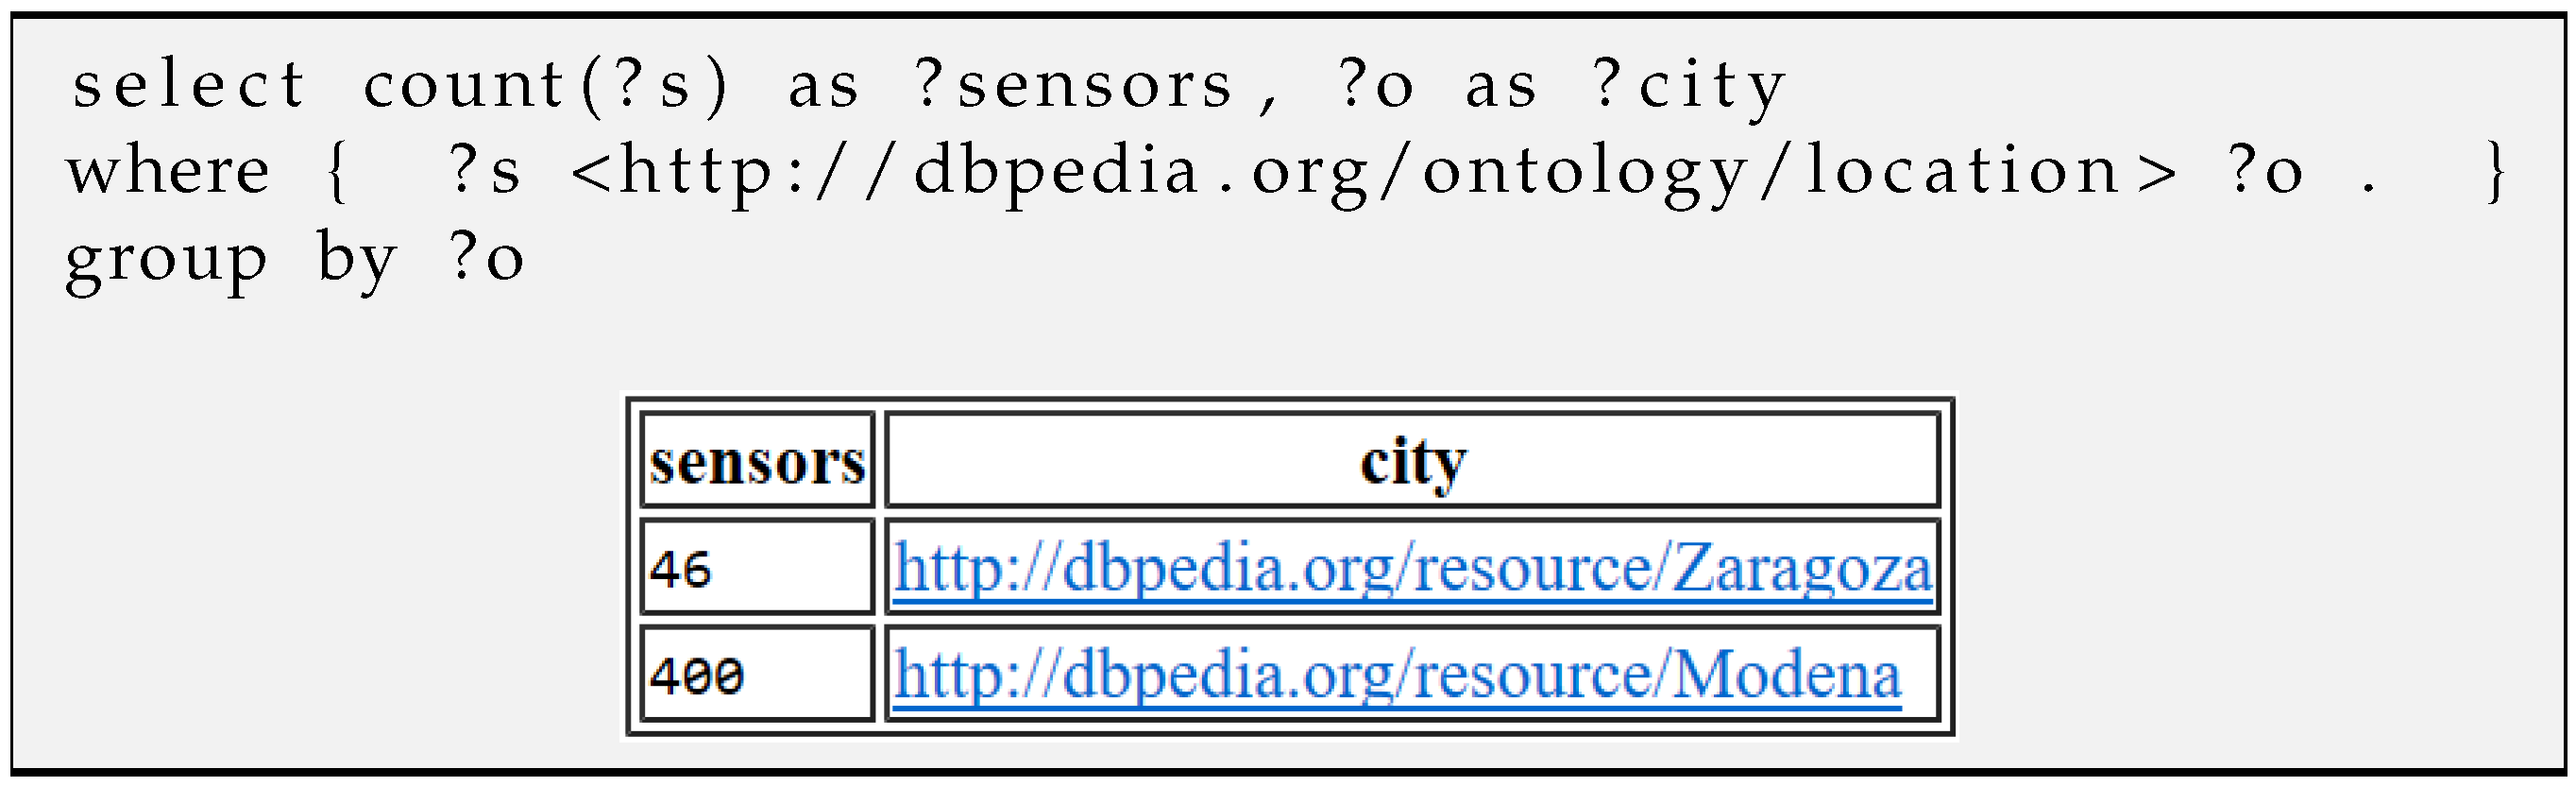
| Query Figure A2 | Number of sensors in each city | 750 ms | |
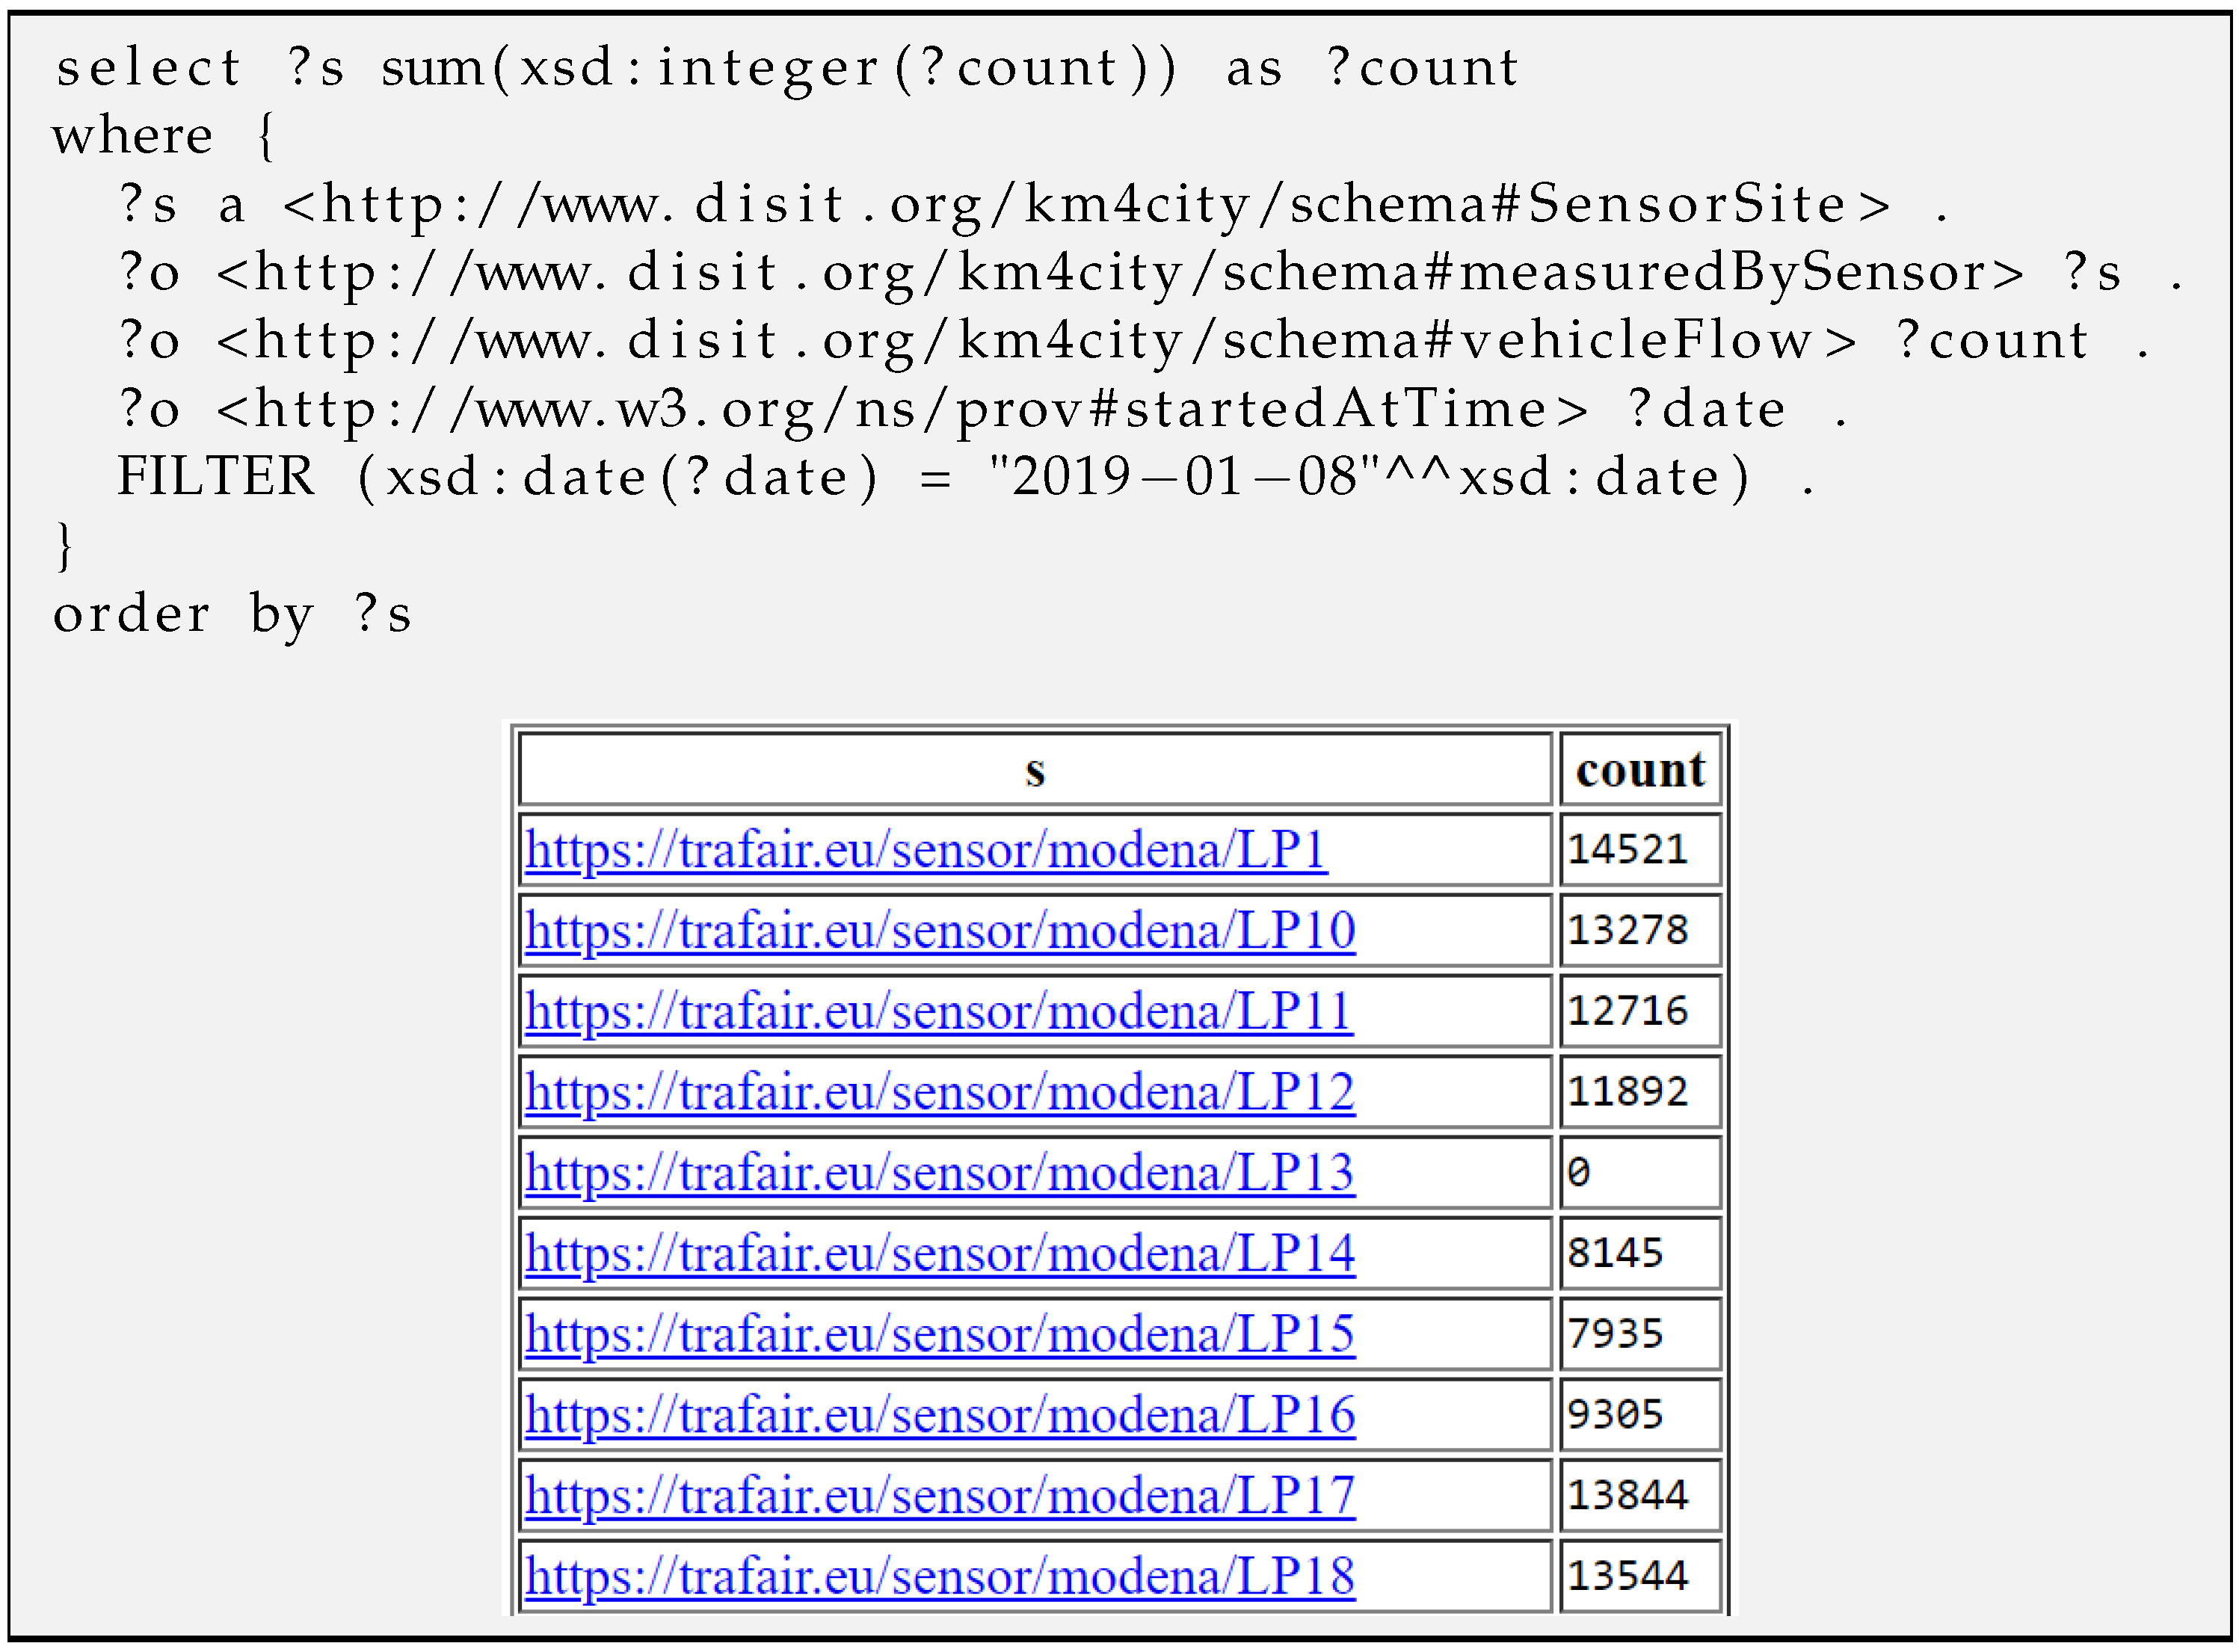
| Query Figure A3 | Number of vehicles counted by each sensor in the datastore | 26.4 s | |
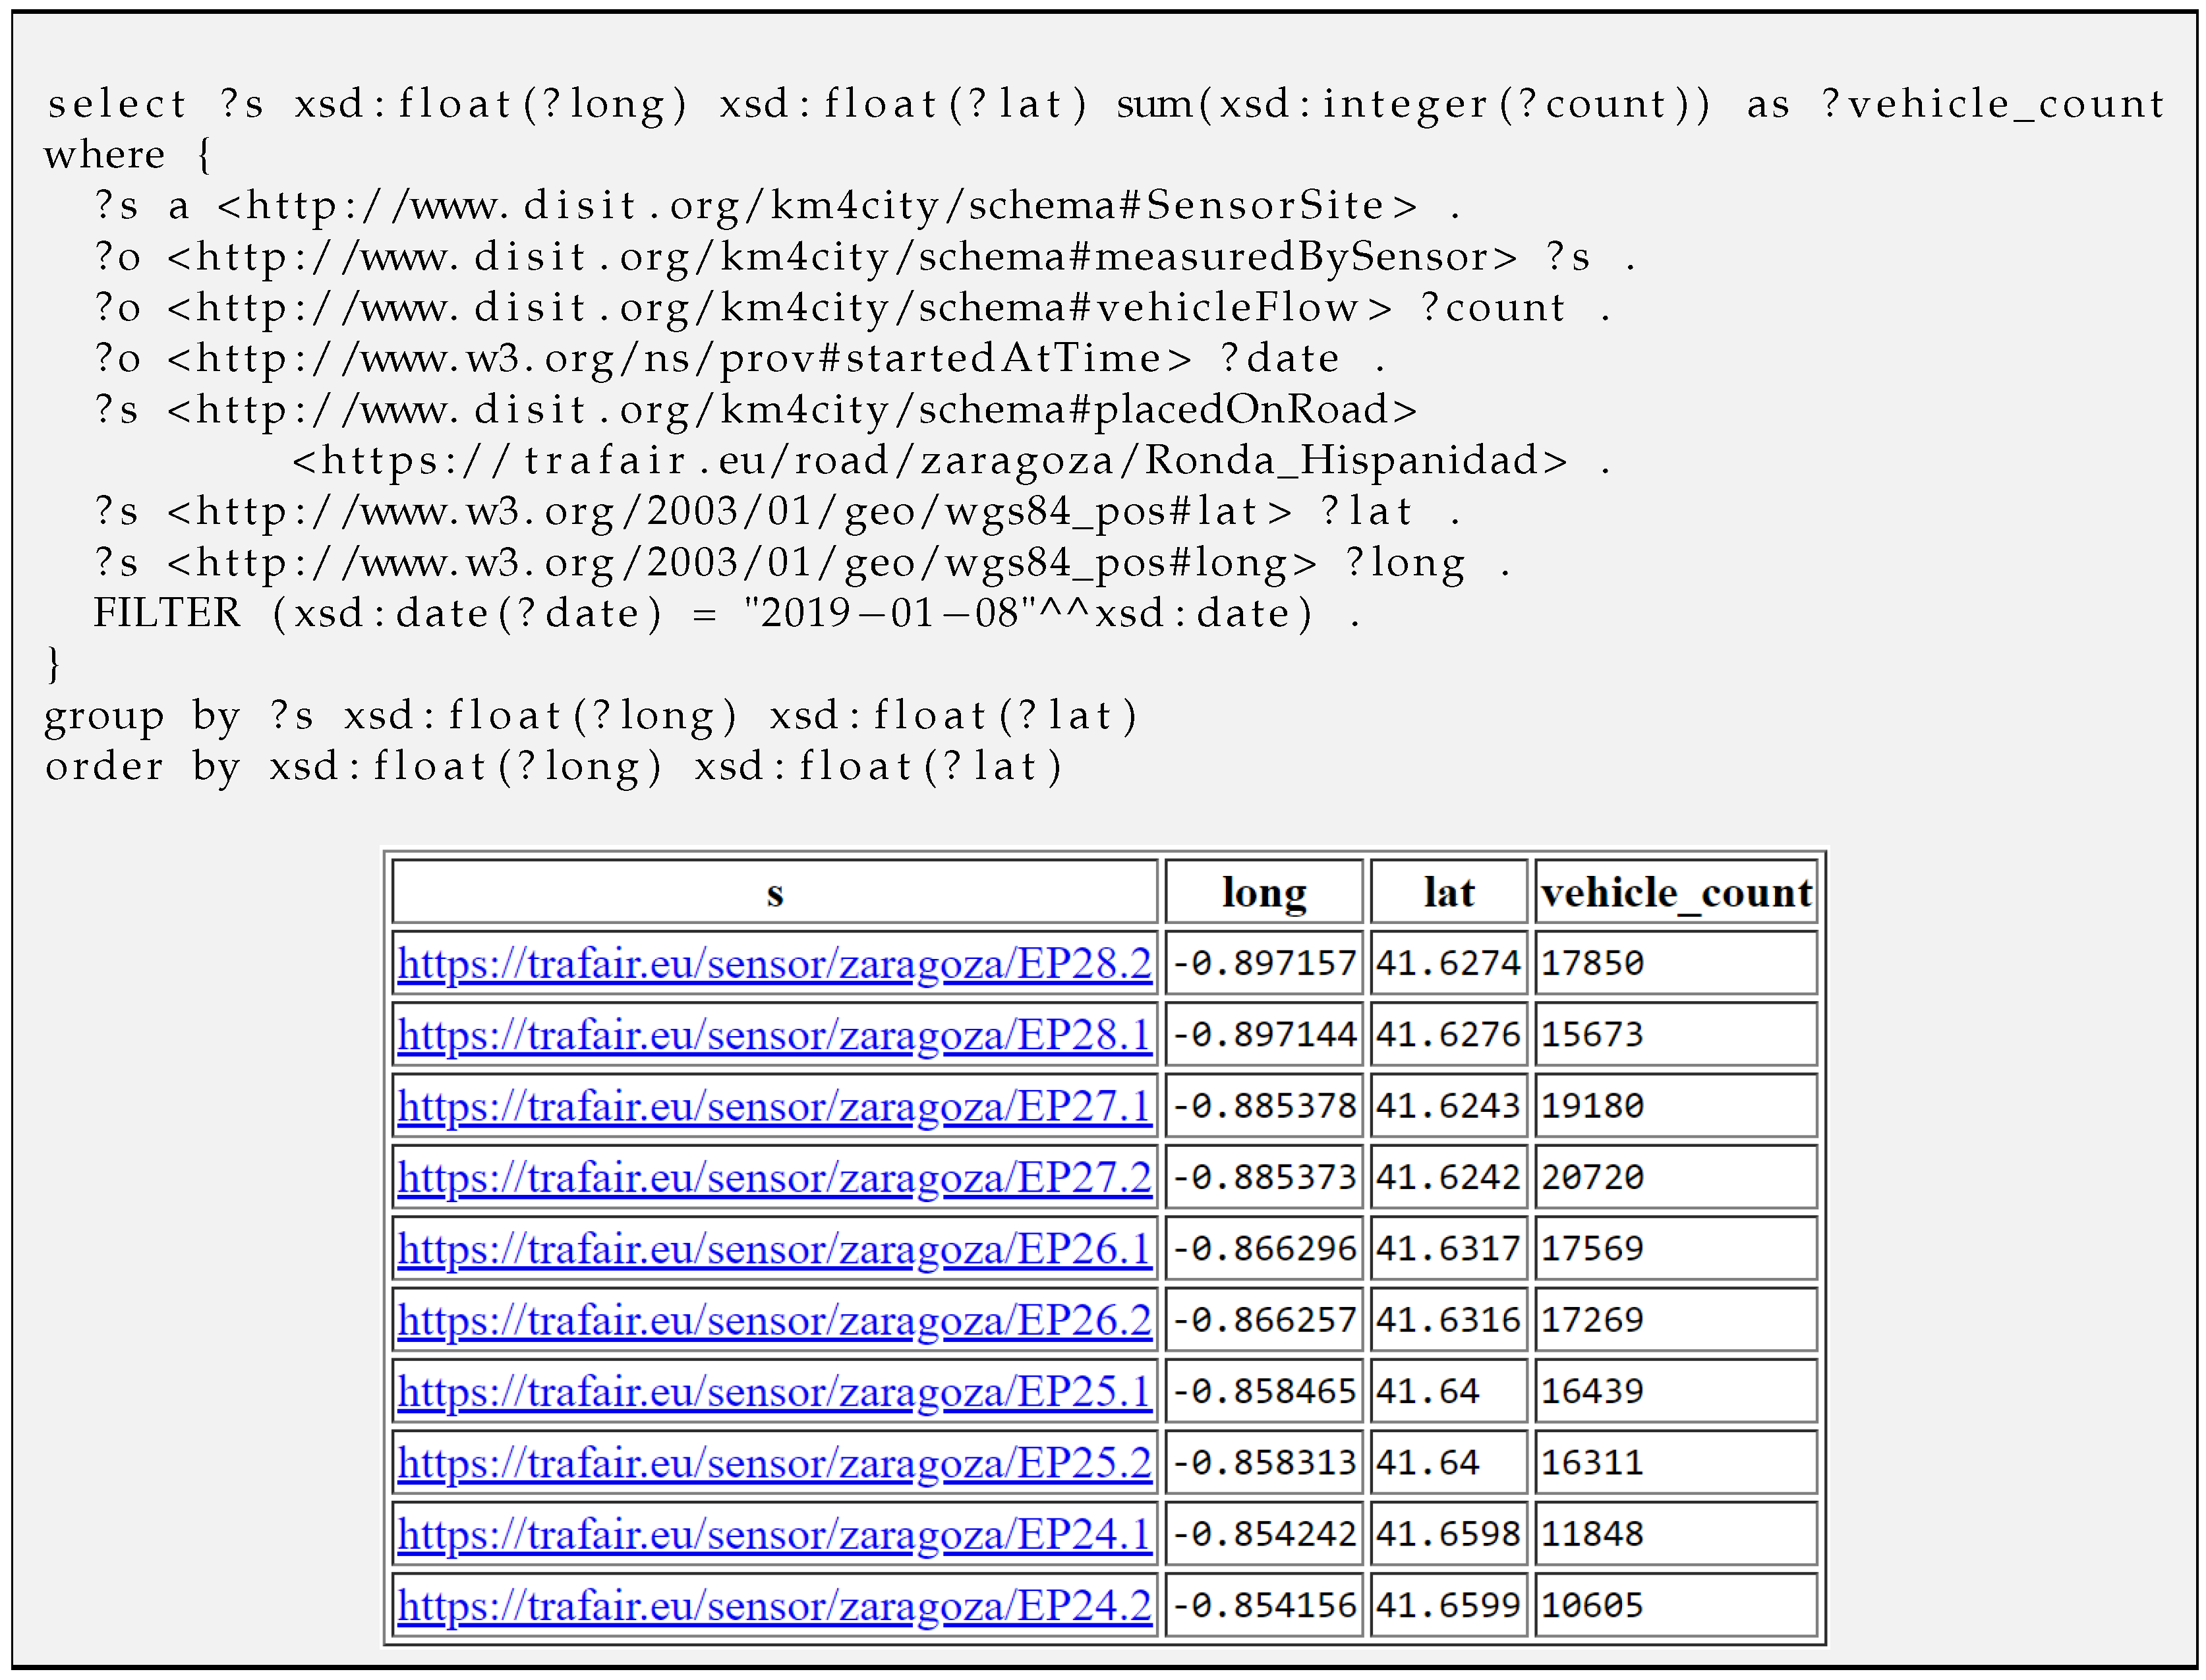
| Query Figure A4 | Number of vehicles counted by sensors on a street | 1.86 s | |
| Query Figure A5 | Number of sensors within the ring road in Modena | 650 ms | GeoSpatial |
© 2020 by the authors. Licensee MDPI, Basel, Switzerland. This article is an open access article distributed under the terms and conditions of the Creative Commons Attribution (CC BY) license (http://creativecommons.org/licenses/by/4.0/).
Share and Cite
Desimoni, F.; Ilarri, S.; Po, L.; Rollo, F.; Trillo-Lado, R. Semantic Traffic Sensor Data: The TRAFAIR Experience. Appl. Sci. 2020, 10, 5882. https://doi.org/10.3390/app10175882
Desimoni F, Ilarri S, Po L, Rollo F, Trillo-Lado R. Semantic Traffic Sensor Data: The TRAFAIR Experience. Applied Sciences. 2020; 10(17):5882. https://doi.org/10.3390/app10175882
Chicago/Turabian StyleDesimoni, Federico, Sergio Ilarri, Laura Po, Federica Rollo, and Raquel Trillo-Lado. 2020. "Semantic Traffic Sensor Data: The TRAFAIR Experience" Applied Sciences 10, no. 17: 5882. https://doi.org/10.3390/app10175882
APA StyleDesimoni, F., Ilarri, S., Po, L., Rollo, F., & Trillo-Lado, R. (2020). Semantic Traffic Sensor Data: The TRAFAIR Experience. Applied Sciences, 10(17), 5882. https://doi.org/10.3390/app10175882