Evolutions of CO2 Adsorption and Nanopore Development Characteristics during Coal Structure Deformation

Abstract
1. Introduction
2. Specimens and Experimental Methods
2.1. Coal Specimens and Their Characteristics
2.1.1. Coal Specimen Collection
2.1.2. Coal Specimen Properties
2.2. Experimental
2.2.1. Adsorption Experiments
- (1)
- Put the coal specimens in the specimen tank and check the air tightness.
- (2)
- The free space volume of specimen tank and reference tank was measured.
- (3)
- Open the water bath heating system and set the experimental temperature to 35 °C.
- (4)
- Open the booster pump and inflation valve and close the balance valve to charge CH4 into the reference tank, and after the pressure is stable, open the balance valve and close the inflation valve. Then, the isothermal adsorption experiment begins.
- (5)
- After adsorption equilibrium, record the experimental equilibrium pressure and adsorption data, and repeat step (4) to obtain the adsorption data of other pressure points. Seven pressure points were set in this experiment, and the pressure balance time was 72 h.
- (6)
- After the completion of the adsorption experiment, open the balance valve and vent valve, and adjust the exhaust speed to make the maximum experimental pressure drop to standard atmospheric pressure within 2 h.
- (7)
- After the experiment, close the booster pump, cylinder valve, and water bath heating system, and take out the coal specimens.
2.2.2. Liquid Nitrogen Adsorption
3. Results and Discussion
3.1. Adsorption Characteristics’ Evolution during Coal Structure Deformation
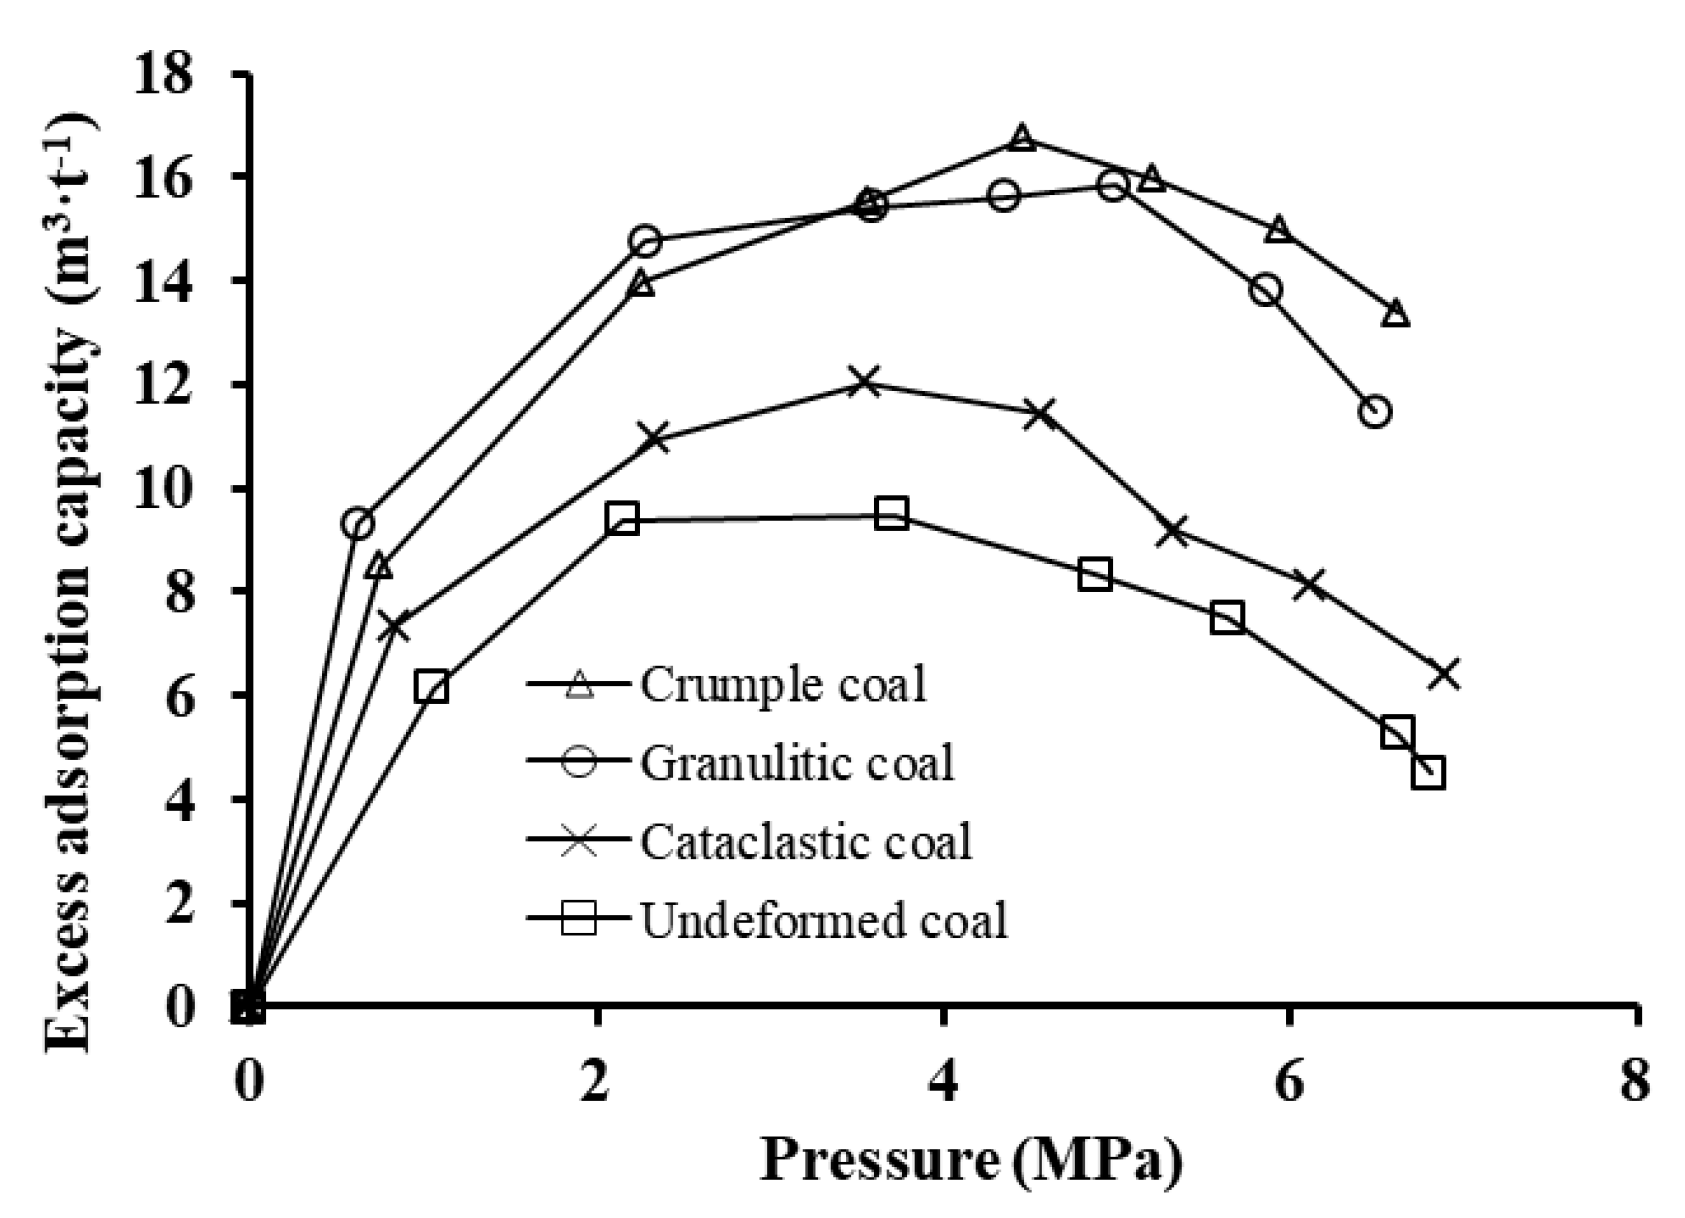
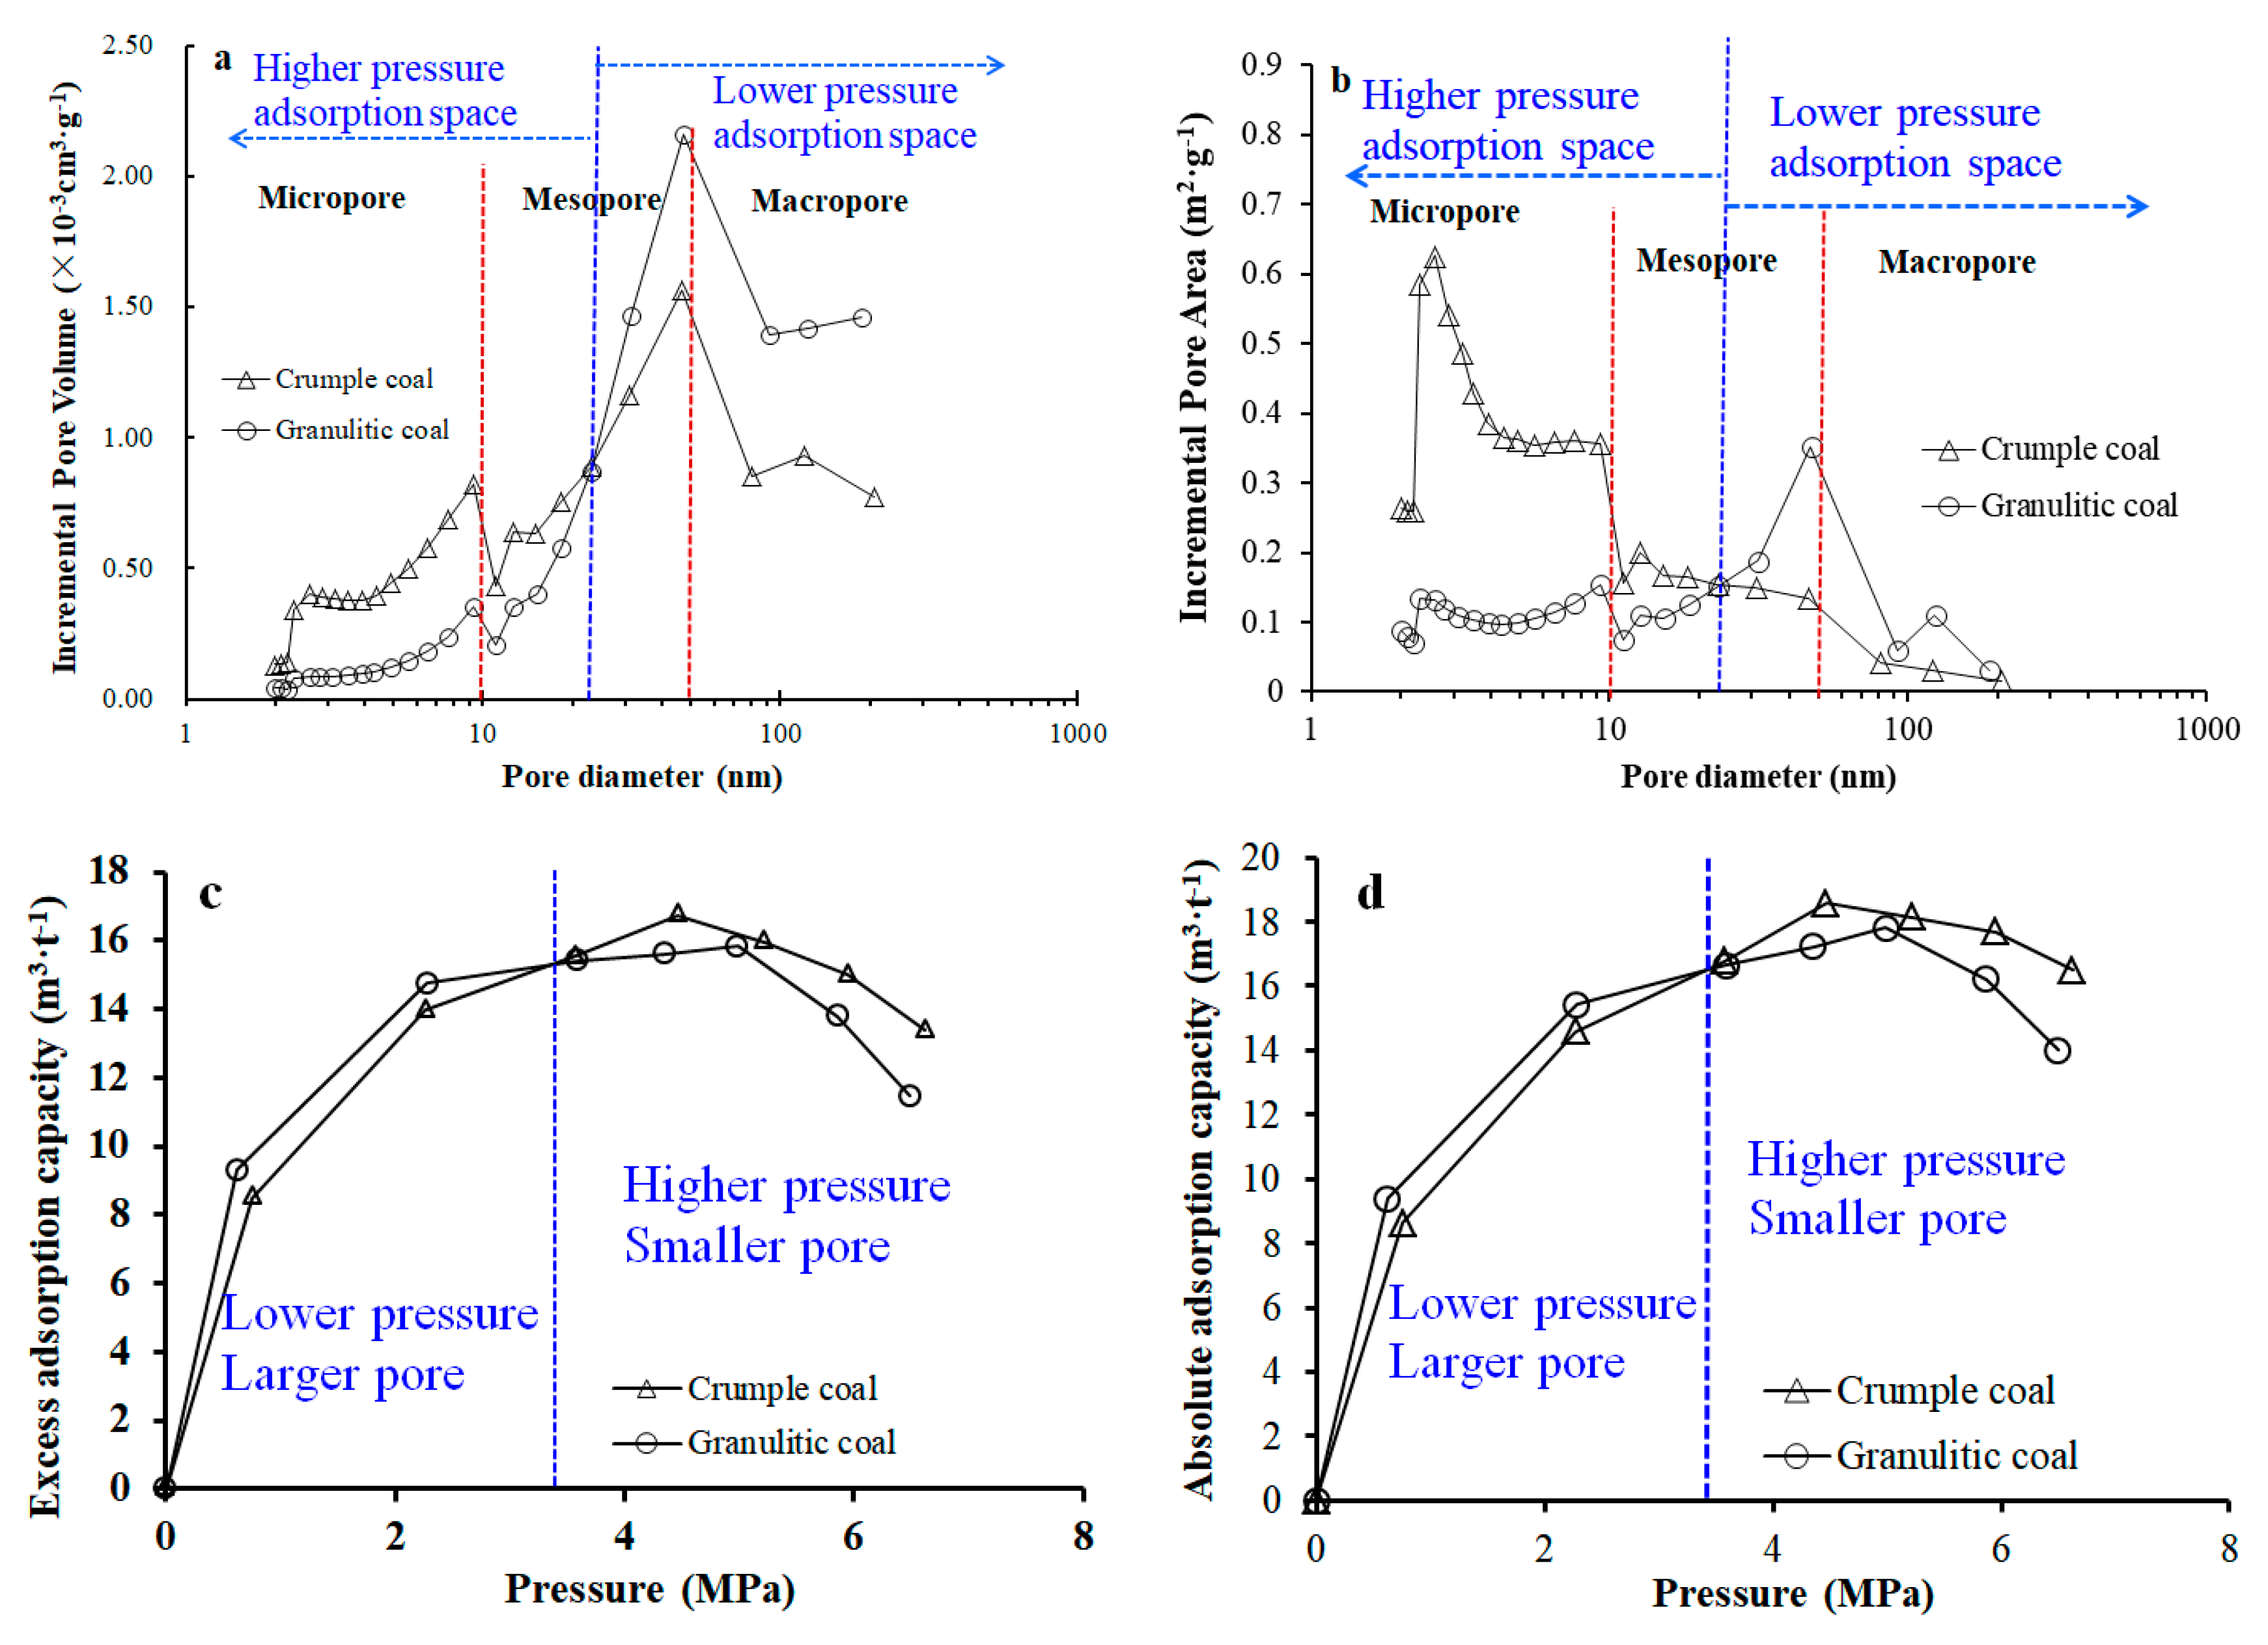
3.1.1. Excess Adsorption Curve
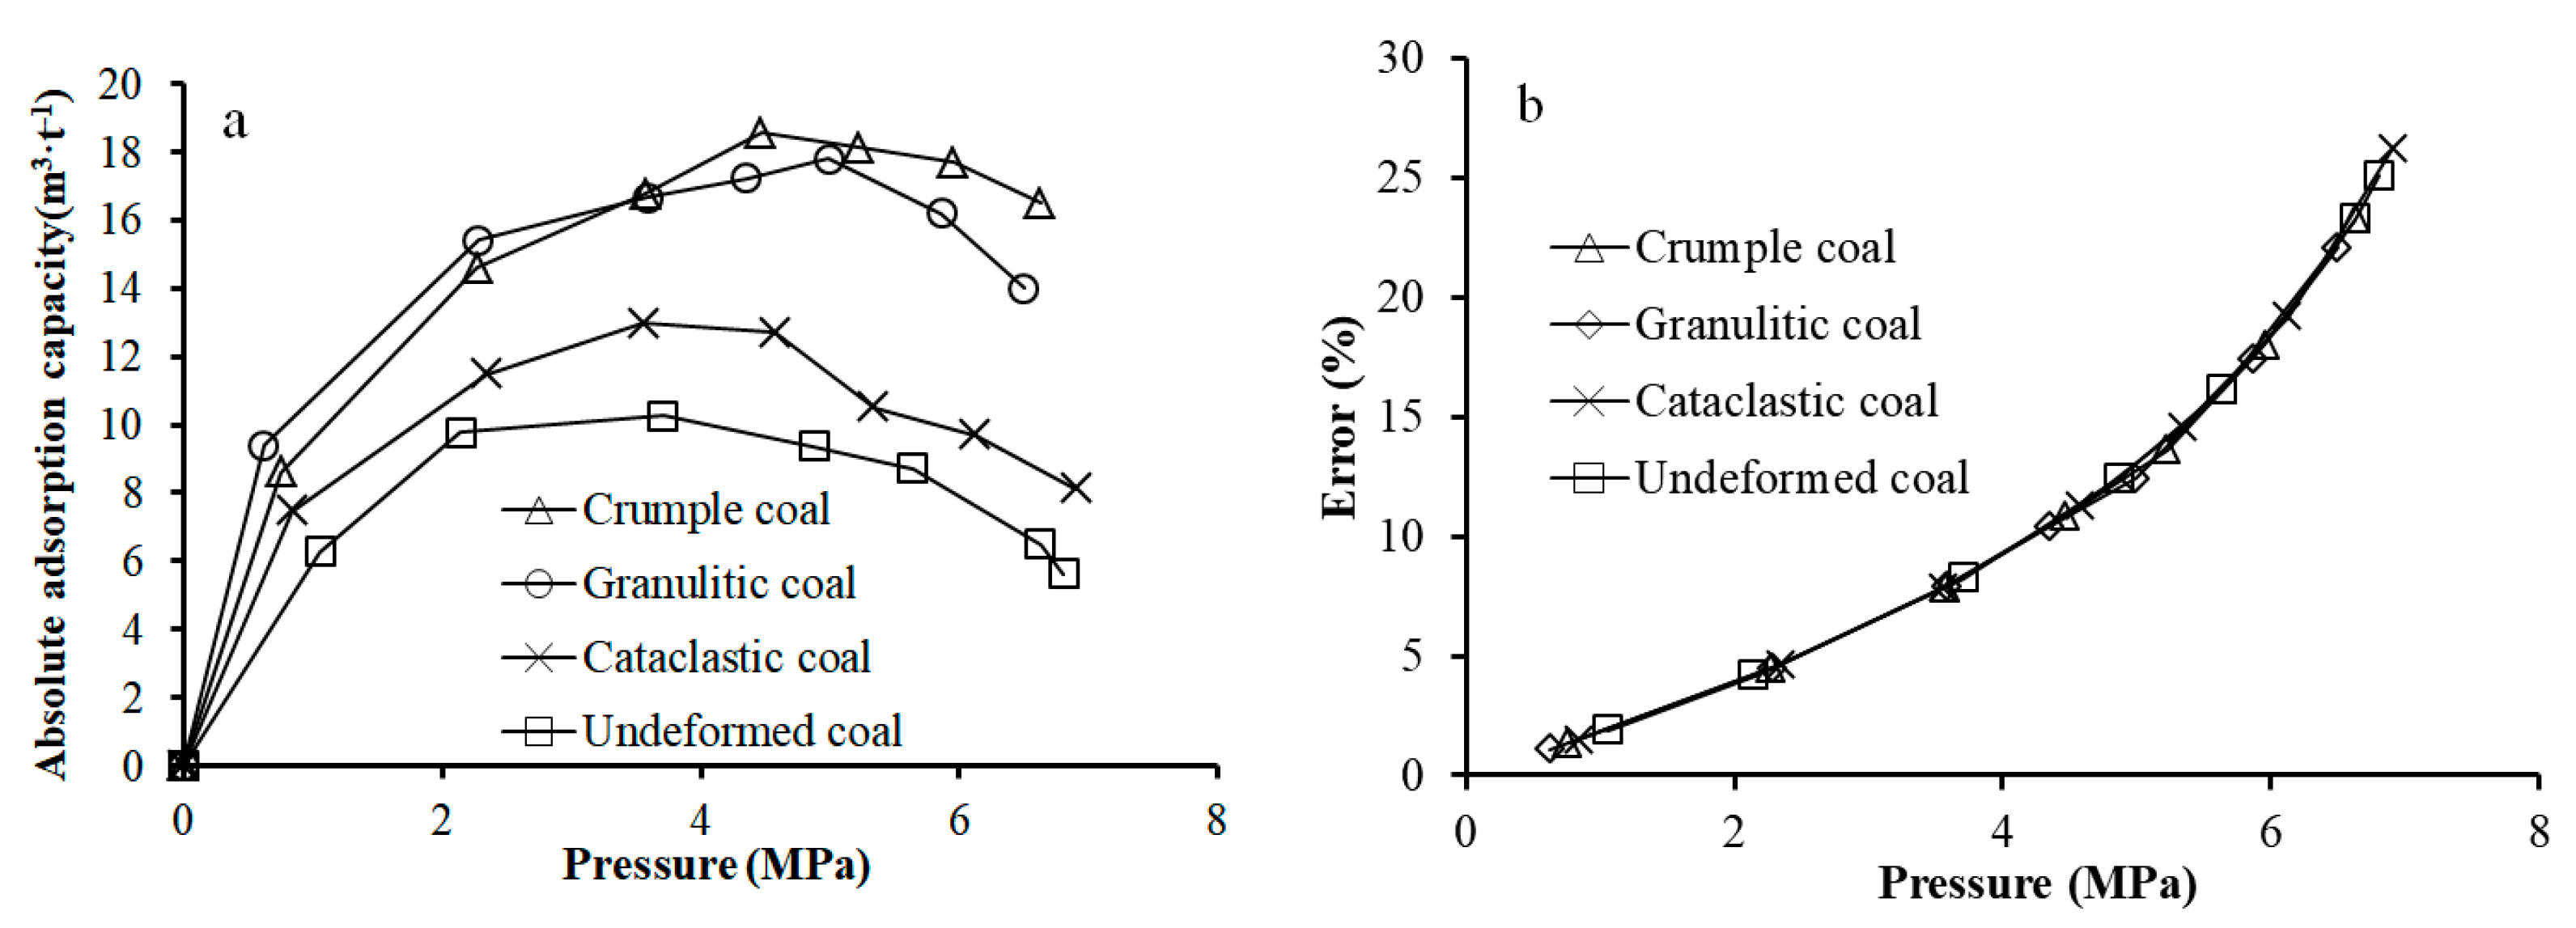
3.1.2. Absolute Adsorption Curve
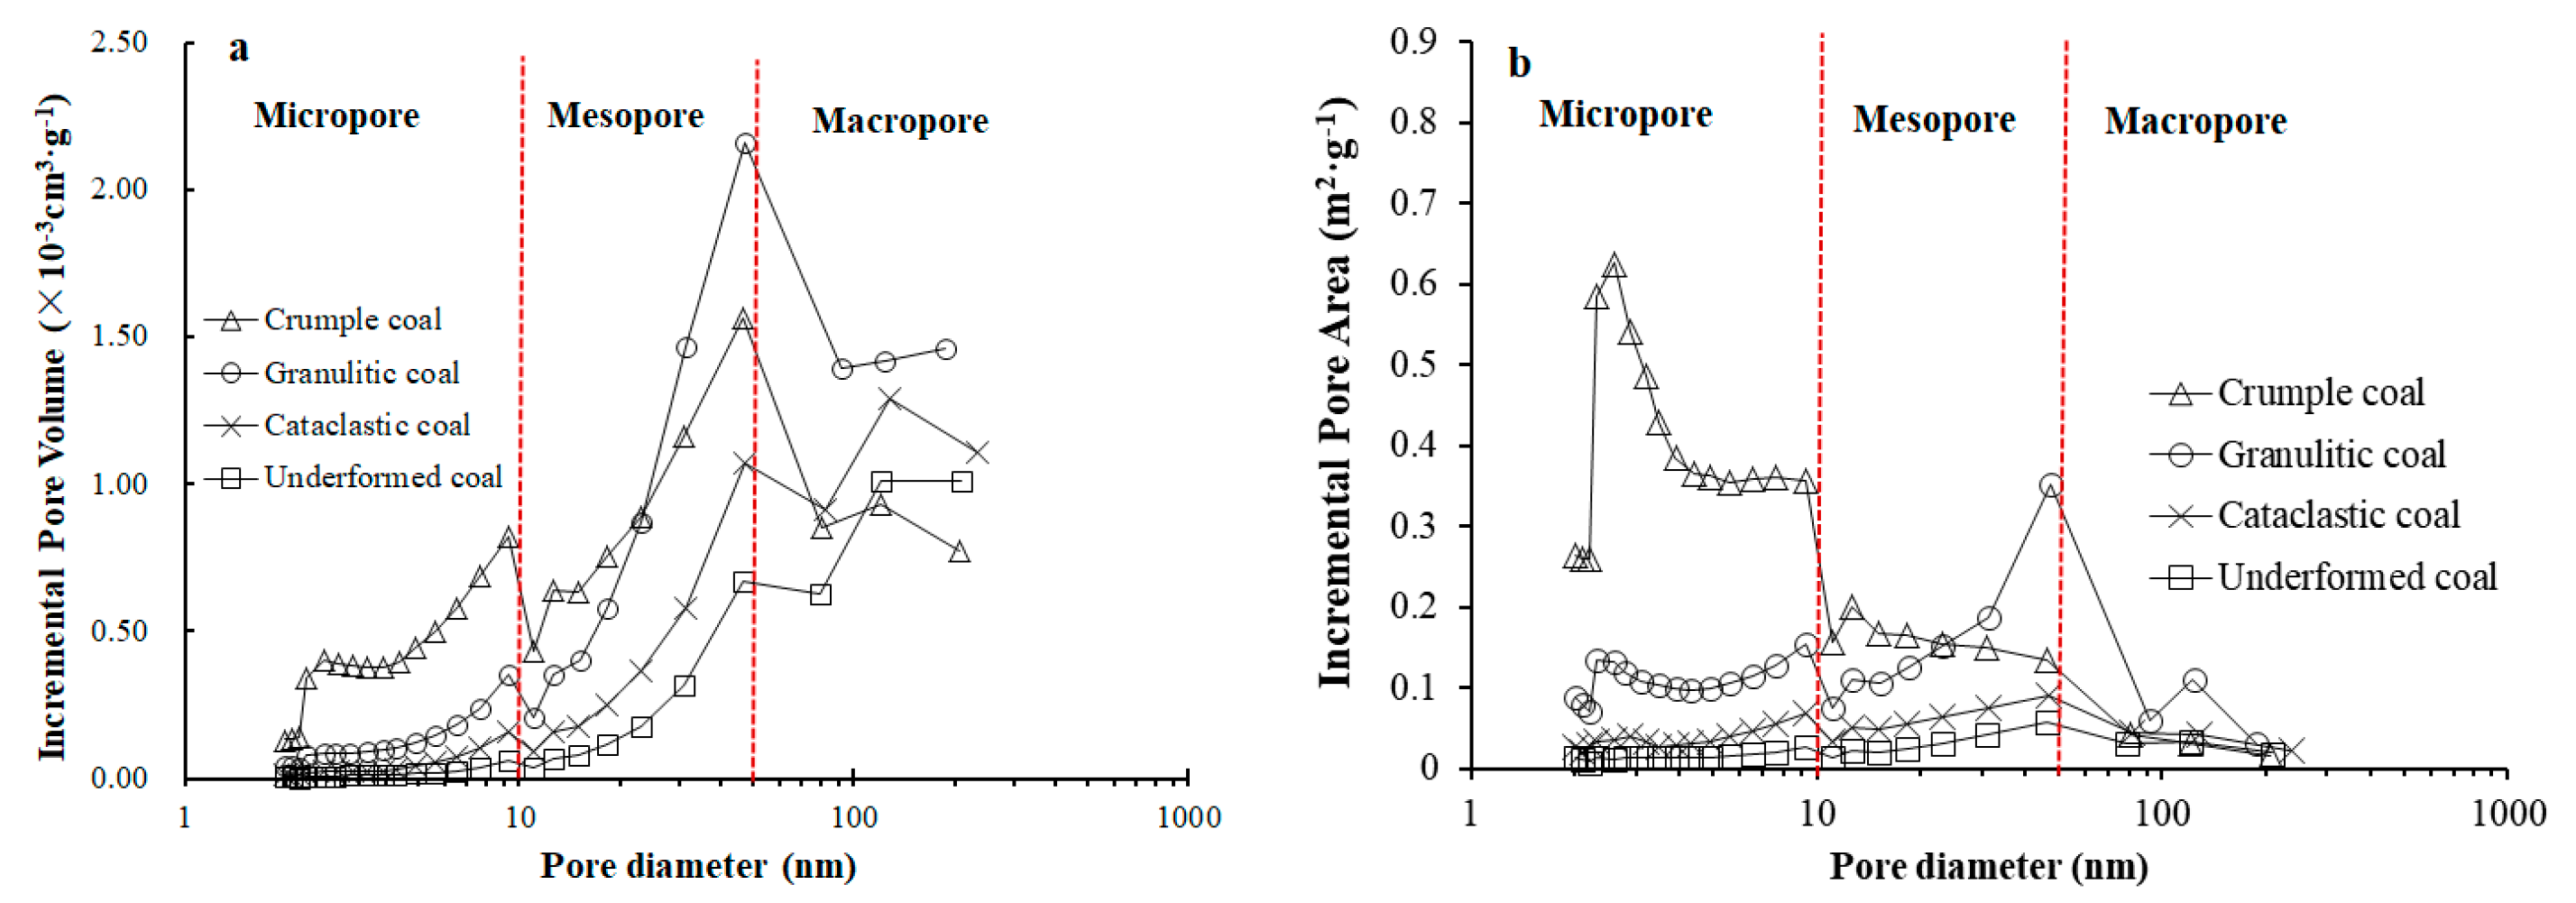
3.2. Nanopore Structural Evolutions during Coal Structure Deformation
3.3. Relationships between CO2 Adsorption Capacity and Nanopore Structure
4. Conclusions
Author Contributions
Funding
Conflicts of Interest
References
- Hou, S.Y. Development status of China coalbed methane industry in recent years. China Coalbed Methane 2018, 15, 42–45. [Google Scholar]
- Gou, D.Y. Research on Structural Physics of Coal and Gas Outburst. Ph.D. Thesis, China University of Mining and Technology, Beijing, China, 1996. [Google Scholar]
- Zhang, H.R. Discussion on the origns of structural coal in Xiahuayuan coal mine. Min. Saf. Environ. Prot. 1999, 5, 31–34. [Google Scholar]
- Ju, Y.W.; Jiang, B.; Hou, Q.L.; Wang, G.L. The new structure-genetic classification system in tectonically deformed coals and its geological significance. J. China Coal Soc. 2004, 29, 513–517. [Google Scholar]
- Jiang, B.; Qin, Y.; Ju, Y.W.; Wang, J.L.; Li, M. The coupling mechanism of the evolution of chemical structure with the characteristics of gas of tectonic coals. Earth Sci. Front. 2009, 16, 262–271. [Google Scholar]
- Zhang, Y.G. Evolution of Deformed Coal and Process of Coal Mechanochemistry. Ph.D. Thesis, Taiyuan University of Technology, Taiyuan, China, 2006. [Google Scholar]
- Xing, W.L. Study on Characteristics of Adsorption/Desorption and Diffusion for CO2, CH4, N2, and Their Mixtures in Coal. Ph.D. Thesis, Dalian University of Technology, Dalian, China, 2016. [Google Scholar]
- Chen, R.; Qin, Y.; Zhang, P.F.; Wang, Y.Y. Changes in pore structure of coal caused by CS2 treatment and its methane adsorption response. Geofluids 2018, 2018, 1–11. [Google Scholar] [CrossRef]
- Zhao, J.C.; Qin, Y.; Shen, J.; Zhou, B.Y.; Li, C.; Li, G. Effects of pore structures of different maceral compositions on methane adsorption and diffusion in anthracite. Appl. Sci. 2019, 9, 5130. [Google Scholar] [CrossRef]
- Castello, D.L. Advances in the study of methane storage in a porous carbon aceous materials. Fuel 2002, 81, 1777–1803. [Google Scholar] [CrossRef]
- Chen, X.J.; Liu, J.; Wang, L.; Qi, L.L. Influence of pore size distribution of different metamorphic grade of coal on adsorption constant. J. China Coal Soc. 2013, 39, 294–300. [Google Scholar]
- Jian, K.; Fu, X.H.; Ding, Y.M.; Wang, H.D.; Li, T. Characteristics of pores and methane adsorption of low-rank coal in China. J. Nat. Gas Sci. Eng. 2015, 27, 207–218. [Google Scholar] [CrossRef]
- Wang, X.H.; Wang, Y.B.; Gao, S.S.; Hong, P.F.; Zhang, M.J. Differences in pore structures and absorptivity between tectonically deformed and undeformed coals. Geol. J. China Univ. 2012, 18, 528–532. [Google Scholar] [CrossRef]
- Li, Y.K. Research on the Methane Adsorption/Desorption/Diffusion Characteristics of Tectonic Coal. Master’s Thesis, Henan Polytechnic University, Jiaozuo, China, 2015. [Google Scholar]
- Donohue, M.D.; Aranovich, G.L. A new classification of isotherms for Gibbs adsorption of gases on solids. Fluid Phase Equil. 1999, 158, 557–563. [Google Scholar] [CrossRef]
- Moffat, D.H.; Weale, K.E. Sorption by coal of methane at high pressures. Fuel 1955, 34, 449–462. [Google Scholar]
- Kim, H.J.; Shi, Y.; He, J.W.; Lee, H.H.; Lee, C.H. Adsorption characteristic of CO2 and CH4 on dry and wet coal from subcritical to supercritical conditions. Chem. Eng. J. 2011, 171, 45–53. [Google Scholar] [CrossRef]
- Cui, Y.J. Adosrption of CH4, N2, CO2, Single and Multicomponent Gas on Coal; Xian Branch, China Coal Researeh Institute: Xian, China, 2003. [Google Scholar]
- Kroos, B.M.; Bergen, F.V.; Gensterblum, Y.; Siemons, N.; Pagnier, H.J.M.; David, P. High-pressure methane and carbon dioxide adsorption on dry and moisture-equilibrated pennsylvanian coals. Int. J. Coal Geol. 2002, 51, 69–92. [Google Scholar] [CrossRef]
- Hall, F.E.; Chunhe, Z.; Gasem, K.A.M.; Robinson, R.L.; Yee, D. Adsorption of pure methane, nitrogen, and carbon dioxide and their binary mixtures on wet Fruitland coal. In Proceedings of the SPE Eastern Regional Conference and Exhibition, Charleston, WV, USA, 8–10 November 1994; pp. 329–344. [Google Scholar]
- Pan, J.N.; Zhu, H.T.; Hou, Q.L.; Wang, H.C.; Wang, S. Macromolecular and pore structures of Chinese tectonically deformed coal studied by atomic force microscopy. Fuel 2015, 139, 94–101. [Google Scholar] [CrossRef]


| Coal Specimen | Type | Ro,max/% | Proximate Analysis (wt.%) | Maceral Analysis (vol.%) | Ultimate Analysis (wt.%) d | ||||||||
|---|---|---|---|---|---|---|---|---|---|---|---|---|---|
| Mad | Ad | VMdaf | V | E | I | C | H | O | N | S | |||
| S1 | Undeformed coal | 0.90 | 2.21 | 11.47 | 34.06 | 83.21 | 2.37 | 8.82 | 77.25 | 4.28 | 16.88 | 1.31 | 0.28 |
| S2 | Cataclastic coal | 0.96 | 1.82 | 8.92 | 33.14 | 82.33 | 2.56 | 7.62 | 77.61 | 4.32 | 16.42 | 1.26 | 0.39 |
| S3 | Granulitic coal | 1.17 | 2.04 | 10.16 | 31.68 | 82.75 | 2.36 | 7.14 | 76.39 | 4.23 | 17.94 | 1.24 | 0.20 |
| S4 | Crumple coal | 1.05 | 2.36 | 9.54 | 30.27 | 85.94 | 4.10 | 5.19 | 75.62 | 4.30 | 18.64 | 1.29 | 0.15 |
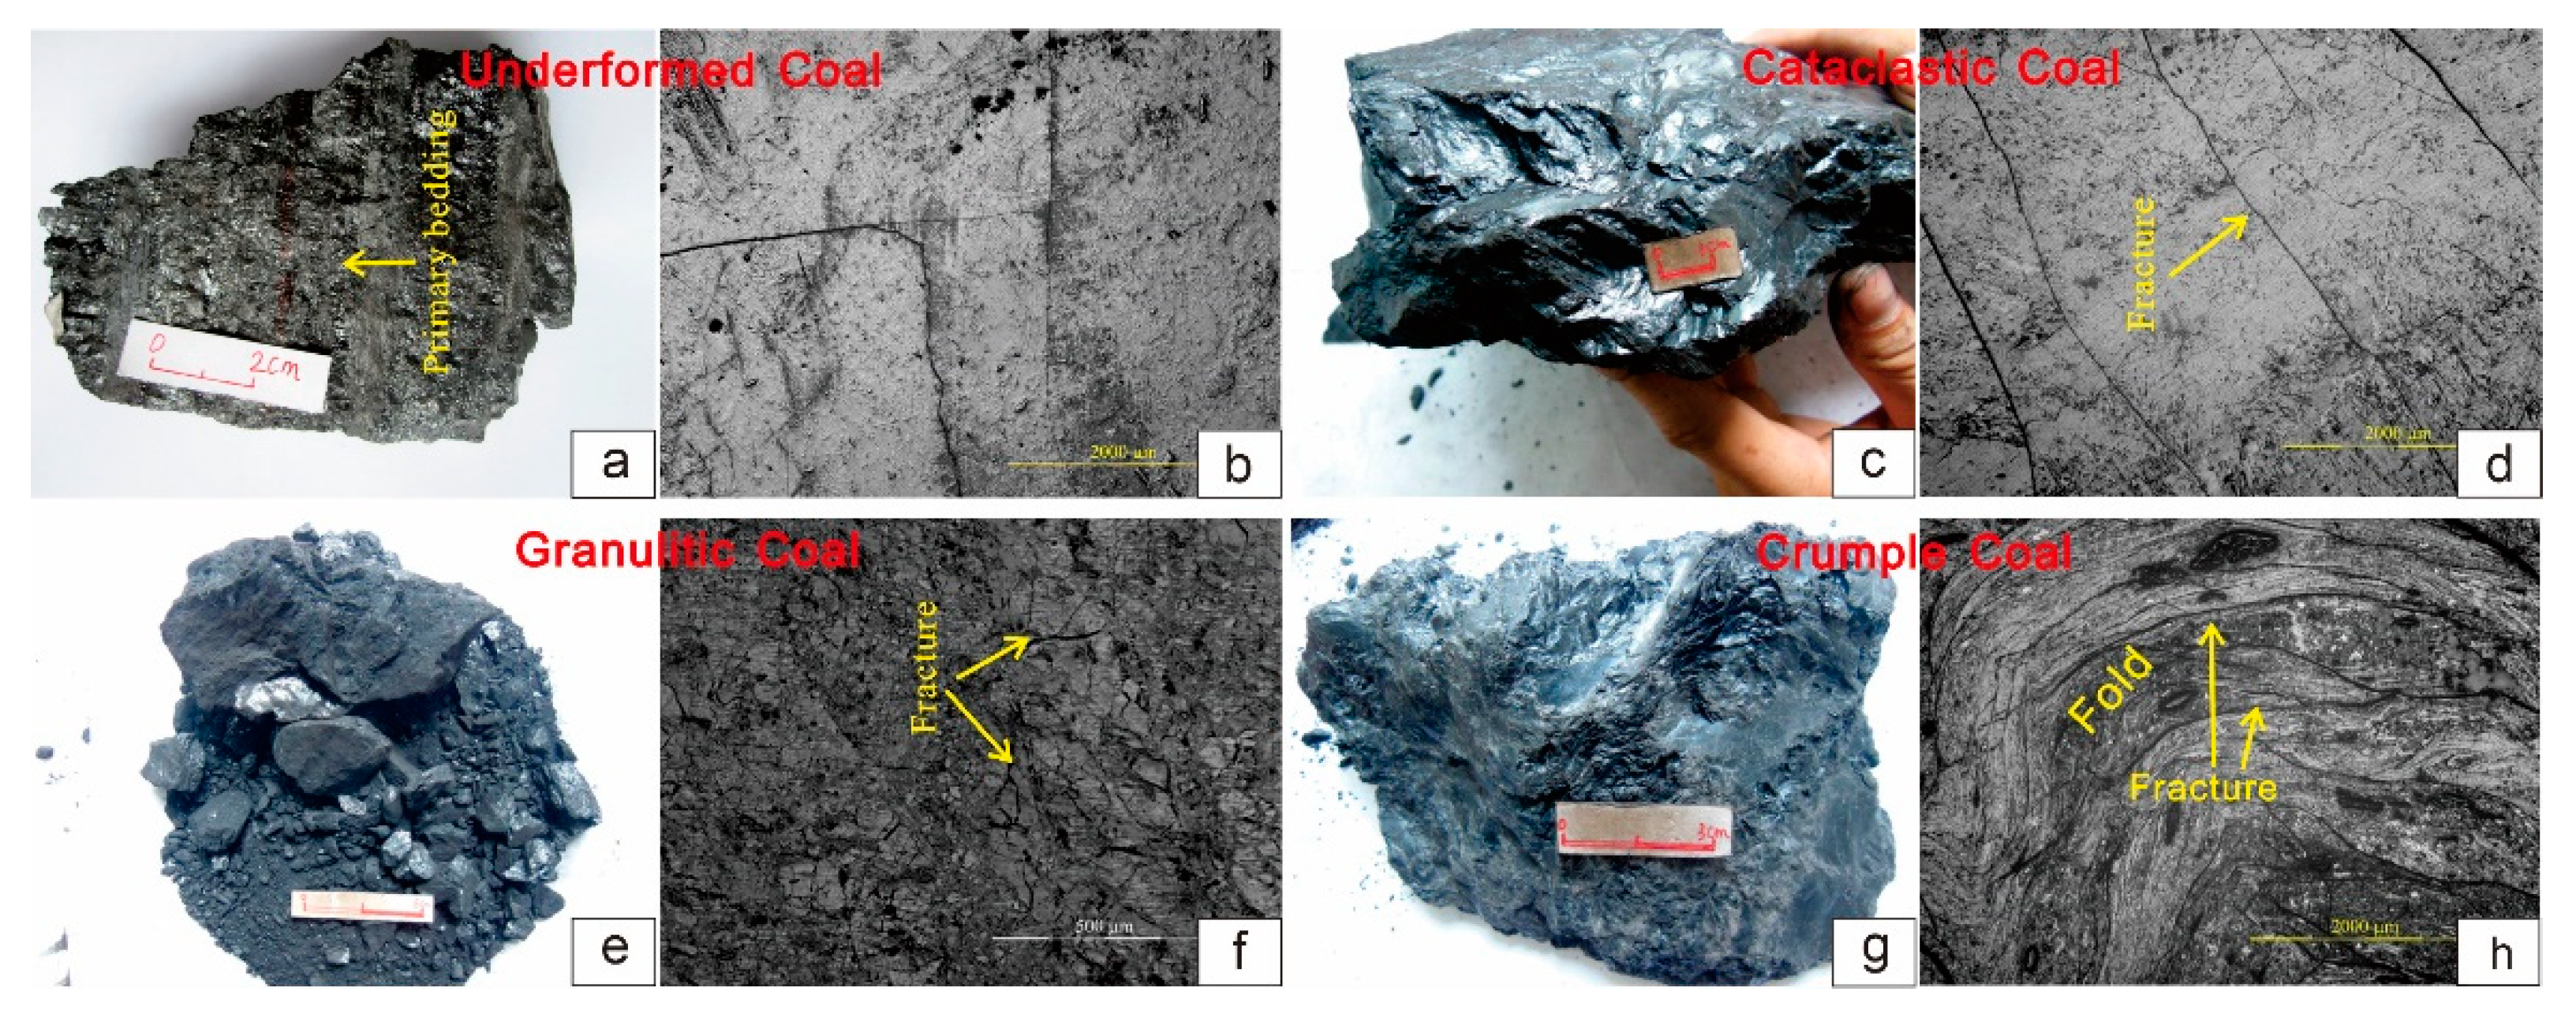
| Specimen No. | Tectonic Coal Type | Deformation Degree | Deformation Series | Macro Characteristics | Micro Characteristics |
|---|---|---|---|---|---|
| S1 | Undeformed coal | No or weak deformation | Complete coal body structure, well preserved primary banded structure, and easily distinguished petrographic constituent (Figure 2a) | Rare structural fractures (Figure 2b) | |
| S2 | Cataclastic coal | Weak deformation | Brittle deformation | Damaged structure, while visible primary banded structure, and developed fractures (Figure 2c) | A set of structural fractures developed (Figure 2d) |
| S3 | Granulatic coal | Medium deformation | Completely destroyed primary structure; broken coal body with the particle size ranging from millimeter to centimeter scale (Figure 2e) | Extremely developed micro fractures, difficult tracing of fractures with undirectionality (Figure 2f) | |
| S4 | Crumple coal | Strong deformation | Ductile deformation | Disappeared primary structure of the coal body, presence of irregular arc or twisting shapes, similar to fold shape, and abnormally developed fractures (Figure 2g) | Microfold shape and abnormally developed microfracture (Figure 2h) |
© 2020 by the authors. Licensee MDPI, Basel, Switzerland. This article is an open access article distributed under the terms and conditions of the Creative Commons Attribution (CC BY) license (http://creativecommons.org/licenses/by/4.0/).
Share and Cite
Wang, L.; Long, Z. Evolutions of CO2 Adsorption and Nanopore Development Characteristics during Coal Structure Deformation. Appl. Sci. 2020, 10, 4997. https://doi.org/10.3390/app10144997
Wang L, Long Z. Evolutions of CO2 Adsorption and Nanopore Development Characteristics during Coal Structure Deformation. Applied Sciences. 2020; 10(14):4997. https://doi.org/10.3390/app10144997
Chicago/Turabian StyleWang, Linlin, and Zhengjiang Long. 2020. "Evolutions of CO2 Adsorption and Nanopore Development Characteristics during Coal Structure Deformation" Applied Sciences 10, no. 14: 4997. https://doi.org/10.3390/app10144997
APA StyleWang, L., & Long, Z. (2020). Evolutions of CO2 Adsorption and Nanopore Development Characteristics during Coal Structure Deformation. Applied Sciences, 10(14), 4997. https://doi.org/10.3390/app10144997