Article

Numerical and Experimental Investigations of Laser Metal Deposition (LMD) Using STS 316L

School of Aerospace and Mechanical Engineering, Korea Aerospace University, 76 Hanggongdaehak-ro, Deogyang-gu, Goyang-si, Gyeonggi-do 10540, Korea
*
Author to whom correspondence should be addressed.
Equally contributed as first authors.
Appl. Sci. 2020, 10(14), 4874; https://doi.org/10.3390/app10144874
Submission received: 14 June 2020 / Revised: 7 July 2020 / Accepted: 8 July 2020 / Published: 16 July 2020
(This article belongs to the Special Issue Microstructural and Mechanical Properties of Metallic Materials)

Abstract

:
This study aimed to understand the effect of heat accumulation on microstructure formation on STS 316L during multilayer deposition by a laser metal deposition (LMD) process and to predict the microstructure morphology. A comprehensive experimental and numerical study was conducted to quantify the solidification parameters (temperature gradient (G) and growth rate (R)) in the LMD multilayer deposition process. During deposition, the temperature profile at a fixed point in the deposit was measured to validate the numerical model, and then the solidification parameters were quantified using the model. Simultaneously, the microstructure of the deposit was investigated to confirm the microstructure morphology. Then, a relationship between the microstructure morphology and the G/R was proposed using a solidification map. The findings of this study can guide the design of scanning paths to produce deposits with a uniform structure.

1. Introduction

In the multilayer deposition process of metals using additive manufacturing (AM) technology, a heat-accumulation phenomenon occurs owing to the repeated heat input from the deposition of each layer. Researchers have been concerned by the changes in the cooling rate of each layer due to this accumulated heat because these changes have a significant influence on the formation of microstructures that, in turn, affect the mechanical properties of the deposit [1,2,3,4,5,6].
Solidification parameters such as the temperature gradient (G) and growth rate (R) determine the solidification characteristics. These parameters significantly influence the formation of microstructures and the mechanical properties of the deposit. During the deposition process, the solidification parameters vary in each layer of the deposit depending on the accumulated heat from the repetitive heat input, and these variations cause differences in the mechanical properties between layers. Therefore, it is necessary to quantify the solidification parameters for a structure with uniform properties. However, it is not easy to calculate or measure quantitative information about the solidification parameters during the deposition process, and repeated experiments require considerable time and cost.
To overcome these shortcomings, various types of models can be utilized [7,8,9,10,11]. For example, a numerical model based on previous studies [7,10,11] can be used as an alternative means to obtain quantitative information on solidification parameters. Several researchers have conducted numerical studies on the calculation of the solidification parameters. Bertoli et al. [12] studied the relationship between the solidification parameters and the microstructure of multilayer deposits in a powder bed fusion (PBF) process by using a laser heat source and STS 316L powder. They verified the numerical model by comparing the simulation results with calculated solidification rates obtained by using a high-speed camera. They also derived a relationship between the G/R and the resulting morphologies. Du et al. [13] studied the relationship between the G/R and the microstructure in laser-based AM by using Inconel 625 powder. They verified the numerical model by comparing the morphology of the microstructure of real specimens with simulation results. They stated that as the number of tracks increased, many columnar dendrites were formed owing to the decrease in G/R from the center of the melt pool to the edge. Knapp et al. [14] studied the temperature profile, cooling rate, and solidification parameters of the deposit by varying the process parameters in a laser metal deposition (LMD) single-layer deposition process by using STS 316L and Alloy 800H. They verified the numerical model by comparing the experimentally obtained cross-section size (height and width) of the specimen with that calculated through a simulation. They stated that as the laser power increased, the cooling rate and G/R decreased, the secondary dendrite arm spacing (SDAS) tended to increase slightly, and hardness tended to decrease slightly. Huang et al. [15] studied the relationship between G, R, and the microstructure in an LMD single-layer deposition process by using STS 316L and Inconel 625 powder. They validated the numerical model by comparing the simulation results with the temperature of the molten pool surface as measured by a thermal imaging camera. They reported that finer microstructures formed as the value of the cooling rate increased from the bottom to the top in the layer.
In the aforementioned studies, G and R were quantified in a single layer. In addition, the microstructure morphology and cross-sectional size of the deposit were used to verify the numerical model without temperature information. However, for multilayer deposits, it is necessary to acquire an accurate temperature history of the deposits to derive solidification parameters, such as G and R, that determine the final solidified microstructure.
Therefore, the present study aims to derive a quantitative relationship between the microstructure and the solidification parameters for each layer through a numerical model that considers the heat accumulation in the LMD multilayer deposition process. As a result, solidification parameter guidelines for the design/control of the process parameters are suggested. For this purpose, the temperature profile at a fixed point on the deposit was measured in real time by using a pyrometer during deposition with STS 316L powder. A numerical model was developed to quantify G and R of the deposit based on the measured temperature profile. Then, the relationship between the calculated G and R values from the numerical model and microstructure was analyzed. Based on this analysis, practical guidelines for the change in microstructure morphology due to G/R during the deposition process were suggested.
The rest of this paper is organized as follows. Section 2 and Section 3 describe the experimental procedures and numerical models, respectively. Section 4 presents the experimental results. Finally, Section 5 presents the conclusions of this study.

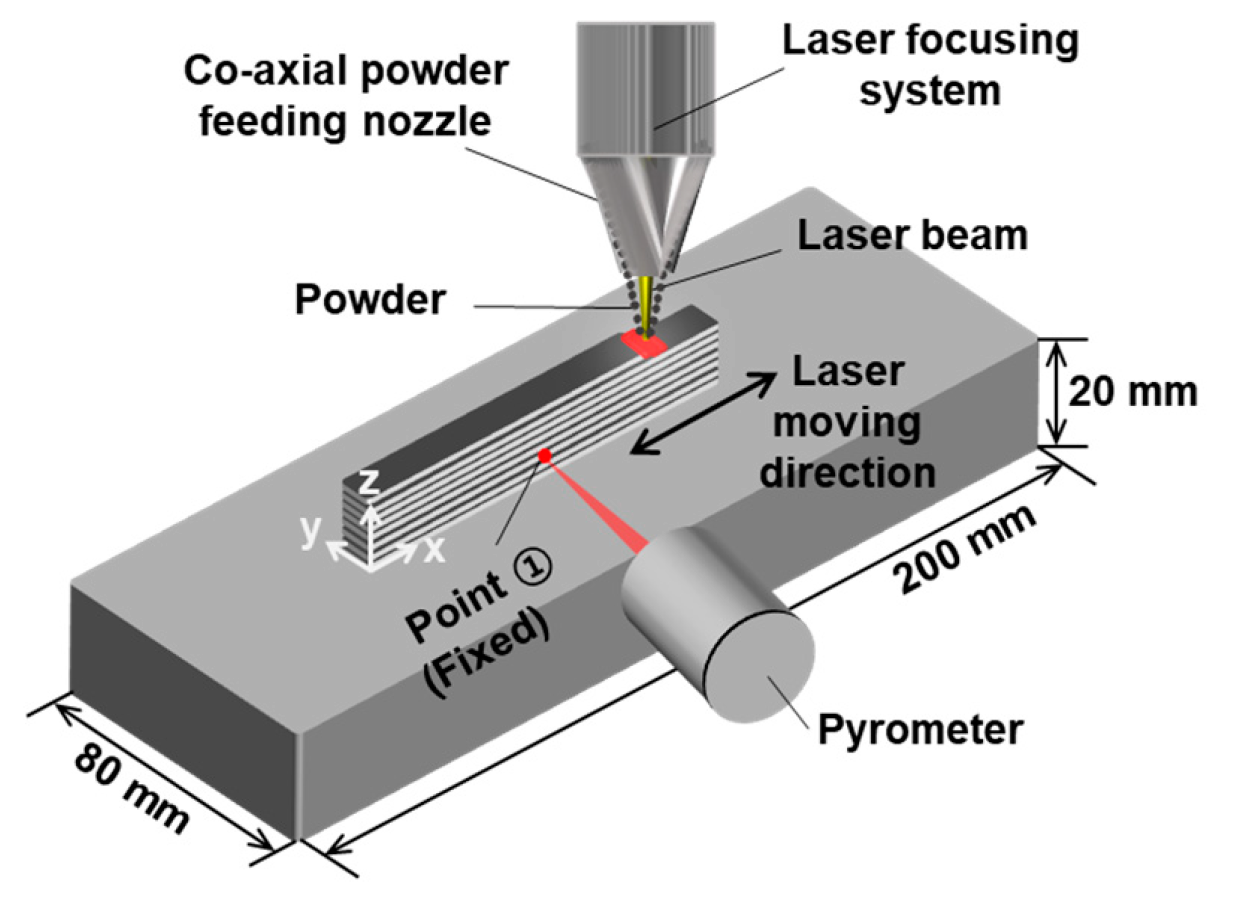
2. Experimental Procedure
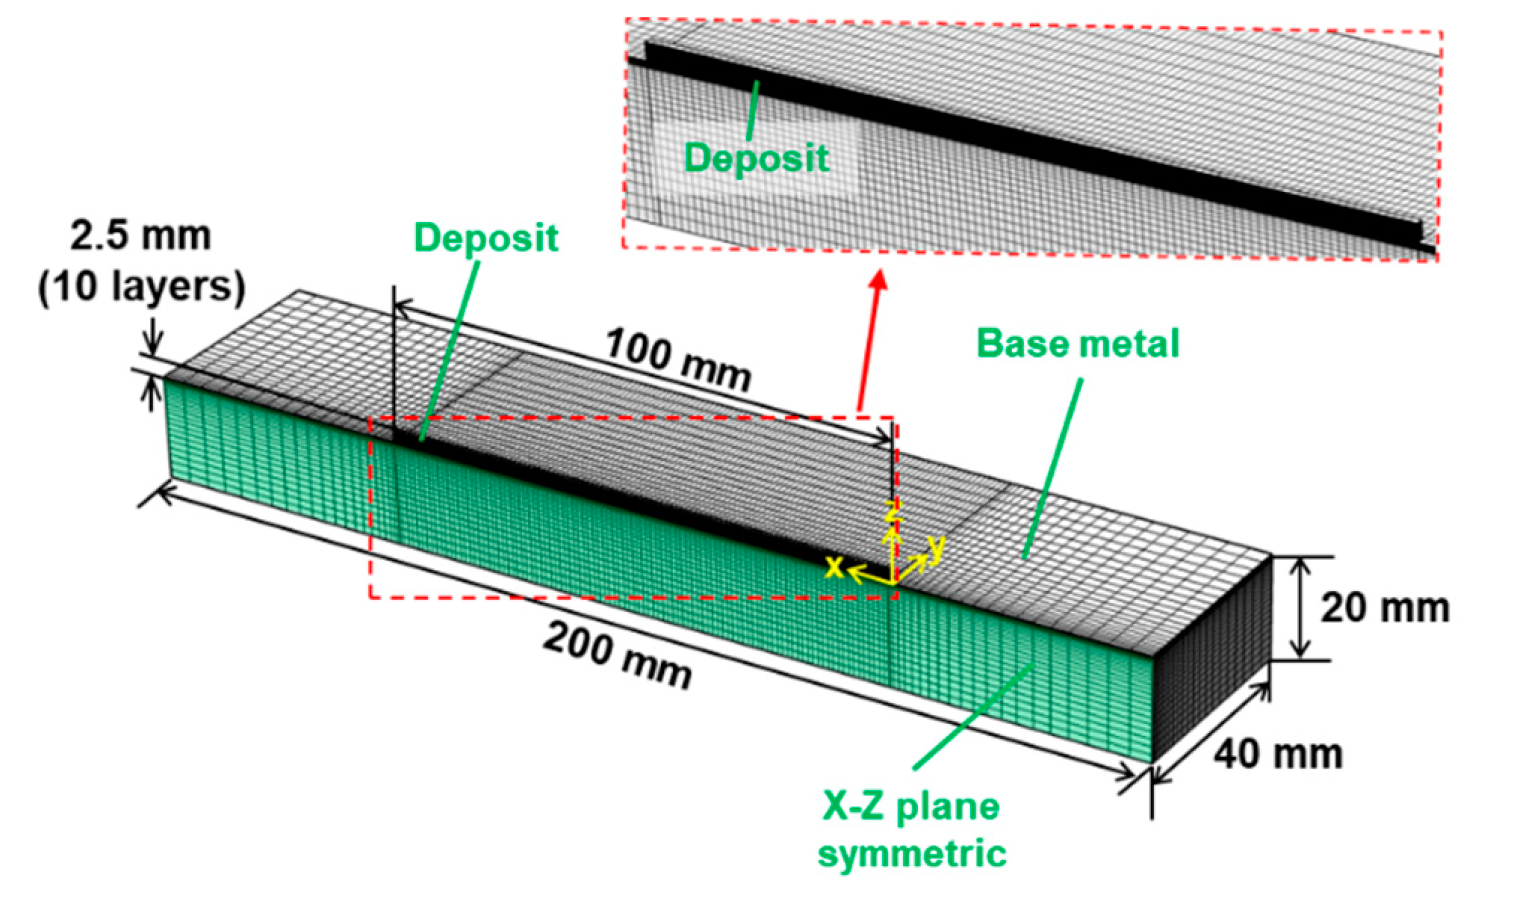
Figure 1 shows a schematic diagram of the experimental setup for the LMD process. A high-power fiber laser (IPG Photonics, Oxford, USA) was used as the heat source. The laser head was moved in a zig-zag pattern, and deposition was performed layer-by-layer with no interlayer time. The powder was supplied in real time onto the substrate coaxially with the laser. An STS 316L substrate (POSCO, Pohang, Republic of Korea) with dimensions of 200 × 80 × 20 mm and gas-atomized STS 316L powder with a particle diameter of 53–106 µm (Titd metal materials, Changsha, China) were used for deposition. Table 1 shows the chemical compositions of the substrate and powder, and Table 2 shows the optimized process parameters based on prior experiments. During the deposition process, the temperature was measured in real time by using a pyrometer (LumaSense Technologies GmbH, Frankfurt, Germany) that can measure temperatures between 580 and 3300 °C. The pyrometer was fixed at point ① in Figure 1 (located at 50 mm in the +x direction and 0.8 mm in the +z direction). The emissivity of the pyrometer was suitably set for solid-state STS 316L.

3. Numerical Model

In this study, a finite element (FE) model was developed to calculate the solidification parameters. The laser heat source has a Gaussian beam and is mathematically expressed as follows [16,17,18]:
I = P π r 2 e x p [ ( x v t ) 2 + y 2 r 2 ] ,
where P is the power of the laser; r, the radius of the laser beam; v, the scanning velocity of the laser beam; and t, the scanning time.
The deposition process is modeled as transient heat transfer with a moving heat source; the three-dimensional heat transfer equation is expressed as follows:
( ρ C p T ) t = x ( k T x ) + y ( k T y ) + z ( k T z ) + a × I ,
where ρ is the mass density; Cp, the heat capacity; T, the unknown temperature; t, the time; k, the conductivity; and a, the laser absorptivity. The initial temperature, T0, at time t = 0 is a room temperature of 27 °C.
The boundary between the deposit and the substrate surface was considered to be conductive, whereas the rest of the surface boundary was considered to be radiative and convective [6]. Boundary conditions such as heat conduction, radiation, and convection are applied as follows:
k s T S = q h ( T T 0 ) σ ε ( T 4 T 0 4 ) ,
where ks is the thermal conductivity at the surface of the base metal, q is the input heat flux, h is the convection heat transfer coefficient, σ is the Stefan–Boltzmann constant, and ε is the surface emissivity. The thermophysical properties of STS 316L, including the density, specific heat, and thermal conductivity, can be found elsewhere [14,19]. To minimize the computational load for designing the process parameters, such as the scanning path, the flow of the molten pool and metal transfer are not considered.
Figure 2 shows the mesh of the full-scale numerical model used in this study. To reduce the simulation time, a symmetric half model of the deposit to the X–Z plane was applied. Further, a non-uniform mesh was applied to increase the simulation accuracy and reduce the simulation time [13,20]. The deposit part was composed of a fine hexahedral mesh with a size of 0.0375 mm. The mesh in the base metal zone gradually became coarser as it moved away from the deposit part. The total number of elements in the model was 800,000.

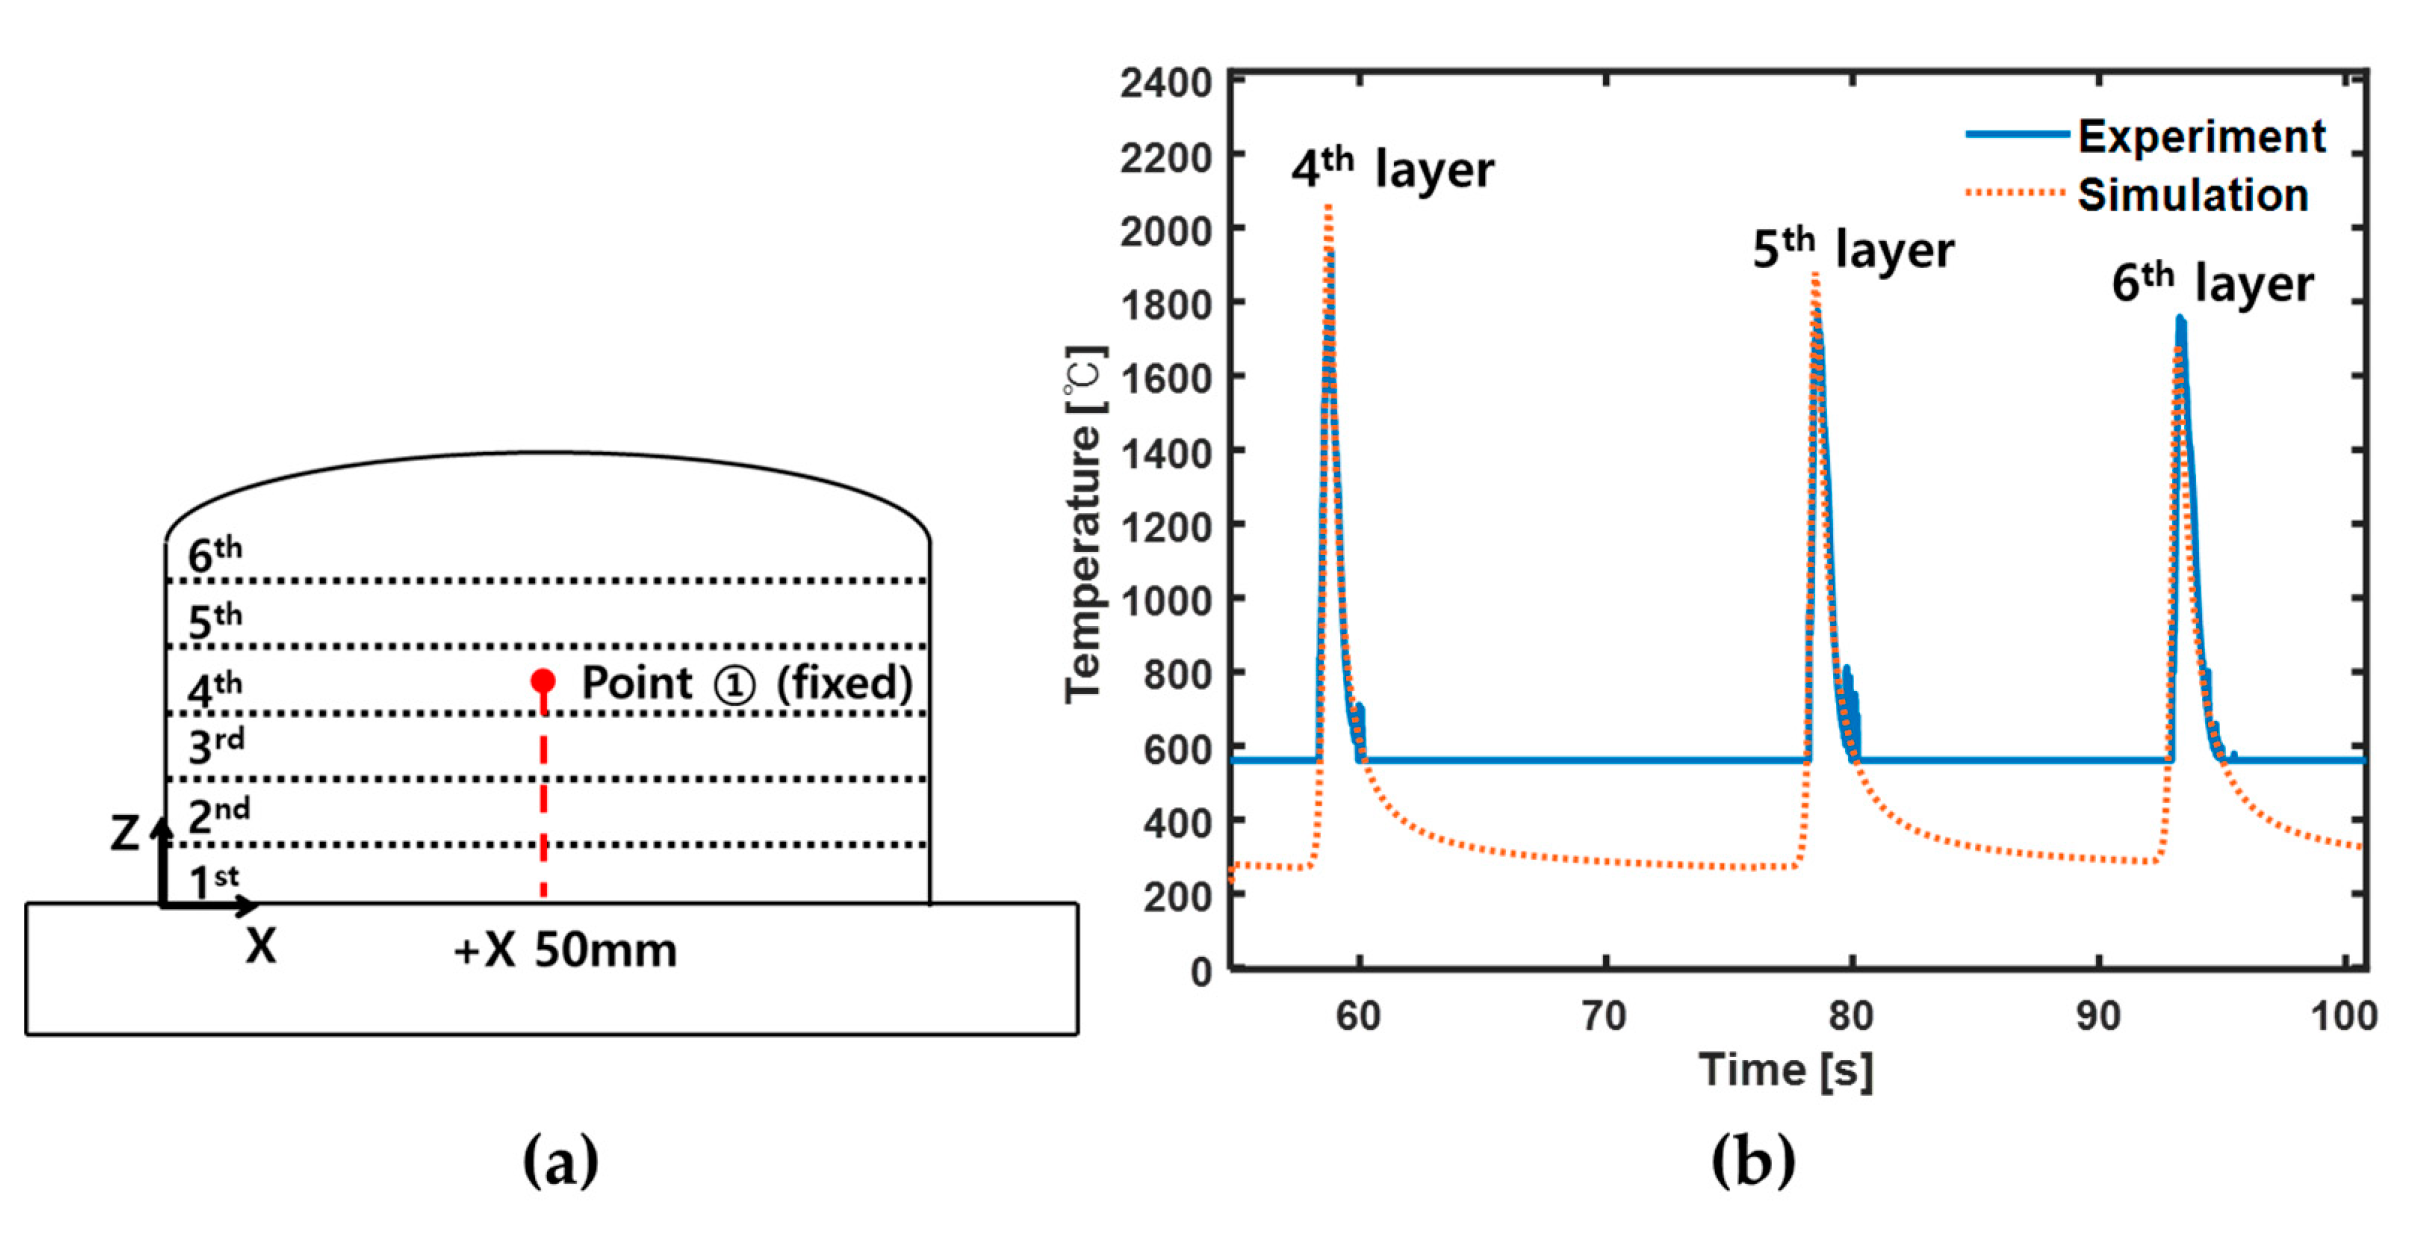
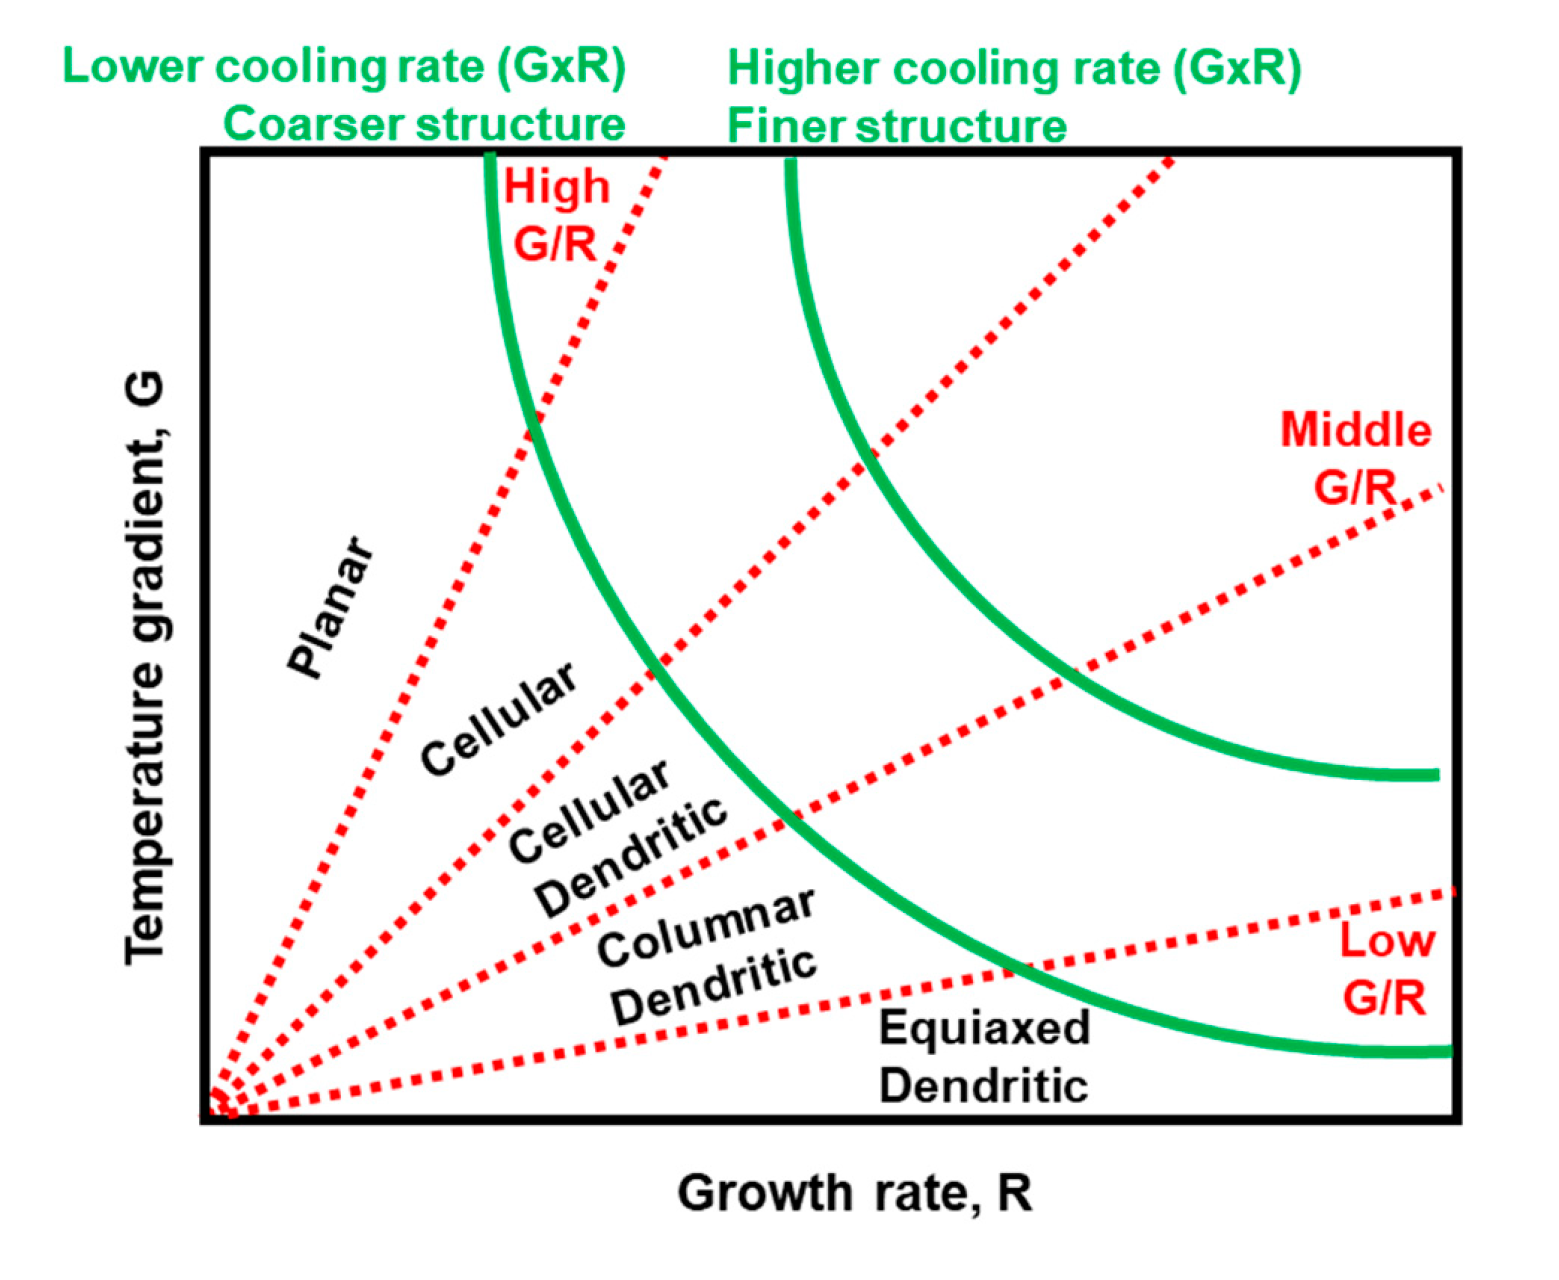
4. Results and Discussion

Figure 3a shows the position (point ①) where the pyrometer continuously measured the varying temperature for validating the numerical model. Figure 3b shows the temperature profile measured using a pyrometer (solid line) and the temperature calculated through the simulation model (dotted line) at point ①. The difference in the peak temperatures between the two temperature profiles is 6.5% at maximum and 4.1% at minimum. In Figure 3b, because point ① is fixed at the height of the fourth layer, there are no temperature profiles from the first to the third layers. As mentioned in Section 2, the pyrometer cannot measure temperatures below 580 °C; therefore, the measured temperature profile in Figure 3b is shown as a straight line at 580 °C. In addition, some errors occurred at ~580 °C because of electrical noise after the temperature decreased to this value. Figure 3b shows a difference of ~5% on average between the peaks of the two temperature profiles. However, except for the temperature near the peaks, which were above the melting point of STS 316L (1400 °C), the measured and the simulated temperature profiles are almost identical. This indicates that the developed numerical model fits well. During the cooling process of each layer, the slope of the temperature profile at the melting point of STS 316L indicates the cooling rate when the molten powder solidifies. Note that the solid–liquid interface was simplified and assumed to be a melting point in this study. Therefore, the solidification parameters obtained at the melting point have an important effect on the characteristics of the microstructure morphology. In other words, it is important to obtain a continuous temperature history, including the melting point, of the cooling process through the simulation model. By doing so, quantified solidification parameters can be derived through the model.
Figure 4 shows the solidification map. The temperature gradient (G) (shown on the y-axis in the map) indicates the temperature difference at the solid–liquid interface and the growth rate (R) (shown on the x-axis) represents the travel speed of the solid–liquid interface.
In the map, the G/R value determines the morphology of the microstructure and the cooling rate, expressed as G × R, determines the size of the microstructure [22,23]. As shown in Figure 4, the morphology transforms from planar to cellular, cellular dendritic, columnar dendritic, and finally, equiaxed dendritic as the G/R value decreases. In addition, the higher the cooling rate, the finer is the microstructure that is formed and the more improved are mechanical properties such as the tensile strength and hardness [24,25,26].
In this study, G and R were calculated using a mathematical model validated through the measured temperature profiles. A deposit with the same configuration as the real deposit was built in the mathematical model. After calculating G and G × R by using the mathematical model, R was inversely derived. These parameters were all calculated at the spatial location where the temperature was passing through the last melting point in each layer.
Figure 5 shows the cooling rate, temperature gradient, and growth rate depending on the height of the deposits. Figure 5a shows the locations where G and R were calculated. The sample size is 1.8 mm (W) × 2.5 mm (H). The bottom is at 0.13 mm in the -Z direction from the base metal surface. The middle is at 0.88 mm in the +Z direction from the base metal surface. The top is at 1.63 mm in the +Z direction from the base metal surface. Figure 5b shows the changes in G × R, G, and R at each layer. G × R, G, and R tend to decrease as the location moves from bottom to top. Further, the decrease in slope between the middle and the top was smaller than that between the bottom and the middle. This means that during deposition, a significant portion of the heat input supplied by the laser heat source is rapidly transferred to the base material, and the difference between the decreasing slopes of each solidification parameter reflects the effect of heat accumulation for each layer of the deposit due to repeated heat input. As shown in Figure 5b, G × R was in the range of 1 × 10³ to 2.5 × 10³ °C/s, which agrees with the results of other studies [15,27,28].
As shown in Figure 6, cross sections of the deposit were analyzed using an optical microscope to investigate the relationship between the calculated solidification parameters and the formed microstructure. Figure 6a–c shows the microstructures at the bottom, middle, and top regions of the deposit for 0-s interlayer time. A cellular structure was observed in the three figures; however, a small amount of cellular dendrite was additionally observed in the top region in Figure 6c. This is because G/R decreases from the bottom to the top area, as shown in Figure 5. This phenomenon was also observed in different locations of the deposit, as shown in Figure 6d–f. These results suggest the possibility of quantifying the conditions for morphology change between cellular and cellular dendrite. In addition, Figure 6 clearly shows that the size of the cell gradually increases from the bottom (a, d) to the top (c, f) owing to the effect of the cooling rate described in Figure 5.
Figure 7 shows the calculated G/R values for the deposit. The G/R value gradually decreases from the bottom to the top of the deposit. This trend was consistent with the trends of G, R, and G × R as shown in Figure 4b. G/R has the same order of magnitude of 102 °C·s/mm2 for the bottom, middle, and top positions. However, other researchers reported that the G/R values of STS 316L deposits with cellular appearance in the deposit were of the order of 102 °C·s/mm2 [12] or 102–103 °C·s/mm2 [15]. In addition, the G/R value for planar and equiaxed appearance in STS 316L deposits is ~5 × 10⁴ °C·s/mm2 [12] or higher and ~10 °C·s/mm2 [29] or lower, respectively. In summary, planar and equiaxed formations were not expected to appear in the bottom, middle, or top of the deposits investigated in this study. Therefore, it can be concluded that the microstructure observed in Figure 6 was formed with the G/R values shown in Figure 7. Finally, by combining Figure 5, Figure 6 and Figure 7, the relationship between G/R and the microstructure characteristics can be derived as follows:
498 (cellular dendrite) ≤ G/R ≤ 598 (cellular)

5. Conclusions

In this study, to investigate the quantitative relationship between the solidification parameters and the microstructures formed by heat accumulation owing to repetitive heat input in the multilayer deposition of STS 316L, a numerical model was developed and validation experiments were performed. This study makes the following contributions:
(1) A numerical model has been developed to understand the heat transfer of the deposit in the LMD multilayer deposition process. To improve the accuracy of the numerical model, the temperature profile was obtained at a fixed point in the deposit during the experiment and the results were validated by using the numerical model. There was an average difference of ~5% between the peaks of the two temperature profiles. However, except for the temperature near peaks that were above the melting point of STS 316L (i.e., 1400 °C), the profiles between the measured and the simulated temperature were almost identical. Therefore, the developed numerical model simulates the multilayer deposition process well and can be directly applied to the thermal history analysis of various types of deposits.
(2) The relationship between the microstructure morphologies and the solidification parameters was investigated. In particular, the relationship between the microstructure morphologies was quantitatively analyzed by deriving G and R affected by the heat accumulation during multilayer deposition. In this process, the relationship between cellular and cellular dendrite formation according to G/R was proposed using a solidification map. Accordingly, the resulting microstructure can be predicted through a simulation model without the need to perform real depositions, and the predicted results are useful for process variable design.

Author Contributions

Conceptualization, J.P., J.-y.K. and S.H.L.; Funding acquisition, S.H.L.; Project administration, S.H.L.; Software, J.-y.K. and I.J.; Supervision, S.H.L.; Validation, J.P.; Visualization, J.P.; Writing—original draft, J.P.; Writing—review & editing, S.H.L. All authors have read and agreed to the published version of the manuscript.

Funding

This work was supported by a National Research Foundation of Korea (NRF) grant funded by the Korean government (MSIT) (no. 2020R1C1C1009519) and by Korea Aerospace University (no. 2019-01-006).

Conflicts of Interest

The authors declare no conflict of interest.

References

  1. Farshidianfar, M.H.; Khajepour, A.; Gerlich, A.P. Effect of real-time cooling rate on microstructure in Laser Additive Manufacturing. J. Mater. Process. Technol. 2016, 231, 468–478. [Google Scholar] [CrossRef]
  2. Wang, Z.; Palmer, T.A.; Beese, A.M. Effect of processing parameters on microstructure and tensile properties of austenitic stainless steel 304L made by directed energy deposition additive manufacturing. Acta Mater. 2016, 110, 226–235. [Google Scholar] [CrossRef] [Green Version]
  3. Akbari, M.; Kovacevic, R. An investigation on mechanical and microstructural properties of 316LSi parts fabricated by a robotized laser/wire direct metal deposition system. Addit. Manuf. 2018, 23, 487–497. [Google Scholar] [CrossRef]
  4. Wu, B.; Pan, Z.; Ding, D.; Cuiuri, D.; Li, H. Effects of heat accumulation on microstructure and mechanical properties of Ti6Al4V alloy deposited by wire arc additive manufacturing. Addit. Manuf. 2018, 23, 151–160. [Google Scholar] [CrossRef]
  5. Hejripour, F.; Binesh, F.; Hebel, M.; Aidun, D.K. Thermal modeling and characterization of wire arc additive manufactured duplex stainless steel. J. Mater. Process. Technol. 2019, 272, 58–71. [Google Scholar] [CrossRef]
  6. Zhan, M.; Sun, G.; Wang, Z.; Shen, X.; Yan, Y.; Ni, Z. Numerical and experimental investigation on laser metal deposition as repair technology for 316L stainless steel. Opt. Laser Technol. 2019, 118, 84–92. [Google Scholar] [CrossRef]
  7. Lee, S.H.M.; Mazumder, J. Role of zinc coating at liquid-vapor interface during laser material processing of zinc coated steel. J. Appl. Phys. 2013, 114, 044903. [Google Scholar]
  8. Casalino, G.; Facchini, F.; Mortello, M.; Mummolo, G. ANN modelling to optimize manufacturing processes: The case of laser welding. IFAC-Pap. Line 2016, 49, 378–383. [Google Scholar] [CrossRef]
  9. Casalino, G.; Losacco, A.M.; Arnesano, A.; Facchini, F.; Pierangeli, M.; Bonserio, C. Statistical analysis and modelling of an Yb: KGW femtosecond laser micro-drilling process. Procedia CIRP 2017, 62, 275–280. [Google Scholar] [CrossRef]
  10. Lee, Y.; Bandari, Y.; Nandwana, P.; Gibson, B.; Richardson, B.; Simunovic, S. Effect of Interlayer Cooling Time, Constraint and Tool Path Strategy on Deformation of Large Components Made by Laser Metal Deposition with Wire. Appl. Sci. 2019, 9, 5115. [Google Scholar] [CrossRef] [Green Version]
  11. Lee, S.H. CMT-Based Wire Arc Additive Manufacturing Using 316L Stainless Steel: Effect of Heat Accumulation on the Multi-Layer Deposits. Metals 2020, 10, 278. [Google Scholar] [CrossRef] [Green Version]
  12. Bertoli, U.S.; MacDonald, B.E.; Schoenung, J.M. Stability of cellular microstructure in laser powder bed fusion of 316L stainless steel. Mater. Sci. Eng. A 2019, 739, 109–117. [Google Scholar] [CrossRef]
  13. Du, L.; Gu, D.; Dai, D.; Shi, Q.; Ma, C.; Xia, M. Relation of thermal behavior and microstructure evolution during multi-track laser melting deposition of Ni-based material. Opt. Laser Technol. 2018, 108, 207–217. [Google Scholar] [CrossRef]
  14. Knapp, G.; Mukherjee, T.; Zuback, J.; Wei, H.; Palmer, T.; De, A.; DebRoy, T. Building blocks for a digital twin of additive manufacturing. Acta Mater. 2017, 135, 390–399. [Google Scholar] [CrossRef]
  15. Huang, Y.; Ansari, M.; Asgari, H.; Farshidianfar, M.H.; Sarker, D.; Khamesee, M.B.; Toyserkani, E. Rapid prediction of real-time thermal characteristics, solidification parameters and microstructure in laser directed energy deposition (powder-fed additive manufacturing). J. Mater. Process. Technol. 2019, 274, 116286. [Google Scholar] [CrossRef]
  16. Antony, K.; Arivazhagan, N.; Senthilkumaran, K. Numerical and experimental investigations on laser melting of stainless steel 316L metal powders. J. Manuf. Processes. 2014, 16, 345–355. [Google Scholar] [CrossRef]
  17. Foroozmehr, A.; Badrossamay, M.; Foroozmehr, E.; Golabi, S.I. Finite element simulation of selective laser melting process considering optical penetration depth of laser in powder bed. Mater. Des. 2016, 89, 255–263. [Google Scholar] [CrossRef]
  18. Zhang, Z.; Huang, Y.; Kasinathan, A.R.; Shahabad, S.I.; Ali, U.; Mahmoodkhani, Y.; Toyserkani, E. 3-Dimensional heat transfer modeling for laser powder-bed fusion additive manufacturing with volumetric heat sources based on varied thermal conductivity and absorptivity. Opt. Laser Technol. 2019, 109, 297–312. [Google Scholar] [CrossRef]
  19. Rong, Y.; Huang, Y.; Xu, J.; Zheng, H.; Zhang, G. Numerical simulation and experiment analysis of angular distortion and residual stress in hybrid laser-magnetic welding. J. Mater. Process. Technol. 2017, 245, 270–277. [Google Scholar] [CrossRef]
  20. Wu, B.; Ding, D.; Pan, Z.; Cuiuri, D.; Li, H.; Han, J.; Fei, Z. Effects of heat accumulation on the arc characteristics and metal transfer behavior in Wire Arc Additive Manufacturing of Ti6Al4V. J. Mater. Process. Technol. 2017, 250, 304–312. [Google Scholar] [CrossRef]
  21. Lippold, J.C. Welding Metallurgy and Weldability; Wiley: Hoboken, NJ, USA, 2015; pp. 15–30. [Google Scholar]
  22. Kurz, W.; Giovanola, B.; Trivedi, R. Theory of microstructural development during rapid solidification. Acta Metall. 1986, 34, 823–830. [Google Scholar] [CrossRef]
  23. Kou, S. Welding Metallurgy, 2nd ed.; Wiley: Hoboken, NJ, USA, 2003; pp. 163–167. [Google Scholar]
  24. Ngo, T.D.; Kashani, A.; Imbalzano, G.; Nguyen, K.T.; Hui, D. Additive manufacturing (3D printing): A review of materials, methods, applications and challenges. Composites Part B 2018, 143, 172–196. [Google Scholar] [CrossRef]
  25. Buchanan, C.; Gardner, L. Metal 3D printing in construction: A review of methods, research, applications, opportunities and challenges. Eng. Struct. 2019, 180, 332–348. [Google Scholar] [CrossRef]
  26. Caballero, A.; Ding, J.; Ganguly, S.; Williams, S. Wire + Arc Additive Manufacture of 17-4 PH stainless steel: Effect of different processing conditions on microstructure, hardness, and tensile strength. J. Mater. Process. Technol. 2019, 268, 54–62. [Google Scholar] [CrossRef]
  27. Hofmeister, W.; Griffith, M. Solidification in direct metal deposition by LENS processing. JOM 2001, 53, 30–34. [Google Scholar] [CrossRef]
  28. Tan, W.; Wen, S.; Bailey, N.; Shin, Y.C. Multiscale modeling of transport phenomena and dendritic growth in laser cladding processes. Metall. Mater. Trans. B 2011, 42, 1306–1318. [Google Scholar] [CrossRef]
  29. Zhang, K.; Wang, S.; Liu, W.; Shang, X. Characterization of stainless steel parts by laser metal deposition shaping. Mater. Des. 2014, 55, 104–119. [Google Scholar] [CrossRef]
Figure 1. Schematic diagram of experimental setup for the laser metal deposition (LMD) process.
Applsci 10 04874 g001
Figure 2. Mesh of numerical model for LMD simulation.
Applsci 10 04874 g002
Figure 3. Temperature measurement position and results; (a) Schematic diagram of temperature measurement position; (b) comparison of simulated and experimental results for temperature profile of deposits.
Applsci 10 04874 g003
Figure 4. Solidification map: effect of temperature gradient (G) and growth rate (R) on morphology and size of solidification microstructure [21].
Applsci 10 04874 g004
Figure 5. Solidification parameter measurement position and results; (a) Schematic diagram of solidification parameter measurement position; (b) behavior of solidification parameters and cooling rate at each position.
Applsci 10 04874 g005
Figure 6. Optical microscope image of microstructure at each position of the deposit: (ac) microstructure at the bottom, middle, and top of the deposit for 0-s interlayer time; (df) microstructure at the different bottom, middle, and top of the deposit for 0-s interlayer time.
Applsci 10 04874 g006
Figure 7. Behavior of G/R at each position in deposit.
Applsci 10 04874 g007
Table 1. Chemical composition of STS 316L substrate and powder.
STS 316LElement (wt%)
CSiMnPSCuNiCrMo
Substrate0.0160.501.250.0300.0010.2610.0916.632.05
Powder0.010.940.050.0280.0010.2112.5616.662.38
Table 2. Process parameters for LMD.
ParametersValueParametersValue
Laser power [W]630Spot diameter [mm]1
Scan speed [mm/s]6Shielding gas (Ar) flow rate [L/min]10
Powder feed rate [g/min]16Delivery gas (Ar) flow rate [L/min]13
Interlayer time [s] 0Pyrometer emissivity0.7

