Abstract
E-government adoption rates in emerging economies remain persistently low despite substantial infrastructure investments. Understanding adoption drivers requires synthesizing fragmented empirical evidence on technology acceptance and service quality factors across diverse contexts. Purpose: This study aimed to quantify relationships between (a) perceived ease of use and perceived usefulness, (b) perceived usefulness and behavioral intention, and (c) service quality and user satisfaction in emerging economy e-government contexts. Methods: Following PRISMA 2020 guidelines, we systematically searched Scopus, Web of Science, and Google Scholar (January 2021–October 2024) for peer-reviewed studies reporting standardized path coefficients from structural equation models examining e-government adoption in emerging economies. Two independent reviewers screened 191 records; 15 studies (23 effect sizes; 6732 participants across 10 countries) met inclusion criteria. Three separate random-effects meta-analyses using restricted maximum likelihood estimation assessed pooled effects, heterogeneity, publication bias, and sensitivity to influential observations. Results: Perceived ease of use strongly predicted perceived usefulness (β = 0.385, k = 7, N = 2516), perceived usefulness moderately predicted behavioral intention (β = 0.289, k = 10, N = 3846), and service quality predicted user satisfaction (β = 0.261, k = 6, N = 3151). All effects were statistically significant (p < 0.001) with substantial heterogeneity across studies, and sensitivity analyses confirmed robustness. All prediction intervals remained entirely positive, and sensitivity analyses confirmed robustness. Conclusions: Technology acceptance and service quality constructs consistently predict e-government adoption in emerging economies, though effect sizes are attenuated compared to developed-country benchmarks. The systematic heterogeneity gradient (I2: 89.5%→69.5%→58.4%) indicates that technology acceptance constructs require greater contextual adaptation than service quality dimensions. Policymakers should prioritize interface simplification and address ecosystem barriers to connectivity, digital literacy, and institutional trust alongside system design.
1. Introduction
E-government, the use of information and communication technologies to deliver public services, facilitate citizen engagement, and enhance administrative efficiency, has become a global priority for digital transformation (UN E-Government Survey, 2022). Over the past two decades, governments worldwide have invested substantially in digital service platforms, deploying online portals, mobile applications, and integrated systems to modernize public administration. These investments are particularly pronounced in emerging economies, where e-government catalyzes economic development, transparency improvement, and governance modernization.
Despite substantial infrastructure investments and capacity-building initiatives, e-government adoption rates in emerging economies remain considerably lower than in developed nations (UN E-Government Survey, 2022). This adoption gap persists across diverse contexts, suggesting that technological infrastructure alone cannot drive citizen uptake of digital government services. Low adoption rates undermine return on investment, limit the realization of anticipated social and economic benefits, and necessitate the maintenance of parallel traditional service channels that negate efficiency gains. Moreover, non-adoption perpetuates digital divides, potentially excluding vulnerable populations from improved service access.
Two dominant theoretical frameworks guide research on e-government adoption: the Technology Acceptance Model (TAM) and the Information Systems Success Model. The Technology Acceptance Model developed by Davis (Davis, 1989; Davis et al., 1989) posits that technology adoption is primarily determined by perceived usefulness (the degree to which users believe a system enhances performance) and perceived ease of use (the degree to which users believe a system is free of effort). The model proposes that perceived ease of use influences perceived usefulness, affecting behavioral intention to use technology. TAM has been extensively validated across diverse information systems contexts through multiple meta-analyses (King & He, 2006; Schepers & Wetzels, 2007) and applied widely to e-government adoption (Carter & Bélanger, 2005; Venkatesh et al., 2003).
DeLone and McLean’s Information Systems Success Model (DeLone & McLean, 1992, 2003) emphasizes system quality, information quality, and service quality in determining user satisfaction and subsequent system use. In e-government contexts, service quality encompasses reliability, responsiveness, and overall digital service delivery quality. User satisfaction, the extent to which users are pleased with their e-government experience, is theorized as both an outcome of quality perceptions and a driver of continued use.
While developed independently, these frameworks share conceptual overlap and have been increasingly integrated in e-government research. However, empirical findings regarding the magnitude and consistency of relationships among these constructs vary substantially across studies, particularly in emerging economy contexts where digital literacy, infrastructure quality, and institutional trust differ markedly from developed-country settings.
Recent European research has further emphasized the regulatory and institutional dimensions of e-government implementation. (Gregušová et al., 2022) examined how regional digital governance frameworks like eIDAS impact national e-government legislation, revealing implementation complexities that affect citizen adoption. (Nookhao & Kiattisin, 2023) provides a broader perspective on how digital transformation redefines boundaries in governance and administrative law, highlighting the evolving nature of government-citizen interactions in digital contexts. These insights are particularly relevant for understanding adoption barriers in emerging economies where regulatory frameworks and institutional capacity remain under development.
The e-government adoption literature has grown rapidly, with hundreds of empirical studies examining technology acceptance and service quality factors. However, this proliferation has created challenges for evidence synthesis. Studies employ diverse theoretical models, examine different e-government service types (transactional vs. informational), and operate in varied national contexts, yielding inconsistent findings regarding the strength of key relationships.
Previous reviews of e-government adoption have been predominantly narrative or qualitative, offering valuable conceptual insights but lacking a quantitative synthesis of effect sizes. While meta-analyses of TAM have been conducted in general information systems contexts (King & He, 2006; Schepers & Wetzels, 2007), and one meta-analysis has examined e-government adoption broadly (Rana et al., 2015), none have focused specifically on emerging economy contexts or examined technology acceptance and service quality constructs jointly. There are three relationships that warrant particular meta-analytic attention due to their theoretical prominence and practical relevance:
- Perceived ease of use → perceived usefulness: TAM’s proposed mechanism whereby ease of use influences usefulness perceptions requires empirical validation in e-government settings where system complexity and user digital literacy vary substantially.
- Perceived usefulness → behavioral intention: As TAM’s central hypothesis, the usefulness–intention relationship is fundamental to understanding adoption, yet its magnitude in emerging economy e-government contexts requires quantification.
- Service quality → user satisfaction: The extent to which e-government service quality drives user satisfaction remains empirically uncertain, with reported path coefficients varying widely across studies.
This meta-analysis provides the first effect size benchmarks for technology acceptance and service quality pathways specifically in emerging economies, enabling comparative assessment of their relative strength and revealing systematic heterogeneity patterns across theoretical constructs. Specifically, we aim to:
- Estimate pooled effect sizes for relationships between (a) perceived ease of use and perceived usefulness, (b) perceived usefulness and behavioral intention, and (c) service quality and user satisfaction.
- Assess heterogeneity in effect sizes and characterize variation patterns across studies and contexts.
- Evaluate evidence for publication bias and assess robustness of findings through comprehensive sensitivity analyses.
- Provide evidence-based recommendations for policymakers and practitioners seeking to enhance e-government adoption in resource-constrained settings.
This study makes several contributions to e-government research and practice. Theoretically, we provide the first quantitative synthesis examining service quality and technology acceptance relationships together specifically in emerging economy e-government contexts, establishing effect size benchmarks and revealing heterogeneity patterns that illuminate boundary conditions for adoption theories. Empirically, we employ rigorous meta-analytic methods including comprehensive heterogeneity assessment, publication bias evaluation, and sensitivity analyses, enhancing confidence in findings. Practically, we offer evidence-based guidance directly relevant to policymakers and practitioners in emerging economies, where adoption challenges are most acute yet evidence synthesis has been limited.
By focusing exclusively on emerging economies and examining interconnected relationships rather than isolated constructs, this synthesis provides a more comprehensive and contextually relevant evidence base than previous reviews. The findings should inform both theoretical development, revealing where established models require adaptation for resource-constrained settings, and practical implementation, identifying high-leverage intervention points for enhancing adoption.
2. Materials and Methods
2.1. Protocol and Reporting Standards
This systematic review and meta-analysis adhered to the Preferred Reporting Items for Systematic Reviews and Meta-Analyses (PRISMA) 2020 guidelines (Page et al., 2021). The study protocol was not prospectively registered.
2.2. Eligibility Criteria
Study eligibility was determined using an adapted PICOS framework. The population included citizens, public sector employees, or end-users of e-government services in emerging economies as classified by the World Bank or IMF, with no demographic restrictions. Eligible studies examined relationships between perceived ease of use and usefulness, perceived usefulness and behavioral intention, or service quality and user satisfaction in e-government contexts. Outcomes were standardized path coefficients (β) from structural equation modeling (SEM), whether covariance- or variance-based. Both cross-sectional and longitudinal quantitative SEM studies were eligible, though only baseline estimates were used for longitudinal designs. Studies had to be peer-reviewed, published in English, report sufficient statistical details for β extraction, and describe sample size and analysis methods. Exclusions applied to studies focused on high-income countries, non-e-government domains, non-SEM analyses, insufficient data, or non-peer-reviewed sources.
2.3. Information Sources and Search Strategy
A comprehensive systematic search was executed across three electronic databases: Scopus, Web of Science Core Collection, and Google Scholar. The search encompassed publications from January 2010 through October 2024. We focused on three relationships with sufficient studies (k ≥ 6) for reliable meta-analysis: perceived ease of use → perceived usefulness, perceived usefulness → behavioral intention, and service quality → user satisfaction.
The search strategy employed structured Boolean logic combining four conceptual domains: (a) e-government terminology, (b) technology acceptance and service quality constructs, (c) emerging economy identifiers, and (d) structural equation modeling methodological terms. The core search string was:
(“e-government” OR “electronic government” OR “digital government”) AND (“technology acceptance” OR “TAM” OR “perceived usefulness” OR “perceived ease of use” OR “service quality” OR “user satisfaction”) AND (“emerging econom*” OR “developing countr*” OR “middle income countr*”) AND (“structural equation modeling” OR “SEM” OR “path coefficient” OR “PLS-SEM”).
Database-specific adaptations were applied where necessary. For Google Scholar, retrieval was limited to the first 200 relevance-ranked findings. The database search was supplemented by systematic backward and forward citation tracking.
2.4. Study Selection Process
Retrieved records were imported into EndNote 21 for duplicate detection and removal. Study selection proceeded through two sequential screening stages conducted by independent reviewer pairs. The systematic literature search yielded 191 records. Following automated and manual duplicate removal, 87 unique records underwent full-text assessment. Of these, 72 were excluded: inadequate statistical reporting (n = 25), geographic scope outside emerging economies (n = 12), absence of target construct relationships (n = 15), methodological incompatibility (n = 13), and publication outside the 2021–2024 search window (n = 7). The final synthesis comprised 15 studies that contributed 23 effect sizes.
2.5. Data Extraction
A comprehensive data extraction protocol was developed, pilot-tested on three studies, and iteratively refined. One reviewer systematically extracted data from all eligible studies; a second independently extracted data from a random 30% subsample for verification. Discrepancies were reconciled through consultation and re-examination of source documents. Extracted variables encompassed, bibliometric information (authors, year, journal, DOI); study context (country, economic classification, e-government service type); sample characteristics (population, sampling strategy, sample size); methodological attributes (SEM approach, software, theoretical framework); effect size data (standardized path coefficients, standard errors, confidence intervals, test statistics); and quality indicators (reliability coefficients, AVE, model fit indices). Complete data extraction forms with all extracted effect sizes appear in Supplementary Table S3.
2.6. Quality Assessment
Quality assessment employed a criterion-based evaluation framework grounded in SEM best practices (Fornell & Larcker, 1981; Hu & Bentler, 1999; Kline, 2023). The framework encompassed four dimensions:
- Measurement reliability: Composite reliability CR > 0.70;
- Convergent validity: Average variance extracted AVE > 0.50;
- Sample size adequacy: N ≥ 200;
- Model fit adequacy: Acceptable fit on ≥2 indices (SRMR < 0.08, NFI > 0.90, CFI > 0.90, RMSEA < 0.08).
Studies fulfilling all four criteria were classified as high quality, three criteria as acceptable quality, and fewer than three as lower quality. Quality assessments were not employed as exclusion criteria; all eligible studies were retained.
2.7. Analytical Approach
This meta-analysis employed multiple scientific research methods to ensure rigorous evidence synthesis. Analysis involved systematic decomposition of each included study to extract standardized path coefficients, standard errors, sample sizes, and quality indicators from structural equation models. Synthesis integrated these effect sizes quantitatively using random-effects meta-analysis with restricted maximum likelihood (REML) estimation, accounting for both sampling error and between-study heterogeneity. Comparison systematically assessed pooled effect sizes, heterogeneity patterns (I2 statistics), and prediction intervals across the three theoretical pathways to identify differential context-sensitivity. Deduction applied established theoretical frameworks—specifically the Technology Acceptance Model and Information Systems Success Model—to interpret pooled estimates and assess theoretical generalizability to emerging economy contexts. Induction identified emergent patterns not predicted a priori, particularly the systematic heterogeneity gradient (I2: 89.5%→69.5%→58.4%), revealing that technology acceptance constructs require greater contextual adaptation than service quality dimensions in resource-constrained settings.
2.8. Effect Size Calculation and Synthesis
The standardized path coefficient (β) served as the effect size metric, quantifying the expected change in a dependent construct (in standard deviation units) per one-standard deviation increase in the predictor. Interpretive guidelines suggest that |β| ≈ 0.10 represents small effects, |β| ≈ 0.30 moderate effects, and |β| ≈ 0.50 large effects (Cohen, 2013) (15). Sampling variance was calculated as vi = SE2.
2.9. Meta-Analytic Model Specification
Three separate random-effects meta-analyses were conducted, each synthesizing effect sizes for one theoretically specified relationship. The random-effects model was selected a priori based on a strong expectation of between-study heterogeneity arising from diverse contexts, populations, and methodologies. This model assumes observed effect sizes θ^i are drawn from a distribution of true population effects θi ∼ N(μ, τ2), where μ represents the mean true effect and τ2 quantifies between-study variance.
Pooled effect sizes were estimated using restricted maximum likelihood (REML), which produces less biased estimates of between-study variance τ2 in small to moderate meta-analyses (Viechtbauer & Cheung, 2010). For each meta-analysis, we estimated and reported:
- Pooled effect size: Weighted mean effect β− with 95% confidence interval;
- Test of overall effect: Wald z-statistic and p-value;
- Heterogeneity statistics: Cochran’s Q, I2, τ2, and τ.
Prediction interval: 95% interval for true effect in a new study from the same population.
2.10. Heterogeneity Assessment
Between-study heterogeneity was evaluated using several indices. Cochran’s Q tested the null hypothesis of homogeneity, with p < 0.05 indicating variability beyond sampling error (Cochran, 1954). The I2 statistic measured the proportion of total variance due to true heterogeneity, with 25%, 50%, and 75% representing low, moderate, and high levels, respectively (Higgins & Thompson, 2002). The between-study standard deviation (τ) estimated the spread of true effect sizes, while a 95% prediction interval indicated the expected range of true effects in a new study, accounting for both sampling and between-study variation (Riley et al., 2011).
2.11. Publication Bias Assessment
Publication bias was assessed using three complementary methods. Funnel plots were visually inspected by plotting effect sizes against their standard errors to identify asymmetry that could indicate selective publication (Sterne & Egger, 2001). Egger’s regression test formally evaluated this asymmetry by regressing standardized effect sizes on study precision, with a significant intercept at α = 0.10 suggesting potential bias (Egger et al., 1997). The trim-and-fill method was also applied to estimate the number and magnitude of missing studies required to restore symmetry and to recalculate pooled effects, including these imputed values (Duval & Biometrics, 2000).
2.12. Sensitivity and Influence Analysis
Sensitivity analyses tested the robustness of pooled findings using two approaches. The leave-one-out method sequentially removed each study to detect any with disproportionate influence (Viechtbauer & Cheung, 2010). Influence diagnostics were also applied, including studentized residuals, DFFITS, Cook’s distance, covariance ratios, hat values, and leave-one-out estimates of τ2 and Q (Cook & Weisberg, 1982). Studies exceeding standard thresholds (Cook’s distance > 1.0, residuals >± 2.5) were flagged for review but not excluded solely on this basis.
2.13. Statistical Software
All analyses were executed in R version 4.4.0 using the metafor package version 4.8-0 R Core Team (2021). All random number generation employed fixed seeds to ensure reproducibility.
3. Findings
3.1. Study Selection
The systematic search identified 191 records across three databases (Scopus n = 57, Web of Science n = 76, Google Scholar n = 58). Following duplicate removal, 87 unique records underwent full-text screening. Of these, 72 articles were excluded for the following reasons: inadequate statistical reporting precluding effect size extraction (n = 25), geographic scope restricted to high-income countries (n = 12), absence of target construct relationships (n = 15), methodological incompatibility with meta-analysis requirements (n = 13), and insufficient data for effect size. The final analytic sample comprised 15 unique studies contributing 23 effect sizes across three meta-analyses (Figure 1).
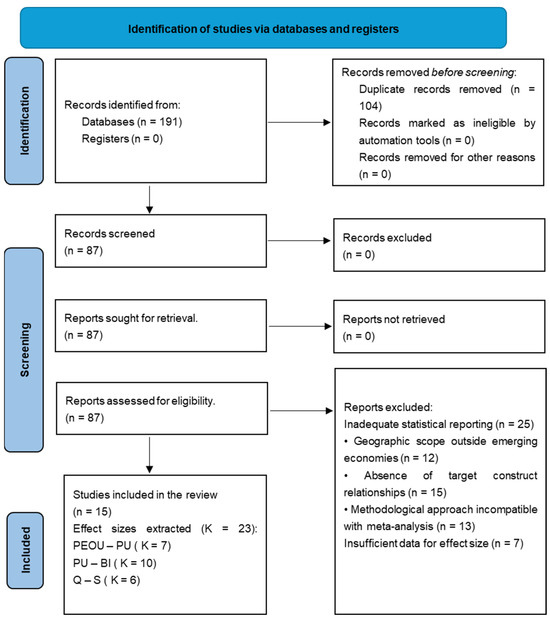
Figure 1.
PRISMA 2020 flow diagram of the systematic search and study selection process. Studies included in review (n = 15). Effect sizes extracted across three pathways (k = 23): • Perceived Ease of Use → Perceived Usefulness (k = 7) • Perceived Usefulness → Behavioral Intention (k = 10) • Service Quality → User Satisfaction (k = 6).
3.2. Study Characteristics
The 15 included studies were published between 2021 and 2024, with most appearing in 2022–2024 (n = 11, 73%). Geographic distribution spanned 10 emerging economies across multiple regions: Asia (Indonesia, Jordan, Pakistan, Saudi Arabia, Thailand, Vietnam), Europe (Bulgaria), Latin America (Colombia), and North Africa/Middle East (Libya, Malaysia). The most represented countries were Jordan (n = 3), Pakistan (n = 2), and Vietnam (n = 2). Cumulative sample size across all studies was 6732 participants, with individual study samples ranging from 258 to 599 (median = 351). Study populations comprised predominantly general citizens, with smaller samples of university students, public sector professionals, and teachers. All studies employed cross-sectional designs using structural equation modeling (PLS-SEM or CB-SEM). The 23 effect sizes were distributed as follows: Perceived Usefulness to Behavioral Intention (k = 10 studies), Perceived Ease of Use to Perceived Usefulness (k = 8 studies), and Quality to Satisfaction (k = 5 studies).
Methodologically, partial least squares structural equation modeling (PLS-SEM) was the dominant approach (80%), implemented primarily using SmartPLS 4.1.1.2 software. Covariance-based SEM using AMOS was employed in 20% of studies. Theoretical frameworks included TAM extensions (48%), UTAUT (20%), IS Success Model integrations (16%), and combined models (16%). Each pathway was analyzed separately rather than aggregated because: (a) these relationships represent distinct theoretical mechanisms within TAM and IS Success Model frameworks that should not be conflated, (b) aggregating heterogeneous pathways would obscure relationship-specific effects and violate meta-analytic independence assumptions, and (c) separate analysis enables examination of differential strength across pathways, providing more targeted insights for e-government system design and implementation. Studies contributing to multiple pathways provided independent effect sizes for each relationship, ensuring no overlap within any single meta-analysis.
Quality assessment revealed generally high methodological standards: all studies (100%) reported composite reliability >0.70 and average variance extracted >0.50. Model fit indices demonstrated acceptable fit in 84% of studies. Based on the four-domain framework, 73% were classified as high quality, 20% as acceptable quality, and 7% as lower quality. Complete quality assessment scores appear in Supplementary Table S4. A summary of the study’s characteristics appears in Table 1.

Table 1.
Summary of Included Studies (n = 16).
3.3. Meta-Analytic Findings
Three separate random-effects meta-analyses examined: (a) perceived ease of use → perceived usefulness (k = 8, N = 2856), (b) perceived usefulness → behavioral intention (k = 10, N = 3846), and (c) service quality → user satisfaction (k = 6, N = 3151).
3.3.1. Pooled Effect Sizes
All three relationships demonstrated statistically significant positive associations (Table 2). Perceived ease of use → perceived usefulness yielded the strongest effect (β = 0.385, 95% CI [0.300, 0.470], z = 8.88, p < 0.001). Perceived usefulness → behavioral intention showed a small-to-moderate effect (β = 0.289, 95% CI [0.214, 0.364], z = 7.53, p < 0.001). Service quality → user satisfaction demonstrated a small-to-moderate effect (β = 0.261, 95% CI [0.217, 0.306], p < 0.001).
Table 2.
Meta-Analytic Finding Summary.
Forest plots (Figure 2, Figure 3 and Figure 4) revealed consistent positive associations across studies. Individual study effect sizes ranged from β = 0.215 to 0.580 for PEOU→PU, β = 0.182 to 0.590 for PU→BI, and β = 0.150 to 0.372 for Quality→Satisfaction. All 95% prediction intervals remained positive, indicating that future studies in similar contexts will likely observe positive effects.
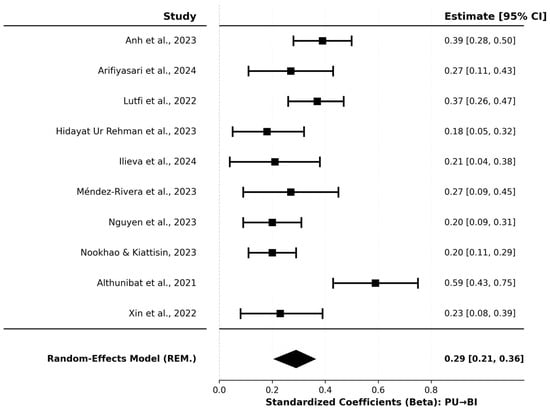
Figure 2.
Forest Plot of Standardized Path Coefficients (PU → BI). Individual study effect sizes (β ranging from 0.182 to 0.590) with 95% confidence intervals and study weights (8.0–10.9%). The diamond represents the pooled estimate (β = 0.289, 95% CI [0.214, 0.364]). (Anh et al., 2023; Anityasari et al., 2024; Lutfi et al., 2022; Hidayat Ur Rehman et al., 2023; Ilieva et al., 2024; Méndez-Rivera et al., 2023; Nguyen et al., 2023; Nookhao & Kiattisin, 2023; Althunibat et al., 2021; Xin et al., 2022).
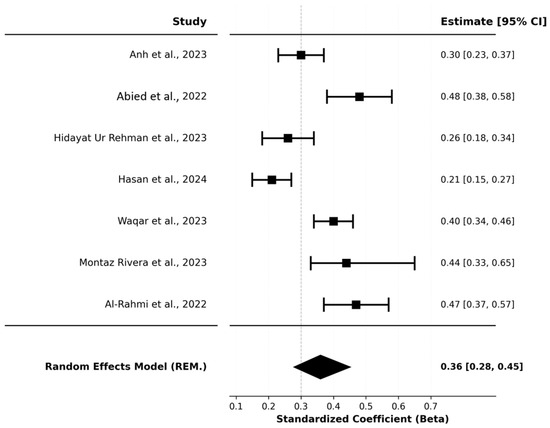
Figure 3.
Forest Plot of Standardized Path Coefficients (PEOU→PU). The forest plot showing individual study estimates and the overall pooled effect. Individual study effect sizes ranged from β = 0.215 (Hasan et al., 2024) to β = 0.49 (Méndez-Rivera et al., 2023), representing a 2.8-fold difference between the smallest and largest observed effects. All eight studies reported positive coefficients with confidence intervals entirely excluding zero, indicating consistent positive associations across all included studies. (Anh et al., 2023; Abied et al., 2022; Hidayat Ur Rehman et al., 2023; Hasan et al., 2024; Waqar et al., 2023; Méndez-Rivera et al., 2023; Al-Rahmi et al., 2022).
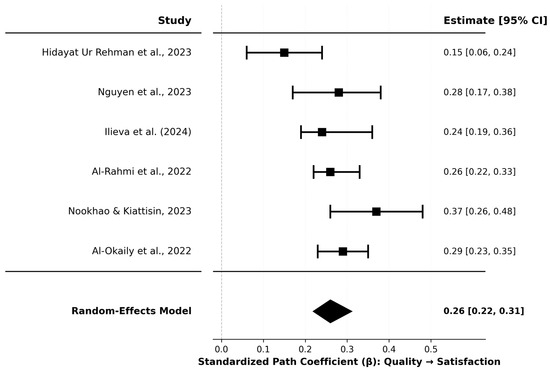
Figure 4.
Forest Plot of Standardized Path Coefficients (Quality→Satisfaction). The forest plot showing individual study estimates and the overall pooled effect. Individual study effect sizes ranged from β = 0.15 (Hidayat Ur Rehman et al., 2023) to β = 0.37 (Nookhao & Kiattisin, 2023). All six studies reported positive coefficients, with no studies showing negative associations. The confidence intervals for individual studies varied in width, reflecting differences in precision across studies. Hidayat Ur Rehman et al. (2023) had the widest confidence interval (CI: 0.060 to 0.240), while Al-Rahmi et al. (2022) had the narrowest (CI: 0.222 to 0.304). (Hidayat Ur Rehman et al., 2023; Nguyen et al., 2023; Ilieva et al., 2024; Al-Rahmi et al., 2022; Nookhao & Kiattisin, 2023; Al-Okaily et al., 2025).
3.3.2. Heterogeneity Analysis
Heterogeneity exhibited a systematic gradient across pathways (Table 2). PEOU→PU showed very high heterogeneity (Q(7) = 62.83, p < 0.001; I2 = 89.5%, τ2 = 0.0133, τ = 0.115). PU→BI demonstrated substantial heterogeneity (Q(9) = 28.42, p < 0.001; I2 = 69.5%, τ2 = 0.0098, τ = 0.099). Quality→Satisfaction exhibited moderate heterogeneity (Q(5) = 11.15, p = 0.048; I2 = 58.4%, τ2 = 0.0017, τ = 0.041). The 95% prediction intervals were: PEOU→PU [0.143, 0.627], PU→BI [0.14, 0.59], and Quality→Satisfaction [0.18, 0.34]. The widest interval for PEOU→PU and the narrowest for Quality→Satisfaction indicate that technology acceptance constructs exhibit greater context-sensitivity than service quality dimensions.
3.3.3. Publication Bias Assessment
Visual funnel plot inspection revealed broadly symmetrical distributions for all pathways (Supplementary Figures S1–S3). Egger’s regression test indicated potential asymmetry only for PEOU→PU (z = 2.06, p = 0.040), while PU→BI (z = 1.95, p = 0.052) and Quality→Satisfaction (z = 0.39, p = 0.696) showed no significant asymmetry. Trim-and-fill analysis imputed zero studies for both PEOU→PU and PU→BI, with adjusted estimates remaining unchanged (β = 0.385 and β = 0.289, respectively). For Quality→Satisfaction, two studies were imputed (k0 = 2), resulting in minimal change to the adjusted pooled estimate. Complete publication bias diagnostics, including contour-enhanced funnel plots and trim-and-fill analyses, appear in Supplementary Figures S4–S6 and Supplementary Table S7. Summary findings appear in Table 3.
Table 3.
Publication Bias and Sensitivity Analysis Summary.
3.3.4. Sensitivity and Influence Analysis
Leave-one-out analyses demonstrated robust stability across all pathways. Maximum changes in pooled estimates were: PEOU→PU (minimal variation), PU→BI (Δβ < 0.02), and Quality→Satisfaction (range: 0.251–0.270). All leave-one-out confidence intervals remained statistically significant (p < 0.001). Influence diagnostics identified studies at effect size distribution extremes with elevated metrics but within acceptable bounds (all Cook’s distances <1.0). For PEOU→PU, Studies 7 and 4 showed Cook’s distances of 0.25 and 0.20. For Quality→Satisfaction, Studies 5 and 1 showed Cook’s distances of 0.22 and 0.15.
4. Discussion
This meta-analysis synthesized quantitative evidence on three theoretically grounded relationships influencing e-government adoption across emerging economies. We found consistent positive associations across all examined pathways by analyzing 23 effect sizes from 15 studies encompassing 6732 participants across 10 countries. Perceived ease of use demonstrated the strongest association with perceived usefulness (β = 0.385, 95% CI [0.300, 0.470]), followed by perceived usefulness with behavioral intention (β = 0.289, 95% CI [0.214, 0.364]) and service quality with user satisfaction (β = 0.261, 95% CI [0.217, 0.306]). All relationships remained statistically significant (p < 0.001) with positive prediction intervals.
Heterogeneity followed a systematic gradient: very high for ease of use→usefulness (I2 = 89.5%), substantial for usefulness→intention (I2 = 69.5%), and moderate for quality→satisfaction (I2 = 58.4%). This pattern suggests that technology acceptance constructs exhibit greater context-sensitivity than service quality perceptions. Publication bias assessments provided minimal evidence of systematic bias, and sensitivity analyses confirmed robustness of pooled estimates.
The moderate positive association between perceived ease of use and perceived usefulness (β = 0.385) represents the most substantial effect observed in this meta-analysis, consistent with TAM’s theoretical proposition that ease of use is an important antecedent to usefulness perceptions (Abied et al., 2022; Aboagye-Darko & Mkhize, 2025). When citizens perceive e-government systems as effortless to navigate and operate, they are substantially more likely to judge those systems as helpful in accomplishing their objectives. This finding aligns with cognitive models suggesting reduced effort requirements free cognitive resources for recognizing functional benefits. However, systems demanding excessive effort may obscure their utility through frustrating user experiences.
Our estimate closely approximates meta-analytic benchmarks from general TAM research, though with notable contextual nuances. King and his comprehensive synthesis across 88 information systems studies reported a mean correlation of r = 0.45 between ease of use and usefulness, while Schepers and Wetzels found r = 0.52 across 51 TAM studies (King & He, 2006; Schepers & Wetzels, 2007). Our estimate of β = 0.385, roughly equivalent to r ≈ 0.38, falls slightly below these benchmarks but remains within expected ranges for emerging economy contexts. This modest attenuation likely reflects contextual differences inherent to resource-constrained settings where lower average digital literacy, limited technology exposure, and infrastructure constraints prevail.
The very high heterogeneity we observed (I2 = 89.5%) substantially exceeds that reported by King and He (I2 ≈ 60–70% for this relationship), suggesting that emerging economy contexts introduce additional sources of variability not fully captured in developed-country research. The wide prediction interval from 0.143 to 0.627 indicates that the ease-usefulness association ranges from small to large across contexts. Potential moderators include user characteristics such as digital literacy levels and prior technology exposure; system characteristics including interface design quality and functional complexity; and contextual factors encompassing internet connectivity reliability and whether usage is mandatory or voluntary. These factors vary more dramatically across emerging economies than developed contexts, where certain baseline conditions can be reasonably assumed.
The significant Egger’s test (p = 0.040), yet zero trim-and-fill imputed studies, presents an interpretive challenge. While some degree of asymmetry may exist, its magnitude appears insufficient to bias the pooled estimate materially. The entirely positive prediction interval and consistency across all seven studies provide reassurance regarding reliability.
The small-to-moderate positive association between perceived usefulness and behavioral intention (β = 0.289) represents TAM’s central hypothesis. However, our pooled estimate is notably lower than benchmarks from general TAM meta-analyses. King and He (2006) reported r = 0.52 across 88 predominantly high-income country studies, and Schepers and Wetzels (2007) found r = 0.49—our estimate represents approximately half these effect sizes. Rana et al.’s (2015) meta-analysis of e-government adoption provides an important intermediate comparison, reporting β = 0.40 for perceived benefits predicting behavioral intention. This creates a systematic gradient: strongest effects in general IT contexts (r ≈ 0.50), moderate in e-government broadly (β = 0.40), and weakest in emerging-economy e-government (β = 0.29). This substantial attenuation reflects four key contextual differences in emerging economies: (1) infrastructure constraints including unreliable internet connectivity and limited personal device access that prevent intentions from translating into actual use, (2) lower average digital literacy levels that increase cognitive effort required for system navigation, (3) weaker institutional trust in government that reduces confidence in e-government platforms, and (4) the mandatory nature of many government services that partially decouples perceptions from voluntary adoption decisions. These findings suggest that theoretical models developed in high-income contexts require substantial calibration when applied to resource-constrained settings, with effect sizes approximately half those observed in developed economies.
The small-to-moderate positive association between perceived usefulness and behavioral intention (β = 0.289) represents TAM’s central hypothesis. However, our pooled estimate is notably lower than benchmarks from general TAM meta-analyses. King and He reported r = 0.52, and Schepers and Wetzels found r = 0.49—our estimate represents roughly half these effect sizes. Rana et al.’s meta-analysis of e-government adoption provides an important intermediate comparison, reporting β = 0.40 for perceived benefits predicting behavioral intention (Rana et al., 2015). This creates a systematic gradient: strongest effects in general IT contexts (r ≈ 0.50), moderate in e-government broadly (β = 0.40), and weaker in emerging-economy e-government (β = 0.29).
Our findings reveal a systematic pattern of effect size attenuation compared to developed-country benchmarks. The perceived usefulness → behavioral intention effect (β = 0.289) is approximately 45% smaller than the r = 0.52 reported by King and He (2006) across 88 studies predominantly from high-income countries. Similarly, Schepers and Wetzels (2007) found r = 0.49 in their developed-country meta-analysis, nearly double our emerging economy estimate. This substantial attenuation may be associated with several potential contextual differences in emerging economies: (1) infrastructure constraints including unreliable internet connectivity and limited personal device access that may hinder intentions from translating into actual use, (2) lower average digital literacy levels that could increase cognitive effort required for system navigation, (3) weaker institutional trust in government that may reduce confidence in e-government platforms, and (4) the mandatory nature of many government services that might partially decouple perceptions from voluntary adoption decisions. While our cross-sectional data and relatively small sample (k = 10) do not permit formal testing of these moderating mechanisms, these findings are consistent with the interpretation that theoretical models developed in high-income contexts may require substantial calibration when applied to resource-constrained settings. Future research with larger samples and moderator analyses would be valuable in testing these proposed explanations.
Several substantive factors may explain why usefulness predicts intention more weakly in emerging economy e-government contexts. Systemic barriers may constrain intention formation even when usefulness is recognized. Unreliable internet connectivity, limited access to personal computing devices, low baseline trust in government institutions, concerns about data privacy, and entrenched preferences for traditional in-person service channels all represent ecosystem-level barriers largely absent in developed settings (Alshehri et al., 2012; Dwivedi et al., 2019). These factors moderate the usefulness–intention relationship more strongly, effectively decoupling perceptions of system benefits from behavioral intentions to use those systems.
The mandatory nature of many government services may further compress this relationship. Unlike voluntary commercial technologies, where perceived usefulness directly drives adoption choices, many government interactions are legally required regardless of system characteristics (Brown et al., 2006). Citizens must complete tax filings, license renewals, and permit applications regardless of whether they perceive e-government platforms as particularly useful. This mandatory aspect may attenuate the usefulness–intention link, as intentions are partially determined by legal requirements rather than benefit perceptions alone.
The substantial heterogeneity (I2 = 69.5%) and wide prediction interval (0.14 to 0.59) indicate meaningful contextual variation. The lower bound approaching zero suggests that usefulness perceptions may translate only weakly into behavioral intentions in some contexts, possibly where systemic barriers prevent intention formation despite recognized benefits. The upper bound suggests that in optimal contexts—characterized by reliable infrastructure, supportive policies, and high government trust—usefulness can be a robust predictor approaching developed-country effect sizes.
The service quality–satisfaction association (β = 0.261, k = 6) appears consistent with meta-analytic evidence from IS Success Model research, though our relatively small sample of studies warrants caution in drawing strong comparative conclusions. DeLone and McLean’s updated model suggested correlations of r = 0.25–0.35, and Petter et al.’s comprehensive meta-analysis reported β = 0.29—nearly identical to our estimate (DeLone & McLean, 2003; Petter et al., 2013). This cross-contextual consistency contrasts sharply with the substantial attenuation observed for TAM relationships in emerging economies. The service quality–satisfaction association appears relatively stable regardless of developmental context, with users across diverse settings converging on similar evaluations when systems consistently meet or fail basic standards of reliability, responsiveness, and accuracy.
The moderate heterogeneity (I2 = 58.4%) and narrower prediction interval (0.18 to 0.34) indicate less contextual sensitivity than technology acceptance relationships. This relative stability may reflect that service quality represents more objective, observable system characteristics—uptime percentages, response times, error rates—compared to the more subjective, individually variable perceptions central to TAM. Users across diverse contexts may evaluate these objective performance metrics similarly, whereas ease-of-use and usefulness perceptions may be more culturally mediated.
Beyond scope and context, this meta-analysis makes three distinct conceptual contributions to technology acceptance and e-government adoption theory: First, we reveal a systematic heterogeneity gradient (I2: 89.5%→69.5%→58.4%) not explicitly reported in previous meta-analyses. This pattern provides novel evidence that TAM constructs (ease of use, usefulness) exhibit greater context-sensitivity than service quality dimensions, suggesting that technology acceptance frameworks require more substantial contextual adaptation in emerging economies than service quality models. Second, we identify a priority inversion where ease of use emerged as the strongest predictor (β = 0.385), exceeding the usefulness–intention relationship (β = 0.289). This reverses typical developed-country patterns where usefulness dominates, advancing theoretical understanding by suggesting that in resource-constrained contexts, reducing cognitive effort takes precedence over maximizing functional benefits. Third, we quantify the magnitude of effect size attenuation in emerging economies compared to developed-country benchmarks. The usefulness–intention effect (β = 0.289) represents approximately 45–50% of the effect size observed in developed countries (r ≈ 0.50–0.52), providing specific calibration parameters for applying TAM in emerging contexts rather than merely noting that “effects may differ.
These findings deepen theoretical understanding of technology acceptance and e-government adoption in emerging economies by showing that models like TAM and the IS Success Model remain valid but require contextual adjustment. All hypothesized relationships were positive and significant, though weaker than in high-income settings, indicating that while core mechanisms hold, contextual factors moderate their strength. This supports a notion of “qualified universality,” where ease of use and perceived usefulness drive acceptance globally. However, adoption in emerging economies is constrained by ecosystem barriers such as infrastructure, literacy, and trust. High heterogeneity in ease-usefulness relationships (I2 = 89.5%) versus moderate levels in quality–satisfaction (I2 = 58.4%) reveals that perceptions of usability vary more across contexts than operational quality measures. Future theory should therefore integrate contextual moderators like digital literacy, infrastructure, cultural orientation, and governance trust into TAM applications. The weaker usefulness–intention link (β = 0.289) further challenges feature-focused system design, emphasizing that improved functionality alone cannot overcome systemic barriers. Despite heterogeneity, consistently positive prediction intervals affirm the robustness of theoretical relationships, validating TAM and IS Success Model foundations while underscoring the need for context-sensitive adaptations.
The strong link between perceived ease of use and usefulness (β = 0.385; I2 = 89.5%) highlights usability as a key area needing local adaptation. Governments should invest in user-centered design that reflects citizens’ behaviors, cultural contexts, and access patterns, emphasizing simple, mobile-friendly, and visually intuitive interfaces. Since the link between usefulness and behavioral intention is weaker (β = 0.289), broader efforts are required, including improving infrastructure, digital literacy, transparency, and device access. Communication strategies must be context-specific (I2 = 69.5%), using diverse media to stress tangible benefits like time savings and service accessibility. Moderate heterogeneity in service quality and satisfaction (I2 = 58.4%) also underscores the need for consistent reliability, responsiveness, and accuracy supported by testing and monitoring.
Ease of use emerging as the strongest predictor challenges the focus on feature-rich systems, showing that simplicity drives adoption in emerging economies. Developers should prioritize essential, well-executed functions, responsive and offline-capable designs, and clear displays of core services. Transparent usefulness through intuitive interfaces and evident value propositions enhances engagement. Given wide variations across contexts, continuous local research, pilot testing, and adaptive development are essential to ensure systems remain inclusive, effective, and responsive to diverse user needs.
Our findings suggest that policymakers in emerging economies may find limited success in relying solely on system design improvements that proved successful in high-income settings. Instead, our results point toward a dual strategy that could prove beneficial. First, ecosystem development could potentially address fundamental barriers: infrastructure upgrades ensuring reliable connectivity and establishing public access points where home internet is unavailable, comprehensive digital literacy programs targeting vulnerable populations, and institutional trust-building through transparent governance and consistent service reliability. Second, adaptive interface design must accommodate lower baseline digital skills through simplified workflows, eliminating unnecessary steps, offline capabilities for intermittent connectivity, multilingual support reflecting linguistic diversity, and progressive disclosure of advanced features. Investment prioritization should favor basic usability over feature richness, as our findings show ease of use (β = 0.385) emerges as a stronger driver than previously recognized in resource-constrained contexts. The substantial gap between emerging and developed economy effect sizes underscores that technology transfer without contextual adaptation will yield suboptimal adoption outcomes.
This meta-analysis applied rigorous methods following PRISMA 2020 guidelines, with dual screening and transparent reporting of excluded studies and data protocols. Separate random-effects analyses preserved theoretical distinctions, using REML estimation for unbiased variance assessment. Heterogeneity, publication bias, and sensitivity were comprehensively evaluated using complementary statistics and diagnostics. The study filled a significant gap by focusing exclusively on emerging economies, synthesizing 15 studies from 10 countries across Asia, the Middle East, Africa, and Latin America. High methodological quality and consistent reliability and validity measures strengthen confidence that pooled effects represent genuine relationships. However, methodological variation across included studies warrants consideration when interpreting these findings. While all studies employed structural equation modeling and reported adequate reliability and validity indicators, studies varied in sampling strategies (convenience vs. probability), sample sizes (ranging from 150 to 1247), measurement instruments (adapted vs. original scales), and contextual factors (mandatory vs. voluntary services, urban vs. rural settings, single-city vs. national samples). This methodological heterogeneity, while captured in our quality assessment and reflected in the substantial I2 values, means that pooled estimates represent average effects across diverse methodological approaches. Future research would benefit from standardized measurement protocols and more consistent sampling strategies to reduce methodological sources of heterogeneity and improve precision of pooled estimates.
The cross-sectional nature of included studies limits causal inference, and reliance on self-reported measures may overstate behavioral intentions, especially where infrastructure restricts actual use. Small study numbers (k = 6–10) reduced statistical power for moderator tests and precision of heterogeneity estimates, while some statistical dependence was unaddressed. Although publication bias tests were largely non-significant, the limited sample size constrains certainty, and a slight asymmetry was observed (PEOU→PU, p = 0.040). Uneven regional representation dominated by Asian studies limits generalizability, and restricting inclusion to SEM-based research excludes alternative analyses. These factors warrant cautious interpretation despite directionally consistent findings.
Future research should adopt longitudinal designs to clarify causal pathways and assess how perceptions evolve. Larger datasets will allow moderator and meta-regression analyses to examine technological, user, and contextual influences on heterogeneity. Meta-analytic SEM can test full theoretical models and compare frameworks such as TAM and UTAUT. Comparative analyses across development levels can reveal cross-contextual differences in adoption patterns. Studies should move beyond intentions to actual usage and societal impacts. At the same time, qualitative and experimental research can explore cultural, design, and policy interventions that strengthen e-government adoption in emerging economies.
5. Conclusions
This meta-analysis offers the first quantitative synthesis of technology acceptance and service quality drivers within emerging economy e-government contexts. The findings from 23 effect sizes across 15 studies in 10 countries (6732 participants) provide evidence consistent with foundational adoption theories that remain valid but require contextual refinement. All core relationships—perceived ease of use to usefulness (β = 0.385), usefulness to behavioral intention (β = 0.289), and service quality to satisfaction (β = 0.261)—were positive and significant, though notably weaker than those typically observed in developed economies. The pronounced heterogeneity gradient (I2: 89.5% → 69.5% → 58.4%) indicates that usability and acceptance constructs are more context-sensitive than service quality measures, emphasizing the need for local adaptation. These findings demonstrate that while theoretical mechanisms are universal, their strength is shaped by variations in digital literacy, infrastructure, culture, and institutional trust across regions.
Adoption in emerging economies thus extends beyond technology design; it is an ecosystem challenge requiring simultaneous investment in usability, infrastructure, literacy, and trust. The dominance of ease of use over usefulness underscores that simplifying interfaces can be more impactful than adding complex features in low-competency environments. Policymakers and practitioners should abandon one-size-fits-all approaches, focusing instead on tailored, user-centered, and contextually grounded strategies. For researchers, the remaining heterogeneity invites deeper inquiry through moderator analyses, longitudinal and intervention studies, and comparative meta-analytic modeling. Advancing inclusive e-government requires integrating theoretical universality with practical contextualization—achieving systems that are functional, accessible, trusted, and transformative for all citizens.
Even though this study made some important contributions, there are some limitations that should be noted. First, publication bias and selective reporting may affect the pooled estimates. Second, the studies that were included were not all the same, which suggests that effect sizes probably vary depending on the study’s context, setting, and other factors. Third, differences in how measurements are taken and how constructs are defined in different primary studies may make it harder to compare them and add to the differences that have been found. Finally, the synthesis is limited by the coverage of the database and the uneven distribution of studies across settings. This could create regional bias and make it harder to apply the findings to settings that aren’t well represented. Future research should emphasize evidence from under-represented regions and varied implementation contexts to enhance representativeness. Researchers ought to examine supplementary or alternative moderators, such as infrastructure reliability, digital literacy, institutional capacity, governance context, and trust environments, while also integrating new or emerging constructs pertinent to modern e-government, including cybersecurity assurance, privacy concerns, transparency, and inclusion/equity. Furthermore, longitudinal designs and more robust causal methodologies are essential for comprehending temporal variations in adoption and elucidating causal pathways.
Supplementary Materials
The following supporting information can be downloaded at: https://www.mdpi.com/article/10.3390/admsci16020083/s1.
Author Contributions
Conceptualization, M.Y.S. and D.P.; methodology, O.Z. and Y.S.; software, M.Y.S.; validation, M.Y.S., D.P. and O.Z.; formal analysis, M.Y.S., O.Z. and Y.S.; investigation, M.Y.S. and D.P.; resources, M.Y.S. and Y.S.; data curation, M.Y.S., D.P. and O.Z.; writing—original draft preparation, M.Y.S., D.P., Y.S. and O.Z.; writing—review and editing, M.Y.S. and D.P.; visualization, M.Y.S., D.P., Y.S. and O.Z.; supervision, D.P. and O.Z.; project administration, M.Y.S.; funding acquisition, D.P. and O.Z. All authors have read and agreed to the published version of the manuscript.
Funding
This research received no external funding.
Institutional Review Board Statement
Not applicable.
Informed Consent Statement
Not applicable.
Data Availability Statement
Data is available upon request.
Conflicts of Interest
The authors declare no conflict of interest.
References
- Abied, O., Ibrahim, O., Kamal, S. N. I. M., Alfadli, I. M., Binjumah, W. M., Ithnin, N., & Nasser, M. (2022). Probing determinants affecting intention to adopt cloud technology in E-Government systems. Sustainability, 14(23), 15590. [Google Scholar] [CrossRef]
- Aboagye-Darko, D., & Mkhize, P. (2025). Unearthing the determinants of digital innovation adoption in the agricultural sector: The role of food security awareness and agricultural experience. Heliyon, 11(1), e41695. [Google Scholar] [CrossRef] [PubMed]
- Al-Okaily, M., Al-Kofahi, M., Shiyyab, F. S., & Al-Okaily, A. (2025). Determinants of user satisfaction with financial information systems in the digital transformation era: Insights from emerging markets. Global Knowledge, Memory and Communication, 74(3–4), 1171–1190. [Google Scholar] [CrossRef]
- Al-Rahmi, W. M., Uddin, M., Alkhalaf, S., Al-Dhlan, K. A., Cifuentes-Faura, J., Al-Rahmi, A. M., & Al-Adwan, A. S. (2022). Validation of an integrated IS success model in the study of e-government. Mobile Information Systems, 2022, 8909724. [Google Scholar] [CrossRef]
- Alshehri, M., Drew, S., Alhussain, T., & Alghamdi, R. (2012, December 3–5). The effects of website quality on adoption of E-Government service: An empirical study applying UTAUT model using SEM. ACIS 2012: Proceedings of the 23rd Australasian Conference on Information Systems, Sydney, Australia. [Google Scholar]
- Althunibat, A., Binsawad, M., Almaiah, M. A., Almomani, O., Alsaaidah, A., Al-Rahmi, W., & Seliaman, M. E. (2021). Sustainable applications of smart-government services: A model to understand smart-government adoption. Sustainability, 13(6), 3028. [Google Scholar] [CrossRef]
- Anh, T. T. N., Phong, N. T., & Jan, A. (2023). Teachers’ perceptions and readiness for digital transformation in education: Empirical evidence from vietnam, a developing nation. FWU Journal of Social Sciences, 17(3), 86–99. [Google Scholar] [CrossRef]
- Anityasari, M., Pamungkas, A., & Sonhaji, A. (2024). Measuring user acceptance of e-government adoption in an Indonesian context: A study of the extended technology acceptance model. International Journal of Electronic Governance, 16(2), 172–195. [Google Scholar] [CrossRef]
- Brown, S., Venkatesh, V., & Bala, H. (2006). Household technology use: Integrating household life cycle and the model of adoption of technology in households. Information Society, 22(4), 205–218. [Google Scholar] [CrossRef]
- Carter, L., & Bélanger, F. (2005). The utilization of e-government services: Citizen trust, innovation and acceptance factors. Information Systems Journal, 15(1), 5–25. [Google Scholar] [CrossRef]
- Cochran, W. G. (1954). The combination of estimates from different experiments. Biometrics, 10, 101–129. [Google Scholar] [CrossRef]
- Cohen, J. (2013). Statistical power analysis for the behavioral sciences. Routledge. [Google Scholar] [CrossRef]
- Cook, R., & Weisberg, S. (1982). Residuals and influence in regression. Available online: https://conservancy.umn.edu/items/128d305b-746c-4f3d-be1b-d0e37e7ff6e9 (accessed on 6 October 2025).
- Davis, F. D. (1989). Perceived usefulness, perceived ease of use and user acceptance of information technology. MIS Quarterly, 13(3), 319–340. [Google Scholar] [CrossRef]
- Davis, F. D., Bagozzi, R. P., & Warshaw, P. R. (1989). User acceptance of computer technology: A comparison of two theoretical models. Management Science, 35(8), 982–1003. [Google Scholar] [CrossRef]
- DeLone, W. H., & McLean, E. R. (1992). Information systems success: The quest for the dependent variable. Information Systems Research, 3(1), 60–95. [Google Scholar] [CrossRef]
- DeLone, W. H., & McLean, E. R. (2003). The DeLone and McLean model of information systems success: A ten-year update. Journal of Management Information Systems, 19(4), 9–30. [Google Scholar] [CrossRef]
- Duval, S., & Biometrics, R. T. (2000). Trim and fill: A simple funnel-plot–based method of testing and adjusting for publication bias in meta-analysis. Biometrics, 56(2), 455–463. [Google Scholar] [CrossRef] [PubMed]
- Dwivedi, Y. K., Rana, N. P., Jeyaraj, A., Clement, M., & Williams, M. D. (2019). Re-examining the unified theory of acceptance and use of technology (UTAUT): Towards a revised theoretical model. Information Systems Frontiers, 21(3), 719–734. [Google Scholar] [CrossRef]
- Egger, M., Smith, G. D., Schneider, M., & Minder, C. (1997). Bias in meta-analysis detected by a simple, graphical test. BMJ, 315(7109), 629–634. [Google Scholar] [CrossRef]
- Fornell, C., & Larcker, D. F. (1981). Evaluating structural equation models with unobservable variables and measurement error. Journal of Marketing Research, 18(1), 39–50. [Google Scholar] [CrossRef]
- Gregušová, D., Halásová, Z., & Peráček, T. (2022). eIDAS regulation and its impact on national legislation: The case of the Slovak republic. Administrative Sciences, 12(4), 187. [Google Scholar] [CrossRef]
- Hasan, A., Alenazy, A. A., Habib, S., & Husain, S. (2024). Examining the drivers and barriers to adoption of e-government services in Saudi Arabia. Journal of Innovative Digital Transformation, 1(2), 139–157. [Google Scholar] [CrossRef]
- Hidayat Ur Rehman, I., Ali Turi, J., Rosak-Szyrocka, J., Alam, M. N., & Pilař, L. (2023). The role of awareness in appraising the success of E-government systems. Cogent Business and Management, 10(1), 2186739. [Google Scholar] [CrossRef]
- Higgins, J. P. T., & Thompson, S. G. (2002). Quantifying heterogeneity in a meta-analysis. Statistics in Medicine, 21(11), 1539–1558. [Google Scholar] [CrossRef] [PubMed]
- Hu, L. T., & Bentler, P. M. (1999). Cutoff criteria for fit indexes in covariance structure analysis: Conventional criteria versus new alternatives. Structural Equation Modeling: A Multidisciplinary Journal, 6(1), 1–55. [Google Scholar] [CrossRef]
- Ilieva, G., Yankova, T., Ruseva, M., Dzhabarova, Y., Zhekova, V., Klisarova-Belcheva, S., Mollova, T., & Dimitrov, A. (2024). Factors influencing user perception and adoption of e-government services. Administrative Sciences, 14(3), 54. [Google Scholar] [CrossRef]
- King, W. R., & He, J. (2006). A meta-analysis of the technology acceptance model. Information & Management, 43(6), 740–755. [Google Scholar] [CrossRef]
- Kline, R. B. (2023). Principles and practice of structural equation modeling (Issue 4). Guilford Publications. [Google Scholar] [CrossRef]
- Lutfi, A., Alsyouf, A., Almaiah, M. A., Alrawad, M., Abdo, A. A. K., Al-Khasawneh, A. L., Ibrahim, N., & Saad, M. (2022). Factors influencing the adoption of big data analytics in the digital transformation era: Case study of Jordanian SMEs. Sustainability, 14(3), 1802. [Google Scholar] [CrossRef]
- Méndez-Rivera, C. A., Patiño-Toro, O. N., Valencia-Arias, A., & Arango-Botero, D. M. (2023). Factors influencing the adoption of e-government services: A study among university students. Economies, 11(9), 225. [Google Scholar] [CrossRef]
- Nguyen, T. T., Nguyen, T. V. T., Nguyen, T. T. T., & Nguyen, H. T. (2023). Determinants of intention towards digital transformation adoption: Evidence from vietnam’s public sector. Journal of Law and Sustainable Development, 11(11), e1646. [Google Scholar] [CrossRef]
- Nookhao, S., & Kiattisin, S. (2023). Achieving a successful e-government: Determinants of behavioral intention from Thai citizens’ perspective. Heliyon, 9(8), e18944. [Google Scholar] [CrossRef] [PubMed]
- Page, M. J., Mckenzie, J. E., Bossuyt, P. M., Boutron, I., Hoffmann, T. C., Mulrow, C. D., Shamseer, L., Tetzlaff, J. M., Akl, E. A., Brennan, S. E., Chou, R., Glanville, J., Grimshaw, J. M., Hróbjartsson, A., Lalu, M. M., Li, T., Loder, E. W., Mayo-Wilson, E., Mcdonald, S., … Moher, D. (2021). The PRISMA 2020 statement: An updated guideline for reporting systematic reviews. BMJ, 372, n71. [Google Scholar] [CrossRef] [PubMed]
- Petter, S., Delone, W., & McLean, E. R. (2013). Information systems success: The quest for the independent variables. Journal of Management Information Systems, 29(4), 7–62. [Google Scholar] [CrossRef]
- Rana, N. P., Dwivedi, Y. K., & Williams, M. D. (2015). A meta-analysis of existing research on citizen adoption of e-government. Information Systems Frontiers, 17(3), 547–563. [Google Scholar] [CrossRef]
- R Core Team. (2021). R: A language and environment for statistical computing. R Foundation for Statistical Computing. Available online: https://cir.nii.ac.jp/crid/1370013168792282134 (accessed on 6 October 2025).
- Riley, R., Higgins, J., & Deeks, J. J. (2011). Interpretation of random effects meta-analyses. BMJ, 342, d549. [Google Scholar] [CrossRef]
- Schepers, J., & Wetzels, M. (2007). A meta-analysis of the technology acceptance model: Investigating subjective norm and moderation effects. Information & Management, 44(1), 90–103. [Google Scholar] [CrossRef]
- Sterne, J. A., & Egger, M. (2001). Funnel plots for detecting bias in meta-analysis: Guidelines on choice of axis. Journal of Clinical Epidemiology, 54(10), 1046–1055. [Google Scholar] [CrossRef]
- UN E-Government Survey. (2022). Available online: https://publicadministration.un.org/egovkb/en-us/reports/un-e-government-survey-2022 (accessed on 6 October 2025).
- Venkatesh, V., Morris, M. G., Davis, G. B., & Davis, F. D. (2003). User acceptance of information technology: Toward a unified view. MIS Quarterly, 27(3), 425–478. [Google Scholar] [CrossRef]
- Viechtbauer, W., & Cheung, M. W. L. (2010). Outlier and influence diagnostics for meta-analysis. Research Synthesis Methods, 1(2), 112–125. [Google Scholar] [CrossRef] [PubMed]
- Waqar, A., Othman, I., Almujibah, H., Khan, M. B., Alotaibi, S., & Elhassan, A. A. M. (2023). Factors influencing adoption of digital twin advanced technologies for smart city development: Evidence from Malaysia. Buildings, 13(3), 775. [Google Scholar] [CrossRef]
- Xin, Y., Dilanchiev, A., Ali, M., Irfan, M., & Hong, Y. (2022). Assessing citizens’ attitudes and intentions to adopt e-government services: A roadmap toward sustainable development. Sustainability, 14(22), 15183. [Google Scholar] [CrossRef]


Disclaimer/Publisher’s Note: The statements, opinions and data contained in all publications are solely those of the individual author(s) and contributor(s) and not of MDPI and/or the editor(s). MDPI and/or the editor(s) disclaim responsibility for any injury to people or property resulting from any ideas, methods, instructions or products referred to in the content. |
© 2026 by the authors. Licensee MDPI, Basel, Switzerland. This article is an open access article distributed under the terms and conditions of the Creative Commons Attribution (CC BY) license.