Abstract
The development of export–import activity at all levels of the national economic system is an important factor and the result of globalization and country integration in the world economy. The elaboration of sound public policy related to export–import activity is based on its assessment and analysis. The goal of this article is the systematization and development of methodological support for the evaluation of the export–import activity of the national economy, including the development of its technology and a conceptual assessment model, which is presented in a structural–logical–semantic form, and the analysis and forecasting of export–import activity using the proposed model. To achieve the research goal, quantitative methods were used: the method of integral taxonomic indicators of development and efficiency, the method of forecasting based on trend models, multivariate factor analysis, and the modified method of cointegration of time series. A set of indicators for the export–import activity “development–effectiveness” matrix was proposed, and their dichotomies were studied. To ensure the reliability and objectivity of the export–import activity assessment, a methodological basis, which is detailed by structural elements, was formed. The model was constructed and tested based on monthly data on the export–import activity of Ukraine for the years 2021–2023.
1. Introduction
Globalization as one of the defining trends of modern development is accompanied by an increase in countries’ export–import activity, which has become a significant factor of their economic growth. Moreover, the economic development of a country and the integration of a national economic system into the world economy are determined by the scope and effectiveness of its export and import activities. This applies to both countries with developed economies and countries whose economies are in the stage of development or whose economies are in a state of crisis.
According to the World Bank Group (2024), the average export and import shares of global GDP are 29.3% and 28.5%, respectively. In low-income countries, the average export share is 17.3%, while the import share is 28.5%. In lower-middle-income countries, as classified by the World Bank Group, these indicators are 27.3% and 30.5%, respectively. In upper-middle-income countries, exports account for 24.0% of GDP, while imports account for 22.0%. As observed from these data, in all these income groups, import shares exceed export shares, indicating a trade deficit.
In high-income countries, the average export share is 32.1%, while the import share is 30.9%, resulting in a positive trade balance that provides additional capital inflows to these economies. However, the presented averages do not allow for an assessment of the impact of export–import trade operations on the dynamics of key macroeconomic indicators at the level of individual national economies. The efficiency of trade activity depends on the structure of exports and imports, the growth dynamics, the level of added value in exports, and other factors. Thus, much academic research has been devoted to studying the influence of trade operations on GDP growth, offering varying perspectives on this relationship.
For instance, Millia et al. (2021), in their analysis of the impact of exports and imports on Indonesia’s GDP, concluded that trade activities influence economic growth in both the short and long term. Specifically, in the long term, a 1% reduction in imports leads to a 1.17% increase in economic growth, while a 1% increase in exports results in a 1.83% rise in growth. Molepo and Jordaan (2024) identified diverse causal relationships between exports, imports, and GDP per capita for SACU countries, namely, Botswana, Lesotho, Namibia, South Africa, and Eswatini (formerly Swaziland).
Etahisoa (2020), based on a VAR causality model, pointed out that exports and imports exert a unidirectional short-term causal impact on Madagascar’s economic growth. Given the country’s negative trade balance, the researcher emphasized that the government should reconsider its trade policy planning and promote exports.
When examining the impact of exports, imports, and trade openness on Namibia’s economic growth by using the ARDL cointegration method, Sunde et al. (2023) found a significant negative relationship between imports and economic growth, while exports and trade openness demonstrated a positive and significant correlation with GDP growth.
Similarly, Stojanović et al. (2023), through regression analysis of panel data, provided evidence that exports and imports positively affect GDP growth in selected high-income European Union countries.
Thus, the development and effectiveness of export–import activities requires a thorough assessment to form effective instruments on the part of the governments of countries to accelerate economic growth.
Considering the problems of the Ukrainian economy, which is in crisis and suffering socio-economic shock caused by Russia’s aggression, it should be noted that export–import activity becomes extremely important, because it allows domestic needs to be satisfied through the import of critically important goods and enables the inflow of foreign currency due to the export of goods and services, which are vitally necessary to support the national monetary system and currency exchange rate. This role of export–import activity explains the special attention paid to its development and effectiveness in the national economic policy.
In the pre-war period, the problems of imperfect taxation and legislative system, an unfavorable investment environment, and an inefficient structure of export that are typical for developing countries were inherent to Ukraine’s export–import activity. Ukrainian exports were characterized by goods with a relatively low technological component consisting of mineral and agricultural raw materials and semi-finished products of the primary processing stages of the metallurgical, metal processing, and chemical industries. To increase the benefits of international trade and the effectiveness of export and import activities, it was necessary to update technological processes at the enterprise level and gradually transform the economy into more innovative, knowledge-intensive, and competitive world markets (Ministry of Economy of Ukraine, 2024).
The war has caused other numerous problems for the Ukrainian economy: the destruction of resource capacity, a huge decrease in GDP (by 25.8% in 2022), inflation (the consumer price index reached 126.6%), a reduction in exports (by 35.2%), and a growth of the deficit of the balance of payments (up to USD 2.9 billion) (State Statistics Service of Ukraine, 2024). Despite these problems, according to the National Bank of Ukraine (2024), the Ukrainian economy is overcoming the difficulties of martial law thanks to the mobilization of its own resources and the support of foreign partners.
The European Union was the largest trading partner of Ukraine before and during the war. Ukraine’s trade in goods and services with EU countries was growing steadily before the war. The growth rate of Ukraine–EU bilateral trade in goods and services reached 35% in 2021 (from USD 46.3 to USD 62.5 billion) compared with the previous year. However, the war disrupted global supply chains, inducing a sharp rise in commodity prices and increased uncertainty, and it directly affected the EU economy due to its geographical proximity to Russia and Ukraine, its dependence on imported energy resources (mainly Russian), and high vulnerability to global supply chain shocks (Ministry of Economy of Ukraine, 2024).
The volume of Ukraine–EU trade decreased by 5.2 percent—to USD 59.3 billion in 2022 in comparison with 2021 (State Statistics Service of Ukraine, 2024). EU countries remain Ukraine’s largest foreign investors. Its share in direct foreign investment was 87.0% in 2023 (National Bank of Ukraine, 2024).
The commodity structure of Ukraine’s foreign trade has changed in wartime. Figure 1 shows the percentage change in the commodity structure of Ukraine’s foreign trade in the first 6 months of 2023 in comparison with the same period of 2022.
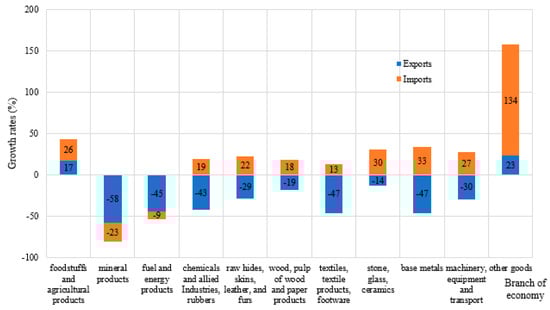
Figure 1.
Growth rates (%) of the commodity structure of Ukraine’s foreign trade (2023 to 2022, the first semi-year). Source: Ministry of Economy of Ukraine (2024).
The data of Figure 1 testify that the exports of mineral products, textiles and textile products, footwear, metals and metal products, and fuel and energy products fell significantly, while imports increased for almost all groups of goods, except mineral products, fuel, and energy products.
In the stage of recovery, the Ukrainian economy, on the one hand, will need the import of new technologies and equipment and an inflow of foreign investment; on the other hand, the development of exports will ensure the inflow of foreign currency and promote economic growth and institutional reforms.
In general, under the conditions of globalization, the sustainable economic development of any country, and Ukraine is no exception to this, is ensured both by the development and the effectiveness of export–import activities, but they are two different dimensions.
By analyzing the dynamics of Ukraine’s export–import activity, we note that the Ukrainian export and import of goods and services increased before the war. After the beginning of the war, they fell sharply and gradually began to grow over the following months. However, the level of development of export–import activity remains below the pre-war level. Figure 2 shows the dynamics of the monthly indicators of the Ukrainian export of goods and services (X1, million USD) and import (X2, million USD) during 2021–2023. These indicators determine the development of export–import activities.
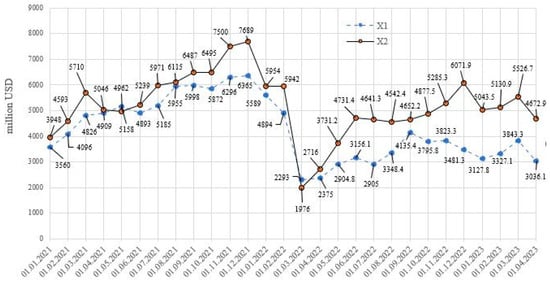
Figure 2.
Dynamics of exports (X1) and imports (X2) of goods and services in Ukraine. Source: Ministry of Economy of Ukraine (2024).
The dynamics of the balance of trade in goods (X3, million US dollars) was very unstable during the research period (Figure 3), and its deficit and fluctuations have increased significantly since the beginning of the war. In 2023, the merchandise trade balance demonstrated positive changes, which indicates a sign of slight economic growth.
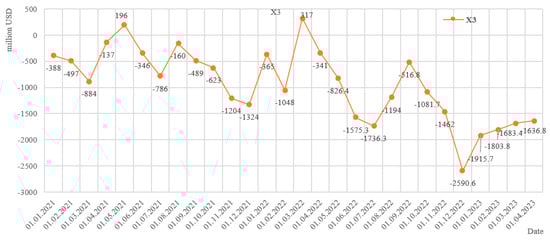
Figure 3.
Dynamics of the balance of trade in goods (X3) of Ukraine in 2021–2023. Source: Ministry of Economy of Ukraine (2024).
Figure 4 demonstrates the structure of Ukrainian exports and imports with main partner countries in January–June 2023 (National Bank of Ukraine, 2024).
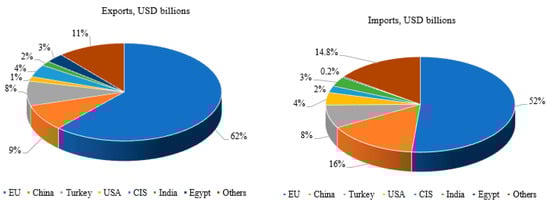
Figure 4.
Ukraine’s trade in goods (exports and imports) with major partners in January–June 2023 (USD bn). Source: National Bank of Ukraine (2024).
The statistical data (Figure 4) prove that imports significantly outweigh exports with the EU and China. There was also a 10% decline in the value of exports to the EU, reflecting a drop in exports of most commodity groups due to problems with the transit of agricultural products and a ban on the import of cereals and oilseeds by some EU member states.
Also, the Russian war aggression in Ukraine has had a significant impact on trade flows and export–import balances in many countries, including the EU member states and the US.
The indicators of export–import activity of Ukraine testify to the threatening trends (the merchandise export reductions of 35.2% in 2022 and 53.2% in 2023, the imports decreasing by 24% in 2022 and by 12.6% in 2023 in comparison with 2021, and the huge growth of the trade balance deficit) during the studied period (State Statistics Service of Ukraine, 2024), which cause the necessity of the substantiation of state policy based on the assessment and analysis of the dynamics of the country’s export–import activity in the combination of its two characteristics: development and effectiveness.
The development indicators reflect the scope and trends of a country’s export–import activity; the effectiveness indicators assess its achieved results and some impacts on the national economy.
According to the authors, the dichotomy in the results of export–import activity at the national economy level leads to the need to design a matrix formed by the components of effectiveness and development. This approach will be productive in revealing the current state of export–import activity in the country and can be used for substantiating the economic policy and institutional support guidelines for the development of the national economy.
This article aims to systematize and develop methodological support for evaluating the national economy’s export–import activity. This includes developing a conceptual evaluation model presented in a structural–logical–semantic form, as well as designing and testing evaluation technology for analyzing and forecasting export–import activity.
To achieve this goal, the following objectives were defined: develop a conceptual model and technology for the assessment of export–import activity; form a set of indicators for evaluating the development and effectiveness of export–import activities; carry out an assessment of the development and effectiveness of export–import activity in Ukraine in 2021–2023; construct the trend models for its forecasting.
The proposed approach to evaluating the results of export–import activity can be used either for Ukraine or for another country. The set of indicators to determine the integral indicators of development and effectiveness might be adjusted according to the availability of data and objectives of the study.
2. Literature Review
The different aspects of export–import activity, including its components and factors, influence on the national economy, and methodology of assessment, have been studied, and the results of research have been presented in numerous publications globally. Aykol and Leonidou (2018), Eatwell et al. (1987), Cooke and Watson (2011), and others have paid much attention to solving the problems of the effectiveness of export–import activities. Shu and Steinwender (2019) determined four types of components, essential for the effectiveness and development of export–import activities and firms’ trade flows: import competition, export opportunities, access to imported inputs, and foreign competition for resources.
Alimova and Khalilova (2022) highlighted the practical aspects of the public management of the export–import potential of enterprises in Kazakhstan and Uzbekistan. Jackson and Jabbie (2020) scrutinized the background for stimulating industrial growth and potential-based development, particularly export–import potential.
Dahal et al. (2024) noted that the development of foreign trade determines the multiplier effect of GDP growth in developing countries (the example of Nepal). At the same time, it is emphasized that the GDP growth rate depends on the total volume of foreign trade, exports, imports, and direct foreign investments.
Both terms, “foreign (or international) trade” (Baláž et al., 2020; Dahal et al., 2024) and “export-import activity” (Aristei et al., 2013; Pyroh et al., 2021), are commonly used in scientific publications. Our analysis indicates that while foreign trade and export–import activity are closely related, they differ in scope. The choice of terminology often reflects the researchers’ focus—whether on separating export and import activities or incorporating additional aspects beyond trade, such as trade balance, logistics, or financial flows. Since our study does not include trade operations at the level of enterprises, we use the term “export–import activity” to assess the development and effectiveness of such operations at the country level. It is this assessment that is the basis for the development and implementation of certain strategies at the state level, aimed primarily at increasing the country’s GDP.
Vovk et al. (2021) pointed out that the assessment of export potential is the basis for the development and implementation of managerial decisions in managing the development of export activities. The set of indicators that should be used for strategy development should include the production, financial, investment, innovation, and direct export spheres estimation of the enterprise, with the corresponding ranking based on their impact on business effectiveness.
The modern technological structure of the development of national economic systems within the framework of Industry 4.0 determines the growth of the importance of intangible resources, both at the level of individual economic entities and at the macro-level (Labunska et al., 2023). An increase in the intangible component in the total potential of exporters has a synergistic effect of enhancing their export potential. The results of the study by Lee and Kwon (2021) are based on a predictive analytical model. The interactive synergistic effect of the growth of most market indicators of activity effectiveness and sustainability of US industrial companies, which is caused by R&D and a sound export strategy in the long and short term, is determined. It was this approach that determined the selection of particular indicators included in the model for assessing the effectiveness of export–import activities at the country level in the subsequent study.
Abbas and Waheed (2015) studied the macroeconomic aspects of export flows and export potential of Pakistan with its bilateral trade partners using the extended gravity model and proposed a model proving that Pakistan’s exports are positively determined by the supply capacity and demand potential of the partner country, as well as the market.
The study by Orhan et al. (2022) refutes the leading role of the impact of exports on the growth of the country’s economy when the country’s economy is not in the growth phase (example of Turkey). At the same time, economic growth expands export opportunities, and exports represent a multi-driver of growth of the country’s GDP. Love and Ramesh (2004) also confirm the hypothesis of the impact of GDP growth in the event of total growth of the country’s export. In this context, the issue of identifying economic factors affecting the development and effectiveness of export imports is based on determining the mechanism of their development over time.
It should be noted that the authors agree with the opinion of Kramer et al. (2023) that the ratio of exports to imports, which determines a country’s trade balance, is crucial to understanding the overall efficiency of export–import activity. A predominance of imports can result in a “currency outflow” from the country, potentially triggering inflationary processes in the economy.
Ditsiou et al. (2024) propose an interesting approach to the analysis of factors that cause disparities in the trade balance between the volume of exports and imports of EU countries and China by using the methods of correlation–regression analyses. Their paper examines the impact of the net export index (NEI), which measures the direct effectiveness of trade, on the indicators of the volume of imports of those goods that are directly or indirectly related to the production of export products and some variable factors, such as exchange rates, the dynamics of changes in consumer prices, etc.
Considering the crucial role of selecting appropriate methods for assessing export–import activity in shaping strategic guidelines for state policy, we note a significant number of scientific studies in this field. In the research study by Baláž et al. (2020), the Trade Complementarity Index (TCI) is suggested as the main indicator for evaluating the effectiveness of export–import activities and the trade balance between countries (or groups of countries), which allows for the identification of the unused trade potential of foreign trade between those countries. Simultaneously, they proposed to clarify this indicator by adding the export volumes of the evaluated countries within their standardized value and using a simplified gravity model to include the logistical leverage of supplies in the countries. The use of the gravity model to assess and model the development of relations between countries is discussed in the study by Lang et al. (2023). The bilateral trade attraction model was estimated by using the EGLS, two-stage EGLS, and GMM methods and included the following variables: GDP, population, distance, and trade openness between Georgia and partner countries (using the example of trade relations between Georgia and the USA). In our opinion, this approach is rather compelling, because it includes additional indicators of influence on the results of the effectiveness of export–import activity, which is also proven in the study by Hassan Khayat and McMillan (2019). But, in general, the substantiation of indicators for inclusion in the model depends on the volume of the country’s GDP, its trend changes, and many other factors, which were considered by Meyer (2021), Akhter et al. (2022), Boughanmi et al. (2016), and others.
An et al. (2017) developed a model to separate the direct and indirect effects of export tax rebate on the intensive margin of export sales at the firm level for subnational operations. The direct effect of rebate leads to a reduction in the variable costs of the exporting firm, while the indirect effect is manifested through an increase in regional wages because of the expanding demand for local labor.
It should be noted that the study by Ribeiro (2024) provides evidence that imports and exports have a persistent, negative, and significant impact on overall job creation, with this impact increasing in the long run.
The research findings of Dzikevičius and Šaranda (2016) showed that the level of unemployment in the country, the volume of exports and imports, and the volume of GDP were the most important macroeconomic factors that explained the financial indicators of business performance, relating to export–import activity. This confirms the validity of adding the unemployment level as a verification factor in a general model for assessing the development and effectiveness of export–import activity.
Jordaan (2015) describes both static and dynamic extended gravity models that identify sectors with export potential, considering whether they are reliable and stable. He says that the balance of preferences is predominantly skewed towards developed countries, reinforced by more imports and fewer exports to these countries from the developing ones. The export potential of the latter is driven by mostly unprocessed or primary products with little or no value added, added by little manufacturing activity focused on import substitution. This makes them highly vulnerable to external risks and shocks, as developing states are largely dependent on imports for their survival.
Zhang et al. (2024) considered the influence of cold logistic supply chains on international trade and concluded that modern Internet sales applications can significantly affect the total volume of final product consumption. Therefore, to expand the volume of exports and increase the efficiency of export–import activities, the possibilities of providing logistic services and the development of telecommunications and Internet services should be considered. This means that during the generation of the export–import activity feature space, these metrics must be included in the common estimation model.
Studying the systemic problems of foreign trade effectiveness relates to the transition from protectionism to economic integration, which began in the previous century. Anderson (1960) is believed to be the first to simultaneously solve the problems of exports and imports at the company’s level and forecasting export sales in the markets. O’Connell and Benson (1963) contributed to developing the theory of effectiveness of export–import activities, which is based on the economic effects of importing for companies. A significant development of the theory of foreign trade effectiveness was performed in the work by Aykol and Leonidou (2018) on importing, but their study’s weakness is the lack of methodology and a systematic approach. They used numerous indicators for the evaluation and analysis of the modern tendencies of the export–import activities’ effectiveness. Other approaches to analyzing the effectiveness of export–import activities as participation in exports exist, such as the “tipping point” by Birou and Fawcett (1993), which describes the change in a company’s strategy from “random” imports and exports to well-grounded and developed export and import strategies.
The study by Panta et al. (2021) is interesting, as it determines the causal relationship between a country’s economic growth in GDP and exports and imports by using the example of the development of the Nepalese economy, which is characterized by a significant imbalance between exports and imports.
Vrabcova et al. (2022) discuss the strategic trends of organizations in the context of new perspectives of sustainable competitiveness. Stryzhak et al. (2024) considered the possibility of a common strategy for export–import activity improvements by countries with different GDP levels. According to their conclusion, countries with different levels of economic development cannot use the same strategies for intensifying export–import activities to improve their competitive positions in the world market; developing countries can take into account the experience of more successful countries in development strategies, but they must also build their economic strategy by taking into account traditional business relations with foreign partners and the structure of their export potential.
Megits and Meyer (2023) provided a deep analysis of the impact of Russia’s aggression against Ukraine on the trade patterns of export and import flows of Poland, Ukraine’s closest neighbor, and the United States, the major trading partner. The presented data showed the disruption of the volume of trade flows in general and in certain sectors of the economy, which reflected the changes in trade patterns and strategies, and adjustment to the risk factors, which highlighted the importance of the strategic management of export–import activity under geopolitical stability.
Many scientists and practitioners believe that Ukraine needs foreign assistance, such as the Marshall Plan, to restore its economic potential (Trofimchuk, 2022; Chebotarov et al., 2023; Nestor, 2023). Also, the accelerated development of innovation will contribute to the national economy’s recovery and its further development.
The WTO experts developed a practical guide to trade and policy analysis to help in the quantitative methods of research application. In their approach, the descriptive statistics of international trade draw a picture of a country’s trade performance, which is based on three main questions: (1) How much does a country trade? (2) What does a country trade? (3) With whom does a country trade? These focuses of study cover the volume, product, and geographical structure of foreign trade. The answer to the first question is based on the degree of a country’s openness, which is measured on the base of the country’s openness ratio (the export plus import ratio to GDP (WTO, 2012, p. 15)). The geographical and sectoral composition of trade is important, as its characteristics give answers to the second and third questions. The indicators proposed for this analysis are the Grubel–Lloyd index, which is a widely used measure of intra-industry trade; the inverse Herfidahl concentration index, which was recommended for export diversification assessment; the Revealed Comparative Advantage index (the Balasse index) and its normalization version; the PRODY index; the indicator of factor intensities of trade product; and the regional intensity of trade and Trade Complementarity Indices, which have become a traditional measurement of a country’s trade performance. Also, some other important concepts were added to this assessed picture, among which are the real effective exchange rate and the terms of trade.
The quantitative and qualitative approaches for trade impact assessment, as well as the main steps of its methodology, were proposed by the UCTAD (2022). Despite this Guide focusing on trade policy impact, the set of indicators for trade analysis is considered. This set includes the Revealed Comparative Advantage (RCA) index, the Trade Intensity Index (TII), the Trade Complementarity Index (TCI), the Herfindahl–Hirschman indices (HHIs) and their normalized versions, the Index of Export Market Penetration (IEMP), and the Grubel–Lloyd Index (GLI). The different models (the partial equilibrium model, the computable general equilibrium (CGE) model, the Global Trade Analysis Project (GTAP) model, and the gravity model) were mentioned as possible methodological tools for trade investigation.
However, the experts of OECD/Eurostat (2018) pointed out the possibilities and necessity of the strategy of measurement development. In broad terms, their approach applies to the methodology of assessment of different economic and managerial processes and phenomena. They concluded that the choice of which methods to use for the assessment depends on the quality of the data collected and their intended use; the assessment methodology can vary over time according to user needs, and the types of data that can be collected evolve in response to new opportunities or challenges.
It should be noted that traditional methods of assessment and forecasting are mostly based on macroeconomic indicators with relatively significant lags, which reduces their accuracy especially in times of economic shocks (Stundziene et al., 2023). To solve this problem under conditions of uncertainty, an assessment of the impact of the main factors, the trends of which are interconnected in time, should be made (Istaiteyeh et al., 2023).
Going through the literature, we found an abundance of research on export–import activity. However, the question of improving the methodological toolkit for export–import activity evaluation requires continuous study, especially in light of modern factors. The recovery of Ukraine’s economy, which remains in a state of collapse, demands new, unconventional approaches to policy development.
Thus, this study is targeted to contribute to the assessment and analysis of export–import activity, which is critical to formulating sound policies related to export–import activity at the national economy level, for path “mapping” for future development.
3. Data and Research Methodology
3.1. Methodological Approaches for Export–Import Activity Assessment
Our methodology was developed with the assumptions of studying the development and effectiveness of international trade in Ukraine, modern tendencies of digital service trade, and data availability.
The informational basis for the assessment of export–import activity consists of a hierarchical system of indicators. The elaboration of strategic directions of export–import activity needs the assessment of the achieved level of its development and effectiveness. Managerial approaches advise considering a hierarchical system of indicators to assess various economic processes relating to the effectiveness of export–import activity by using the comparison of the achieved values with the reference (normative, planned, and optimal) in static and dynamic environments (Cherednichenko et al., 2023), the deviation analysis to make a decision on improvement, and the search for reserves for further development (Hudakova & Adamko, 2016; Kolodiziev et al., 2021).
The levels of development and effectiveness of the export–import activity might be assessed by the value of the integral indicator, which is obtained by the convolution of the system of partial indicators. Partial convolution is usually made by factor analysis, canonical correlations, multidimensional scaling, cluster, and discriminant analysis, i.e., methods of multidimensional statistical analysis. The methods of an integral indicator calculation, such as multiplicative convolution, additive convolution, the integral taxonomic indicator of development, and the Harrington integral quality indicator, carry out the complete convolution of the system of partial indicators. As a result of full convolution, the system of partial indicators is integrated into one value, which is called an integral indicator (Malyarets et al., 2017).
3.2. Evaluation Techniques for Assessing the Development and Effectiveness of Export–Import Activities
The evaluation of export–import activities is a technology-driven process. The evaluation technique is a consequence of the operational stages of the evaluation process using appropriate methods and tools. Evaluating the development and effectiveness of export–import activities according to this technique ensures their solidity.
The appropriate state policy is based on the results of the assessment of export–import activities. In other words, to improve this effectiveness and to identify reserves, the assessment of export–import activities serves as a scientific basis for public affairs. The results of this assessment should be used to develop all strategic, tactical, and operational decisions.
The techniques of assessment of export–import activities are proposed to be combined into four blocks: a goal and task setting block, an informationally instrumental block, an analytical processing block, and a management block. Figure 5 illustrates the logic of the proposed blocks and steps of the assessment techniques for the development and effectiveness of export–import activities.
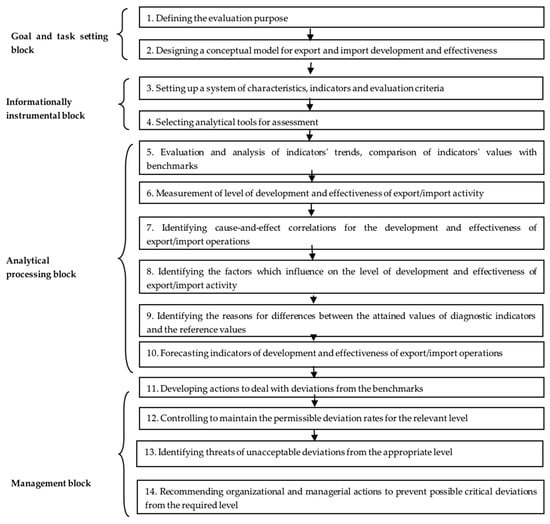
Figure 5.
Techniques to assess export–import development and effectiveness.
3.3. System of Indicators of Development and Effectiveness of Export and Import Activities
The assessment of export–import activity is based on its feature space design, which is described by a system of variables of its characteristics. The system of indicators of development and effectiveness of export–import activity is represented by the following tuple of composed and partial indicators:
where the following apply:
- Ost(e1,…ek)—variables of structure components of the development and effectiveness of export–import activity;
- Oopr(e1,…en)—variables of processes of the development and effectiveness of export–import activity;
- Om(e1,…em)—variables of mechanisms of the development and effectiveness of export–import activity;
- Oof(e1,…ep)—variables of factors of influence of external and internal environments;
- Ke—effectiveness criteria;
- Kd—criterion of development.
Scientists Shtal et al. (2018), Sytnyk et al. (2022), and Sidak et al. (2020), who have studied the problems of Ukraine’s export–import activity and identified its factors, proposed the following macroeconomic indicators for the assessment of its development and effectiveness: the values of exported goods, the value of imported goods, the trade balance, the value of industrial products sold in a domestic market, the value of exported industrial products, the consumer price index, direct investment, etc.
The authors’ approach to the formation of a set of indicators in the “development–effectiveness“ plane expands the early-developed set by including some indicators of service trade and unemployment. The set of indicators used to evaluate the integrated indicators of export–import activity development and efficiency may vary from country to country. The selection of these indicators depends on the strategic direction of a country’s development, the structure of its trade balance, and the internal factors of its national economic system.
In our study, for the assessment of the development (Id) of Ukraine’s export–import activity, the main characteristics of the country’s market positions in international trade were selected, primarily based on statistical indicators used by EU countries (EUROSTAT, 2024). These indicators include the value of exported goods, the value of imported goods, the value of exported services, and the value of imported services.
However, considering the structure of Ukraine’s national export, where according to the National Bank of Ukraine (2024), services account for 32.4% of total exports (USD 16,602 million), special attention was paid to this category of export activity. Telecommunications, computer, and information services were identified as strategically significant for the further development of exports, representing 41.46% of service exports in 2023 (USD 6.884 million). Additionally, the total volume of R&D service exports, accounting for 7.07% (USD 285 million) of total service exports, was deemed strategically important for maintaining Ukraine’s position in global markets as a country with high intellectual and research potential.
Other countries, such as most EU member states, may add additional indicators to this pool based on their national economic priorities. For instance, in EU countries, business services (23.4% of total service exports) and transport services (17.7%) are often included as key indicators. Unfortunately, for Ukraine, these services cannot currently be considered priorities in export development due to significant economic and physical risks associated with military operations within the country. As a result, they were only included in the general indicator for service exports.
Other indicators of export activity development can also be adjusted based on the macroeconomic priorities of a country.
Given the current limitations on the availability of statistical data in Ukraine, the set of indicators for this study was restricted to those proposed by the authors, as shown in Figure 6.
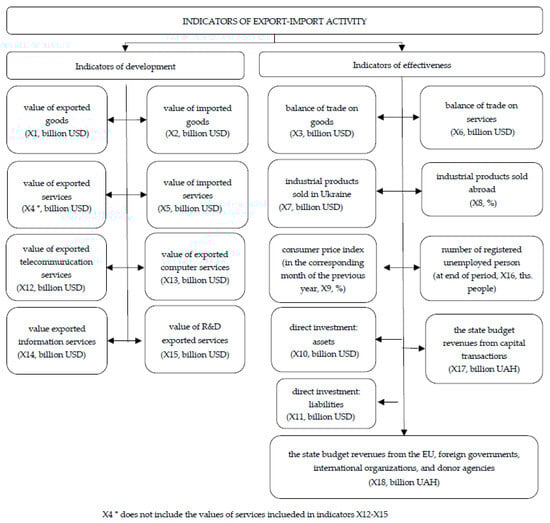
Figure 6.
Set of indicators of export–import activity.
The authors’ approach to developing a set of indicators for evaluating the integral indicator of export–import activity efficiency (Id) involves expanding the standard set by including indicators that are strategically important for Ukraine in preserving its export potential as an industrial economy. These indicators include the percentage of industrial products sold within Ukraine as part of the total turnover and the percentage of industrial products sold abroad as part of the total volume of industrial products sold. Equally important is the indicator of domestic market development, which may be negatively impacted by excessive export orientation, such as the consumer price index (compared with the same month of the previous year, %).
Social indicators of the country’s development, especially during and after wartime, are also strategically important. For example, the number of registered unemployed persons is included in the overall set (Figure 6).
Additionally, traditional indicators for evaluating export–import efficiency, such as direct investment in assets and direct investment in liabilities, have a direct impact on the country’s general macroeconomic indicators and were also included in the corresponding set (Figure 6).
The authors also included state budget revenues from the EU, foreign governments, international organizations, and donors in the set of indicators. This factor is crucial for the country’s economic development, especially in the context of the socio-economic shock caused by Russia’s military aggression. This indicator can also be used to assess the prospects for export–import activity development in the post-war recovery period. Furthermore, such an indicator is valuable for countries with developing economies.
The presented set of indicators of the development and effectiveness of export–import activity was developed by considering the data availability of official statistics in Ukraine, which are from the official sources of the State Statistics Service of Ukraine (2024), the Ministry of Economy of Ukraine (2024), and the National Bank of Ukraine (2024).
4. Results and Discussion
The results of the descriptive statistical analysis of the export–import activity indicators (monthly value for 2022–2023) are submitted in Appendix A. This analysis corresponds to the steps of “the block of analytical processing” (Figure 5).
The analysis of the standardized coefficients of asymmetry and kurtosis shows that the following indicators are close to a normal distribution: export of goods, import of goods, balance of export–import of goods, liabilities, export of services, import of services, value of sold industrial products in Ukraine, value of exported industrial products, consumer price index, direct investments in assets, direct investments in liabilities, value of research and development services, number of registered unemployed, and revenue of the state budget from operations with capital. The distribution of the following variables is far from normal: the balance of trade in services, the value of telecommunication services, the value of computer services, the value of information services, and the income of the state budget of the European Union, international organizations, and other donor institutions. The asymmetry of this variable distribution is explained by the significant changes during the war.
4.1. Determining the Levels of Development and Effectiveness of Export and Import Activities
Determining the level of development and the level of effectiveness of export–import activity involves the calculation of integral indicators. The application of the integral taxonomic indicator of development has the following advantages: it has a clear interpretation and a simple calculation algorithm (Diamantopoulos & Winklhofer, 2003; Ponomarenko & Malyarets, 2009). The taxonomic integral indicator of development may have values from 0 to 1. The closer the value of the integral indicator to 1, the higher the level of development of export–import activity.
The procedure for calculating the integral taxonomic development indicator involves the following steps:
- (1)
- Definition of stimulators (indicators whose increasing values tend to increase the studied processes of development or effectiveness), destimulators (indicators whose increasing values tend to decrease the studied processes of development or effectiveness), and nominators (indicators the trends of which are different in different current periods) among the indicators in the system:where is the number of the type of indicator in the -period;
- (2)
- Setting the standard value of each xi according to the min/max criterion;
- (3)
- Standardization of indicators:
- (4)
- Calculation of integral taxonomic indicators:where —the standardized value of indicators; —the mean of indicators, —the standard deviation of indicators; —the distance of standardized value of indicators to the standard; —the mean of distances; and —the mean of square root of distances.
The calculation of the taxonomic indicator might have the problem related to the definition of the values of and . The value is a number of standard deviations in fractions , which can be equal to 2, if the distribution is symmetric, or equal to 3 in the general case. Most often, is taken equal to 3. If a proper level of accuracy is needed, then all the distributions of the indicators’ values should be tested for symmetry.
The application of this algorithm for calculating the integral taxonomic indicator to determine the levels of development and efficiency of export–import activity made it possible to scale their values and construct the “level of development (Id)—efficiency (Ie)” matrix. Determining the level of export–import activity in the “level of development (Id)—efficiency (Ie)” matrix provides an opportunity to diagnose the state of this activity’s dimensions on the plane (Figure 7, Appendix B).
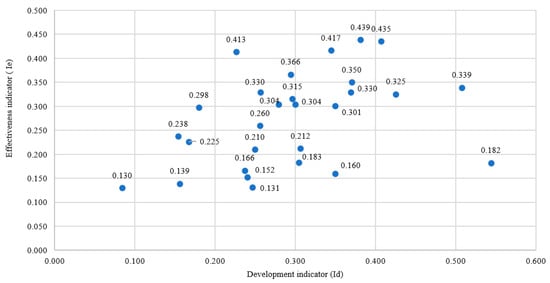
Figure 7.
Monthly levels of development and effectiveness of export–import activities in Ukraine in 2021–2023 (April included).
The assessment of export–import activity is based on both the partial and integral indicators that reflect the level of its development and effectiveness and was considered on the plane “level of development (Id)—effectiveness (Ie)”. This approach for integral indicators calculation was used to show the changes in export–import activity within the space “level of development (Id)—level of effectiveness (Ie)” (Figure 7).
Figure 7 highlights the dichotomy of development–effectiveness of export–import activity and shows that a high level of development may be accompanied by a low level of effectiveness in export–import activity, or the low level of development, for example, Id = 0.226, is observed when the level of effectiveness Ie = 0.413 is relatively high (Figure 7). The strength of the relationship between the levels of development and effectiveness of export–import activity according to the paired correlation coefficient is equal to 0.399, which is low and testifies to the weak relationship between the integrated indicators of these dimensions.
The revealed weak association between the levels of development and efficiency of export–import activity establishes the grounds for the conclusion that a high level of development is not accompanied by a high level of effectiveness of export–import activity, which makes both focuses in government economic policy necessary, i.e., both the development and effectiveness of export–import activity.
It should be noted that the study period 2021–2023 (incl. April) consists of two different operating conditions: pre-war and wartime. The integrated indicators of development and effectiveness are on average higher for the pre-war period. The war negatively influenced the analyzed dimensions of Ukraine’s export–import activity, and the average levels of their indicators are lower than in the pre-war period.
The comparative assessment was made separately for the pre-war and war sub-periods. Figure 8 and Figure 9 show the levels of development and effectiveness of export–import activity for two different operating conditions in these sub-periods.
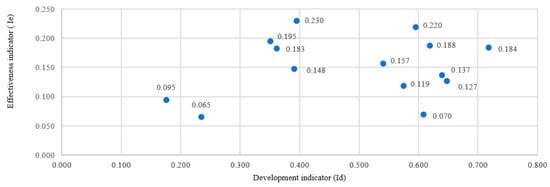
Figure 8.
Monthly levels of development and effectiveness of export–import activity in Ukraine 2021–2022 (incl. February).

Figure 9.
Monthly levels of development and effectiveness of export–import activities in Ukraine in 2022 (incl. March)–2023 (incl. April).
The data analysis shows that the level of export–import activity development was relatively high in the pre-war period (86% of indicators are in the corridor between 0.359 and 0.720), but the value of the effectiveness indicators of export–import activity did not exceed 0.230.
Figure 9 shows that the war period demonstrated a higher level of effectiveness of export–import activity and a lower level of development in comparison with the pre-war period. These revealed facts are explained by the huge reduction in resources, production, and exports caused by war, which influenced export–import activity development and the growth of the component of state budget revenues from the EU, foreign governments, international organizations, and donor agencies that positively influenced the effectiveness.
Therefore, a comprehensive evaluation of the export and import opportunities used is worthy to carry out for the entire period, as well as for sub-periods, which are characterized by different conditions. A comparison of the sub-periods before and during the war was made. The separate analysis of these sub-periods allows for the study of the processes and their dependencies under different conditions.
4.2. Forecasting of Development and Effectiveness Indicators of Export–Import Activity
A better understanding of the levels of development and effectiveness of export–import activity is possible on the basis of forecasting partial indicators. The forecast of these indicators is carried out according to analytical functions presented in trend curves, which were constructed on the monthly data (from March 2022 to April 2023). The trend models for these indicators are presented in Table 1.

Table 1.
The models of the trend models for the development and effectiveness indicators.
A short-term forecast for the next three periods was performed on the base of defined trend models and with corrections based on security probability (Table 2).
Table 2.
Forecasted indicators of export–import activities, comprising the probability of foreign economic security.
Encompassing the probability of foreign economic security, the forecast values of the following indicators are increasing: export and import of goods, export and import of services, sales of industrial products in Ukraine, consumer price index, direct investment in liabilities, research and development services, state budget revenues from capital transactions, and state budget revenues from the European Union, foreign governments, international organizations, and donor agencies. Downward trends in forecasts are observed for the balance of export–import of goods, volume of telecommunications services, and number of registered unemployed.
The approach that uses the probability of security of foreign economic activity to determine the export and import forecast can be implemented at the macro-level of a national economy to develop state economic policy and take public actions to overcome a crisis in export–import activity and ensure its development and effectiveness.
4.3. Cointegration of Time Series of Export–Import Activity and Its Use for Estimation Under Conditions of Uncertainty
Under conditions of uncertainty, it is advisable to assess export–import activity by using the cointegration of some economic indicators that determine it. The problem of detecting cointegration between the time series of indicators is complex. It is recommended that the mechanisms of interrelationship in the system of export–import activity indicators be first specified by using multidimensional factor analysis.
Since there are linearly dependent indicators in the above factor system, we will remove them and leave only linearly independent ones. It is better to rate the correlation of factors by the weighting coefficients of the first latent factor (F), which explains 44.322% of the variability of the initial system of indicators (Equation (1)):
The most important factor is the state budget revenues from capital transactions, followed by the consumer price index; the balance of export and import of goods; the state budget revenues from the European Union, foreign governments, international organizations, and donor agencies; the number of registered unemployed; direct investment (assets); the balance of export and import of services; and the amount of Ukrainian industrial products sold abroad. Factors with weighting coefficients below 0.5 should not be considered.
The assessment of export–import activity under conditions of uncertainty and under the influence of factors whose variation is interconnected in time should take into account their cointegration, since changes in one factor will lead to changes in another.
To establish the true causal dependence of two or more time-series variables, revealing their cointegration is necessary, provided that their linear combination is a stationary time series. The problems of stationarity in time series have been solved in the works by Box and Jenkins (1970), Banerjee et al. (1993), Pucheta et al. (2019), Mackinnon (1991), and others.
Despite the random nature of changes in partial economic indicators, there is a long-run dependence among them which causes a common, interrelated change. To determine whether a series of economic indicators is cointegrated, it is recommended to first calculate the dependence of the resultant factor on other indicators, which may be included in the indicator system.
The balance of the export and import of goods is an effective factor in the system of key indicators that determines the effectiveness of the export–import potential, so it is necessary to calculate its dependence on other factors that are closely related, using factor analysis.
The equation for the dependence of the balance of goods (Y) on the main factors that determine export–import activity, significant according to Student’s criterion, is as follows (Equation (2)):
Thus, the balance of the export and import of goods is influenced by the consumer price index, the number of registered unemployed, and the state budget revenues from the European Union, foreign governments, international organizations, and donor agencies, and the variability of these factors explains 92.87% of the variability of the balance of the export and import of goods. Other factors are not significant according to Student’s criterion. In general, the regression equation is significant according to Fisher’s criterion.
The hypothesis of cointegration of the time series was tested by using the Engel–Granger criterion. To do this, we constructed the following regression model (Equation (3)):
where is the first difference in the residuals from the equation and
The regression equation for this task is Δεt = 446.067 + 0.712⋅ε(t − 1).
Student’s criterion calculated for the correlation coefficient is equal to 3.788 (tb = 3.788), which is much higher than the table value at α = 0.01; the null hypothesis of no cointegration of the time series under consideration is rejected; and the alternative hypothesis that there is cointegration between the series Yt and Xit is accepted with a probability of 0.99, i.e., there is cointegration between the series of the export–import balance of goods and the consumer price index, the number of registered unemployed, and the state budget revenues from the European Union, foreign governments, international organizations, and donor agencies. Therefore, a change in these factors will lead to a change in the balance of trade in goods and thus to a change in the development and effectiveness of the country’s export–import activity, which is the basis for developing effective programs for the country’s recovery and development.
4.4. Discussions and Limitations
The differences in the proposed methodological framework for assessing the development and effectiveness of export–import activities lie in its complexity and the justification of the choice of analytical tools. Existing proposals for such an assessment are fragmentary. For example, Voloshan (2019) focused on the analytical definition of partial indicators for assessing the efficiency of export activities but did not pay attention to the need to consolidate the proposed system of indicators into a single value for an unambiguous determination of efficiency. This shortcoming is also present in the studies on the effectiveness of foreign economic activities by Melnyk and Logvinenko (2007), who similarly prioritize the calculation of partial indicators rather than focusing on the evaluation methodology itself, again failing to consider the reduction in indicators into a single measure.
The methodological basis for assessing the effectiveness and development of export–import activities proposed in this article is conceptually similar to the methodology for assessing the efficiency of using the export–import potential of an enterprise, presented by Fatyanov (2022). His work also proposes the use of methods for constructing a taxonomic development indicator and a structural dynamics indicator to assess the levels of efficiency of using export–import potential, as well as regression analysis and canonical correlation analysis, to identify the cause–effect relationship in the processes of this potential. However, Fatyanov does not recognize the need to consider both effectiveness and development simultaneously, which is a significant limitation of his research.
Grynko (2020) also acknowledges the need for a logical framework for evaluating the effectiveness of export–import activities, which involves the use of methods for constructing integrated indicators to assess the levels of effectiveness of export–import activities and their structural dynamics, factor and regression analysis to determine the impact of internal and external factors on the effectiveness of export–import activities, and growth curve models to forecast the values of partial and integrated indicators. However, Grynko (2020) also fails to simultaneously consider the two main characteristics of export–import activities—effectiveness and development—and does not address the uncertainty conditions in forecasting. Many other researchers who have studied the evaluation of export–import activities have focused either on effectiveness or development.
A major scientific interest in this regard is the development of the cointegration method, which is recommended for making forecasts under conditions of uncertainty. In this context, it is appropriate to consider either the level of effectiveness of export–import activities or the level of development of these activities as the dependent variable. However, this will constitute the subject of further research.
In the study by Istaiteyeh et al. (2023), the cointegration method was applied to examine the relationship between GDP, exports, imports, and gross capital accumulation in Jordan. However, tests for unit roots (Dickey–Fuller and Phillips–Perron) and the Johansen trace test confirmed the absence of cointegration. As a result, the authors used autoregressive models to explore causal relationships. In contrast, our study applies an improved approach to defining the cointegration between indicators.
To assess the cointegration of the commodity balance with the key factors affecting export–import activities, we conducted a factor analysis. The most influential factors turned out to be the consumer price index, the number of registered unemployed individuals, and revenue of the national budget from the European Union, foreign governments, international organizations, and donor organizations. We then developed a regression model to describe the relationship between the commodity balance and these key factors.
The hypothesis of cointegration between the time series of these indicators was confirmed by using the Engel–Granger test. The proposed approach to the cointegration method offers a clearer interpretation of the relationships between the time series of indicators, provided such relationships exist.
The scientific novelty of the methodology proposed in this study lies in its ability to evaluate the results of export–import activities at the national economy level, considering both the developmental and effectiveness aspects. Furthermore, it enables the forecasting of changes in partial indicators, which can be incorporated into the development of future national strategies.
A significant limitation of this study is that it is based on data from the Ukrainian economy, and the approach has not yet been validated at the sectoral level. Nonetheless, the authors believe that the proposed dichotomous approach to evaluating export–import activities is universal, requiring only the adaptation of the indicator set in the integrated evaluation of development and effectiveness depending on the country or specific sectors of the economy.
5. Conclusions and Recommendations
The problem of intensifying export–import activity is key for countries’ development under globalization. The development of the country’s export–import activity can become a lever and multiplier factor for the growth of the national economy and the improvement of its competitiveness in world markets. For the Ukrainian economy, which is in a deep crisis as a result of the Russian aggression, the development and effectiveness of export–import activities should become a significant factor in its recovery, but the crisis processes also covered the sphere of the country’s foreign trade. Only the export of goods and services decreased by 35.2% in 2022 in Ukraine and was only 53.2% in 2023 compared with its level in 2021. Negative trends were also observed in import activity: in 2022, commodity imports accounted for 76.0% of their volume in 2021, and in 2023, they reached 87.4% of their level in 2021. The consequence of the export–import activity scope reduction and imbalances has become trade balance deterioration.
The methodological support for the comprehensive assessment of export–import activity and the identification of the main factors that influence its scope and effectiveness contribute to the foundation for state policy development in different countries, especially it is essential for countries suffering from crisis tendencies.
In this study, a methodological approach to the assessment of export–import activity was proposed; it includes the conceptual model and technology of its assessment and implementation, a feature space for evaluation of the dichotomy of export–import activity development and effectiveness, a set of the main indicators of evaluation, trend, and regression models for the analysis and forecasting of export–import activity.
The proposed techniques of the assessment of export–import activities include four blocks: (1) a goal and task setting block, (2) an informationally instrumental block, (3) an analytical processing block, and (4) a management block.
Based on the proposed methodology, a matrix in the space “development (Id)—effectiveness (Ie)” was built for the Ukrainian case in 2021–2023. Its analysis showed the reduction in the average levels of the development and effectiveness indicators in pre-war and war sub-periods, which established the grounds for the recommendation to consider these processes for the entire period as well as for separate sub-periods, which are under the influence of different factors. The revealed weak correlation between the levels of development and effectiveness of export–import activity testifies that a high level of development is not accompanied by a high level of effectiveness of export–import activity, causing the necessity of both focuses in the government policy, i.e., both the development and the effectiveness of export–import activity.
Trend models were designed for the indicators of development and effectiveness of export–import activity in Ukraine, and the cointegration of the time series of indicators was determined to establish trends under conditions of uncertainty. These trend models were used for the forecasting of the mentioned indicators and were corrected by considering the probability of the country’s foreign economic security.
The constructed regression model defines that the main factors for the Ukrainian balance of the export and import of goods, which is an important indicator of export–import activity effectiveness, were the consumer price index, the number of registered unemployed, the state budget revenues from the European Union, foreign governments, international organizations, and donor agencies in the research period. The variability of these factors explains 92.87% of the variability of the balance of the export and import of goods, and the dependent variables are in indirect relationships with the first two factors (the consumer price index and the level of unemployment) and direct dependence on the third factor of the model. These factors should be at the center of government policy for increasing the effectiveness of export–import activity.
This study proved the necessity of carrying out an intelligence analysis of the time-series indicators of the development and effectiveness of export–import activities. When determining the strategic orientations of export–import activity, it is recommended to use the cointegration property of a set of economic indicators, which will make it possible to use the correlation between the change in the trend of factors and the change in the trend of the dependent variable.
The limitations of this study deal with the special case of forecasting and regression models that were developed by the usage of a database for a specific period (2021–2023) and specific country (Ukraine). In addition, the applied set of indicators of development and efficiency of export–import activities, despite the fact that it was formed by taking into account the main trends and the availability of data, reflects the authors’ choice of most valuable indicators that may affect the integral indicators. However, the proposed techniques of the export–import activity assessment and the approach to studying the dichotomy “development—effectiveness” of it are universal and might be adjusted and used for future research on export–import activity in different countries.
Author Contributions
Conceptualization and methodology: L.M. and S.L.; Writing and original draft preparation: L.M., S.L., and H.B.; Data collection and analysis: L.M. and H.B.; Data interpretation: L.M., S.L., and V.O.; Design and development of data analysis L.M. and M.S.; Review and editing: V.O. and M.S.; Visualization: L.M. and M.S.; Project administration, S.L. All authors have read and agreed to the published version of the manuscript.
Funding
This research study was funded by the EU Next Generation EU through the Recovery and Resilience Plan for Slovakia under project No. 09I03-03-V01-00081.
Institutional Review Board Statement
Not applicable.
Informed Consent Statement
Not applicable.
Data Availability Statement
Data are contained within the article.
Conflicts of Interest
The authors declare no conflicts of interest.
Appendix A
Table A1.
Descriptive statistics of indicators of export–import activity (Ukraine, 2021–2023).
Table A1.
Descriptive statistics of indicators of export–import activity (Ukraine, 2021–2023).
| Variable | Mean x | Median Me | Standard Deviation σ | Coefficient of Variation V | Minimum Value of Indicator Xmin | Maximum Value of Indicator Xmax | Span Δ | Standardized Coefficient of Asymmetry Stnd sk | Standardized Kurtosis Coefficient Stnd krt |
|---|---|---|---|---|---|---|---|---|---|
| X1 | 4255.30 | 3969.65 | 1225.56 | 0.29 | 2293.00 | 6365.00 | 4072.00 | 0.51 | −1.24 |
| X2 | 5187.51 | 5088.45 | 1230.99 | 0.24 | 1976.00 | 7689.00 | 5713.00 | −0.87 | 1.31 |
| X3 | −932.21 | −855.20 | 701.12 | 0.75 | −2590.60 | 317.00 | 2907.60 | −0.65 | −0.39 |
| X4 | 1419.32 | 1341.50 | 218.26 | 0.15 | 1073.00 | 1954.00 | 881.00 | 1.53 | −0.43 |
| X5 | 1748.21 | 1607.00 | 599.21 | 0.34 | 906.00 | 2800.00 | 1894.00 | 0.38 | −1.69 |
| X6 | −328.89 | −209.50 | 715.35 | 2.18 | −1375.00 | 539.00 | 1914.00 | −0.22 | −2.09 |
| X7 | 262,990.00 | 253,749.00 | 57,652.60 | 0.22 | 184,324.00 | 399,626.00 | 215,302.00 | 1.38 | 0.12 |
| X8 | 24.25 | 23.00 | 4.56 | 0.19 | 17.00 | 32.00 | 15.00 | 0.70 | −1.34 |
| X9 | 15.94 | 12.50 | 7.21 | 0.45 | 6.00 | 27.00 | 21.00 | 0.82 | −1.66 |
| X10 | 17.46 | 16.00 | 62.90 | 3.60 | −101.00 | 122.00 | 223.00 | −0.31 | −0.73 |
| X11 | 330.61 | 212.00 | 362.56 | 1.10 | −633.00 | 940.00 | 1573.00 | −0.22 | 0.44 |
| X12 | 0.00 | 0.50 | 5.48 | % | −19.00 | 10.00 | 29.00 | −2.67 | 4.89 |
| X13 | 532.32 | 524.00 | 80.93 | 0.15 | 358.00 | 788.00 | 430.00 | 2.27 | 3.41 |
| X14 | 1.86 | 2.00 | 1.35 | 0.73 | −1.00 | 6.00 | 7.00 | 1.64 | 2.61 |
| X15 | 18.00 | 18.00 | 3.83 | 0.21 | 10.00 | 25.00 | 15.00 | −0.14 | −0.29 |
| X16 | 291.46 | 290.95 | 94.21 | 0.32 | 127.00 | 489.60 | 362.60 | 0.70 | 0.18 |
| X17 | 311.05 | 297.10 | 233.00 | 0.75 | −0.80 | 815.00 | 815.80 | 0.73 | −0.89 |
| X18 | 90,515.50 | 3746.20 | 138,803.00 | 1.53 | 0.00 | 481,091.00 | 481,091.00 | 3.32 | 1.41 |
Source: authors’ calculations.
Appendix B
Table A2.
Integrated indicators of monthly levels of development and effectiveness of export–import activities in Ukraine in 2021–2022 (incl. February).
Table A2.
Integrated indicators of monthly levels of development and effectiveness of export–import activities in Ukraine in 2021–2022 (incl. February).
| t | 1 | 2 | 3 | 4 | 5 | 6 | 7 | 8 | 9 | 10 | 11 | 12 | 13 | 14 |
|---|---|---|---|---|---|---|---|---|---|---|---|---|---|---|
| Ie | 0.238 | 0.225 | 0.304 | 0.350 | 0.366 | 0.413 | 0.417 | 0.439 | 0.435 | 0.325 | 0.304 | 0.330 | 0.339 | 0.182 |
| Id | 0.154 | 0.167 | 0.279 | 0.370 | 0.294 | 0.226 | 0.344 | 0.381 | 0.407 | 0.426 | 0.300 | 0.370 | 0.508 | 0.544 |
Table A3.
Integrated indicators of monthly levels of development and effectiveness of export–import activities in Ukraine in 2022 (incl. March)–2023 (incl. April).
Table A3.
Integrated indicators of monthly levels of development and effectiveness of export–import activities in Ukraine in 2022 (incl. March)–2023 (incl. April).
| t | 15 | 16 | 17 | 18 | 19 | 20 | 21 | 22 | 23 | 24 | 25 | 26 | 27 | 28 |
|---|---|---|---|---|---|---|---|---|---|---|---|---|---|---|
| Ie | 0.152 | 0.183 | 0.160 | 0.131 | 0.139 | 0.212 | 0.260 | 0.298 | 0.315 | 0.210 | 0.130 | 0.166 | 0.301 | 0.330 |
| Id | 0.241 | 0.305 | 0.350 | 0.247 | 0.156 | 0.307 | 0.256 | 0.180 | 0.297 | 0.250 | 0.084 | 0.237 | 0.350 | 0.257 |
References
- Abbas, S., & Waheed, A. (2015). Pakistan’s potential export flow: The gravity model approach. The Journal of Developing Areas, 49(4), 367–378. [Google Scholar] [CrossRef]
- Akhter, S., Mir, M. A., & Megits, N. (2022). The linkage between international trade and economic growth in Kazakhstan. Journal of Eastern European and Central Asian Research (JEECAR), 9(6), 1021–1033. [Google Scholar] [CrossRef]
- Alimova, S. A., & Khalilova, M. N. (2022). State management of foreign economic activity of enterprises. Galaxy International Interdisciplinary Research Journal, 10(10), 364–369. [Google Scholar]
- An, L., Hu, C., & Tan, Y. (2017). Regional effects of export tax rebate on exporting firms: Evidence from China. Review of International Economics, 25(4), 774–798. [Google Scholar] [CrossRef]
- Anderson, H. (1960). Peculiar to export sales forecasting. Journal of Marketing, 24(4), 39–42. [Google Scholar] [CrossRef]
- Aristei, D., Castellani, D., & Franco, C. (2013). Firms’ Exporting and Importing Activities: Is there a Two-way Relationship? Review of World Economics, 149, 55–84. [Google Scholar] [CrossRef]
- Aykol, B., & Leonidou, L. C. (2018). Exporter-importer business relationships: Past empirical research and future directions. International Business Review, 27(5), 1007–1021. [Google Scholar] [CrossRef]
- Baláž, P., Královičová, M., & Steinhauser, D. (2020). Foreign trade as a tool to strengthen the EU’s competitiveness against China (A case of the service sector). Prague Economic Papers, 29(2), 129–151. [Google Scholar] [CrossRef]
- Banerjee, A., Dolado, J., Galbraith, J., & Hendry, D. (1993). Co-integration, error correction and the econometric analysis of non-stationary data. Oxford University Press. [Google Scholar]
- Birou, L. M., & Fawcett, S. E. (1993). International purchasing: Benefits, requirements, and challenges. International Journal of Purchasing and Materials Management, 29(1), 27–37. [Google Scholar] [CrossRef]
- Boughanmi, H., Al-Shammakhi, A., & Antimiani, A. (2016). Deeper integration or wider integration? The case of the gulf cooperation council. Journal of Economic Integration, 31, 206–233. [Google Scholar] [CrossRef]
- Box, G., & Jenkins, G. (1970). Time series analysis: Forecasting and control. Holden Day. [Google Scholar]
- Chebotarov, V., Glinkowska-Krauze, B., & Chebotarov, I. (2023). “Marshall plan for Ukraine”: Rationale for a systemic approach to development and proposals for institutional support. Galician Economic Journal, 1(80), 98–108. [Google Scholar] [CrossRef]
- Cherednichenko, O., Ivashchenko, O., Cibák, L., & Lincenyi, M. (2023). Item matching model in e-commerce: How users benefit. Economics and Culture, 20(1), 77–90. [Google Scholar] [CrossRef]
- Cooke, S., & Watson, P. (2011). A comparison of regional export enhancement and import substitution economic development strategies. Journal of Regional Analysis and Policy, 41(1), 201–215. [Google Scholar]
- Dahal, A. K., Bhattarai, G., & Budhathoki, P. B. (2024). Impact of foreign trade and foreign direct investment on economic growth: Empirical insights from Nepal. Problems and Perspectives in Management, 22(1), 390–400. [Google Scholar] [CrossRef]
- Diamantopoulos, A., & Winklhofer, H. (2003). Export sales forecasting by UK firms: Technique utilization and impact on forecast accuracy. Journal of Business Research, 56(1), 45–54. [Google Scholar] [CrossRef]
- Ditsiou, A., Darvidou, K., & Siskos, E. (2024). The bilateral trade imbalances between the EU and China: Structure and trends. Problems and Perspectives in Management, 22(2), 137–149. [Google Scholar] [CrossRef]
- Dzikevičius, A., & Šaranda, S. (2016). Establishing a set of macroeconomic factors explaining variation over time of performance in business sectors. Business: Theory and Practice, 17(2), 159–166. [Google Scholar] [CrossRef]
- Eatwell, J., Milgate, M., & Newman, P. (1987). Import substitution and export-led. In The New Palgrave: A dictionary of economics. Macmillan. [Google Scholar] [CrossRef]
- Etahisoa. (2020). The impact of import-export on economic growth in madagascar. Journal of Smart Economic Growth, 5(3), 57–66. [Google Scholar]
- EUROSTAT. (2024). An official website of the european union. Available online: https://ec.europa.eu/eurostat/databrowser/view/bop_its6_det__custom_13949206/default/table?lang=en (accessed on 1 January 2025).
- Fatyanov, D. (2022). Methodical provision of assessment of the efficiency of the use of the enterprise’s export-import potential. The Journal of V. N. Karazin Kharkiv National University. Series: International Relations. Economics. Country Studies. Tourism, 16, 42–50. [Google Scholar] [CrossRef]
- Grynko, P. (2020). Methodological diagnostics of efficiency of export and import enterprise activities. The Journal of V. N. Karazin Kharkiv National University. Series: International Relations. Economics. Country Studies. Tourism, 10, 113–121. [Google Scholar] [CrossRef]
- Hassan Khayat, S., & McMillan, D. (2019). A gravity model analysis for trade between the GCC and developed countries. Cogent Economics & Finance, 7(1), 1703440. [Google Scholar] [CrossRef]
- Hudakova, M., & Adamko, J. (2016). Technical reserves in insurance and Slovak insurance market. Economic Annals-XXI, 162(11–12), 98–103. [Google Scholar] [CrossRef]
- Istaiteyeh, R., Najem, F., & Saqfalhait, N. (2023). Exports- and imports-led growth: Evidence from a time series analysis, case of Jordan. Economies, 11(5), 135. [Google Scholar] [CrossRef]
- Jackson, E. A., & Jabbie, M. (2020, July 3). Import substitution industrialization [ISI]: An approach to global economic sustainability, MPRA paper 102316. University Library of Munich, Germany. Available online: https://mpra.ub.uni-muenchen.de/102316/ (accessed on 1 January 2025).
- Jordaan, A. C. (2015). Determining South Africa’s export potential to Australia: A panel data approach. South African Journal of Economic and Management Sciences, 18(3), 354–365. [Google Scholar] [CrossRef]
- Kolodiziev, O., Krupka, M., Shulga, N., Kulchytskyy, M., & Lozynska, O. (2021). The level of digital transformation affecting the competitiveness of banks. Banks and Bank Systems, 16(1), 81–91. [Google Scholar] [CrossRef]
- Kramer, L., Rathburn, P., & Kelly, R. (2023). How importing and exporting impacts the economy. Available online: https://www.investopedia.com/articles/investing/100813/interesting-facts-about-imports-and-exports.asp (accessed on 1 January 2025).
- Labunska, S., Cibák, Ľ., Sidak, M., & Sobakar, M. (2023). The role of internally generated goodwill in choosing areas and objects of investment. Investment Management and Financial Innovations, 20(2), 215–231. [Google Scholar] [CrossRef]
- Lang, I., Shaburishvili, S., & Sikharulidze, D. (2023). Georgia’s foreign trade potential with the United States: A Gravity Model approach. Journal of Eastern European and Central Asian Research (JEECAR), 10(7), 1088–1099. [Google Scholar] [CrossRef]
- Lee, J., & Kwon, H. B. (2021). Synergistic effect of R&D and exports on performance in US manufacturing industries: High-tech vs low-tech. Journal of Modelling in Management, 18(2), 343–371. [Google Scholar] [CrossRef]
- Love, J., & Ramesh, C. (2004). Testing export-led growth in india, pakistan and sri lanka using a multivariate framework. Manchester School, 72(4), 483–496. [Google Scholar] [CrossRef]
- Mackinnon, J. (1991). Critical Values for Cointegration Tests. Oxford University Press. [Google Scholar]
- Malyarets, L., Draskovic, M., Babenko, V., Kochuyeva, Z., & Dorokhov, O. (2017). Theory and practice of controlling at enterprises in international business. Economic Annals-XXI, 5–6, 90–96. [Google Scholar] [CrossRef]
- Megits, N., & Meyer, D. (2023). An economic analysis of the impact of the Russian War in Ukraine on the Poland-U.S. trade. Journal of Eastern European and Central Asian Research (JEECAR), 10(7), 1135–1147. [Google Scholar] [CrossRef]
- Melnyk, O. G., & Logvinenko, Y. L. (2007). Indykatory otsiniuvannia efektyvnosti zovnishnyoekonomichnoi diialnosti pidpryiemstva [Indicators for assessing the effectiveness of the enterprise’s foreign economic activity]. Elektronnyi naukovyi arkhiv Naukovotekhnichnoi biblioteky Natsionalnoho universytetu «Lvivska politekhnika». Available online: https://ena.lpnu.ua/handle/ntb/35536 (accessed on 1 January 2025).
- Meyer, D. F. (2021). An assessment of the interrelations between country risk, economic growth and good governance: The case of the Visegrád four. Journal of Eastern European and Central Asian Research (JEECAR), 8(4), 610–627. [Google Scholar] [CrossRef]
- Millia, H., Syarif, M., Adam, P., Rahim, M., Gamsir, G., & Rostin, R. (2021). The effect of export and import on economic growth in Indonesia. International Journal of Economics and Financial Issues, 11(6), 17–23. [Google Scholar] [CrossRef]
- Ministry of Economy of Ukraine. (2024). The official website. Available online: https://www.me.gov.ua/News/Detail?lang=uk-UA&id=a1554595-5306-44ac-90a7-943745ba06f0&title=UkrainaRozvivatime (accessed on 1 January 2025).
- Molepo, E. P., & Jordaan, A. C. (2024). A causal analysis between exports, imports and GDP per capita in the Southern African Customs Union Countries. Studies in Economics and Econometrics, 48(2), 168–185. [Google Scholar] [CrossRef]
- National Bank of Ukraine. (2024). The official website. Available online: https://bank.gov.ua/ua/news/all/makroekonomichniy-ta-monetarniy-oglyad-cherven-2023-roku (accessed on 1 January 2025).
- National Institute for Strategic Researches. (2024). The official website. Available online: https://.gov.ua/news/komentari-ekspertiv/strakhuvannya-investytsiy-vid-voyennykh-ryzykiv-v-ukrayini (accessed on 1 January 2025).
- Nestor, O. (2023). The importance of the marshall Plan for the post-war economic recovery of the regions: Italian experience and lessons for Ukraine. Economy and Society, Electronic Scientific Journal, 53. [Google Scholar] [CrossRef]
- OECD/Eurostat. (2018). Oslo manual 2018: Guidelines for collecting, reporting and using data on innovation, fourth edition, the measurement of scientific, technological and innovation activities. OECD Publishing/Eurostat. [Google Scholar] [CrossRef]
- O’Connell, D. J., & Benson, J. J. (1963). Sourcing abroad for domestic profit. Harvard Business Review, 41(2), 87–94. [Google Scholar] [CrossRef]
- Orhan, A., Emikönel, M., Emikönel, M., & Castanho, R. A. (2022). Reflections of the “export-led growth” or “growth-led ex ports” hypothesis on the Turk ish economy in the 1999–2021 period. Economies, 10(11), 269. [Google Scholar] [CrossRef]
- Panta, H., Devkota, M. L., & Banjade, D. (2021). Exports and imports-led growth: Evidence from a small developing economy. Journal of Risk and Financial Management, 15(1), 11. [Google Scholar] [CrossRef]
- Ponomarenko, V. C., & Malyarets, L. M. (2009). Analysis of data in researches of socio-economic systems. INZHEK. (In Ukrainian) [Google Scholar]
- Pucheta, J., Salas, C., Herrera, M., Rivero, C., & Alasino, G. (2019). Short and long-term time series forecasting stochastic analysis for slow dynamic processes. Applied Mathematics, 10, 704–717. [Google Scholar] [CrossRef]
- Pyroh, O., Prokopenko, M., Chernobay, L., Kovalenko, R., Papizh, Y., & Syta, Y. (2021). Management of business processes and export-import activity of industrial enterprises in the digital economy. Studies of Applied Economics. Special Issue: Innovation in the Economy and Society of the Digital Age, 39(5), 1–11. [Google Scholar] [CrossRef]
- Ribeiro, V. M. (2024). Portuguese textiles and apparel industry: Assessing the effect of international trade on employment and green employment. Administrative Sciences, 14(10), 239. [Google Scholar] [CrossRef]
- Shtal, T. V., Buriak, M. M., Amirbekuly, Y., Ukubassova, G. S., Kaskin, T. T., & Toiboldinova, Z. G. (2018). Methods of analysis of the external environment of business activities. Espacios, 39(12), 22. [Google Scholar]
- Shu, P., & Steinwender, C. (2019). The impact of trade liberalization on firm productivity and innovation. Innovation Policy and the Economy, 19, 39–68. [Google Scholar] [CrossRef]
- Sidak, M., Cibák, Ľ., & Hajnišová, E. (2020). Investment protection: Determination of legal aspects with reflecting to the innovations to ensure sustainable growth of the Slovak republic. Entrepreneurship and Sustainability, 7(3), 2350–2362. [Google Scholar] [CrossRef]
- State Statistics Service of Ukraine. (2024). The official website. Available online: https://www.ukrstat.gov.ua/ (accessed on 1 January 2025).
- Stojanović, M., Božić Miljković, I., Obradović, J., & Dimitrijević, L. (2023). The impact of imports and exports on economic growth: Panel data analysis. International Journal for Economic Theory and Practice and Social Issues “Ekonomika”, 4, 69–81. [Google Scholar] [CrossRef]
- Stryzhak, O., Cibák, L., Sidak, M., & Yermachenko, V. (2024). Socio-economic development of tourist destinations: A cross-country analysis. Journal of Eastern European and Central Asian Research (JEECAR), 11(1), 79–96. [Google Scholar] [CrossRef]
- Stundziene, A., Pilinkiene, V., Bruneckiene, J., Grybauskas, A., & Lukauskas, M. (2023). Nowcasting economic activity using electricity market data: The case of Lithuania. Economies, 11(5), 134. [Google Scholar] [CrossRef]
- Sunde, T., Tafirenyika, B., & Adeyanju, A. (2023). Testing the impact of exports, imports, and trade openness on economic growth in Namibia: Assessment using the ARDL cointegration method. Economies, 11(3), 86. [Google Scholar] [CrossRef]
- Sytnyk, I., Vasylchuk, I., Kolodiziev, O., Kuzminova, O., & Smoliak, V. (2022). Analysis of the state of payment systems in Ukraine the context of the european vector of digital economy development and globalization and integration processes. Financial and Credit Activity Problems of Theory and Practice, 6(47), 34–50. [Google Scholar]
- Trofimchuk, M. (2022). Analysis of the features of the marshall’s plan implementation and the prospects of Ukraine economy restoration on its basis. Herald of Khmelnytskyi National University. Economic Sciences, 3, 246–251. [Google Scholar] [CrossRef]
- UCTAD. (2022). The Guidebook on trade impact assessment. Available online: https://unctad.org/system/files/official-document/ditctncd2021d4_en.pdf (accessed on 1 January 2025).
- Voloshan, I. (2019). Methodical approach to estimation of the efficiency of industrial enterprise export activity. Uzhorod National University Herald, 24(1), 74–77. [Google Scholar]
- Vovk, V., Havrylchenko, O., & Mazorenko, O. (2021). Algorithm of activation export on the example of machine-building enterprises of the Kharkiv region. Development Management, 19(1), 19–29. [Google Scholar] [CrossRef]
- Vrabcova, P., Urbancova, H., & Hudakova, M. (2022). Strategic trends of organizations in the context of new perspectives of sustainable competitiveness. Journal of Competitiveness, 14(2), 174–193. [Google Scholar] [CrossRef]
- World Bank Group. (2024). Available online: https://data.worldbank.org/indicator (accessed on 1 January 2025).
- WTO. (2012). A practical guide to trade policy analysis. Available online: https://www.wto.org/english/res_e/publications_e/wto_unctad12_e.pdf (accessed on 1 January 2025).
- Zhang, M., Fabus, M., & Zhang, Y. (2024). Research on consumers’ intended usage of cold chain logistics service through fresh-food apps based on the structural equations model. Business: Theory and Practice, 25(1), 61–72. [Google Scholar] [CrossRef]
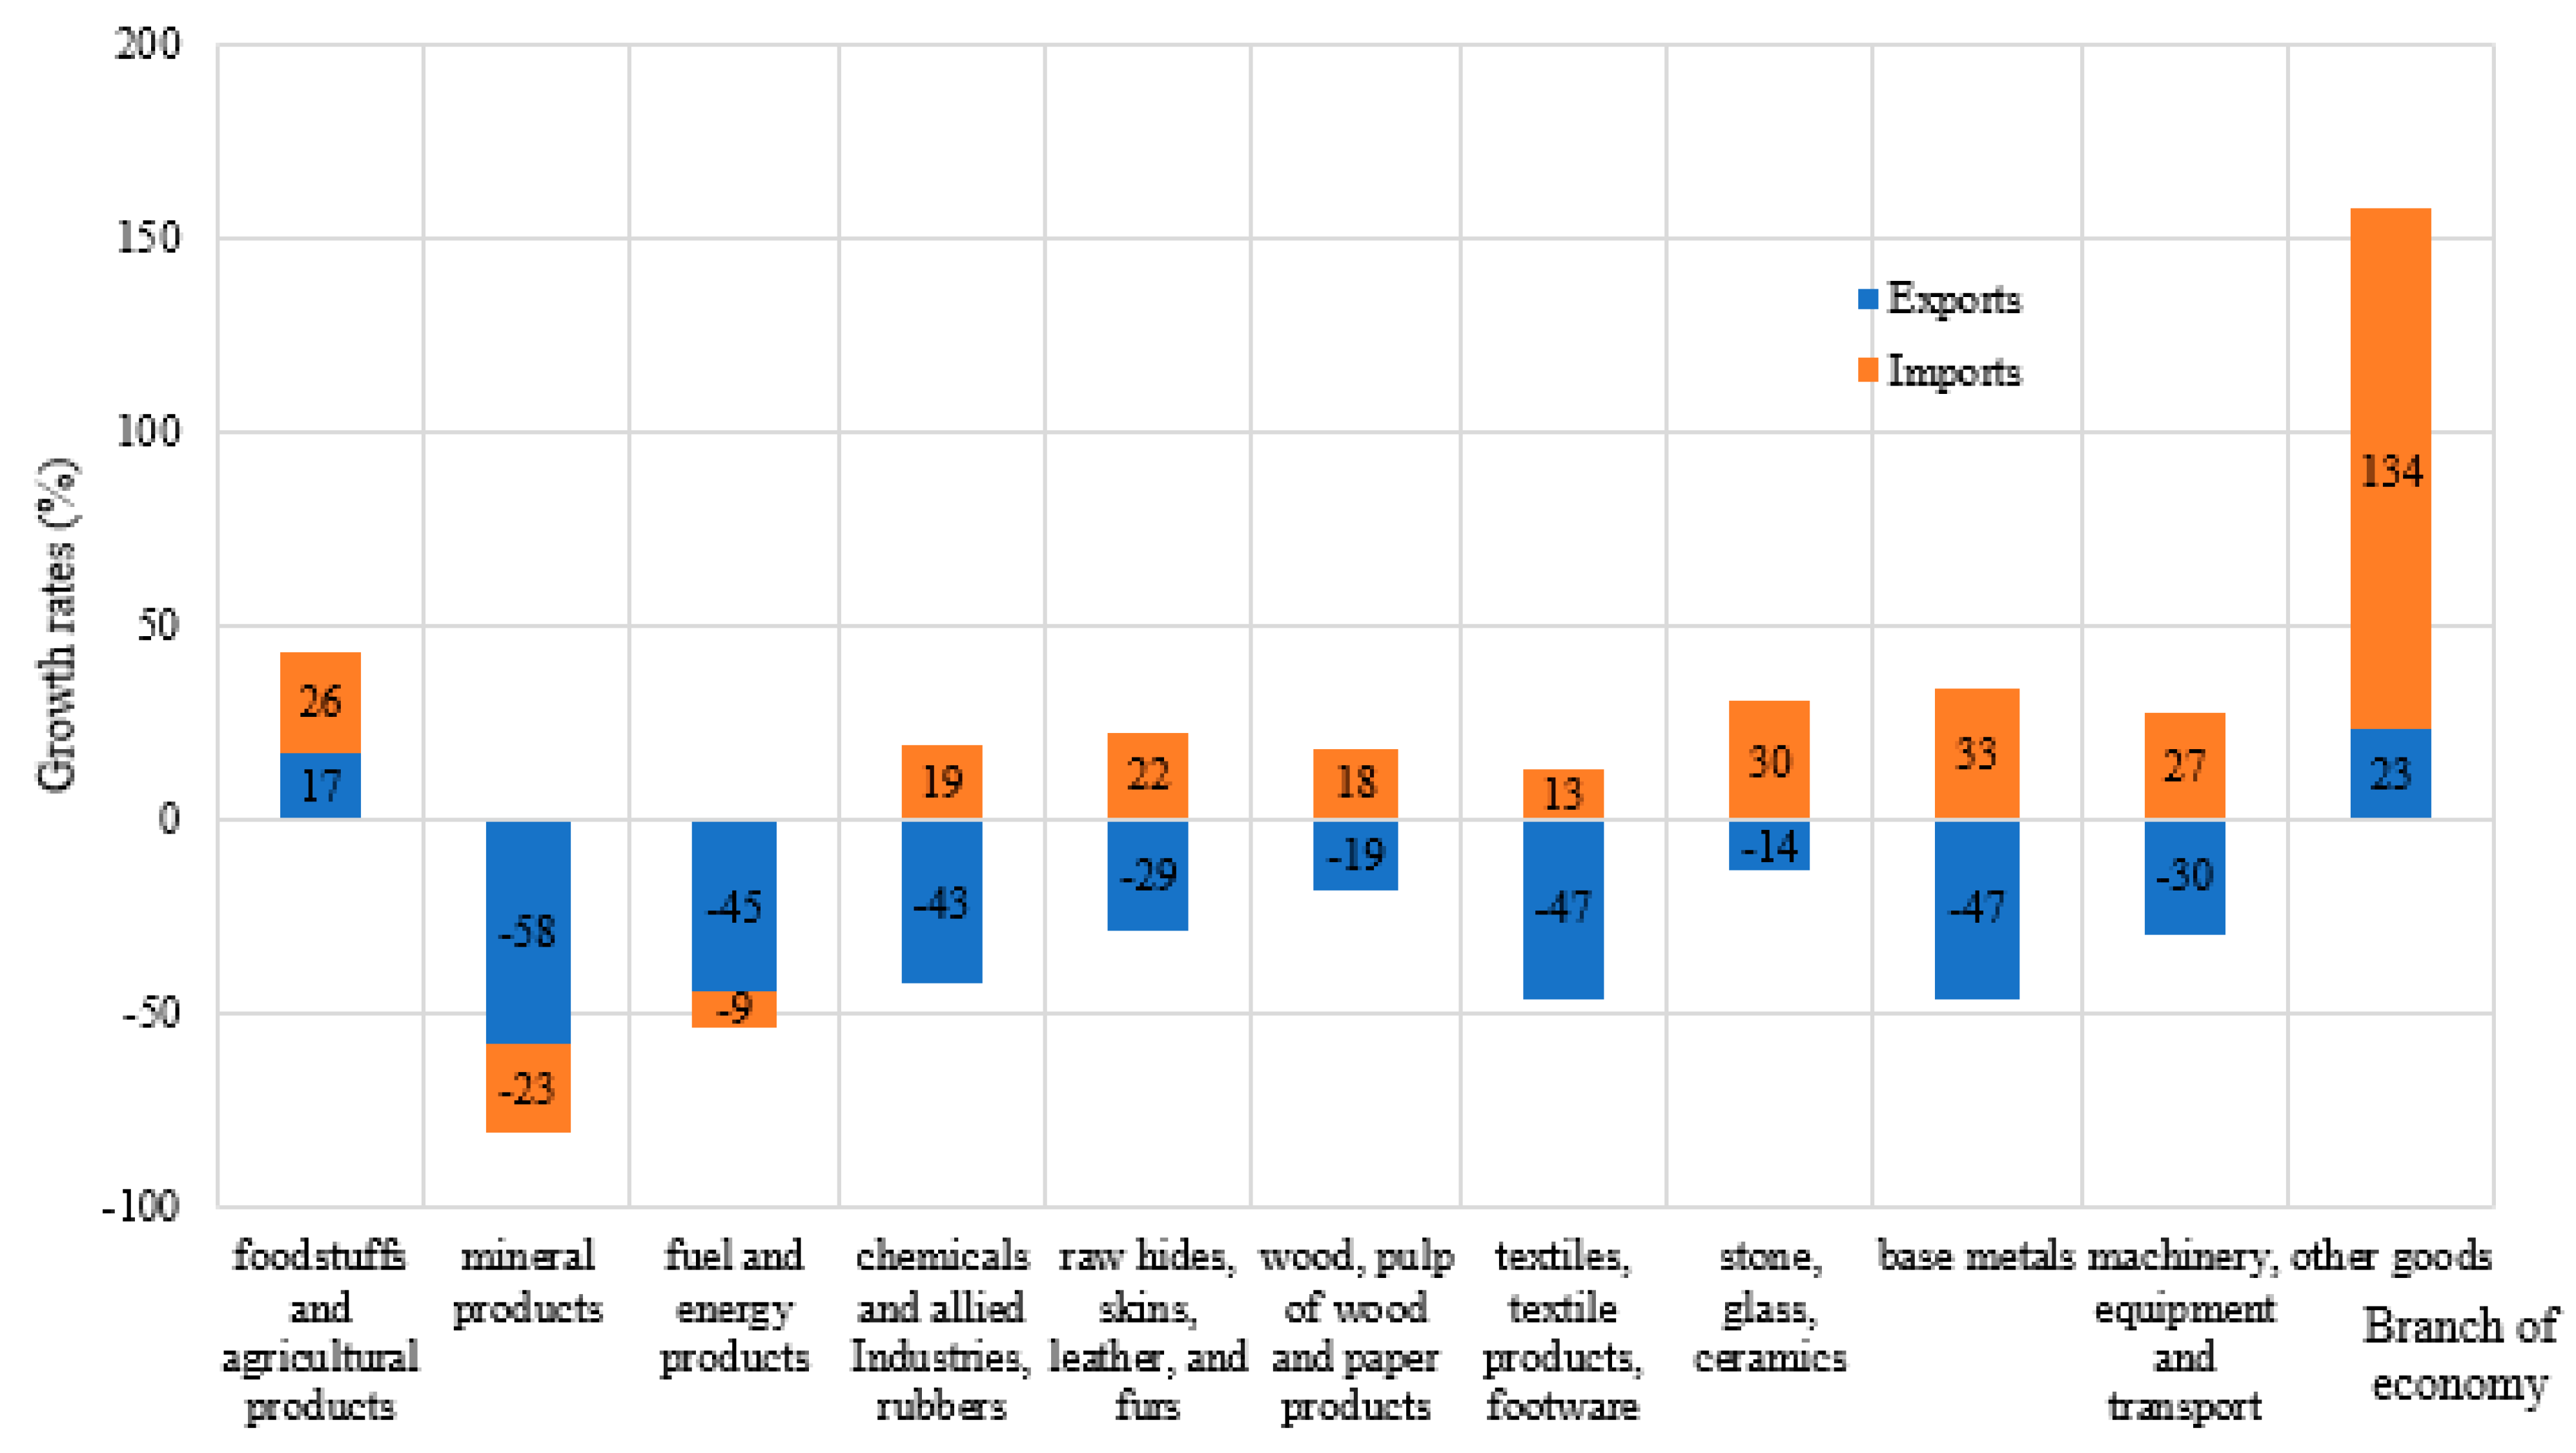
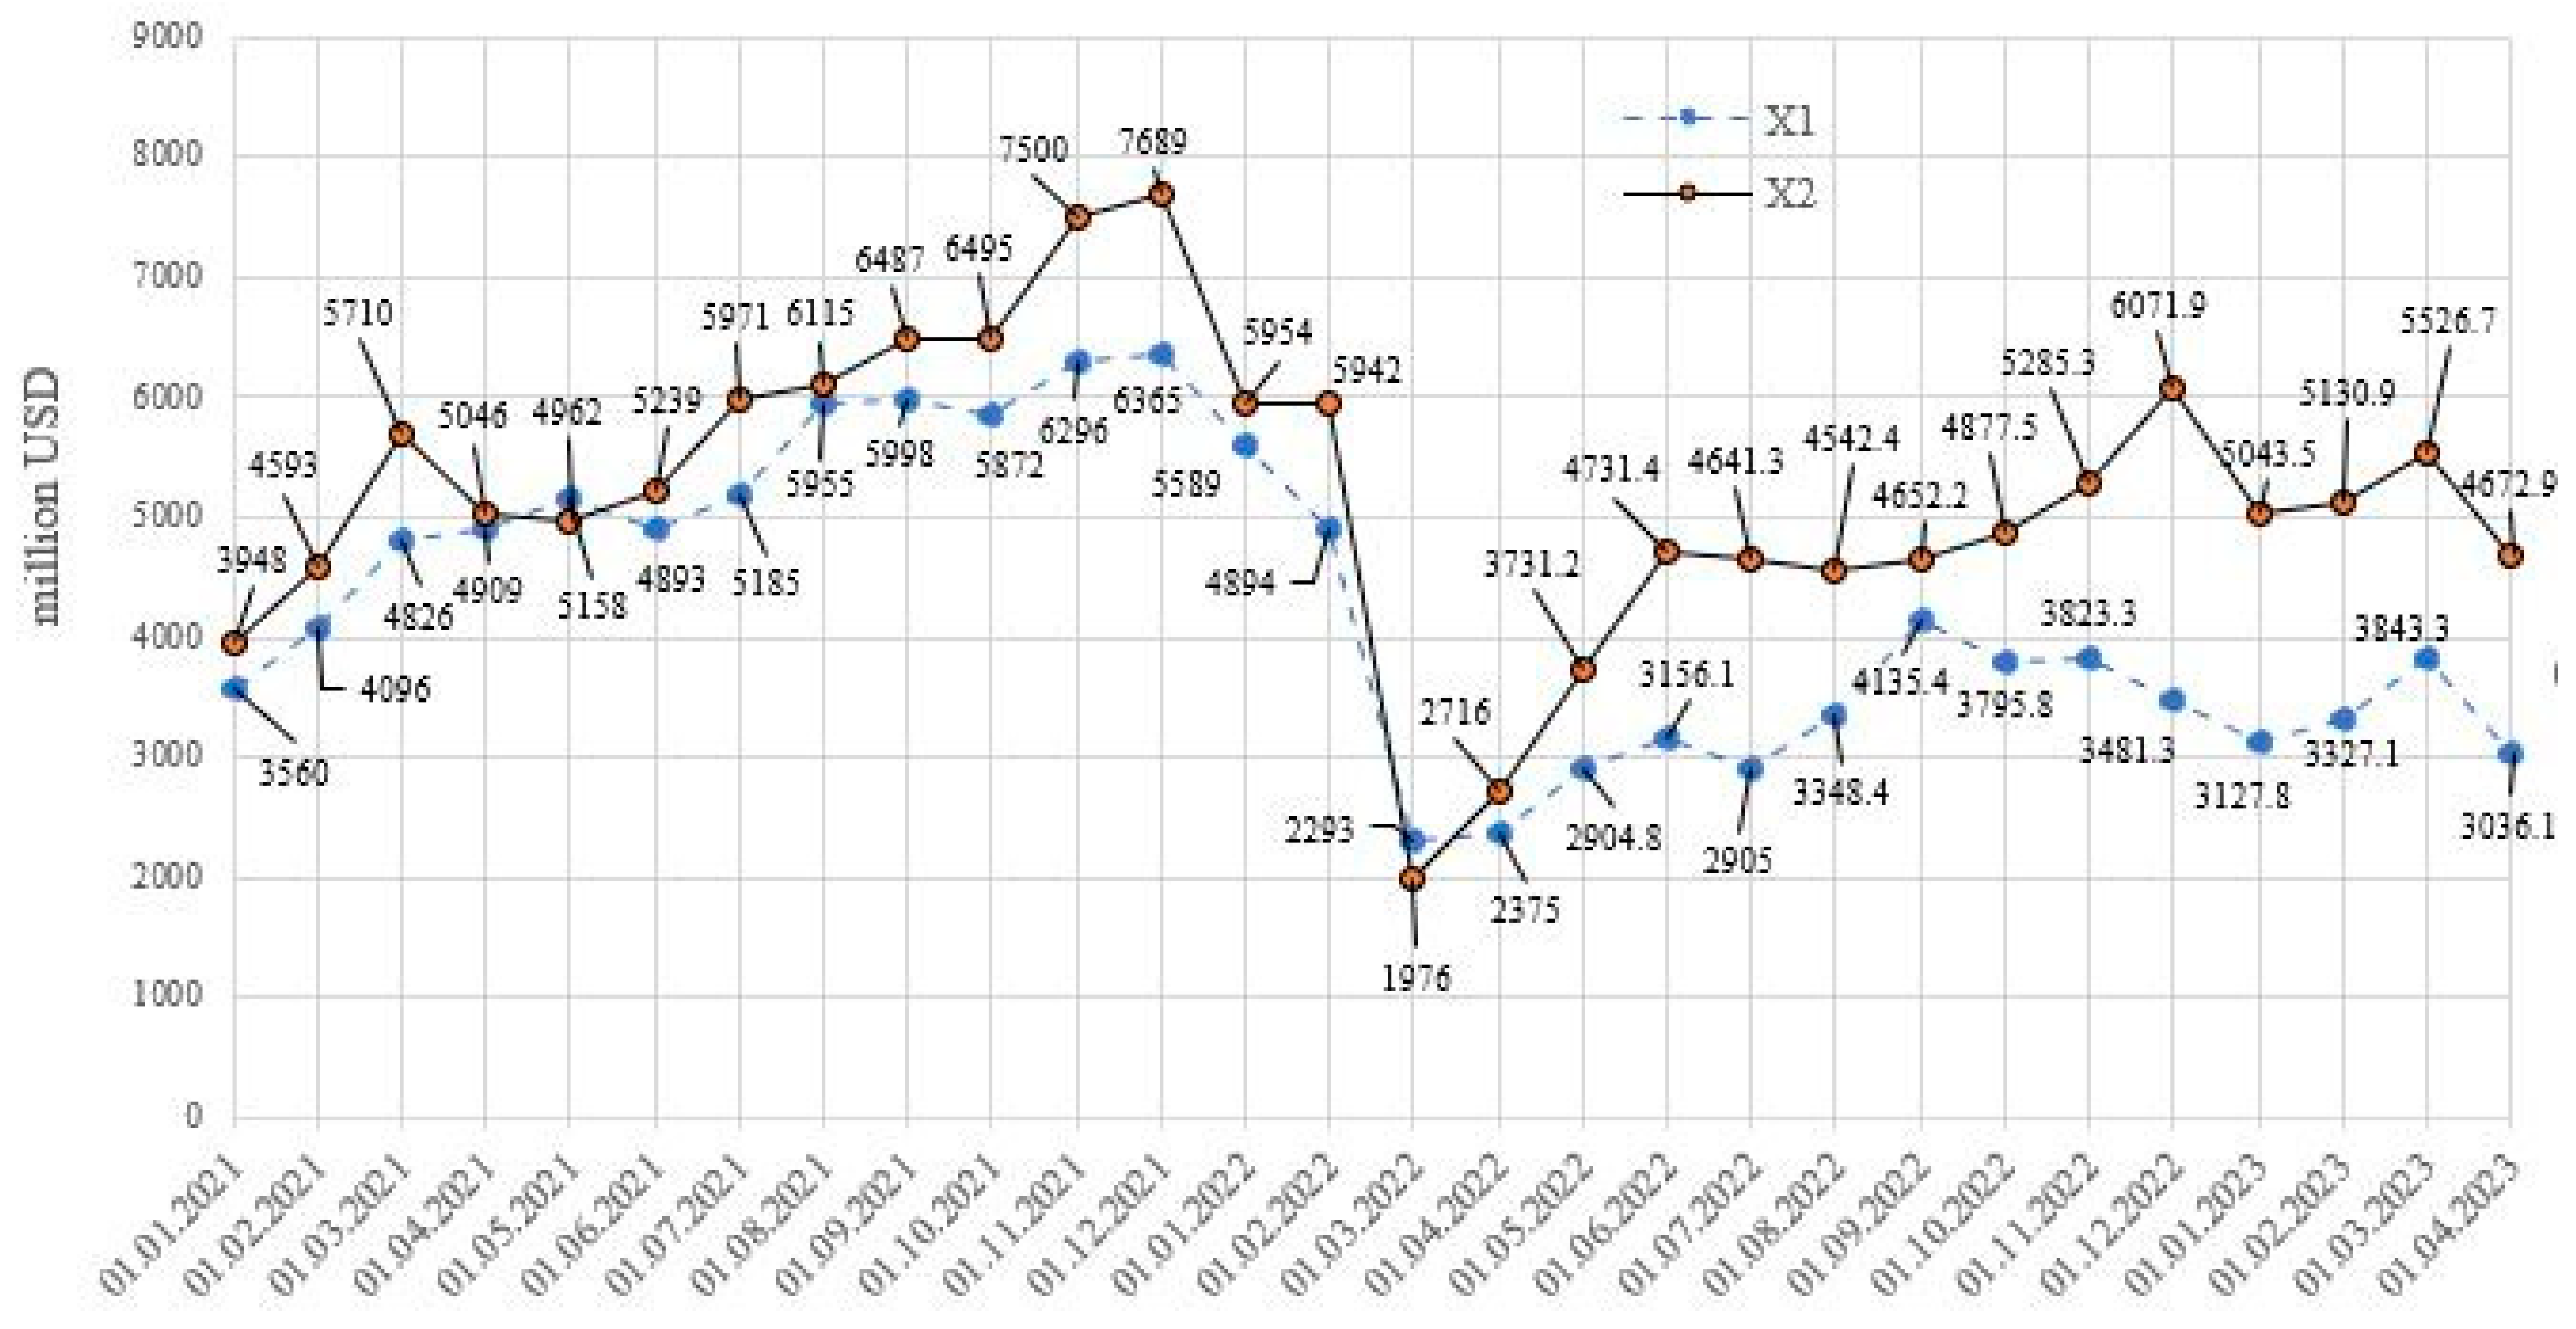
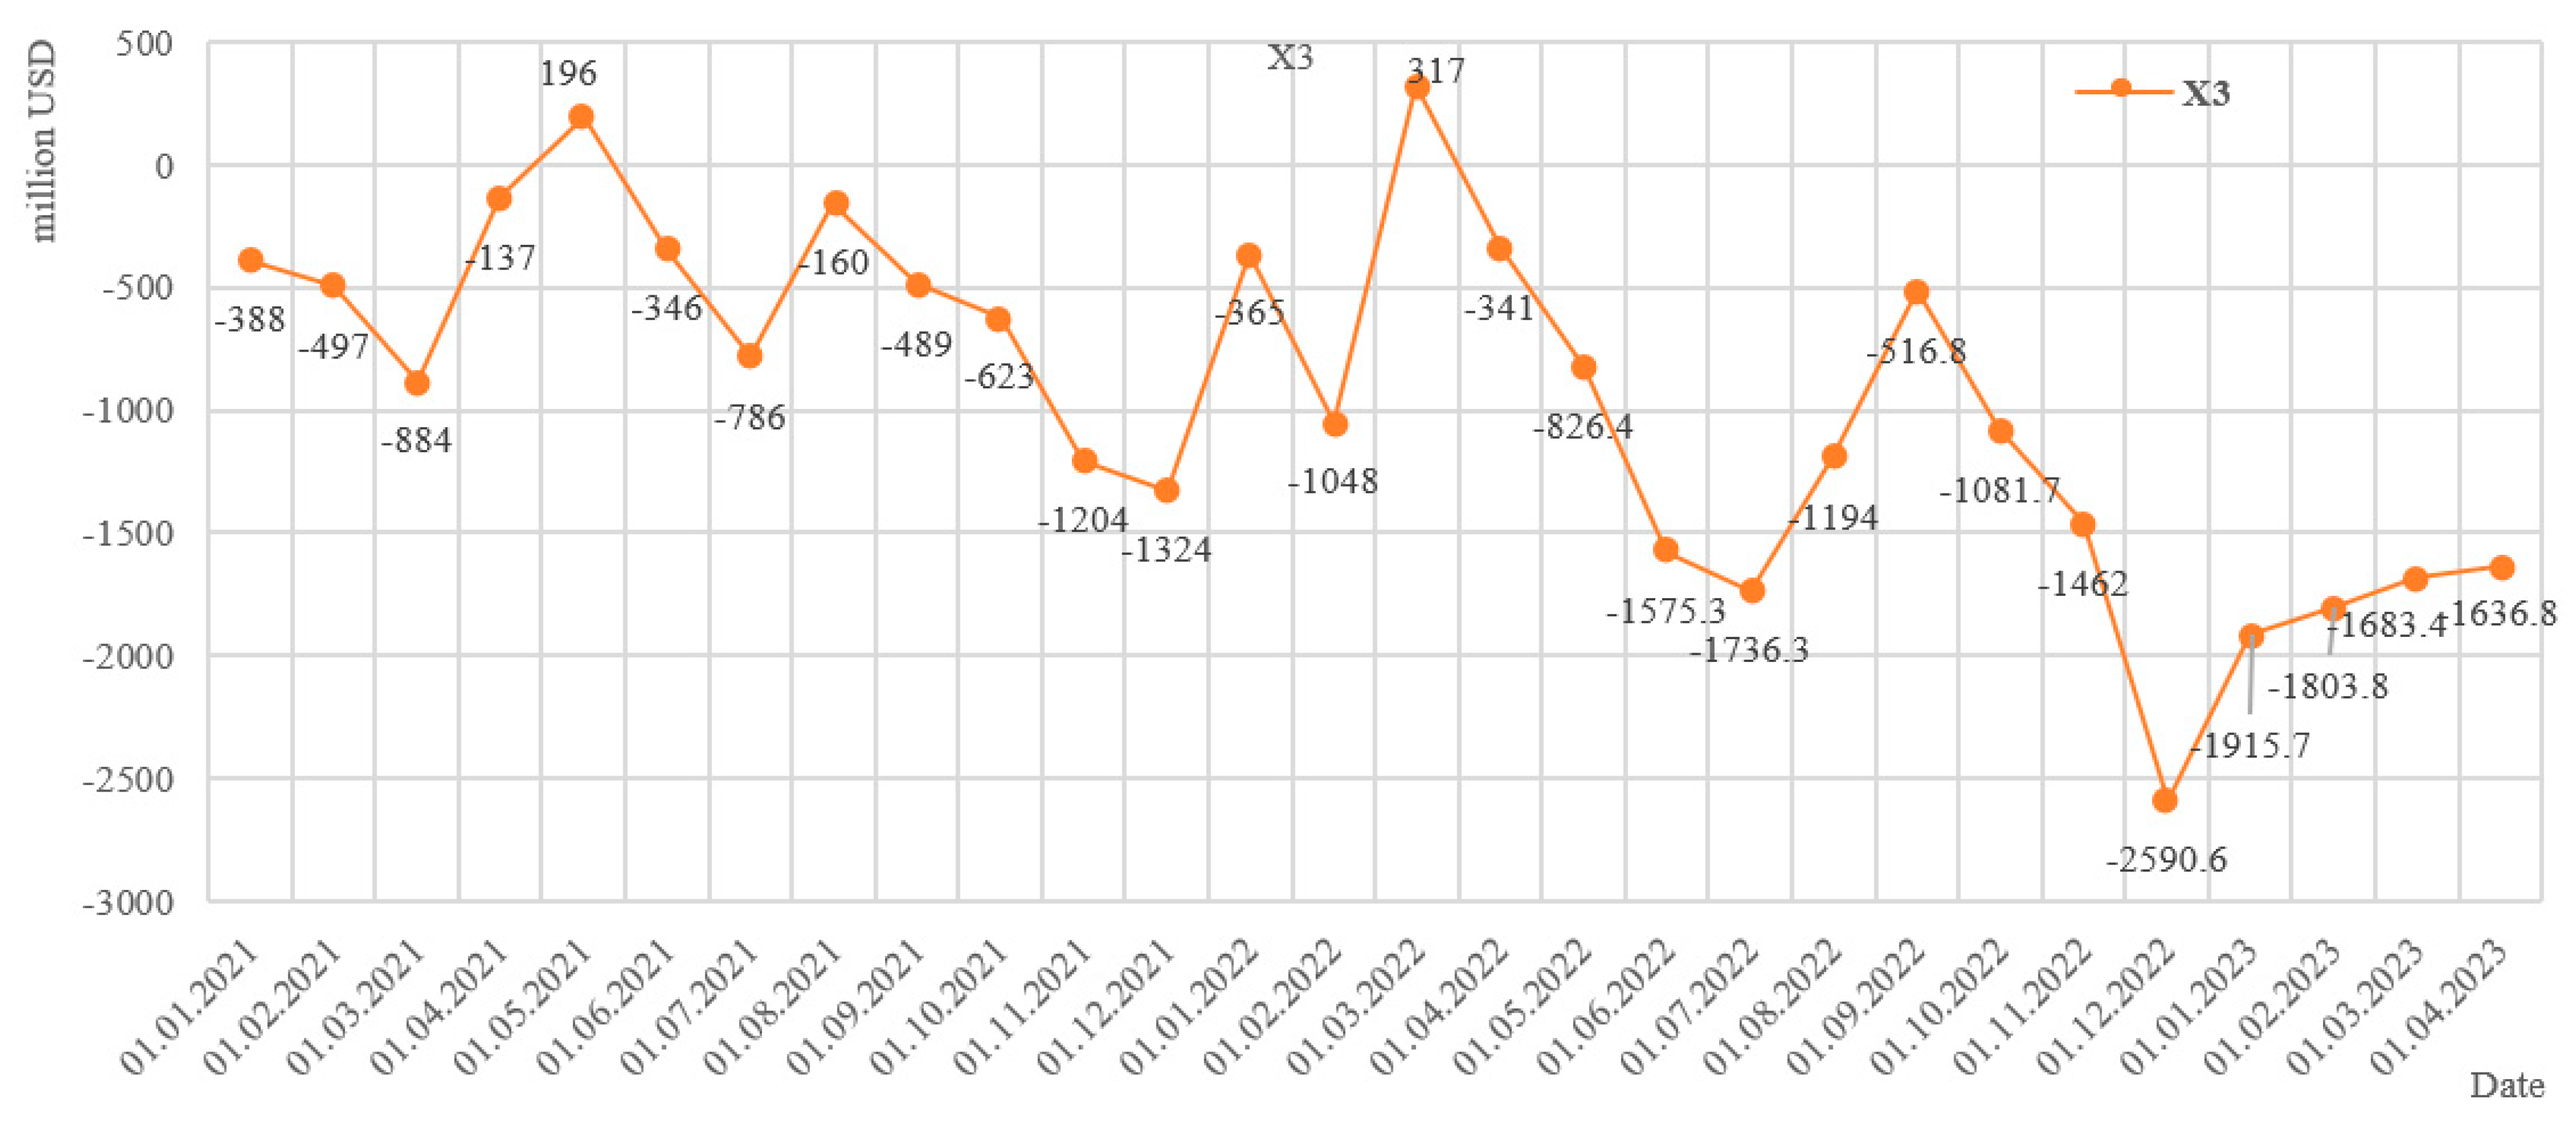
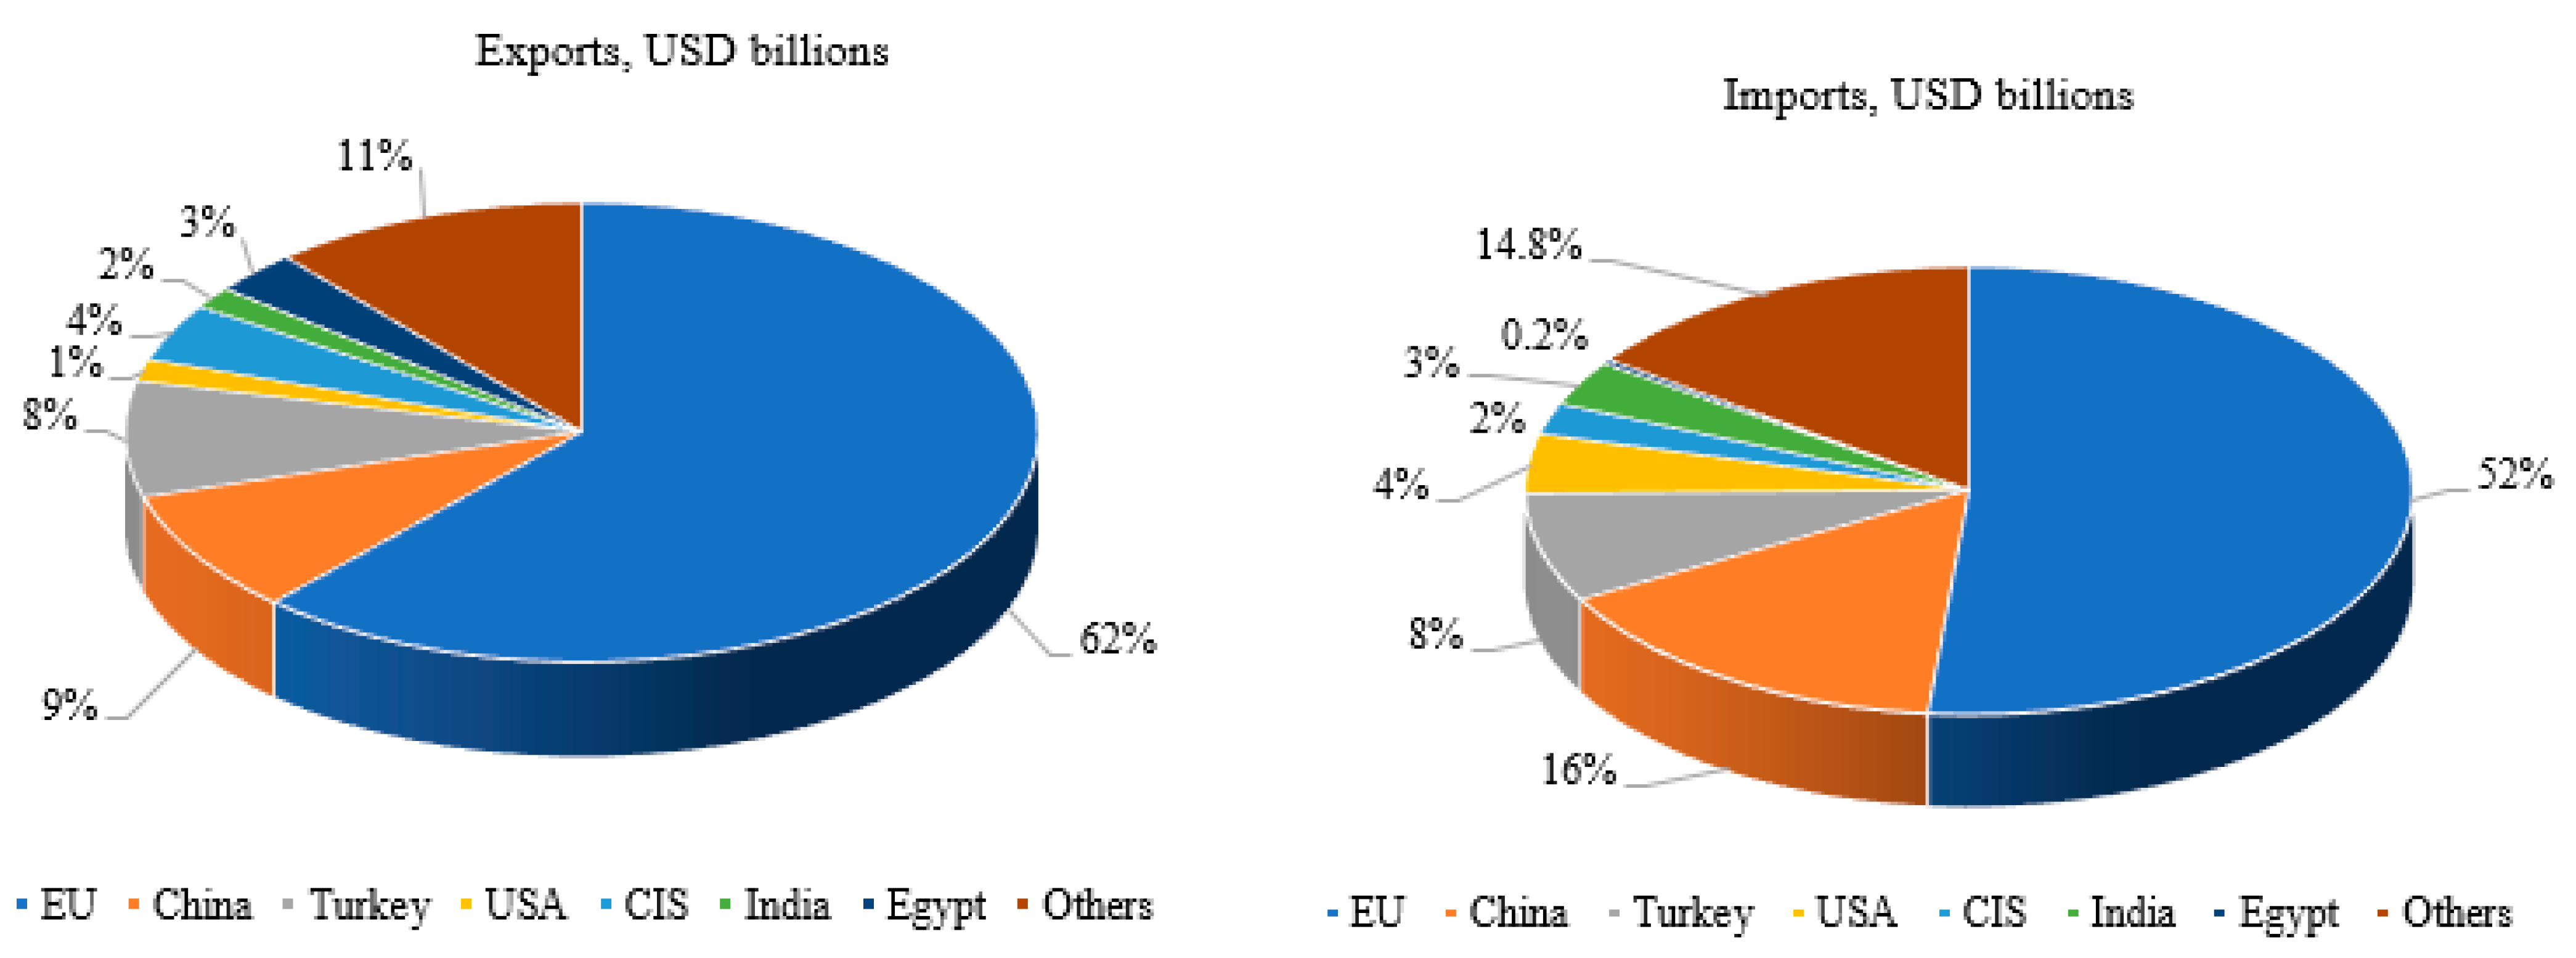
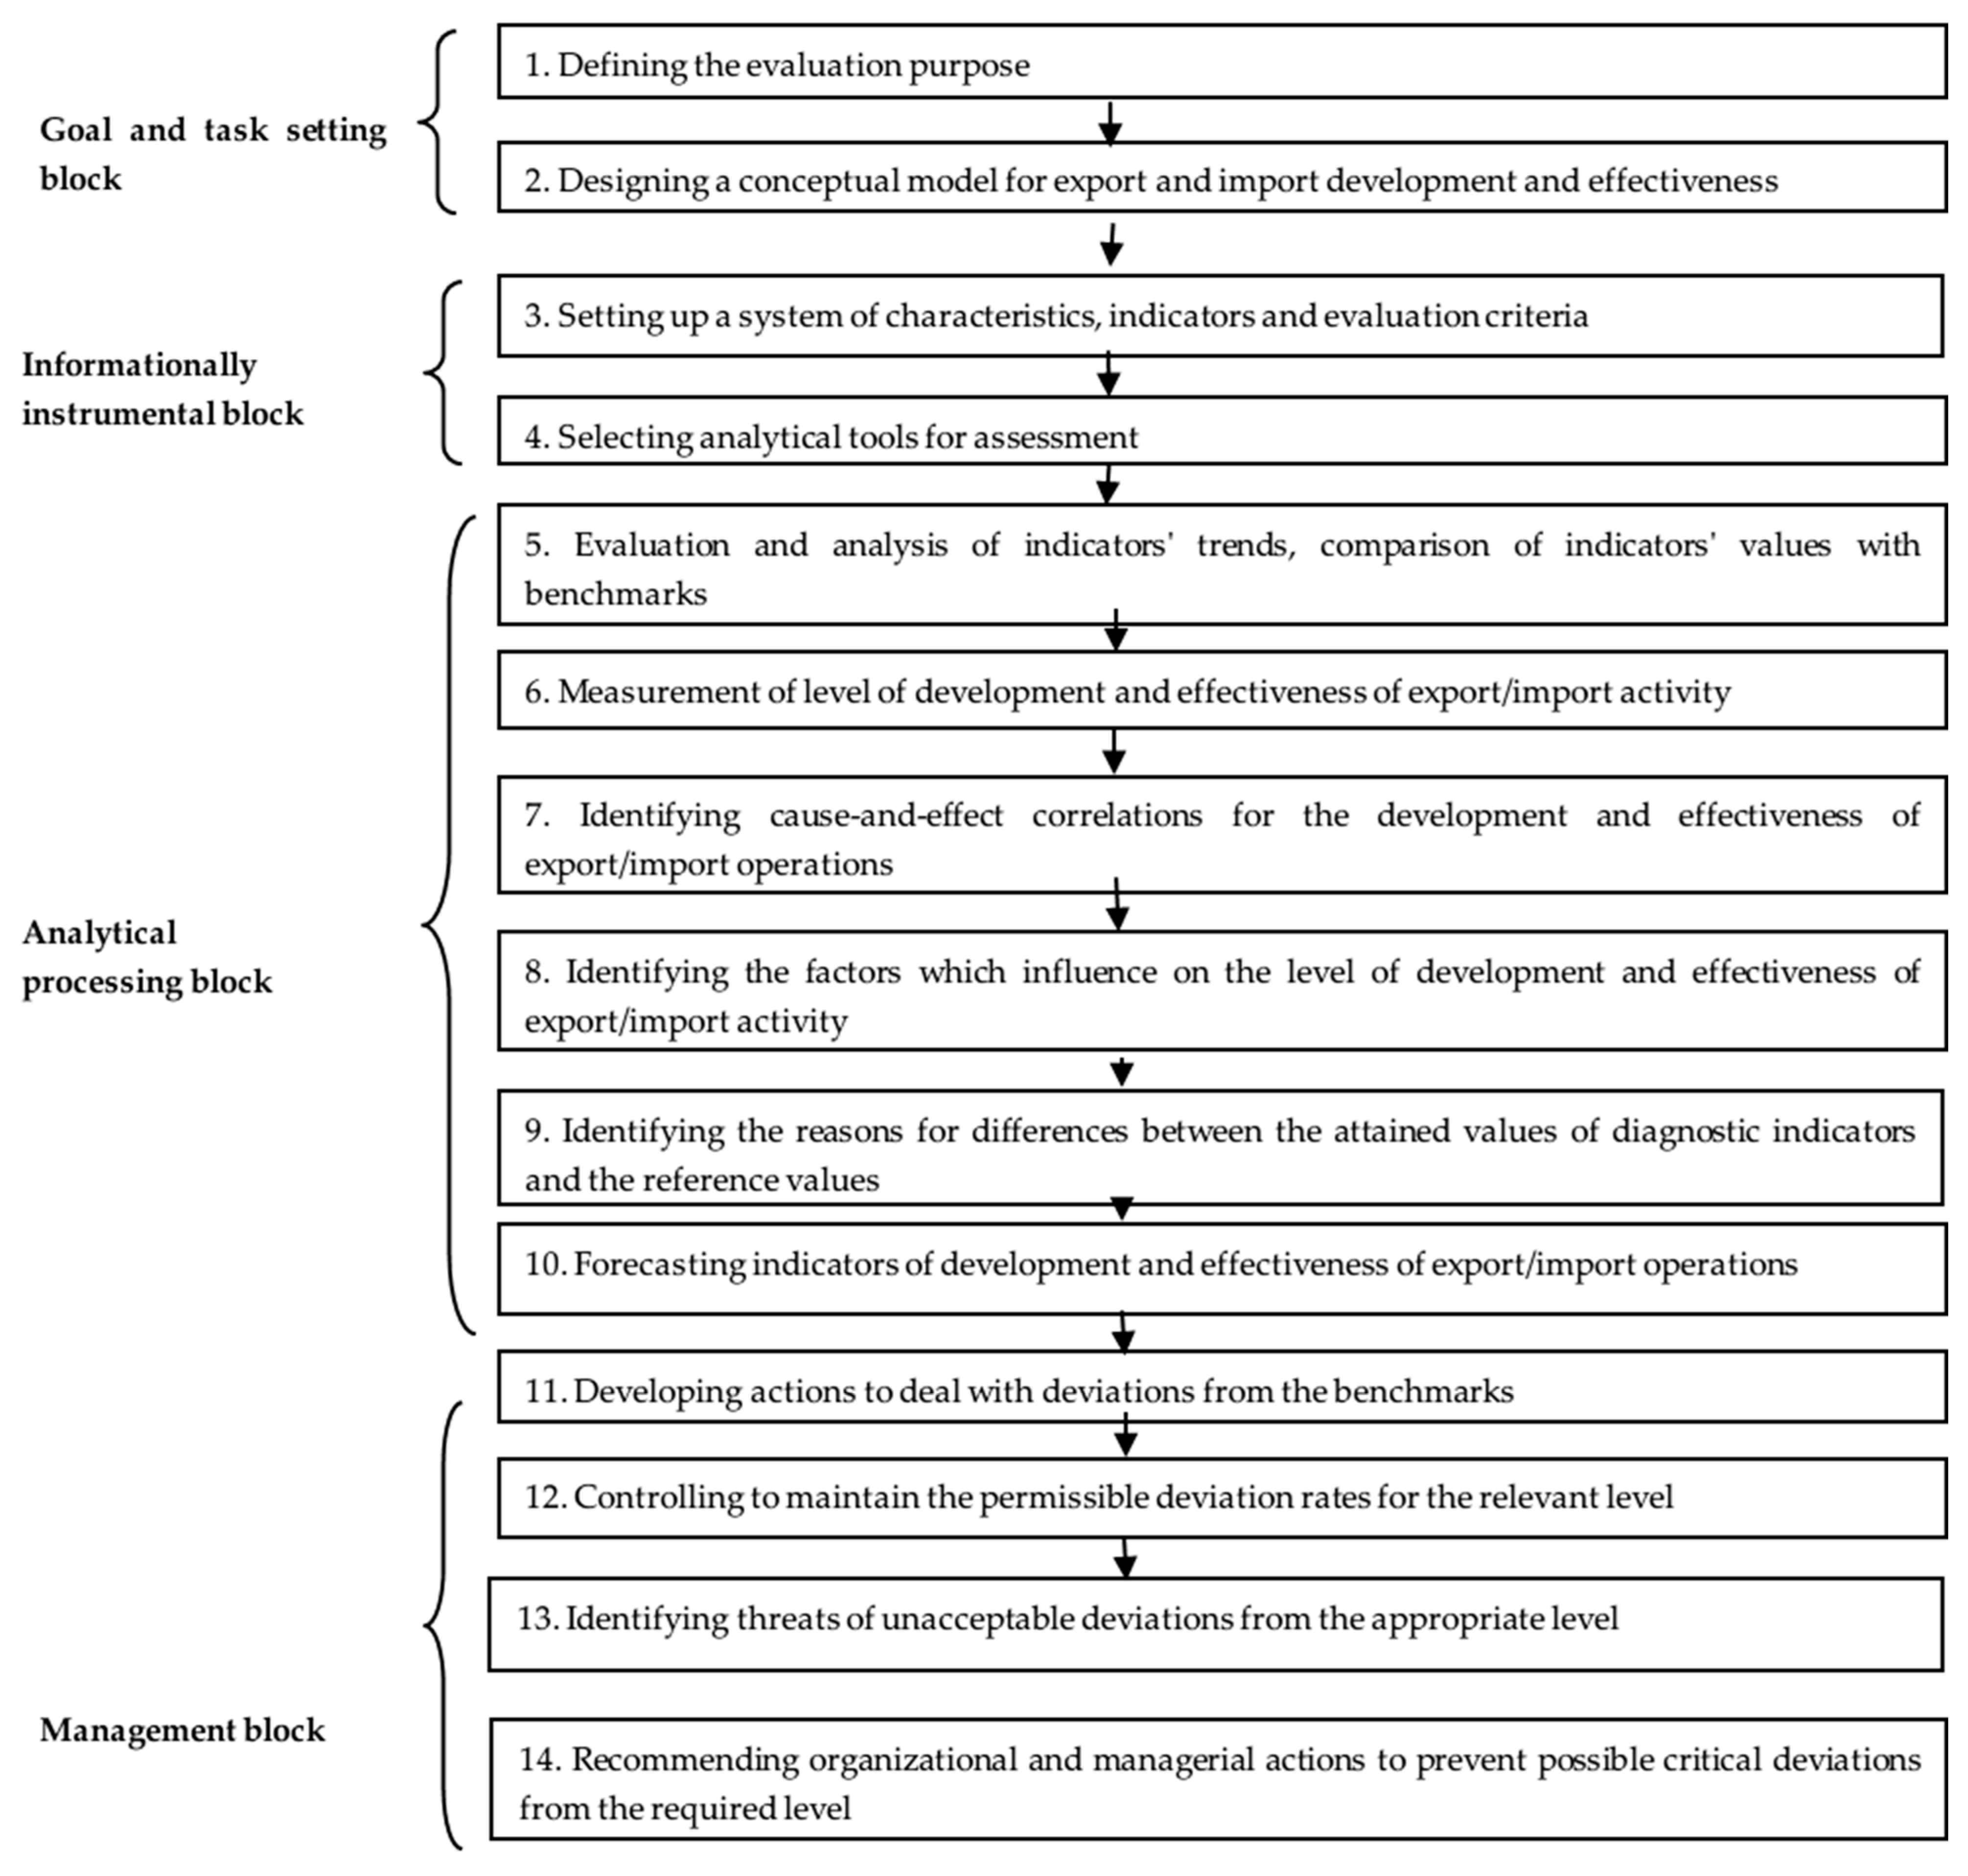
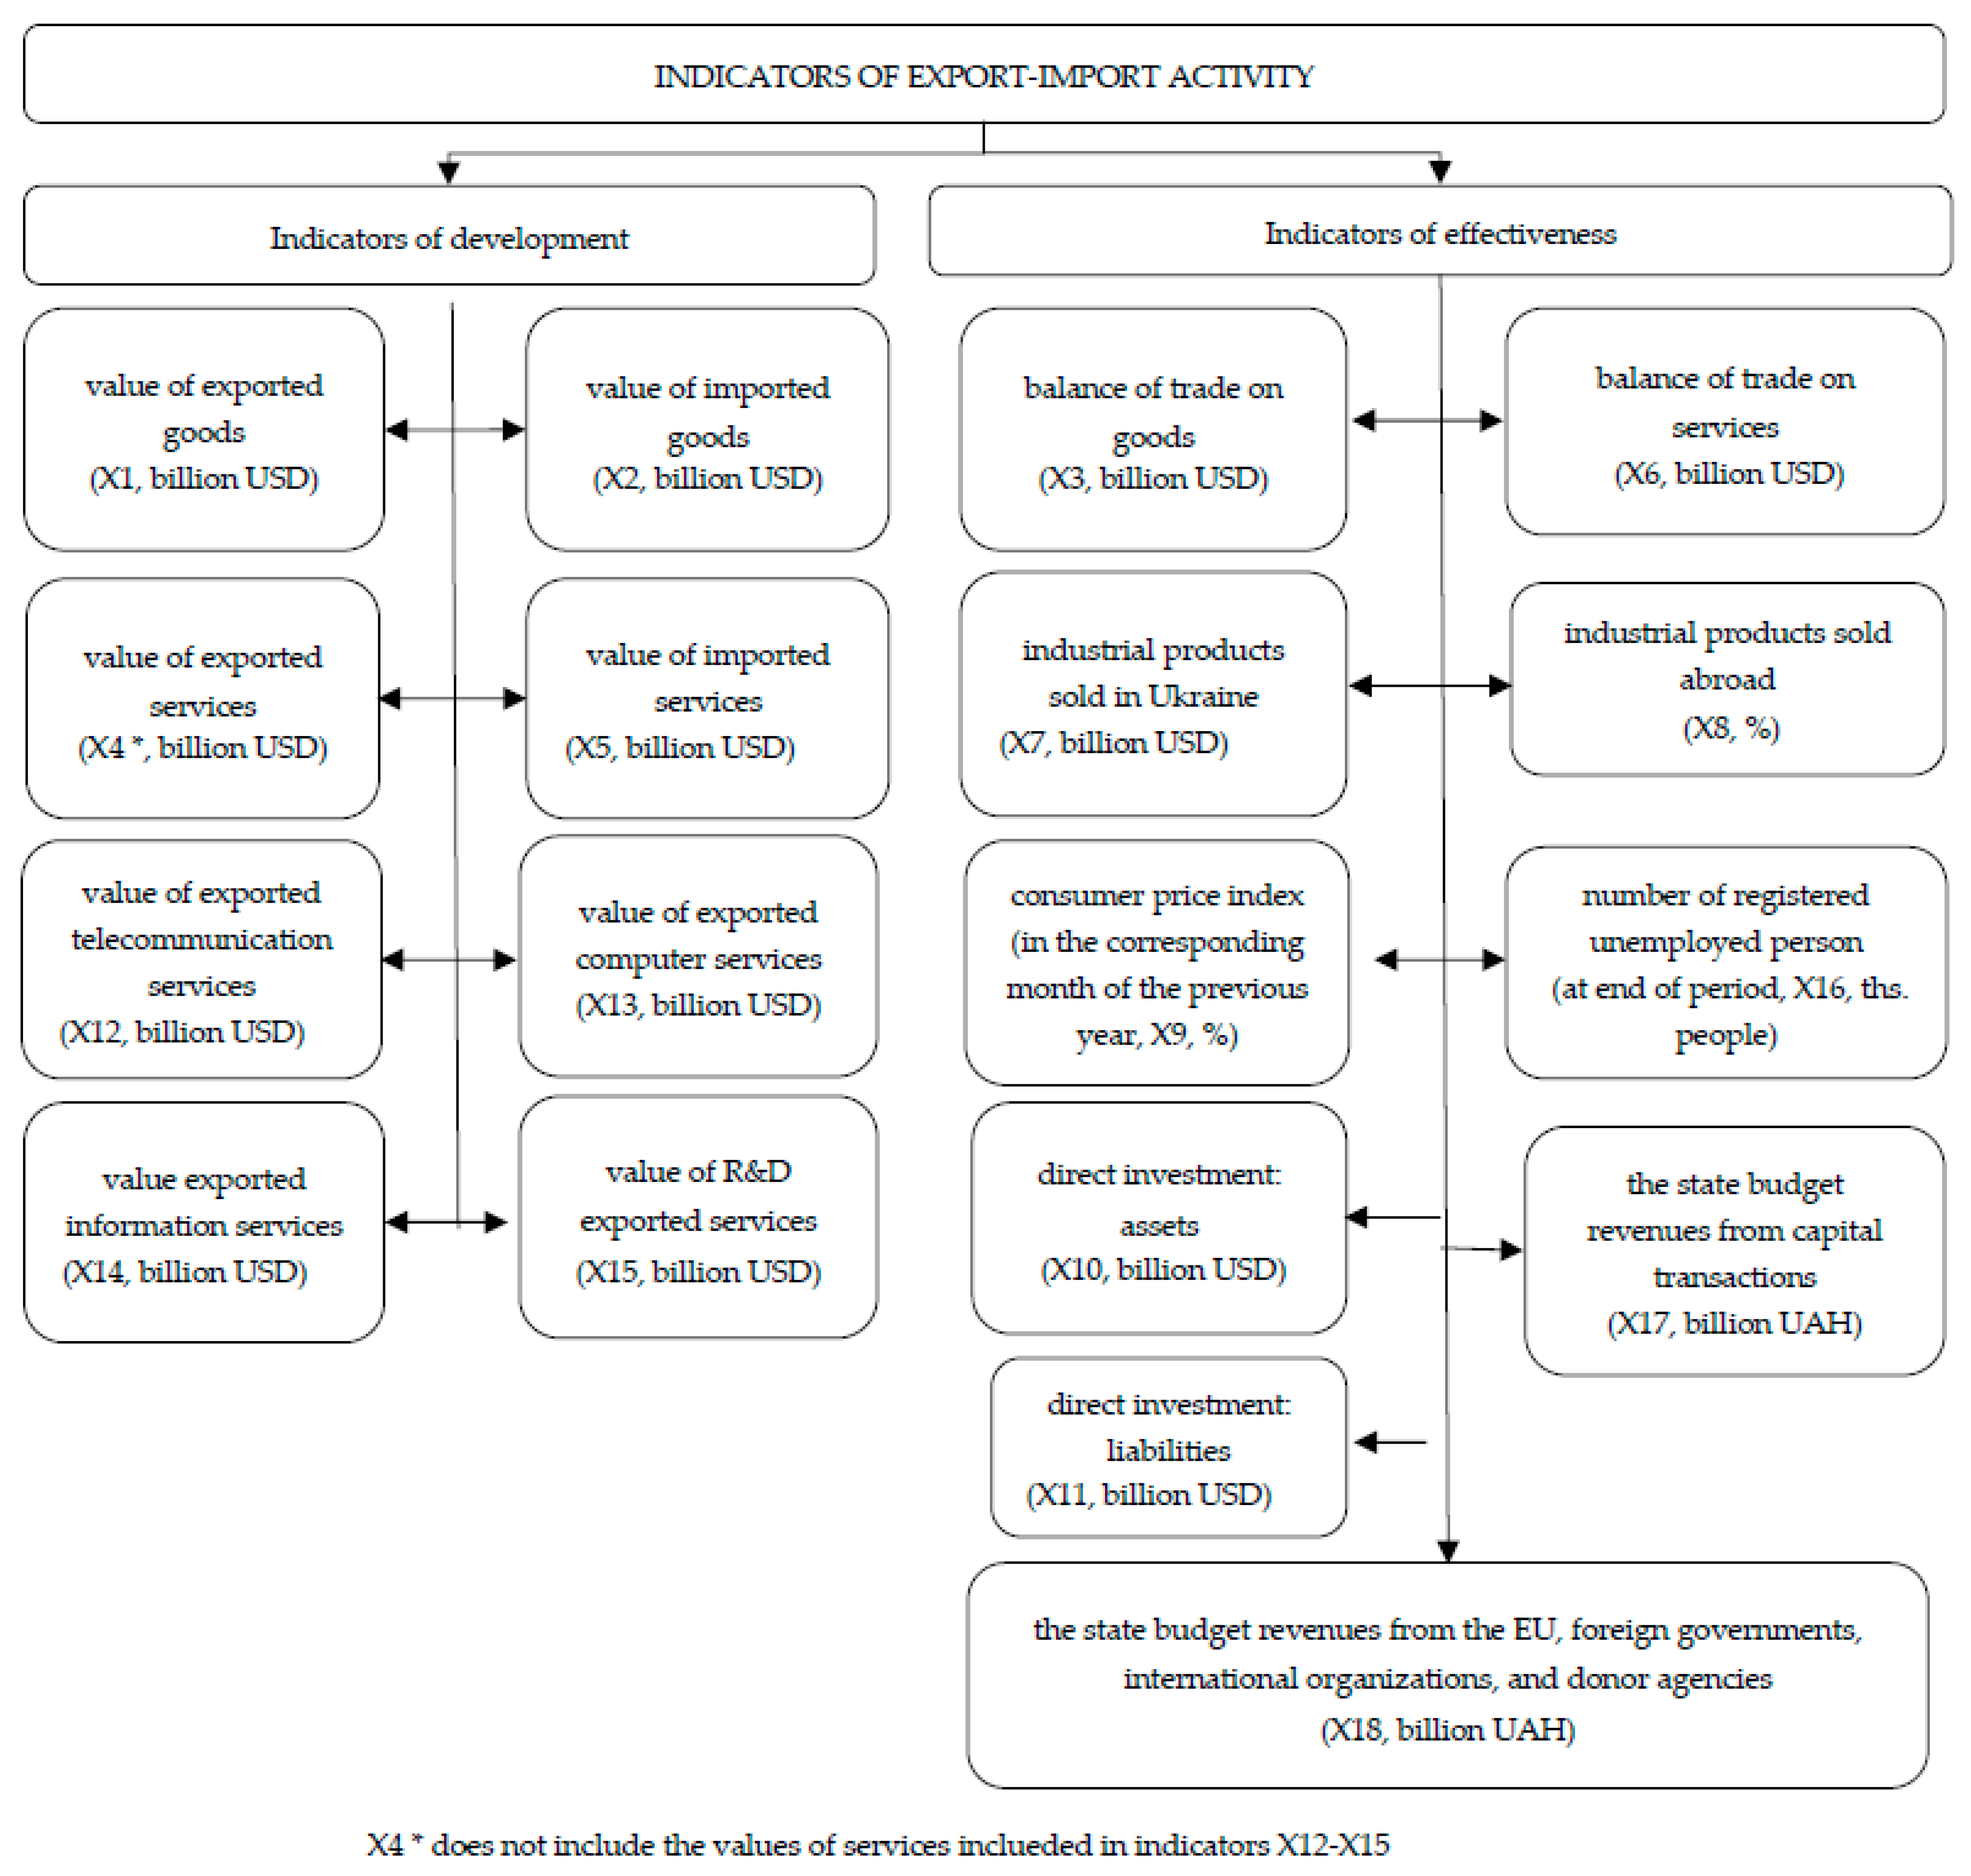
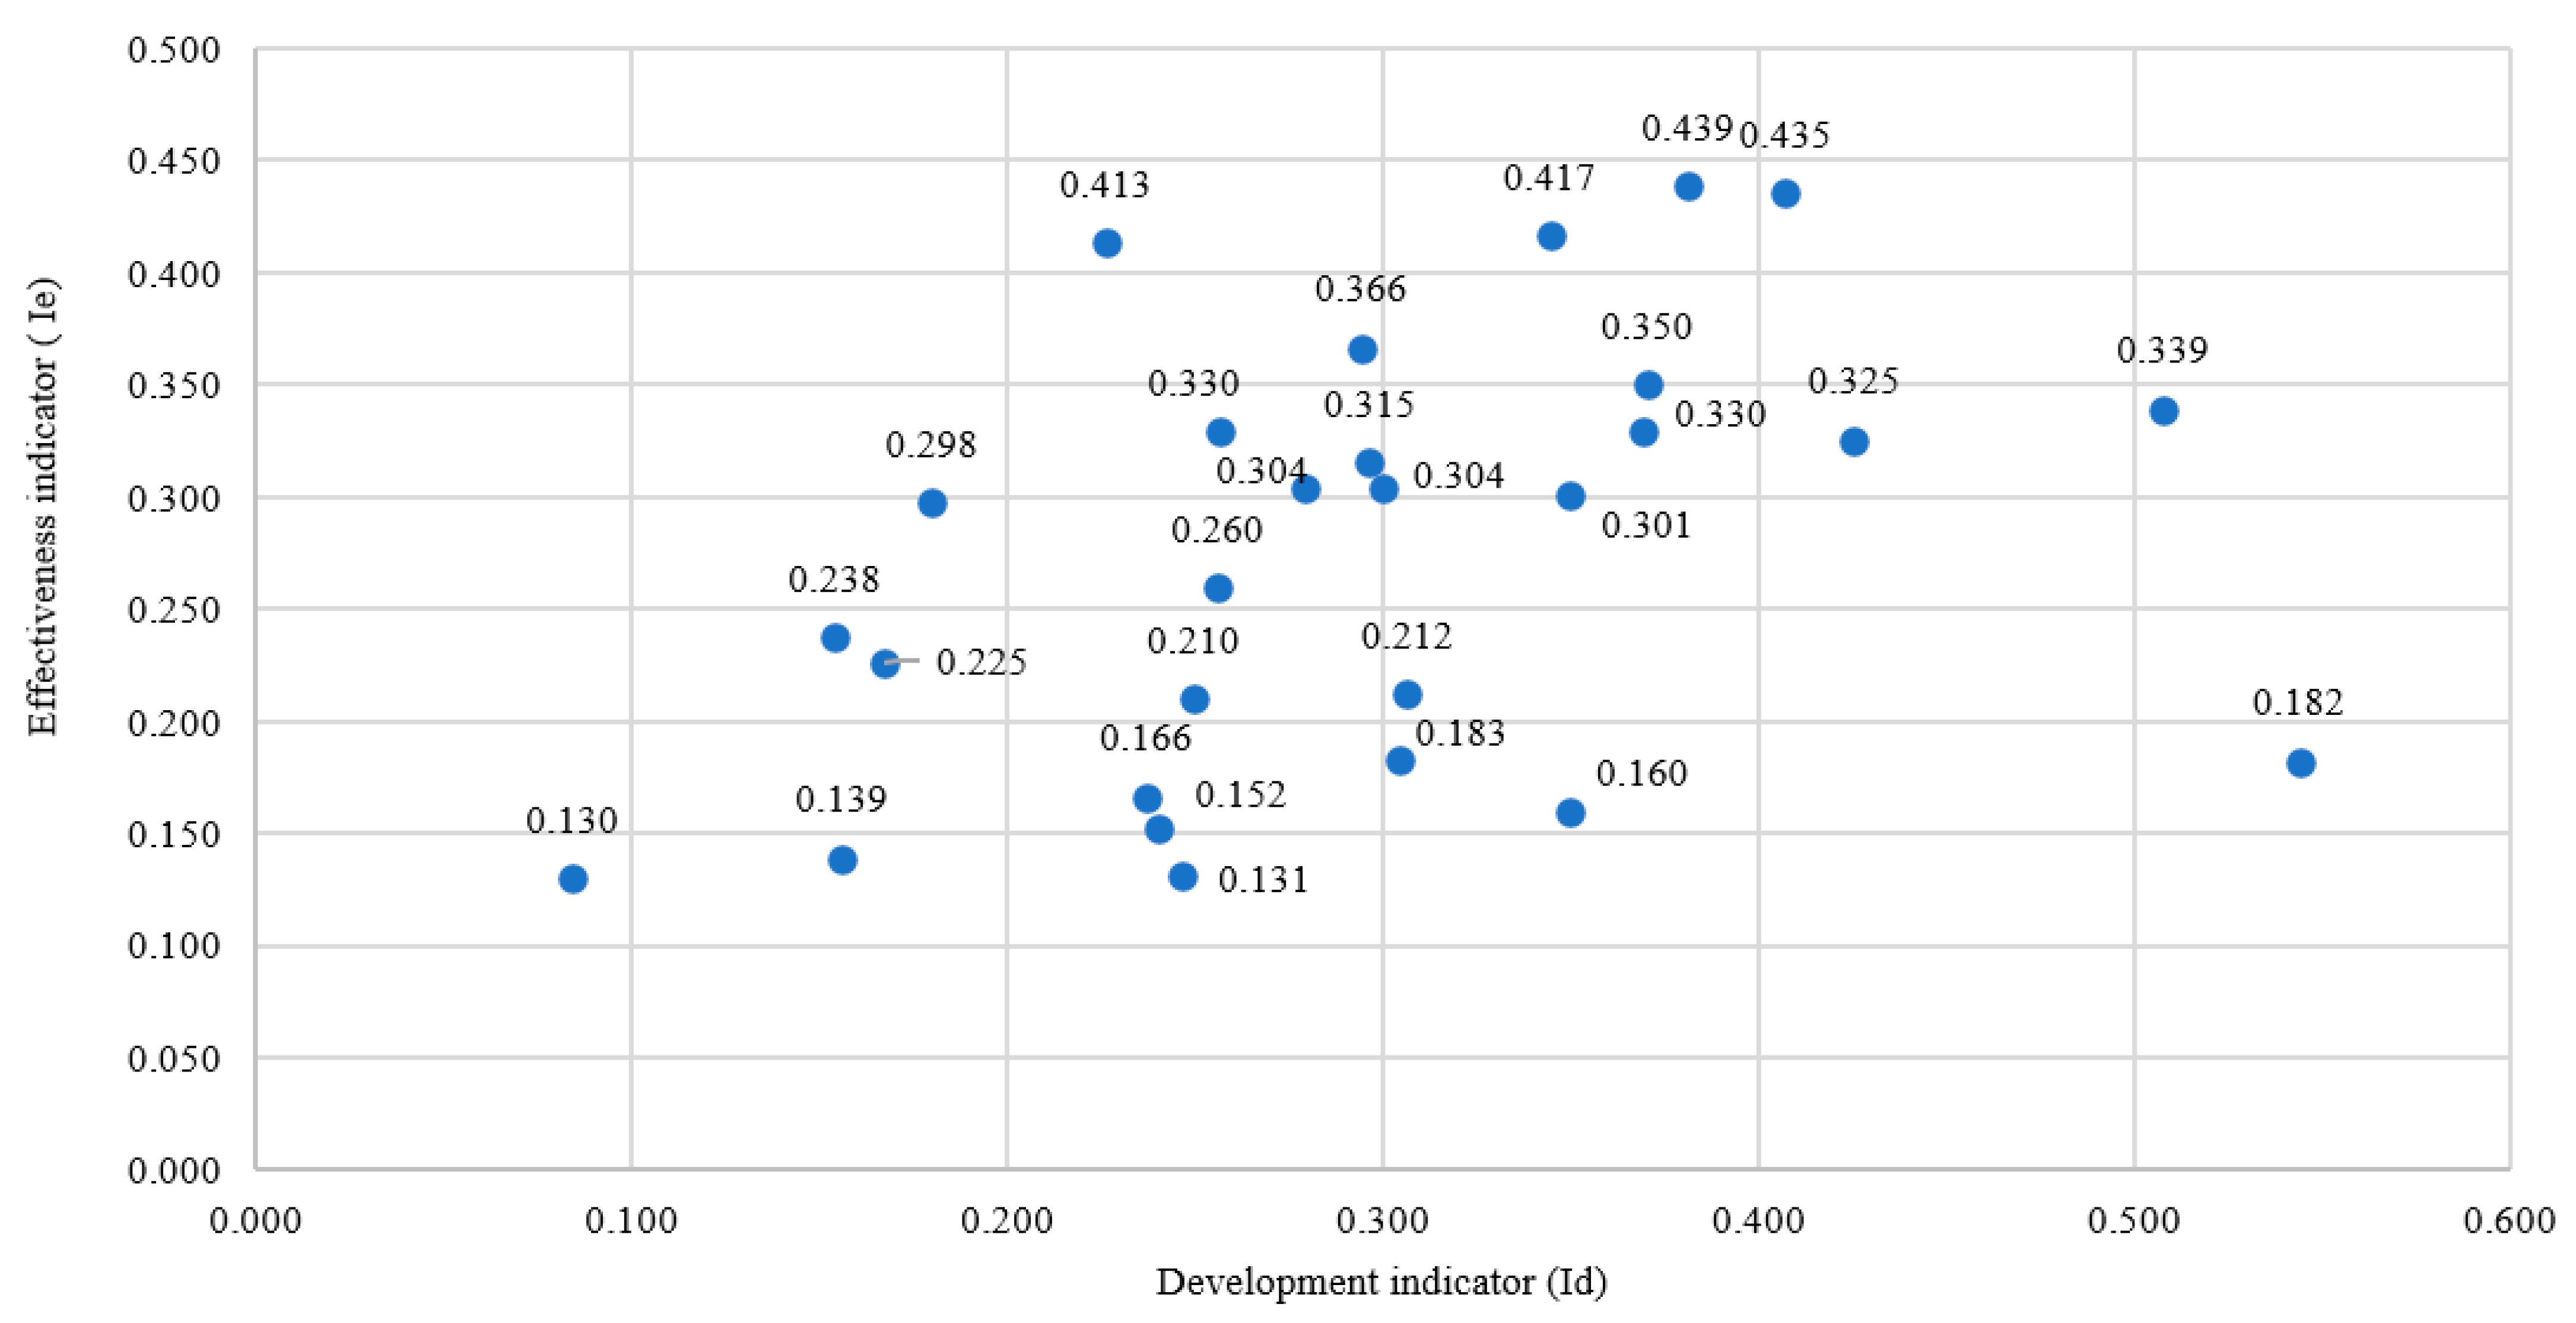
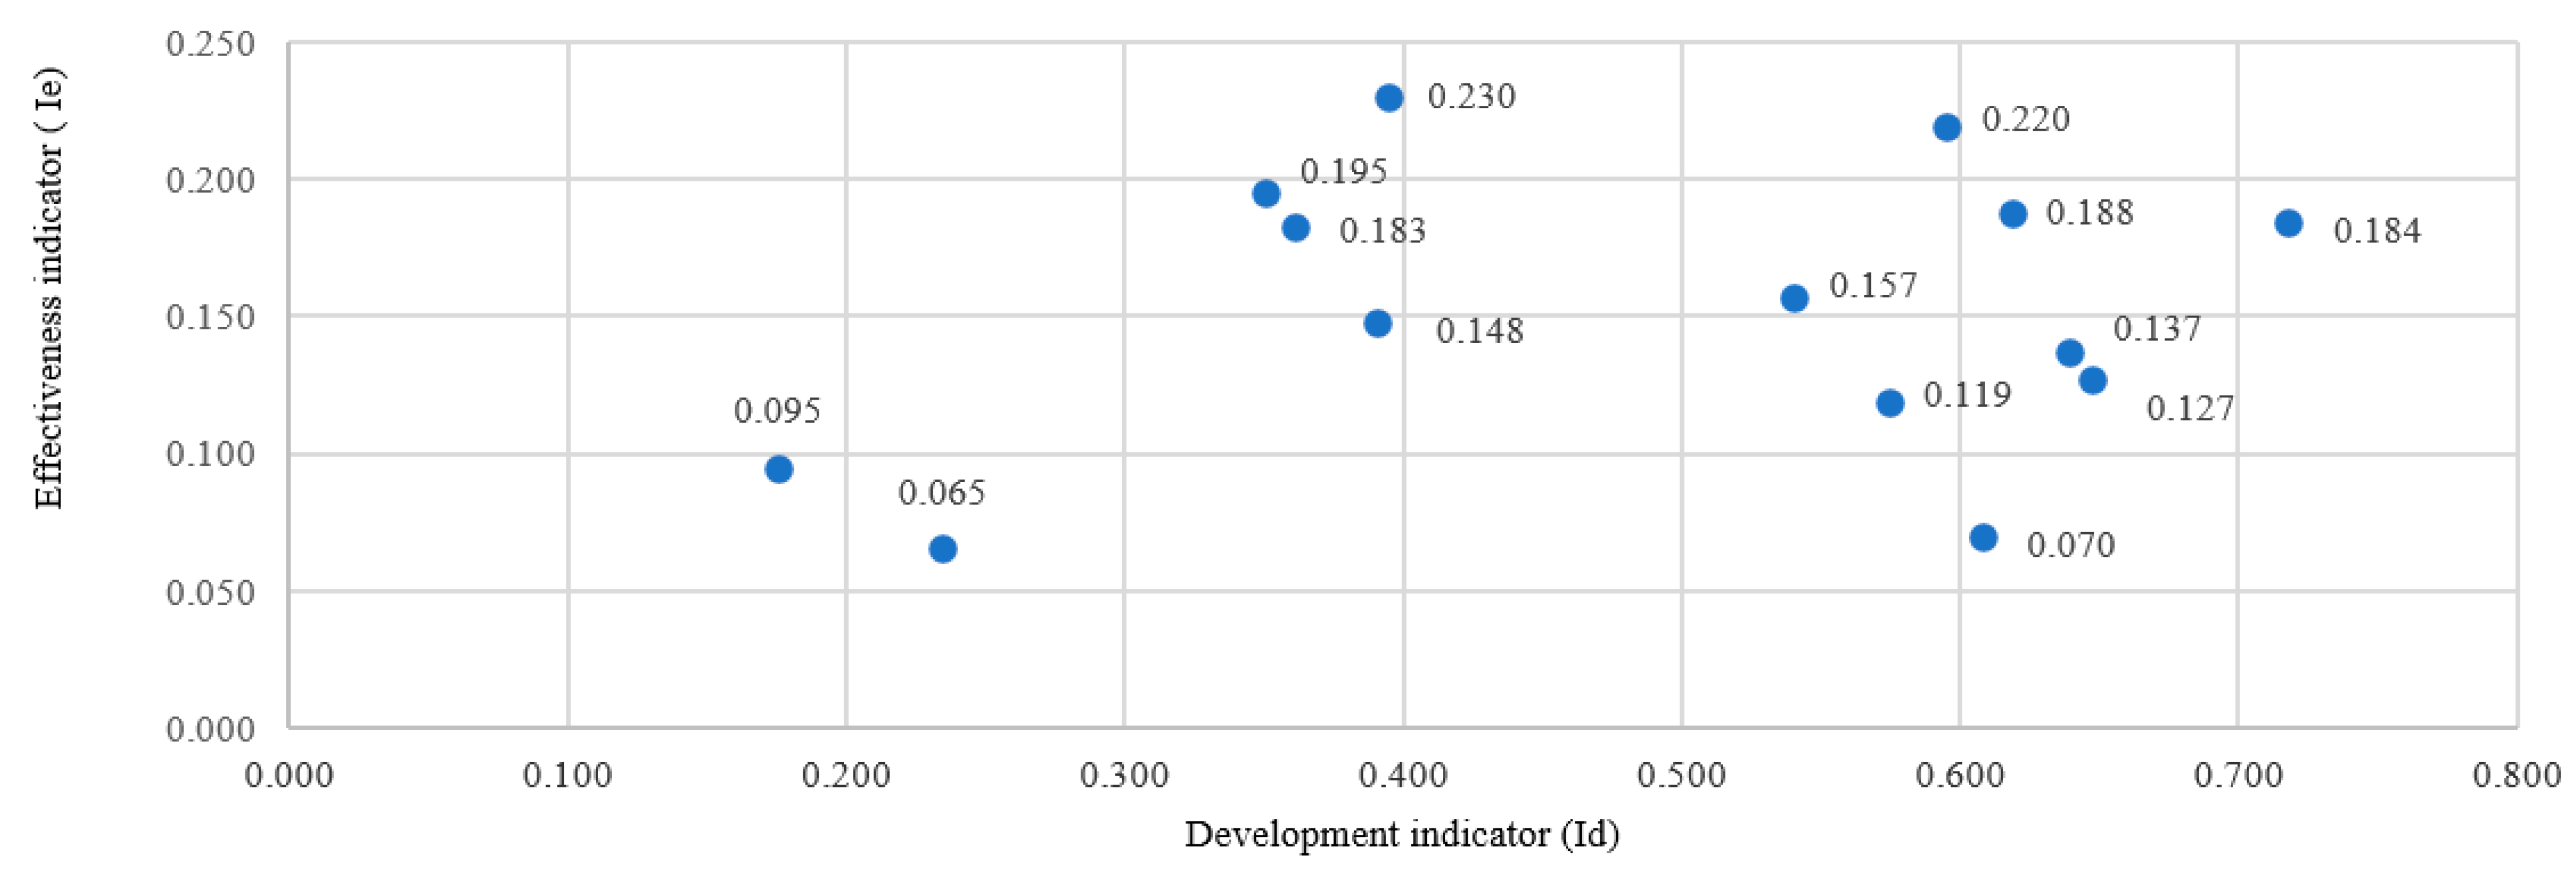
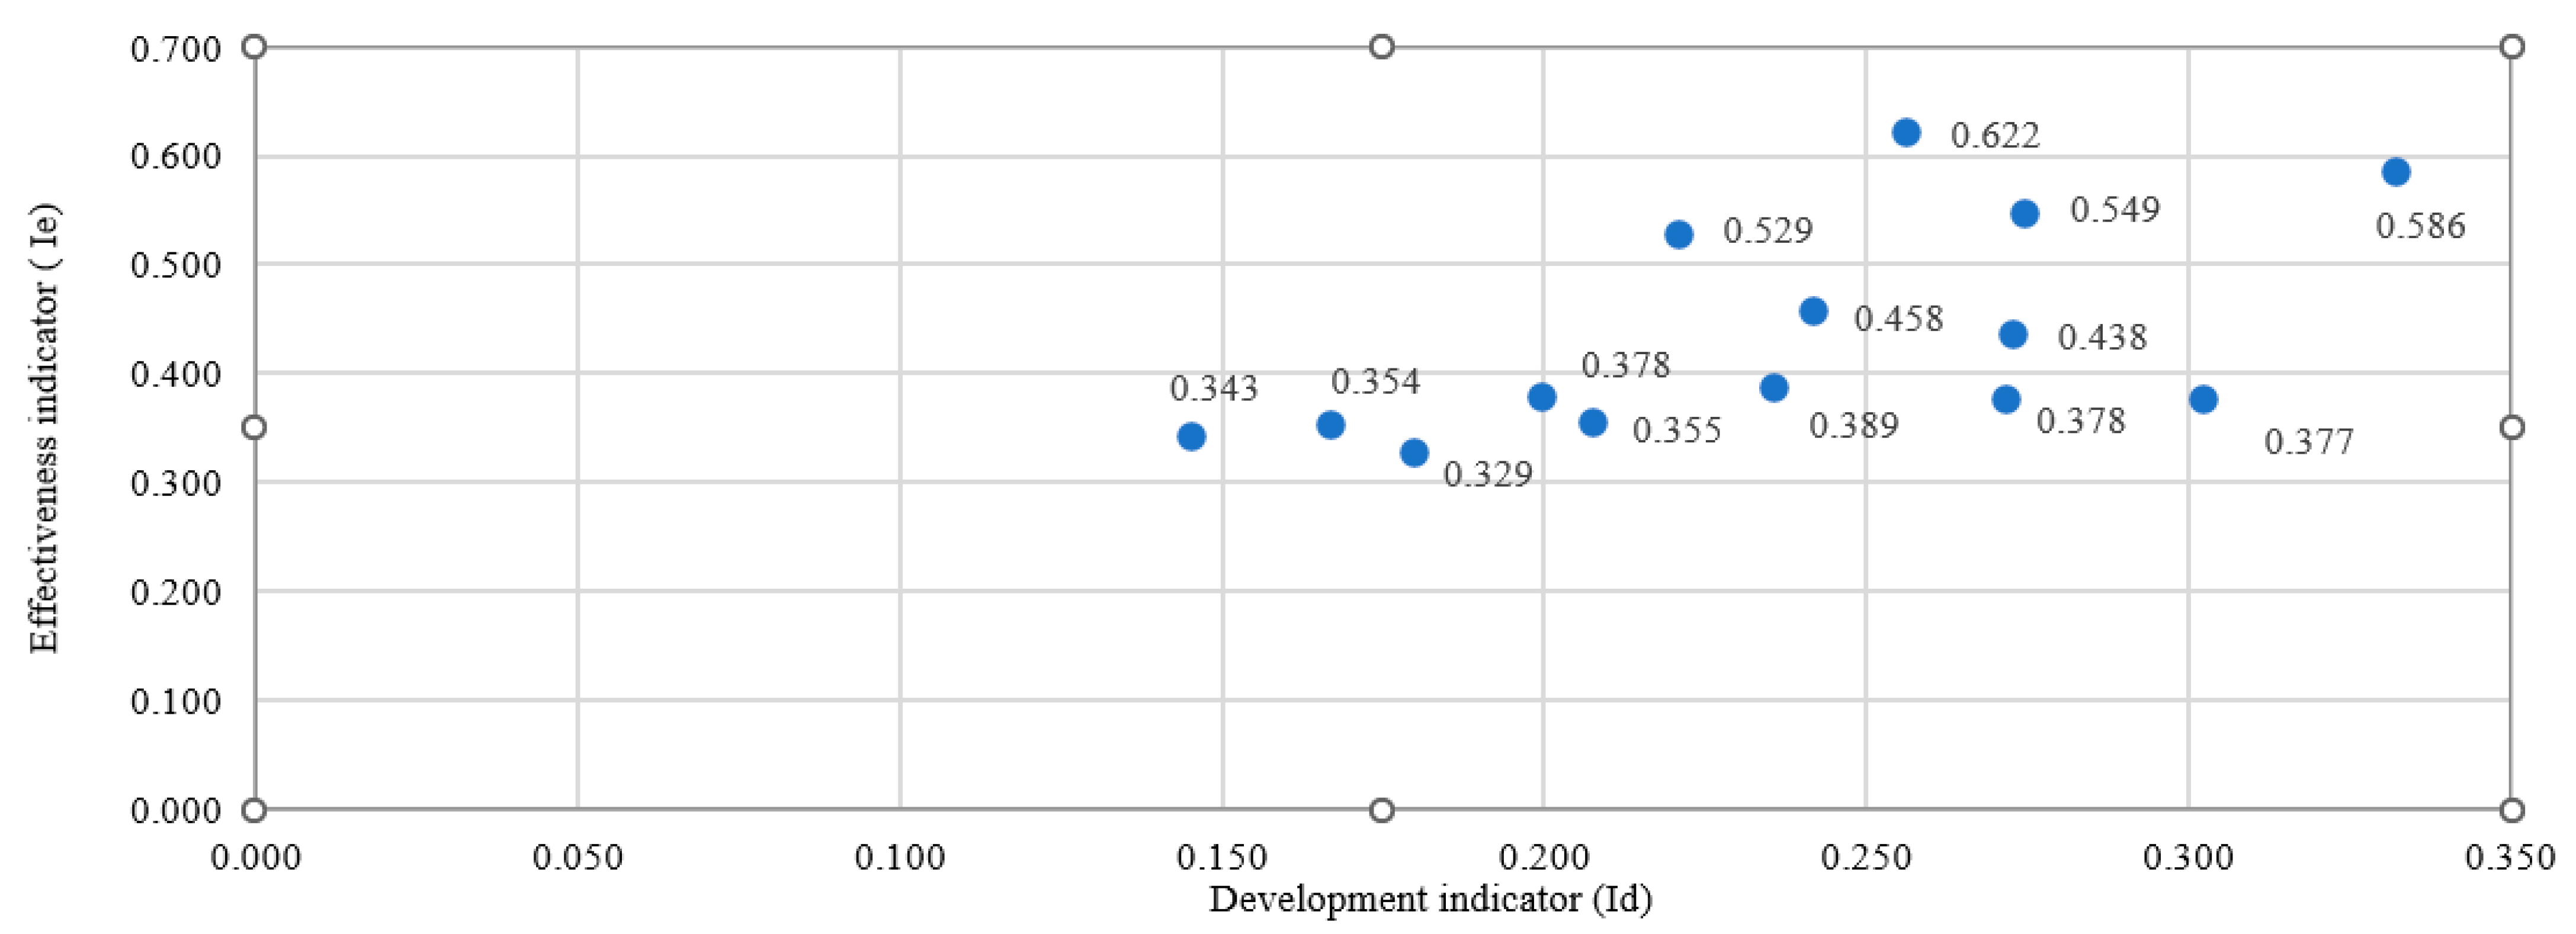
Disclaimer/Publisher’s Note: The statements, opinions and data contained in all publications are solely those of the individual author(s) and contributor(s) and not of MDPI and/or the editor(s). MDPI and/or the editor(s) disclaim responsibility for any injury to people or property resulting from any ideas, methods, instructions or products referred to in the content. |
© 2025 by the authors. Licensee MDPI, Basel, Switzerland. This article is an open access article distributed under the terms and conditions of the Creative Commons Attribution (CC BY) license (https://creativecommons.org/licenses/by/4.0/).