Abstract
Digitalization is one of the key phenomena shaping the modern world, and its impact on various sectors of the economy is increasingly important. The development of the tourism sector is inextricably linked to the development of digital technologies. This study investigates the relationship between the level of digitization and the competitiveness of the tourism sector across European Union countries. Drawing on the literature review, the research hypothesis posits a significant association between these two variables. Using the statistics obtained from Eurostat on digitization, the synthetic Hellwig measure was calculated to create a ranking of the level of digitization of EU countries. Then, the Pearson correlation coefficient was calculated; that is, the relationship between the ranking of digitization and the ranking according to the synthetic Travel & Tourism Development Index 2024 (TTDI) was examined. The study shows a positive correlation between the level of digitization and the competitiveness of the tourism sector in European Union countries. Countries with higher levels of digitization tend to perform better in the TTDI rankings. The study contributes to the academic discussion focusing on building competitive and resilient tourist destinations.
1. Introduction
Tourism is a key component of economic development in many countries, particularly in developing economies, where it serves as a major catalyst for economic growth and employment generation. It is suggested that tourism can contribute to the socioeconomic development of tourist destinations (Stryzhak et al., 2024). It’s one of the most important and fastest-growing sectors in many economies. In the face of economic globalization, growing competitiveness and turbulence in the environment, rising consumer demand, and new challenges, actions are required to maintain and achieve competitive standing in the worldwide tourism market. Digitalization is among the factors determining the need for changes and adjustments. It is among the most dynamic changes, opening new opportunities and creating new threats. It offers tools and possibilities for better understanding and meeting customers’ needs, which may lead to a competitive advantage in the market.
The research presented here aims to explore dependencies between the level of national digitalization and the competitiveness of the tourism sector in European Union countries.
There is no single, universally accepted definition or universal method of measuring tourism competitiveness in the literature on the subject, which is due to its complex and multifaceted nature. The available studies can be divided into three main strands: those analyzing the determinants of competitiveness; those focusing on selected elements of destination governance; and those describing the specific characteristics of destinations. Many competitiveness models emphasize the role of resources, management, infrastructure, technology, and social and environmental factors.
The literature review conducted in the theoretical part of the article clearly shows that digitalization has become one of the key factors shaping competitive advantage in the tourism sector. International analyses (including WEF, Salinas-Fernandez) confirm a strong correlation between the level of technological advancement and the competitiveness of destinations, indicating that the implementation of modern technologies increases the industry’s resilience to unexpected crises, improves operational efficiency, promotes innovation, and enhances the effectiveness of marketing activities, which ultimately translates into higher profitability for tourism entities.
The results of our own research, presented in the empirical part of the article on the level of digitization of European Union countries and the competitiveness of the tourism sector, confirm these findings and are fully consistent with previous analyses. The analysis carried out on the basis of statistical data for the years 2015–2024, based on the Hellwig method, which allows for the construction of a synthetic measure based on 11 selected diagnostic variables, also indicates a clear relationship between the degree of digitization and the competitiveness of tourism in EU countries. The values obtained from the measure made it possible to clearly determine the level of digitization in individual Member States, confirming the research hypothesis.
2. Theoretical Framework
The notion of competitiveness is closely related to the breakthrough work of Porter (1990) and is seen as a multi-level and multifaceted idea of market operation. Academic discussion offers a variety of approaches to competitiveness. In general terms, the various definitions converge on the concept of maintaining effective performance relative to other entities and ultimately achieving superiority within a specific context. Competitiveness can be applied to any degree of aggregation, i.e., of a state (Matkarimova et al., 2025; Andronic & Untaru, 2025), region (Grassia et al., 2024), industry (Iwanicz-Drozdowska & Nowak, 2024), economic sector (Jangam et al., 2023), enterprise (Stocker & Erdélyi, 2024; Feng et al., 2024; Castro et al., 2025), or cities (Vašaničová, 2025). At every level, it is a result of multiple internal and external factors of a social, political, natural, and cultural nature.
At the sector’s level, competitiveness means the ability of a given economic sector to preserve and extend its market share at both national and international levels. This measures how well businesses in the sector can compete against other enterprises by offering products and services attractive to consumers in terms of pricing, quality, innovation, and availability.
In the contemporary economy, the tourist sector is gaining significant importance. Tourism’s rising role as a driver of revenue, employment, foreign exchange, and investment has garnered significant scholarly and policy interest (Purwono et al., 2024). The literature on the subject points to the growing contribution of tourism to economic development (Adeleye, 2023), but also examines tourism competitiveness for its role in enhancing destination attractiveness (Kim et al., 2021) as well as factors enabling it (Agostinho et al., 2024). Competitiveness also enhances the quality of services and products and encourages the adoption of digital technologies (da Silva et al., 2025).
Destination competitiveness refers to a place’s ability to attract tourists and compete in the tourism market. It is shaped by numerous factors, including natural and cultural assets, well-developed tourism infrastructure, transport accessibility, service quality, price levels, safety, and the positive image (brand) of the region. Strategic management and cooperation among various stakeholders are essential for building competitiveness (Cordova-Buiza & Perea, 2024). Destination competitiveness is a destination’s ability to attract more tourists and provide them with satisfying and memorable experiences (Weng, 2019). Mazurek-Kusiak (2020) emphasizes that competitiveness in the tourist sector is maintained with the strategies of tourist agencies that focus on matching their offers to customer needs, introducing technical innovations to customer service, and following and analyzing the changing demand in the market.
A variety of indicators and indices have been applied to assess the tourist sector’s competitiveness. The synthetic TTDI (Travel and Tourism Development Index), developed by the World Economic Forum (2022) to replace the TTCI (Travel and Tourism Competitiveness Index), in place since 2007, is the most common. The TTDI consists of 17 pillars, merged into 5 dimensions comprising 102 individual indicators distributed among the different pillars. The Non-Leisure Resources, T&T Socioeconomic Impact, and T&T Demand Sustainability pillars are all new when comparing earlier TTCI editions with the new TTDI (in 2024).
The Enabling Environment dimension encompasses 38 indicators grouped into five pillars: legal regulations and business conditions (Business Environment), the safety and security of residents, tourists, and entrepreneurs (Safety and Security), the availability of health infrastructure and the associated security (Health and Hygiene), the quality of human capital, the dynamics, efficiency, and effectiveness of the labor market (Human Resources and Labor Market), the development and use of the ICT infrastructure and digital services (ICT Readiness). Another dimension, T&T Policy and Enabling Conditions, consists of 12 indicators in three pillars: promotion of and investment in tourism development (Prioritization of T&T), openness to and facilities for tourists (Openness to T&T), and the cost of travel and investments (Price Competitiveness). Infrastructure and Services include 14 indicators as part of three pillars, namely, the availability and quality of air, water, and land infrastructure. The dimension of T&T Resources comprises 14 indicators within three pillars: natural, cultural, and non-leisure business trip resources. The final dimension, T&T Sustainability, consists of 24 indicators related to the general sustainability of an economy’s natural environment, protection of its natural resources, and vulnerability to and readiness for climate change (Environmental Sustainability), the socioeconomic well-being and resilience of an economy (T&T Socioeconomic Impact) and factors that may indicate the existence of, or risk related to, overcrowding and demand volatility, as well as the quality and impact of T&T (T&T Demand Sustainability).
The contemporary economic environment has created a new economy characterized by the widespread digitalization shown by the massive utilization of ICT (Kusairi et al., 2023). The broad applicability of information and communication technologies to tourism has caused several scientific theories to be published since the beginning of the 21st century (Almeida et al., 2020). E-tourism is the earliest and broadest, referring to the digitalization of processes and value chains in tourism (Hamid et al., 2021). In line with socioeconomic and technological development, the smart tourism theory has emerged, envisaging enriched tourist experience and more effective actions at tourist destinations by collecting, aggregating, and processing data sets (Iwaniuk, 2020; Hamid et al., 2021). Some related ideas have appeared in the literature, including smart tourism destinations, smart hospitality, and tourism 4.0, connected with such solutions as the Internet of Things (Ordóñez et al., 2022), virtual reality (Zhu et al., 2025), or big data (Rehman et al., 2024).
Smart tourism involves intelligent tourist experiences that provide tourists with communication and interaction with the external environment entities (e.g., entrepreneurs, residents, public institutions). The information is supplied via ICT technologies like bike rental mobile applications, online payment systems for museums, parking, or urban transport tickets, and applications highlighting tourist attractions or routes, including interactive maps. These values, with a special emphasis on efficiency, sustainable development, and enriched experience, are transferred in real time. Smart tourism destinations have emerged over the last ten years as an advanced form of destination development. They are characterized by innovative, hyper-connected technological systems that facilitate sustainable practices, optimize resource management, enrich tourist experiences, and foster deeper engagement with local communities, ultimately boosting destination competitiveness (Vaz et al., 2025).
Tourism 4.0 (T4.0) can be understood as a concept aimed at improving the added value of tourism using ‘Industry 4.0’ technologies in the field of tourism, such as autonomous robots and cobots, virtual reality, autonomous transport, big data, and artificial intelligence. Therefore, the purpose of Tourism 4.0 is to ensure the effectiveness of tourism, as well as the formation of personal tourism experiences and the development of a model of cooperation between the participants in the process (Astanakulov, 2022). Although the COVID-19 pandemic has increased the use of technology in tourism and more enterprises have become more digitalized, it must be acknowledged that technologies and their implementation in tourism are not new (Table 1).

Table 1.
The development stages of Tourism 4.0.
Only an advanced ICT infrastructure enables a more dynamic, less rigid, and faster interaction within and between organizations at a tourist destination, which empowers stakeholders through the creation of a technological infrastructure for increased communication and collaboration (Buhalis, 2000). Tourist destinations are now, more than ever, building competitive places using state-of-the-art business models. However, without a proper information environment, these models are often subjected to failure (Peceny et al., 2019). Smart tourism is founded upon a smart tourism ecosystem with its main elements: local communities, tourists, tourist service providers, and government. Information can be shared among various stakeholder groups (from different locations and markets) at an appropriate time only using state-of-the-art technologies available in the market, including artificial intelligence, internet of things, augmented reality, high-performance computing, cloud computing, big data, wireless connectivity, emerging technologies, and blockchain.
New disruptive technologies, such as artificial intelligence (AI) and the Internet of Things (IoT), are crucial to achieving more efficiency and productivity in the tourism and travel industry (Ordóñez et al., 2022). Artificial intelligence (AI) is playing a transformative role in enhancing customer experience in the tourism industry. It provides personalized travel recommendations and sophisticated customer service solutions, tailored to individual preferences and needs (Moghadasnian, 2024). AI reengineers internal processes and procedures by enabling data and content as catalysts of competitiveness, empowering the augmented worker, and performing mass personalization and customization (Bulchand-Gidumal et al., 2023). The adoption of IoT technology is instrumental in the development of smart tourism environments. It has several advantages, such as cost savings, increased productivity, greater efficiency, and customized and differentiated services (Demirciftci, 2024). Big data and analytics are considered beneficial to businesses in general and the tourism and hospitality industry in particular (Yallop & Seraphin, 2020). The use of data is viewed as a disruptive innovation in the tourism and hospitality industry, although it allows organizations in the industry to facilitate personalization, offer convenience, save costs, and overall gain a competitive advantage (Evans, 2024). The implementation of tourism blockchain technology provides travel companies with competitive advantages in the digital space (Baydeniz, 2024). Integrating blockchain technology into a company’s website and marketing strategies has the potential to enhance customer experience, increase brand loyalty, and ultimately boost sales and conversions (Rashideh, 2020).
Digitalization has increased over recent years, especially during COVID-19, as the pandemic affected the whole industry and its operation, forcing changes to its conditions (Abbas et al., 2021). Using digitalization solutions was a means to adapt to changing market conditions in order to survive.
The COVID-19 pandemic and the resulting remote work phenomenon made location-independent work possible and cultivated digital nomad markets (Zhou et al., 2024) and workcations—a new form of hybrid tourism (Bassyiouny & Wilkesmann, 2023). Face recognition, artificial intelligence, and robots began to be employed in many facilities to improve the quality of services (Sousa et al., 2024; Lau, 2020). Social media has substantially altered the service industries, including the catering and tourist sector, chiefly in terms of information finding and decision-making, promotion and marketing, and best practices in consumer interactions. In effect, firms have more opportunities for reaching customers and selling their products (Shriharsha, 2023). A growing number of hotels and resorts are adopting live streaming as the newest popular form of online entertainment. (Bu et al., 2025). The important role of digitalization is stressed in research into the competitiveness of the tourist sector (Doğan, 2025; Adekuajo et al., 2023). COVID-19 accelerated the digitalization processes, especially in respect of cooperation with staff, suppliers, and customers (Almeida et al., 2020; Amankwah-Amoah et al., 2021) and the profitability of the catering and hotel sector (Rathore et al., 2023; Malikah, 2021). The concept of smart tourism by means of technology, innovation, and cooperation improves tourist experiences, boosts the effectiveness and competitiveness of tourist enterprises and resorts, and contributes to an overall, sustainable, and competitive development (Iwaniuk, 2020). The resilience of companies that have embraced digital transformation is emphasized, suggesting that digital evolution could be a buffer against economic downturns caused by unforeseen global crises (Ghosh & Bhattacharya, 2022).
Based on the review of specialist literature, the research hypothesis H is postulated: a dependence exists between the standard of digitalization and the level of competitiveness of the EU countries’ tourist sector.
3. Materials and Methods
A numerical taxonomy technique known as the pattern of development method is used to evaluate the digitalization of the European Union countries and verify the research hypothesis. The analysis consists of several key stages:
- The choice of statistical indicators defining the development of digitalization.
- The creation of synthetic indicators to assess the standard of EU-27 states’ digitalization.
- The application of the k-means method to cluster the EU-27 states.
The study utilized 11 indicators, which can be divided into four groups: human capital & technology workforce, economic development & innovation capacity, digitalization & e-commerce, and tourism & travel activity. The selection of these factors was deliberate and justified, as it allows for a comprehensive assessment of the conditions conducive to the implementation of digital technologies, the actual level of digitization of the economy, and the real effects of this digitization visible in the competitiveness of the tourism sector in European Union countries. human capital and technology workforce skills form the basis for the implementation of digital technologies in tourism, enabling the effective use of modern tools. Economic development and innovation capacity reflect the ability of countries to invest in digital infrastructure and promote technological transformation, which indirectly affects the competitiveness of the sector. The group concerning digitization and e-commerce directly indicates the level of technological advancement of the economy, which shapes the availability of digital tourism services and the efficiency of businesses. In turn, factors related to tourism and travel activity allow for an assessment of the actual effects of digitalization, e.g., an increase in tourist traffic. The inclusion of these four groups provides a comprehensive overview of the relationship between digitalization and the competitiveness of tourism, taking into account both the conditions enabling transformation and its measurable results. These indicators are part of the enabling environment—the pillar of ICT Readiness (index TTDI), which measures the development and use of ICT and digital services.
Hellwig’s (1968) method is utilized to construct a synthetic measure based on selected diagnostic variables representing a variety of aspects of a phenomenon under investigation.
Data on key indicators of digitalization, entrepreneurship, tourism, and the economy at the EU-27 level were considered. Available data from the Eurostat database were used. The research period covered 2015–2024. The empirical analysis considered average values for all variables studied during this period. Eleven key indicators, numbered 1 to 11, were discussed, and their detailed breakdown is presented in Table 2.
Table 2.
A list of features to be investigated.
Hellwig’s method requires the following observation matrix to be constructed:
where
- xij—jth variable in ith state (i = 1, 2…, n; j = 1, 2, …, m).
Then, the values of Xj in a tested population need to be standardized. The following equations are used in the calculations (Maráková et al., 2016):
- (a)
- For the stimuli:
- (b)
- For the inhibitors:
- zij—the standardized jth variable in the ith state;
- i—state number;
- j—variable number;
- —the values of the jth variable in the ith state;
- —the arithmetic mean of the jth variable, formulated as follows:
- —the standard deviation of the jth variable, formulated as follows:
- The coefficient of variation is a relative measure of dispersion, calculated as follows:where
- Vj—the coefficient of variation of the jth variable;
- Sj—the standard deviation of the jth variable;
- —the arithmetic mean of the jth variable.
A certain critical value of the coefficient of variation V* (normally V* = 0.1, V* = 0.15, or V* = 0.2) needs to be determined next; V* = 0.1 is adopted for this study. Values computed for given variables are then compared to the critical value. For statistical reasons, quasi-constant variables, whose coefficient of variation is below 10%, must be removed from the variable set; this is not the case here, however. As a result, two types of dependencies may occur. The first holds where V(xj) ≤ V*. xj is the so-called quasi-constant variable that must be removed from the set of potential variables. The other type of dependence obtains where V(xj) > V*, and thus, xj exhibits a satisfactory variability.
Before proceeding to determine a development pattern, a matrix of standardized Z values needs to be built by converting the matrix of observations X (Pomianek, 2010):
where
- zij—the standardized value of xij.
The matrix of standardized Z values is the starting point for determining the pattern of development. The pattern is an abstract state of best-observed variable values. P0 of standardized coordinates (z01, z02, z0m) can be defined as follows:
On converting the variables, the pattern method needs to be applied, assuming the existence of a model object, relative to which the taxonomic distances of tested objects are determined using Euclidean space. The synthetic measure of a state’s development is computed as a synthetic indicator of the taxonomic <distance> of a given state from the theoretical pattern of development. At the final stage, therefore, for each object Pi (state), the distance from the pattern (the value of the synthetic metric called the measure of development Mi) needs to be determined as formulated by (Bąk, 2016):
where
- Mi—synthetic metric/measure of development/;
- —the Euclidean space of any object from the constructed pattern of development;
- m, n—the number of variables, objects/states, respectively;
- zij—the standardized value of input features (jth variable for ith state);
- zoj—the standardized value of model unit/standardized model value for jth variable;
- —the arithmetic mean of taxonomic distances;
- —the standard deviation of taxonomic distances.
The measure of development is a standardized value, normally in the range 0 to 1. The results for the indicator Mi (the sequence M1, M2, …, Mn) for the particular objects should be ordered from top to bottom, then classified based on selected statistical criteria. These values are interpreted as follows: the higher the measure of development, the more developed an object is, and vice versa: a lower value points to poorer development. A higher indicator suggests an object is closer to an ideal model, that is, an abstract point of optimum diagnostic values. The closer the values are to zero, the nearer an object is to the ideal model. The taxonomic analysis of the development indicator values helps to group the objects into homogeneous classes. The states are divided into four typological groups by means of the k-means method, with the features split into two subsets: one includes the objects with above-average indicator values, the other those with lower values. Intermediate means are then defined for each group, which allows for their further discrimination:
- class I—a high state competitiveness, where ;
- class II—a moderate state competitiveness, where ;
- class III—a low state competitiveness, where ;
- class IV—a very low state competitiveness, where ;
where
- —mean development measure;
- and —intermediate means z of development measure values.
The synthetic Hellwig’s measure is a result of all features characterizing tested objects and thus helps to define average feature values over a specified time (Sompolska-Rzechuła, 2020).
The 2024 Tourism and Travel Development Index (TTDI) was used to assess the competitiveness of European Union countries. It is based on the Travel & Tourism Competitiveness Index (TTCI) prepared by the World Economic Forum in 2007. It enables comparing countries across factors affecting the development of tourism. The Index supplies information about individual state policies and the investment decisions of tourist businesses. It is a useful tool for measuring the competitiveness of domestic tourist regions and making international comparisons by means of a standard set of indicators.
Ranking EU countries’ digitalization and then investigating dependencies between the digitalization of particular EU countries and the competitiveness of tourism in those countries are the subsequent stages of verifying the hypothesis. To determine the power and direction of the relationship between the digitalization and TTDI-24 EU rankings (average for 2015–2024), Pearson’s coefficient of correlation is calculated based on the so-called feature covariance, cov(xy), which can be expressed as follows:
where
- xi—the value of feature x;
- yi—the value of feature y;
- x—the arithmetic mean of feature x;
- y—the arithmetic mean of feature y;
- N—the number of observations.
Pearson’s coefficient of correlation is calculated as follows (Ręklewski, 2020):
where
- S(x)—the standard deviation of feature X;
- S(y)—the standard deviation of Y.
The coefficient of correlation’s symbol indicates the direction of correlation (+ signifies a positive correlation, − negative correlation). Correlation is positive when the values of one, and the other feature rise. It is negative when the values of one feature increase and of the other diminish. Its absolute value is evidence of a relationship’s power.
4. Results and Discussion
Based on the diagnostic variables and the calculation method described above, the statistical characteristics of these variables are presented, and the synthetic indicators for the individual EU-27 states are calculated. The k-means method is then applied to divide the countries into four categories. Thus, the analysis involves a geographical differentiation of digitalization standards in the EU-27 states. Their values are compared to the European Union (EU-27) averages.
The values of diagnostic variables and the algorithm for computing the synthetic taxonomic index representing the digitalization of the European Union states are presented in Table 3. The values of the synthetic index uphold the opinion of a considerable diversity of digitalization levels in the EU countries. The diversity is especially true of the variables X2, X3, and X4, for which the coefficient of variations are in the range 50% < V < 100%. X5, X9, and X10, on the other hand, display an average variability, since the dependence <20%; 40%> is fulfilled.
Table 3.
The statistical characteristics of diagnostic variables and the synthetic digitalization indices of EU-27 states.
As a result, the EU-27 countries are divided into four categories regarding their digitalization. With reference to digitalization indices, they are ranked as shown in Table 4.
Table 4.
The division of EU-27 countries by the standards of their digitalization.
It can be noted that Ireland exhibits the highest synthetic index of 0.59, indicating a high standard of digitalization. The same group consists of 7 more countries: Denmark, Sweden, Belgium, Germany, Finland, the Netherlands, and Austria. Luxembourg, France, Spain, Slovenia, Estonia, and the Czech Republic rank high, too, though ranking somewhat lower. The whole EU-27 belongs to this group. The low-digitalization group comprises 8 states: Malta, Hungary, Cyprus, Poland, Slovakia, Croatia, Lithuania, and Latvia. A very low digitalization standard characterizes 5 countries: Italy, Portugal, Greece, Bulgaria, and Romania. The particular European Union countries are ranked for their digitalization in line with the synthetic index M1, as shown in Table 5.
Table 5.
The ranking of digitalization and competitiveness levels of the EU countries’ tourist sectors.
To assess the statistical significance of the correlation between digitalization and EU TTDI-24 rankings, Pearson’s correlation test is carried out. Its result is 0.46, indicating a moderate positive correlation, which means higher digitalization rankings are associated with higher standings in the European Union TTDI-24. The countries with higher digitalization standards tend to rank higher for their tourism competitiveness. It should be emphasized that while no strong correlation was observed, there is a clear tendency for covariation, with other factors also influencing the relationship between the variables. In summary, there is a noticeable, moderate relationship between the analyzed variables: a tendency for their values to increase (or decrease) simultaneously is observed, but this relationship is not strict, and many observations may deviate from a perfect straight line. The score diagram (Figure 1) shows the dependence between digitalization and EU TTDI-24 rankings. The graph illustrates a positive trend, aligned with the results of the correlation analysis.
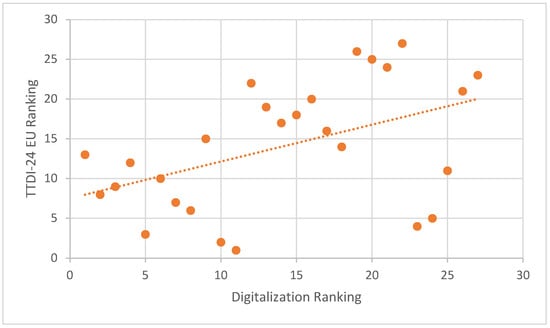
Figure 1.
The correlation between the digitalization and competitiveness ranking of the European Union’s tourist sector.
The analysis indicates a moderate positive correlation between digitalization and the competitiveness of tourism in the European Union countries. More digitalized countries tend to perform better in TTDI-24 EU rankings, which corroborates our research hypothesis: a dependence exists between the standard of digitalization and the level of competitiveness of the EU countries’ tourist sector.
No single, universal definition of or methods of analyzing and measuring the competitiveness of tourism/tourist resorts on an international scale are offered by specialist literature (Hossain et al., 2024; Cronje & Du Plessis, 2022). This is due to divergent definitions, identified factors, and models of competitiveness applied in the sector, which, in turn, are the results of the fact that these analyses can be classified into three groups. The first (and most numerous) focuses on factors determining the competitiveness of the sector, comprising economic, social, technological, environmental, cultural, and political dimensions (Purwono et al., 2024; Martínez-González et al., 2021). The second group addresses a specific aspect of a tourist destination’s competitiveness, e.g., tourists’ satisfaction (Andronic & Untaru, 2025; Sustacha et al., 2023), while the third group encompasses the analysis of the unique potential of a given location (Dinh, 2023; Murayama et al., 2022).
Research into and analyses of the sectors’ and resorts’ competitiveness (mainly since the 1990s) have referred to Porter’s (1990) study of the competitive advantages and strategies of sectors, enterprises, and national economies. The models of tourism destination competitiveness (TDC) were developed by, among others, Dwyer and Kim (2003), who stressed links between destination competitiveness and the socioeconomic development of a region by means of factors like core resources, supporting factors and resources, destination management, situational conditions, or market performance. The Sustainable Destination Competitiveness Model (Heeth, 2003), in turn, emphasizes the following factors: human resource development, communications, and information management. Gooroochurn and Sugiyarto (2005) have compiled a competitiveness monitor model and a tourism industry-specific model of measuring destination competitiveness based on such factors as price, openness, technology, infrastructure, social development, environment, and human resources.
Our literature review proves a positive relationship between the standard of digitalization and the competitiveness of a tourist destination. The results of the study by Vena-Oya et al. (2025) showed that the digitization of destinations affects tourism sustainability in a changing way, highlighting its positive impact on the economic dimension, which is undoubtedly the one that benefits most from the effects of increased digitization. The study by Kubickova et al. (2025) demonstrates that innovation capacity, digitalization, and R&D investment are key drivers of tourism development in the EU. The authors find a moderate to strong link between innovation potential and tourism performance, while higher R&D spending and digitalization levels significantly strengthen tourism-related innovation. Using data from the EIS (European Innovation Scoreboard) and DESI (Digital Economy and Society Index), TTDI (Tourism and Travel Development Index), and statistics from UNWTO and Eurostat, the study shows that EU countries with more advanced digital and innovation systems achieve superior tourism outcomes.
Allahverdi et al. (2025) used K-means clustering to analyze 119 countries based on the Travel and Tourism Development Index (TTDI), identifying seven distinct clusters. Cluster 1, with the lowest averages, mainly includes African countries (e.g., Angola, Senegal). Cluster 2, below average, consists primarily of South American nations. Cluster 3, slightly above Cluster 1, spans multiple continents (e.g., Mongolia, Kazakhstan, Algeria). Cluster 4, the smallest group, shows mid-range values and strengths in price competitiveness and natural resources (e.g., Brazil, India). Cluster 5, mainly European countries (e.g., Poland, the Slovak Republic), performs at or above average across business environment, safety, health, labor markets, ICT, infrastructure, tourism services, and sustainability. Cluster 6, with the highest averages, excels in multiple dimensions, including environmental sustainability and resilient socioeconomic structures (e.g., Australia, Canada, France, Germany). Cluster 7, with the second-highest averages, performs strongly in business environment, safety, labor markets, ICT and transport infrastructure, international openness, and tourism services (e.g., Austria, Belgium, Denmark). The research results show that countries with low performance tend to face shortcomings in enabling conditions, infrastructure, and service quality. In contrast, high-performing countries demonstrate strong infrastructure and sustainability outcomes, although some areas still offer room for improvement. Countries in the medium-performance group particularly need enhancements in tourism policy and sustainability.
The study by Štilić et al. (2024) served as the basis for creating the ranking of European Countries using a hybrid MEREC–MARCOS MCDA approach based on the Travel and Tourism Development Index. This study tackles the issue by applying a hybrid multi-criteria decision analysis that integrates the MARCOS (Measurement of Alternatives and Ranking According to Compromise Solution) method with the MEREC (Method based on the Removal Effects of Criteria) approach. The combined results indicate that the ranking of European countries differs from the order presented in the TTDI. Spain emerges as the top-ranked country, while Turkmenistan occupies the lowest position, and the sensitivity analysis confirms the robustness of these outcomes. The findings emphasize that, when using the TTDI to rank countries, it is essential to account for the relative importance of the criteria to accurately represent the conditions relevant to tourism development, an aspect clearly underscored by this research.
This review implies that the original authors’ research results are aligned with, or similar to, those from other authors and uphold the research hypothesis H: a dependence exists between the standard of digitalization and the level of competitiveness of the EU countries’ tourist sector.
5. Conclusions
Digitalization, defined as the integration of digital technologies into business processes, has substantially transformed the tourist sector and influenced its competitiveness in several dimensions. This greatly improves its operating efficiency through online booking, customer service, and marketing, which saves time and resources. Moreover, the use of mobile applications, virtual guides, and interactive maps enhances tourists’ comfort and satisfaction. Online opinion and review platforms allow customers to share their experiences, affecting other tourists’ buying decisions.
Digitalization also drives product and service innovations. The application of virtual and augmented realities offers new, unique tourist experiences. In addition, big data analysis may create tailored services.
In our own research to assess the level of digitization in a country using the Hellwig method, we used 11 indicators, which can be divided into four groups. The first Human Capital & Technology Workforce includes X1—Human resources in science and technology, and X2—Employed persons in high and medium–high technology manufacturing sectors and knowledge-intensive service sectors. Both of these indicators describe the structure of the workforce related to advanced technologies and competencies. The second group, Economic Development & Innovation Capacity, includes X3—Gross domestic product at market prices and X4—Gross domestic expenditure on research and development (R&D), as these are macroeconomic measures of economic development and innovation expenditure, often analyzed together. The third group, Digitalization & E-Commerce, consists of X5—Enterprises having received orders online, X6—Enterprises’ total turnover from e-commerce sales, X7—Share of households with internet access, and X8—Individuals using the internet for finding information about goods and services. These indicators describe both digital infrastructure and competencies, as well as e-commerce activity on the part of businesses and consumers. The fourth group, Tourism & Travel Activity, consists of a coherent set of indicators describing participation and travel expenditure: X9—Persons participating in tourism for personal purposes, X10—Personal travel expenses, X11—Travel expenses for professional and business purposes.
The analysis based on indicators X1–X11 fits well with the hypothesis that there is a relationship between the level of digitization and the competitiveness of the tourism sector in European Union countries. This set of data allows us to capture the mechanisms through which digitization influences the development and attractiveness of tourism, thereby strengthening the competitive position of this sector.
Indicators relating to internet access and use (X7–X8) show the extent to which the public uses digital tools to search for information about tourism services and plan their trips. Data on the activity of enterprises in e-commerce (X5–X6) reflect the ability of companies, including tourism entities, to operate in the digital market and provide online services, which increases their efficiency and reach.
Indicators related to participation in tourism and tourism expenditure (X9–X11) allow us to analyze how the level of digitalization in a given country translates into the intensity of tourist traffic and the propensity to consume in this sector. Combined with information on economic development and innovation potential (X3–X4), the analysis makes it possible to assess whether more digitized countries achieve better tourism results.
Importantly, the selection of these specific indicators is an original proposal by the authors of the article, which emphasizes the innovative nature of the research approach. This set of variables allows for a comprehensive view of the relationship between digitalization and the competitiveness of the tourism sector, going beyond standard approaches. This allows for a more complete understanding of how digital technologies affect the functioning and competitive advantages of tourism in EU countries.
The results of the study made it possible to create a ranking of the level of digitization of EU countries, which was then compared with the ranking of the competitiveness of the tourism sector. The results confirm that there is a correlation between the level of digitization and the level of competitiveness of the tourism sector in EU countries. Countries with a high level of digital development also occupy high positions in the tourism competitiveness ranking. This is evidenced by Pearson’s correlation coefficient of 0.46, indicating a moderate positive relationship between the level of digitization and the results in the TTDI 2024 ranking. This means that countries with better digitization results tend to have a more competitive tourism sector.
The results obtained are consistent with the existing scientific achievements of other authors, confirming the relationship between digital development and the efficiency of the tourism sector observed in the literature. However, the originality of the research lies in the methodology adopted—the authors selection of digitalization indicators, the construction of the synthetic M1 measure, and the creation of a ranking of EU countries’ digitalization based on it, followed by an analysis of the relationship between the rankings. This research approach allows for a comprehensive and innovative assessment of the impact of digitalization on the competitiveness of the tourism sector in the European Union.
Further research may focus on identifying key challenges and barriers related to the implementation of digitalization in the tourism sector. It is worth emphasizing that this process requires not only appropriate investments but also a change in the approach to management and ensuring a high level of data security and protection. The analysis of these issues will be the subject of further stages of the authors’ work.
Author Contributions
Conceptualization, V.M., A.W.-T. and K.S.; methodology, V.M., A.W.-T., K.B., K.S. and P.K.; software, V.M., A.W.-T., K.B., K.S. and P.K.; validation, V.M., A.W.-T., K.B., K.S. and P.K.; formal analysis, V.M., A.W.-T., K.B., K.S. and P.K.; investigation, V.M., A.W.-T., K.B., K.S. and P.K.; resources, V.M., A.W.-T., K.B., K.S. and P.K.; data curation, V.M., A.W.-T., K.B., K.S. and P.K.; writing—original draft preparation, V.M., A.W.-T., K.B., K.S. and P.K.; writing—review and editing, A.W.-T., K.B. and K.S.; visualization, V.M., A.W.-T., K.B., K.S. and P.K.; supervision, V.M., A.W.-T., K.B., K.S. and P.K.; project administration, P.K.; funding acquisition, V.M. All authors have read and agreed to the published version of the manuscript.
Funding
This work was supported by the Scientific Grant Agency of the Ministry of Education, Science, Research and Sport of the Slovak Republic VEGA, under Grant number 1/0360/23 “Tourism of the New generation—responsible and competitive development of tourism destinations in Slovakia in the post-COVID era”.
Institutional Review Board Statement
Not applicable.
Informed Consent Statement
Not applicable.
Data Availability Statement
No new data were created or analyzed in this study. Data sharing is not applicable to this article.
Conflicts of Interest
The authors declare no conflicts of interest.
References
- Abbas, J., Mubeen, R., Iorember, P. T., Raza, S., & Mamirkulova, G. (2021). Exploring the impact of COVID-19 on tourism: Transformational potential and implications for a sustainable recovery of the travel and leisure industry. Current Research in Behavioral Sciences, 2, 100033. [Google Scholar] [CrossRef]
- Adekuajo, I., Fakeyede, O., Udeh, C., & Daraojimba, C. (2023). The digital evolution in hospitality: A global review and its potential transformative impact on U.S. tourism. International Journal of Applied Research in Social Sciences, 5, 440–462. [Google Scholar] [CrossRef]
- Adeleye, B. N. (2023). Re-examining the tourism-led growth nexus and the role of information and communication technology in East Asia and the Pacific. Heliyon, 9(1), e13505. [Google Scholar] [CrossRef]
- Agostinho, M. N., Dias, A., & Pereira, L. F. (2024). Tourism direct GDP: Configuration of antecedents and tourism future performance in high-income countries. Journal of Tourism Futures. [Google Scholar] [CrossRef]
- Allahverdi, M., Akandere, G., & Varol, F. (2025). Evaluation of the competitiveness and performance of destinations through clustering method within the scope of the travel and tourism development index. International Journal of Tourism Research, 27(5), e70122. [Google Scholar] [CrossRef]
- Almeida, F., Santos, J. D., & Monteiro, J. A. (2020). The challenges and opportunities in the digitalization of companies in a post-COVID-19 world. IEEE Engineering Management Review, 48(3), 97–103. [Google Scholar] [CrossRef]
- Amankwah-Amoah, J., Khan, Z., Wood, G., & Knight, G. (2021). COVID-19 and digitalization: The great acceleration. Journal of Business Research, 136, 602–611. [Google Scholar] [CrossRef] [PubMed]
- Andronic, E., & Untaru, E. N. (2025). Assessment of Romania’s tourism competitiveness: A strategic analysis using the Importance-Performance (IPA) and Competitive Importance-Performance Analysis (CIPA) frameworks. Administrative Sciences, 15(9), 358. [Google Scholar] [CrossRef]
- Astanakulov, O. (2022, December 15). Tourism 4.0: Opportunities for applying industry 4.0 technologies in tourism. 6th International Conference on Future Networks & Distributed Systems, ICFNDS ’22 (pp. 33–38), Tashkent, Uzbekistan. [Google Scholar] [CrossRef]
- Bassyiouny, M., & Wilkesmann, M. (2023). Going on workation—Is tourism research ready to take off? Exploring an emerging phenomenon of hybrid tourism. Tourism Management Perspectives, 46, 101096. [Google Scholar] [CrossRef]
- Baydeniz, E. (2024). Blockchain technology in tourism: Pionieering sustainable and collaborative travel experiences. Journal of Tourismology, 10(1), 1–12. [Google Scholar] [CrossRef]
- Bąk, A. (2016). Porządkowanie liniowe obiektów metodą Hellwiga i TOPSIS—Analiza porównawcza. Prace Naukowe Uniwersytetu Ekonomicznego We Wrocławiu, 426, 22–31. [Google Scholar] [CrossRef]
- Bu, N., Li, Y., Li, Y., Wang, K., Zhao, D., Jiao, X., & Li, T. (2025). How does live streaming affect tourists’ intention—A psychology theory perspective. Scientific Reports, 15, 2262. [Google Scholar] [CrossRef] [PubMed]
- Buhalis, D. (2000). Marketing the competitive destination of the future. Tourism Management, 21(1), 97–116. [Google Scholar] [CrossRef]
- Bulchand-Gidumal, J., Secin, E., O’Connor, P., & Buhalis, D. (2023). Artificial intelligence’s impact on hospitality and tourism marketing: Exploring key themes and addressing challenges. Current Issues in Tourism, 27(1), 2345–2362. [Google Scholar] [CrossRef]
- Castro, I. G., Ramos, F. E., Ganoza-Ubillús, L., Albán, L., Sandoval, R. J., & Juárez, M. C. (2025). Business competitiveness in the 21st century: Trends, challenges, and opportunities. Journal of Educational and Social Research, 15(2), 124. [Google Scholar] [CrossRef]
- Cordova-Buiza, F., & Perea, Y. (2024, March 18–19). The competitiveness of tourist destinations: A review of the scientific literature. International Conference on Tourism Research, Cape Town, South Africa. [Google Scholar] [CrossRef]
- Cronje, D. F., & Du Plessis, E. (2022). A review on tourism destination competitiveness. Journal of Hospitality and Tourism Management, 45(6), 256–265. [Google Scholar] [CrossRef]
- da Silva, A., de Almeida, I. D., Dionisio, A., Rabadao, C., & Capela, C. (2025). How digital technologies enhance competitiveness in manufacturing SMEs. Journal of Innovation and Entrepreneurship, 14, 103. [Google Scholar] [CrossRef]
- Demirciftci, T. (2024). Internet of Things (IoT) in the tourism industry. In C. Tanrisever, H. Pamukçu, & A. Sharma (Eds.), Future tourism trends volume 2 (Building the future of tourism) (pp. 49–58). Emerald Publishing Limited. [Google Scholar] [CrossRef]
- Dinh, T. H. H. (2023). Tourism competitiveness—International experience and les sons applied to Vietnam. International Journal of Economics, Commerce and Management, 11(10), 357–365. Available online: https://ijecm.co.uk/wp-content/uploads/2023/10/111022.pdf (accessed on 15 September 2024).
- Doğan, Y. (2025). Digitalization in the tourism sector and future trends. Tourist Destination, 2(2), 17–26. [Google Scholar] [CrossRef]
- Dwyer, L., & Kim, C. (2003). Destination competitiveness: Determinants and indicators. Current Issues in Tourism, 6(5), 369–414. [Google Scholar] [CrossRef]
- Evans, N. G. (2024). Strategic management for tourism, hospitality and events. Routledge. [Google Scholar]
- Feng, Q., Kot, S., Chaveesuk, S., & Chaiyasoonthorn, W. (2024). The impact of competitive strategy on enterprise performance: An empirical study of small and medium-sized manufacturing enterprises. Journal of International Studies, 17(3), 9–37. [Google Scholar] [CrossRef]
- Ghosh, S., & Bhattacharya, M. (2022). Analyzing the impact of COVID-19 on the financial performance of the hospitality and tourism industries: An ensemble MCDM approach in the Indian context. International Journal of Contemporary Hospitality Management, 34(8), 3113–3142. [Google Scholar] [CrossRef]
- Gooroochurn, N., & Sugiyarto, G. (2005). Competitiveness indicators in the travel and tourism industry. Tourism Economics, 11(1), 25–43. [Google Scholar] [CrossRef]
- Grassia, M. G., Marino, M., Mazza, R., Misuraca, M., Zavarrone, E., & Friel, M. (2024). Regional competitiveness: A structural-based topic analysis on recent literature. Social Indicators Research, 173, 83–108. [Google Scholar] [CrossRef]
- Hamid, R. A., Albahri, A. S., Alwan, J. K., Al-Gaysi, Z. T., Albahri, O. S., Zaidan, A. A., Alnoor, A., Alamoodi, A. H., & Zaidan, B. B. (2021). How smart is e-tourism? A systematic review of smart tourism recommendation system applying data management. Computer Science Review, 39, 100337. [Google Scholar] [CrossRef]
- Heeth, E. (2003). Towards a model to enhance destination competitiveness: A southern African perspective. Journal of Hospitality and Tourism Management, 10(2), 124–142. [Google Scholar]
- Hellwig, Z. (1968). Zastosowanie metody taksonomicznej do typologicznego podziału krajów ze względu na poziom ich rozwoju i strukturę wykwalifikowanych kadr. Przegląd Statystyczny, 15(4), 307–327. [Google Scholar]
- Hossain, M. K., Hamid, A., & Hanafiah, M. (2024). Tourism destination competitiveness from definitions to empirical evidence: A narrative review. Multidisciplinary Reviews, 8(5), 2025132. [Google Scholar] [CrossRef]
- Iwanicz-Drozdowska, M., & Nowak, A. K. (2024). Konkurencyjność sektora bankowego w Polsce na tle sektorów bankowych krajów UE. Studia i Prace Kolegium Zarządzania i Finansów, 198, 25–46. [Google Scholar] [CrossRef]
- Iwaniuk, E. (2020). Koncepcja inteligentnej turystyki (smart tourism). Studia Ekonomiczne. Zeszyty Naukowe Uniwersytetu Ekonomicznego w Katowicach, 391, 110–120. [Google Scholar]
- Jangam, B. P., Rath, B. N., & Ridhwan, M. M. (2023). Does global value chain integration enhance export competitiveness? Evidence from Indonesia’s industry-level analysis. Emerging Markets Finance and Trade, 60(7), 1578–1598. [Google Scholar] [CrossRef]
- Kim, Y. R., Liu, A., & Williams, A. (2021). Competitiveness in the visitor economy: A systematic literature review. Tourism Economics, 28(3), 817–842. [Google Scholar] [CrossRef]
- Kubickova, V., Harcsova, H., & Bruskova, B. (2025). Innovation potential and tourism development in the EU: The impact of digitalisation and research investment on tourism performance. Transformations in Business & Economics, 24(2), 421–438. [Google Scholar]
- Kusairi, S., Wong, Z. Y., Wahyuningtyas, R., & Sukemi, M. N. (2023). Impact of digitalisation and foreign direct investment on economic growth: Learning from developed countries. Journal of International Studies, 16(1), 98–111. [Google Scholar] [CrossRef]
- Lau, A. (2020). New technologies used in COVID-19 for business survival: Insights from the hotel sector in China. Information Technology and Tourism, 22(4), 497–504. [Google Scholar] [CrossRef]
- Malikah, A. (2021). Comparison of financial performance before and Turing COVID-19: Case study of hospitality business in Indonesia. Golden Ratio of Finance Management, 1(1), 51–60. [Google Scholar] [CrossRef]
- Maráková, V., Dyr, T., & Wolak-Tuzimek, A. (2016). Factors of tourism’s competitiveness in European union countries. E & M Ekonomie a Management, 19(3), 92–109. [Google Scholar] [CrossRef]
- Martínez-González, J. A., Díaz-Padilla, V. T., & Parra-López, E. (2021). Study of the tourism competitiveness model of the world economic forum using rasch’s mathematical model: The case of Portugal. Sustainability, 13(13), 7169. [Google Scholar] [CrossRef]
- Matkarimova, L., Oleinikova, L., Kozyk, V., Cherep, A., Kostyshina, T., & Mostenska, T. L. (2025). Ensuring competitiveness of the state economy based on the principles of its modernization. In N. Mansour, & L. M. Bujosa Vadell (Eds.), Green finance and energy transition. Contributions to finance and accounting (pp. 323–333). Springer. [Google Scholar] [CrossRef]
- Mazurek-Kusiak, A. (2020). Determinants of the selection of travel agencies on polish tourist services market. E&M Economics and Management, 23(1), 156–166. [Google Scholar] [CrossRef]
- Moghadasnian, S. (2024, March 8). Tourism 4.0 in Iran: Navigating the digital transformation for sustainable and inclusive growth. The 13th International Conference on Tourism, Culture and Art, Tbiliseli, Georgia. [Google Scholar]
- Murayama, T., Brown, G., Hallak, R., & Matsuoka, K. (2022). Tourism destination competitiveness: Analysis and strategy of the Miyagi Zaō Mountains area, Japan. Sustainability, 14, 9124. [Google Scholar] [CrossRef]
- Ordóñez, M., Gómez, A., Ruiz, M., Ortells, J., Niemi-Hugaerts, H., Juiz, C., Jara, A., & Butler, T. (2022). IoT technologies and applications in tourism and travel industries. In O. Vermesan, & J. Bacquet (Eds.), Internet of things—The call of the edge. River Publishers. [Google Scholar]
- Peceny, U. S., Urbančič, J., Mokorel, S., Kuralt, V., & Ilijaš, T. (2019). Tourism 4.0: Challenges in marketing a paradigm shift. Available online: https://www.intechopen.com/chapters/65836 (accessed on 17 September 2024).
- Pomianek, I. (2010). Poziom rozwoju społeczno-gospodarczego obszarów wiejskich województwa warmińsko-mazurskiego. Oeconomia, 9(3), 227–239. [Google Scholar]
- Porter, M. E. (1990). The competitive advantage of nations. The Free Press. [Google Scholar]
- Purwono, R., Esquivias, M. A., Sugiharti, L., & Rojas, O. (2024). Tourism destination performance and competitiveness: The impact on revenues, jobs, the economy, and growth. Journal of Tourism and Services, 15(28), 161–187. [Google Scholar] [CrossRef]
- Rashideh, W. (2020). Blockchain technology framework: Current and future perspectives for the tourism industry. Tourism Management, 80, 104125. [Google Scholar] [CrossRef]
- Rathore, V., Sangma, S., Vidhya, C. S., Hidangmayum, N., Naqvi, R., Wankasaki, L., Indira, R., & Magreya, A. H. (2023). Effect of COVID-19 on the profitability of the hospitality industry. SSRN Electronic Journal. [Google Scholar] [CrossRef]
- Rehman, S., Khan, S. N., Antohi, V. N., Bashir, S., Fareed, M., Fortea, C., & Cristian, N. P. (2024). Open innovation big data analytics and its influence on sustainable tourism development: A multi-dimensional assessment of economic, policy, and behavioral factors. Journal of Open Innovation: Technology, Market, and Complexity, 10(2), 100254. [Google Scholar] [CrossRef]
- Ręklewski, M. (2020). Statystyka opisowa. Teoria i przykłady. Redakcja Wydawnictwa Państwowej Uczelni Zawodowej we Wrocławku. [Google Scholar]
- Shriharsha, B. S. (2023). Role of social media in tourism marketing. International Journal of Creative Research Thoughts, 11(9), 84–92. [Google Scholar]
- Sompolska-Rzechuła, A. (2020). Zastosowanie liniowego porządkowania obiektów do oceny aktywności ekonomicznej ludności w ujęciu województw. Wiadomości Statystyczne, 65(3), 46–61. [Google Scholar] [CrossRef]
- Sousa, A. E., Cardoso, P., & Dias, F. (2024). The use of artificial intelligence systems in tourism and hospitality: The tourists’ perspective. Administrative Sciences, 14(8), 165. [Google Scholar] [CrossRef]
- Stocker, M., & Erdélyi, Á. (2024). The influence of perceived macro environment on the competitiveness of internationalized medium-sized and large enterprises. Administrative Sciences, 14(6), 116. [Google Scholar] [CrossRef]
- Stryzhak, O., Cibák, L., Sidak, M. M., & Yermachenko, V. (2024). Socio-economic development of tourist destinations: A cross-country analysis. Journal of Eastern European and Central Asian Research (JEECAR), 11(1), 79–96. [Google Scholar] [CrossRef]
- Sustacha, I., Baños-Pino, J. F., & Del Valle, E. (2023). The role of technology in enhancing the tourism experience in smart destinations: A meta-analysis. Journal of Destination Marketing & Management, 30, 100817. [Google Scholar] [CrossRef]
- Štilić, A., Puška, A., Božanić, D., & Durić, A. (2024). Ranking European countries using hybrid MEREC-MARCOS MCDA based on travel and tourism development index. Tourism, 72(4), 592–608. [Google Scholar] [CrossRef]
- Vašaničová, P. (2025). Urban networks and tourism development: Analyzing the relationship between Globalization and World Cities (GaWC) rankings and Travel and Tourism Development Index (TTDI). Urban Science, 9(3), 83. [Google Scholar] [CrossRef]
- Vaz, R., Carvalho, J., Teixeira, S., & Castanho, R. (2025). Smart tourism destination advances through qualitative research and further research avenues: A systematic literature review. Discover Sustainability, 6(1), 682. [Google Scholar] [CrossRef]
- Vena-Oya, J., Sabiote-Ortiz, C. M., Rodríguez-Molina, M. A., & Castañeda-García, J. A. (2025). Analysing how destinations reach sustainability through digitalisation: A semi-qualitative approach. European Planning Studies, 33(10), 1822. [Google Scholar] [CrossRef]
- Weng, P. W. P. (2019). Destination competitiveness: An antecedent or the result of destination brand equity? In R. Hashim, M. M. Hanafiah, & M. Jamaluddin (Eds.), Positioning and branding tourism destinations for global competitiveness (pp. 49–73). IGI Global. [Google Scholar] [CrossRef]
- World Economic Forum. (2022). Travel and tourism development index 2021. Rebuilding for sustainable and resilient future, insight report 2022. Available online: https://www3.weforum.org/docs/WEF_Travel_Tourism_Development_2021.pdf (accessed on 15 September 2024).
- Yallop, A., & Seraphin, H. (2020). Big data and analytics in tourism and hospitality: Opportunities and risks. Journal of Tourism Futures, 6(3), 257–262. [Google Scholar] [CrossRef]
- Zhou, L., Buhalis, D., Fan, D. X. F., Ladkin, A., & Lian, X. (2024). Attracting digital nomads: Smart destination strategies, innovation and competitiveness. Journal of Destination Marketing & Management, 31, 100850. [Google Scholar] [CrossRef]
- Zhu, Z., Hall, C. M., Li, Y., & Zhang, X. (2025). Exploring the impact of virtual reality on tourists’ pro-sustainable behaviors in heritage tourism. Sustainability, 17(14), 6278. [Google Scholar] [CrossRef]
Disclaimer/Publisher’s Note: The statements, opinions and data contained in all publications are solely those of the individual author(s) and contributor(s) and not of MDPI and/or the editor(s). MDPI and/or the editor(s) disclaim responsibility for any injury to people or property resulting from any ideas, methods, instructions or products referred to in the content. |
© 2025 by the authors. Licensee MDPI, Basel, Switzerland. This article is an open access article distributed under the terms and conditions of the Creative Commons Attribution (CC BY) license (https://creativecommons.org/licenses/by/4.0/).