Abstract
Various corporate groups, such as third-sector institutions in Latin America, have shown increasing interest in evaluating organizational performance as a possible strategy for increasing their effectiveness and competitiveness. From this perspective, this study analyzes the psychometric properties of a scale that assesses organizational performance in third-sector institutions in Latin America. The design was instrumental. The sample consisted of 355 workers from nine Latin American countries, recruited through non-probability sampling. A validity and reliability analysis of the scale confirmed the items and original factors. In this sense, the accessibility and use of a brief and useful tool for measuring organizational performance enriches knowledge about organizational theory by facilitating the comparison and validation of existing approaches or even by suggesting new dimensions that reflect the dynamic complexity of current organizations in Latin America.
1. Introduction
The performance of organizations refers to the achievement of a goal, visibility of the efficiency of human resources, the organization, and the positive response of the environment where it operates (; ; ); this is evaluated by the objectives it meets, by the optimization of the resources it uses, and how it responds to market demand (; ; ). This performance is fundamentally based on the role of the employees, since it is up to them to ensure the growth of the company, which indicates the dependence on the ability of managers to take measures and face changes that can guarantee sustainability and correct organizational performance (). Faced with this magnitude, it has been identified that organizational performance is and continues to be a topic studied by many researchers (; ; ); they agree that improving the ability of an organization to adapt to changes is a primary element to achieve success and the expected performance in a company or organization (; ). This indicates the significant dependence placed on the achievement and progress of the strategy applied, which would allow for the fulfillment of an institution’s objectives; these are the same ones centered on leading an organization to success (; ). Thus, () suggest the development of an organization’s capabilities in order to maintain a highly competitive advantage.
Now, considering that companies are exposed to constant competition, product innovation, and digital services, it is important that these are aligned with market trends, which go hand in hand with the expectations of the consumer and/or the parties interested (; ); for this purpose, companies must ensure their performance, taking into account various factors such as digitization, knowledge management, digital services, project management, business intelligence, and even ensuring the establishment of agile and effective leaders (; ; ). In this sense, the adoption of a comprehensive strategy that addresses the management of human resources, technology, and the environment would lead to anticipating a market need that, by responding proactively, would lead to high organizational performance. As shown in these previous studies, measuring organizational performance does not depend solely on financial aspects; contrary to this, research supports the intervention of non-financial aspects as an appropriate complement to diagnose the performance of organizations (; ).
Other factors could contribute to good organizational performance; according to recent studies (; ), another strategy that supports organizational performance is the management of digital human resources, with this referring to the synergy that is created between human resources and information technologies. This interconnection facilitates the optimization of processes, opening up a flexible and efficient work environment that generates productivity and innovation in a competitive environment; thus, organizations are called to reconsider human resources as a workforce that, supported by technology, can transform the destiny of an organization (; ; ).
Using a scale that helps assess organizational performance is essential in management, as it allows for the systematic and objective measurement of important elements such as operational effectiveness, strategic success, the capacity to adapt to the context, and the achievement of institutional objectives. This tool would not only help make informed decisions and develop continuous improvement plans, but it would also provide academic value by offering concrete data that can be examined from different theoretical perspectives. Thus, the use of well-designed scales enriches knowledge of organizational theory by facilitating the comparison and validation of existing approaches or even by suggesting new dimensions that reflect the dynamic complexity of today’s organizations (; ; ).
Although organizational performance is a highly studied variable, few studies have focused on measuring it by applying it to third-sector institutions in Latin America. Given that this is the case and, taking into account the fact that the literature establishes that these companies must act with agility in order to achieve significant growth opportunities (), it is important for these organizations to achieve good organizational performance since their impact goes far beyond economic benefits; it reaches the well-being of society and the environment. Therefore, achieving good performance would mean maximizing resources and attracting greater financing, which would cause positive changes in society; therefore, diagnosing the level of organizational performance becomes a fundamental action that would allow for the identification of areas of improvement and for informed decisions to be made.
Considering the aforementioned background, a review of the literature on this topic in third-sector organizations found few empirical studies that have documented the interest in further exploring the topic among leaders in human talent management, organizational behavior, and academics in this area of knowledge. Bibliometric indicators reveal the ten countries that most disseminate their scientific results, including the United States, China, the United Kingdom, Spain, Taiwan, Australia, Canada, Croatia, Iran, and Albania. These countries have primarily applied their studies to diverse areas, sectors, and populations, such as business, management and accounting, the social sciences, and economics, econometrics, and finance. However, when analyzing scientific dissemination in Latin American countries, no previous studies were found that would allow for a more complete analysis of its behavior in this context (except for Brazil). There is a lack of validated scales for third-sector organizations in Latin America, which represents one of the main reasons for conducting this study.
For this reason, the objective of this study was to analyze the psychometric properties of a scale that assesses organizational performance in third-sector institutions in Latin America. Thus, the research question guiding this work is as follows: does the Organizational Performance Scale present adequate psychometric evidence of validity for application in third-sector institutions in the Latin American context?
2. Literature Review
2.1. Organizational Performance
With the emergence of Strategy Theory (), and later with Taylor’s position in 1911 on proposing scientific or engineering methods to measure the growth of a company through financial indicators (), performance has become a widely studied concept in the organizational literature (; ). Subsequently, the need for more appropriate methods to evaluate performance was noted. In this regard, () stated that every organization has work it must perform in the real world, and it needs to measure, in some way, whether that work is being performed effectively. This gave rise to the inclusion of non-financial measures to evaluate organizational development. In the late 1960s and 1970s, new methods of performance evaluation were discovered that focused on non-financial indicators, while their understanding focused on organizational capabilities aimed at taking advantage of the environment to achieve and use them (; ).
Organizational performance is defined by focusing on effectiveness and efficiency, that is, maintaining the idea that an organization must meet its goals with an acceptable expenditure of resources (). There is a need for evaluating organizational performance in the literature of organizational leadership, marketing, and management, with these being the main objects of extensive empirical research (). This is because the performance of an organization can largely determine the economic indicators important to the sector (; ).
On the other hand, the strategic adoption of information technologies, such as Wi-Fi wireless networks, has become an essential element that can improve organizational performance. Empirical studies have shown that the use of Wi-Fi in the workplace has a positive impact on productivity, innovation, and job satisfaction by enabling mobility, teamwork, and constant access to digital resources (), suggesting increased efficiency, transparency, and sustainability (). The integration of these observations indicates that the combination of technological connectivity and organizational processes represents a vital synergy for achieving sustainable organizational performance in the digital age.
Better organizational performance is important to a wide range of stakeholders, especially shareholders, as it helps increase company value and provides a basis for dividend distribution, thereby attracting investors (). The theoretical model used in this study considers this construct from financial and non-financial performance (). To obtain a complete diagnosis of organizational performance, regardless of an organization’s monetary evaluation, it is necessary to address other non-financial elements such as satisfaction, quality, and social impact. To support this idea, the scientific literature has shown that non-financial performance is a crucial factor for the sustainability and success of organizations (). Other recent studies also support the findings of this research, pointing out that intangible investments, such as environmental management and positive social impact, are a way to attract and retain stakeholders and represent significant value. Therefore, it would be advisable to find the ideal balance between financial and non-financial performance to achieve good organizational performance.
On the other hand, donation growth constitutes a valid and widely recognized non-financial indicator in the evaluation of organizational performance for non-profit organizations. This variable reflects not only the organization’s financial sustainability but also the level of trust, legitimacy, and perceived value of donors and other stakeholders (; ; ). Authors such as () have pointed out that, in contexts where benefits are not economic, it is necessary to incorporate non-financial indicators, such as fundraising, to evaluate strategic effectiveness. Likewise, studies such as those by () have validated performance scales that explicitly include increased donations as a key dimension. Furthermore, indicators related to externally obtained resources reflect institutional success in terms of social outreach and reputation. In this sense, increased donations are not only a relevant operational result but also an indirect indicator of the alignment between the organization’s mission and the community’s positive perception of its impact (). The donation growth indicator has been included in a validated non-financial performance scale, along with other elements such as social image and work environment, reinforcing its usefulness in capturing results that do not translate directly into revenue but are strategically relevant to institutional sustainability ().
2.2. Scales to Evaluate Organizational Performance
When reviewing the diversity of proposed definitions, important scientific studies have found that factors such as morale (), innovation (; ), staff turnover (), adaptability (), and the direction of change () impact organizational performance.
Most of what has been published on this topic has been in the form of books and (non-scientific) journals, and, until now, there has been little scholarly input from primary sources. In this sense, a review of previous research confirms the importance of providing valid instruments that can measure organizational performance in a third-sector context. These measurement instruments must comply with valid psychometric properties to be used in different realities. However, it is important to note that organizational performance is a concept that lacks scientific support in research that uses quantitative methods in Latin America and the world. Below is an overview of measurement scales published in high-impact journals.
In their study in Australia, () proposed the Stakeholder-Based Performance (SBP) scale based on the theoretical approach of (), which consisted of four items. This scale was unidimensional and was aimed at workers who fulfilled the functions of executive directors. The instrument had a Cronbach’s Alpha of 0.761. It used a 7-point Likert-type response format ranging from 1 (“Extremely bad”) to 7 (“Extremely good”).
In India, () built a scale to measure Sustainable Organizational Performance (SOP). This scale was aimed at department heads. The 13-item Costa had three dimensions: (a) economic development (example item: “Develop useful strategies for on-time delivery of products”), (b) environmental development (example item: “Recycling solid waste to reduce terrestrial emissions”), and (c) social development (example item: “Provides professional development opportunities to reduce turnover intentions”). The instrument had a Cronbach’s Alpha of 0.82. It used a 5-point Likert-type response format ranging from 1 (“Strongly disagree”) to 5 (“Strongly agree”).
In Portugal, (), based on other scales, designed a unidimensional scale to measure financial and non-financial aspects in the environment of non-profit entities. It consisted of four items (example item: “Level of competence of employees”) and was aimed at senior managers (executive director, president, administrator). The instrument had a Cronbach’s Alpha of 0.82. It used a 5-point Likert-type response format ranging from 1 (“Very poor performance”) to 5 (“Excellent performance”).
In Italy, () proposed a unidimensional scale of four indicators: Service quality, Service innovation, Technological innovation, and Organizational innovation. Initially, this metric was aimed at salaried employees, volunteers, and managers. The instrument assessed internal consistency through Cronbach’s Alpha (0.77) and used a 5-point Likert-type response format.
In Bolivia, () designed and validated a metric to evaluate organizational performance. This scale was aimed at managers or owners. It consisted of 15 items divided into three dimensions: (i) economic development by sale of services (an example item was “Our profitability has been better than last year”), (ii) comparative economic development (an example item was “Our profit last year has been better compared to that of our main competitor”), and (iii) social and environmental performance (an example item was “We have alliances with social organizations”). The instrument assessed internal consistency through Cronbach’s Alpha (0.859) and used a 5-point Likert-type response format ranging from 1 (“Strongly disagree”) to 5 (“Strongly agree”).
Finally, in South Africa, () designed and validated the Organizational Performance Questionnaire (OPQ) based on the Burke–Litwin model. This scale was aimed at employees of various public- and private-sector organizations. It consisted of 67 items divided into 12 dimensions (an example item was “My organization periodically updates its policies and procedures”): management practices, systems, individual and organizational performance, leadership, culture, motivation, external environment, skills/job fit, climate, mission and strategy, structure, individual needs, and values. The instrument had a Cronbach’s Alpha of 0.859 and used a 5-point Likert-type response format ranging from 1 (“Strongly Disagree”) to 5 (“Strongly Agree”).
Based on this, the following general hypothesis is proposed:
The Organizational Performance Scale presents valid and appropriate psychometric evidence for its application in third-sector institutions in Latin America.
3. Materials and Methods
3.1. Study Design and Participants
The design of this study was instrumental (). The population group consisted of Adventist Development and Relief Agency (ADRA) workers from nine Latin American countries (Ecuador, Peru, Brazil, Chile, Venezuela, Mexico, Colombia, Paraguay, and Argentina). ADRA is considered the international humanitarian extension of the Seventh-day Adventist Church, part of an Adventist community with 23.6 million members, and the most extensive network in healthcare and education worldwide. It provides development aid and support to people in more than 118 countries, regardless of ethnicity, political leanings, gender, or religious beliefs. By collaborating with communities, organizations, and local authorities, it implements culturally relevant programs and promotes local capacity building to achieve sustainable change ().
In addition, to be included in this study, all participants had to meet specific criteria, such as being of legal age (minimum 18 years old), being an ADRA employee, and having worked for more than one year in technical roles in management, administration, and project execution. Before data collection, through a request, the managers gave their consent for this study. To select the participants, non-probabilistic convenience sampling was applied (), choosing volunteer workers willing to participate in this research. After informing the participants about the anonymity of the research and obtaining their informed consent, they proceeded to fill out the questionnaire. A total of 355 workers participated, aged between 19 and 68 years (M = 34.85 and SD = 9.48). The majority of the participants were women (60.8%), with an age range of 19 to 30 years (45.4%), who worked in Ecuador (42.8%), undertaking technical work (62.8%), and with no more than 5 years of experience (79.2%) (Table 1).

Table 1.
Sociodemographic characteristics of the study sample (n = 355).
3.2. Procedure
This study underwent a review and approval process prior to data collection. It was first approved by the Ethics Committee of a Peruvian university (2023-CE-EPG-00058). The online survey was disseminated during the first five months of 2024, and participants who met the inclusion criteria were invited to participate via a Google Form. All of these procedures followed confidentiality regulations and the principles of the Declaration of Helsinki (; ). Participants were fully informed about the purpose of the research, and informed consent was obtained from each participant before completing the survey.
3.3. Measurement Scales and Back-Translation
An online questionnaire was organized into three parts: the first section contained instructions for completion and informed consent from participants, the second section covered sociodemographic variables, and the last section included the assessment scales. All of these were translated from English. Before the application, these underwent a semantic validation process with the inclusion of 6 workers who met the profile of the participants, ensuring that the items were understandable in the context of each country.
A short 2-factor instrument was used (Table 2), which consisted of 4 items for financial performance (FP) and 4 items for non-financial performance (NFP) (). To respond to the items, a 5-point Likert-type scale was used, ranging from 1 (“very poor performance”) to 5 (“excellent performance”). The internal consistency was excellent (α = 0.841 to 0.919).
Table 2.
Scale to evaluate organizational performance (Spanish and English).
As part of a methodological procedure, the original English text was translated into Spanish through back-translation. Two bilingual translators independently completed the translation from English to Spanish. Additionally, in a focus group session, six participants from Latin American third-sector organizations who met the study’s inclusion criteria reviewed, vetted, and adjusted the translations to create a more appropriate Spanish version of the questionnaire. A native speaker also translated the questionnaire from Spanish to Portuguese, which was reviewed by a subject matter expert to ensure clarity before being sent to the study participants.
3.4. Data Analysis
Regarding the data analysis procedure, two statistical packages were used: The first was SPSS version 25, which was used to analyze the sociodemographic data of the study sample descriptively and to perform Exploratory Factor Analysis (EFA). Covariance structural equation modeling (CB-SEM) was then used for Confirmatory Factor Analysis (CFA) and to assess both convergent and discriminant reliability and the fit of the measurement model. This required AMOS version 24 software. This approach is highly recommended for analyzing the psychometric properties of measurement models ().
3.5. Research Methods Used
To ensure scientific rigor and proper methodological support, this study employed a variety of research methods, with each applied individually to each phase of the research process. Following the methodological recommendations of (), analytical methods were used to break down the organizational performance construct into its constituent dimensions and to examine the statistical data in detail, as follows: synthesis to provide coherence between the findings of different international studies; deduction to establish logical connections between general organizational theory and the theory of the specific context of the third sector in Latin America; comparison to contrast different existing measurement instruments and validate the superiority of the proposed model; and induction to gain new insights into the characteristics of organizational performance based on patterns in the data from the 355 workers in the nine Latin American countries. This multi-method approach ensured the scientific rigor of the study. It offered us a range of alternatives to address the complexity of the concept of organizational performance adopted for research in third-sector institutions in Latin America.
4. Results
Table 3 describes the descriptive statistical results for each item on the measurement scale, such as the mean, standard deviation, skewness, and kurtosis. It is observed that all skewness and kurtosis values are less than ±1.5 (), which allows the assumption of normality to be met.
Table 3.
Descriptive analysis of the items (n = 355).
4.1. Exploratory and Confirmatory Factor Analysis
4.1.1. Exploratory Factor Analysis
Table 4 describes the Exploratory Factor Analysis (EFA) of each item on the measurement scale, which shows that the items are grouped into two categories based on the observed variable. Furthermore, a notable difference is observed between the two factors. On the other hand, the results of the Kaiser–Meyer–Olkin (KMO) and Bartlett tests indicate a sampling adequacy of 0.8845, which is greater than 0.70, suggesting a high level of significance. The Bartlett test (Sig. = 0.000) was highly significant, allowing for factor analysis. The total variance explained in the model was 74.700%, higher than 50%, with financial performance (FP) = 59.965% and non-financial performance (NFP) = 14.735%. In this sense, it is shown that all the items were grouped according to their initial dimensions. Then, we proceeded with the Confirmatory Factor Analysis (CFA).
Table 4.
Exploratory Factor Analysis (EFA) pattern matrix: own elaboration.
A comprehensive Confirmatory Factor Analysis (CFA) was then conducted to validate the factor structure obtained previously in the Exploratory Factor Analysis (EFA) and to analyze the psychometric properties of the measurement model, including convergent and discriminant validity.
4.1.2. Confirmatory Factor Analysis and Model Fit
The validation of the final measurement model with convergent reliability and validity is demonstrated in Table 5. In addition, it is observed that the values of Cronbach’s Alpha (α), 0.841 and 0.919, are satisfactory since, for the model to be considered at an adequate level, all values must be above 0.70 (). Likewise, the composite reliability (CR) values were favorable (0.849 and 0.915) since, for the model to be considered optimal, the values should be above 0.60 (). On the other hand, the values of AVE (0.590 and 0.730) were optimal since, in order to have acceptable values for this indicator, they should be equal to or greater than 0.50 (). This means that the measurement model meets all the indicators of reliability and convergent validity.
Table 5.
Validation of the final measurement model with convergent reliability and validity.
Figure 1 shows the factor structure of the scale to evaluate organizational performance in third-sector institutions in Latin America.
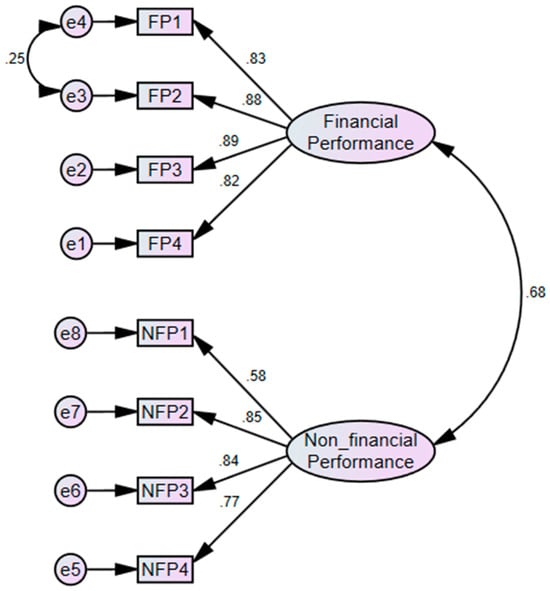
Figure 1.
Factor structure of the scale to evaluate organizational performance.
Table 6 presents the fit indicators for the scale measurement model that assesses organizational performance. According to the findings of the Confirmatory Factor Analysis (CFA), in which a two-dimensional structure was used where eight elements explained the two factors (Model 1), it was noted that not all adjustments were optimal; in this sense, the model was respecified using the modification index (MI) according to (). In this context, a correlation was identified between errors e3 and e4, related to elements FP2 and FP1, due to their similar formulation. Therefore, an adjustment to the model was made, which gave rise to Model 2, which achieved fit indices that were excellent and acceptable.
Table 6.
Statistical scale goodness-of-fit indices to evaluate knowledge management.
Table 7 details the application of the Fornell–Larcker criterion to analyze the discriminant validity of the model (), which implies that the square root of the AVE of each of the factors was calculated. This root had to be greater than the highest correlation between the factors in the measurement model (). All highlighted diagonal values are greater than the correlations. Furthermore, this research considered the Heterotrait–Monotrait (HTMT) criterion proposed by (), which states that if the HTMT value is below 0.90, it establishes that there is discriminant validity between two reflective constructs. In this sense, Table 7 indicates that the correlation presents a value of 0.691, which is less than 0.90. With these findings, the discriminant validity of the model is confirmed.
Table 7.
Discriminant validity.
5. Discussion
The objective of this study was to analyze the psychometric properties of a scale that assesses organizational performance in third-sector institutions in Latin America. This study was developed in the context of non-profit organizations in Latin America. This sector is undergoing significant transformation as a result of the environmental, social, political, and economic changes taking place in Europe and Latin America (). During the late 1960s and early 1970s, both government entities and non-profit organizations began to explore new ways of understanding their performance, moving beyond conventional perspectives that focused solely on personnel, processes, and structure. In this sense, previous research focused on non-profit institutions has focused its interest on analyzing this construct from its relationship with the governance of corporate foundations (), the composition and structure of the board of directors (), volunteerism (), and organizational effectiveness (), in addition to its association between the board of directors () and with the strategic management of the public and private sectors (). This is especially relevant in the field of non-profit community and human service organizations, which face constant changes and transitions.
In this sense, to address the primary objective of the study, data were collected from nine countries. One of the procedures for achieving this objective was the back-translation of the selected instrument, which was initially in English. After semantic validation and its application to the study population, the result was a highly reliable instrument that diagnoses organizational performance in third-sector institutions. This diagnosis is an important element for assessing opportunities for improvement in the efficiency and effectiveness of operations and for strategic decision-making that promotes good organizational performance.
According to the findings, the distribution of two factors to measure organizational performance is evident: financial performance and non-financial performance. This means that, to have a complete diagnosis of organizational performance, independently of evaluating an organization in monetary terms, the results establish that other non-financial elements such as satisfaction, quality, and social impact must also be addressed; to support this idea, it has been found in the scientific literature that non-financial performance is a crucial factor that leads to the sustainability and success of organizations (). Other recent studies also support the findings of this research, that intangible investment such as caring for the environment and having a positive social impact is a way to attract and retain interest groups and holds significant value. This is why it would be advisable to find the ideal balance between financial and non-financial performance in order to obtain good organizational performance as a result (; ).
Furthermore, other research consistent with this study’s results establishes that non-financial performance has a special customer orientation, generating a scenario where decisions are related to the customer and production terms. Sales and profitability become a result of non-financial performance (). Under this same context, organizational performance can be measured from economic and non-economic aspects (; ), and although these are applied in different ways, they maintain a highly significant contribution to companies or organizations—contributions that represent sustainability and a stable economy for the company (; ).
The validation of the Organizational Performance Scale for third-sector institutions in Latin America represents a relevant contribution to the field, especially when compared to other instruments developed in different geographic and sectoral contexts. Compared to the unidimensional Stakeholder-Based Performance (SBP) Scale by () in Australia, which was aimed at executive directors and focused specifically on stakeholder outcomes, the present study incorporates financial and non-financial dimensions, capturing a more holistic perspective of organizational performance. Similarly, () scale to measure Sustainable Organizational Performance (SOP) in India addressed economic, environmental, and social development; its 13-item structure contrasts with the streamlined and concise 8-item structural model, which enhances simplicity without compromising psychometric robustness. Furthermore, () offered a brief unidimensional scale for nonprofit organizations in Portugal; however, the present study demonstrated superior internal consistency (α > 0.90) and broader applicability in Latin America.
Additionally, compared to the innovation-focused scale of () in Italy or the multidimensional proposal of () in Bolivia, the present scale strikes a balance between conceptual comprehensiveness and statistical economy. Unlike () extensive 67-item Organizational Performance Questionnaire (OPQ), based on the Burke–Litwin model in South Africa, which may be impractical for routine use in resource-limited, third-sector contexts, the present study offers a viable alternative with demonstrated validity and reliability. That is, it is considered reliable when it is error-free, and it is considered valid when the instrument is capable of measuring the construct to be quantified. This statement is made after reviewing the methodological background that has become a substantial resource when evaluating the psychometric properties of a scale (; ; ). Therefore, the present findings support the adaptability and utility of a simplified, yet theoretically grounded, instrument for assessing performance in diverse nonprofit settings. These comparisons reinforce the added value of this study for advancing organizational theory in culturally and operationally heterogeneous Latin American environments.
5.1. Theoretical and Practical Implications
The theoretical implications of this study consider the proposal of a theoretical model that focuses on organizational performance from two main dimensions: financial and non-financial performance. This duality is essential for a complete diagnosis and to identify areas of improvement that promote efficiency and effectiveness in the operations and strategic decisions of organizations (). Organizational performance has evolved from being evaluated primarily through financial indicators (Porter’s strategy theory and Taylor’s scientific methods) to being evaluated by non-financial indicators. This evolution reflects a more comprehensive understanding of organizational performance, which includes factors such as morale, innovativeness, adaptability, social and environmental impact, customer satisfaction, and service quality (; ; ). These factors not only complement financial indicators but may also be more relevant in specific contexts, especially in the third sector (; ).
Some managerial implications could focus on developing a synergy between technology and the human factor, considered essential to optimize processes and promote an efficient and flexible work environment. The human factor becomes a transformative workforce when supported by advanced technology (; ). The context of non-profit organizations is believed to be no exception to this need, and it has become a greater challenge for some countries in the region. Furthermore, this study provides a solid platform for designing proposals and actions (strategic and operational) that senior management of third-sector organizations should consider in order to improve organizational performance and effectively achieve their objectives, starting with the implementation of measurement systems that capture both financial and non-financial performance. This may require new assessment tools and staff training in their use.
Some social implications arising from this study lie in the implementation of new policies and practices that promote non-financial performance in third-sector institutions in Latin America, such as environmental sustainability and positive social impact. This could include the adoption of recycling practices, the efficient use of resources, and the creation of Corporate Social Responsibility programs. The application of social innovation proposes investing in digital technologies and knowledge management systems that optimize processes and promote innovation. It also proposes the development of leadership training programs focused on change management, agile leadership, and strategic decision-making contextualized for this particular sector.
The managerial and practical implications are also closely linked to third-sector organizations in Latin America, as this validated scale allows for a reliable and agile assessment of organizational performance in its financial and non-financial dimensions. These types of tools are essential to support informed decision-making (strategic and operational) based on empirical evidence, as this would improve institutional functioning. Furthermore, the application of this scale facilitates continuous improvement processes, transparency, and accountability to funders and stakeholders, which is key in contexts where greater legitimacy and efficiency are demanded of nonprofit organizations. In this sense, the application of this metric could be an ally for professionals in the relevant field to reevaluate the allocation of resources to the areas or departments with the lowest performance. Furthermore, based on the organizational results of this metric, the implementation of leadership or operational management training programs could be justified, or the review of internal policies aimed at specific improvements based on the organization’s strategic objectives could be supported ().
5.2. Limitations and Future Research
Every scientific study has limitations that could affect the generalizability of its results. This study evaluated data collected from 355 employees across nine ADRA offices in Latin America, which may not apply to contexts in other regions. Future research could expand the geographic scope of the scale to diverse cultural, social, and economic settings. Furthermore, future research could evaluate the applicability and adaptation of the scale to other sectors, considering private and/or public management. This study focuses on two dimensions of organizational performance: financial and non-financial. While these dimensions are important and have been broadly substantiated, other relevant aspects such as operational efficiency, stakeholder engagement, and innovation could also contribute to a more comprehensive understanding of performance. Future research could explore and validate additional dimensions, as well as examine the influence of contextual factors such as changes in government policies, economic crises, or natural disasters. Furthermore, this study primarily used quantitative methods for its development, which could limit the exploration of subjective, emotional, or cultural phenomena within third-sector institutions. Future research could include qualitative methodologies for a deeper and more holistic understanding of organizational performance.
Furthermore, while the scale demonstrated strong internal validity and reliability within the studied sample, its practical application and adaptability to different types of organizations and sectors have yet to be fully explored. Future research is needed to clarify how this scale can support managers in strategic decision-making, performance improvement, and organizational policy development. Furthermore, including external validation is critical to ensure the generalizability and practical relevance of the research findings. While internal validity confirms that an instrument reliably measures constructs in a specific context, external validation demonstrates its applicability to different populations, types of organizations, and cultural settings (; ). Cross-cultural validation of this scale for diverse geographical and cultural contexts would be crucial to establish its universality and identify boundary conditions, cultural variations, and sectoral factors that may influence the instrument’s performance, thereby facilitating its refinement and wider adoption (). Therefore, future research should prioritize periodic evaluation of the scale in diverse settings to confirm its robustness and enhance its value as a universally practical tool for strategic decision-making in different organizational contexts.
On the other hand, another limitation was the lack of dynamic analysis to explore the predictive validity of the Organizational Performance Scale. While the psychometric properties of the analyzed instrument are robust, further research is needed to assess the extent to which organizational performance, as measured by the scale, can predict future organizational outcomes. In this regard, it is believed that future longitudinal studies could examine whether higher performance scores are associated with increased beneficiaries, fundraising, or other third-sector-focused components. Furthermore, future research should incorporate time-series data or predictive modeling approaches to validate the scale’s predictive potential in real-life organizational contexts.
6. Conclusions
The main objective of this study was to analyze the psychometric properties of a scale that assesses organizational performance in third-sector institutions in Latin America. This metric provides academia with a completely reliable, adaptable, and practical resource for use by experts and academics in this field of study. In this context, having a tool that assesses organizational performance is essential, as it offers a legitimate resource that can be implemented as part of a strategy to increase organizational effectiveness and competitiveness. It can also be of great help in optimizing an organization’s financial and non-financial performance indicators, seeking to support brand positioning and image.
In this sense, the validity and reliability analysis of the scale confirmed the eight items and two original factors (financial performance and non-financial performance). The KMO test reached a high level (0.884 > 0.70), and the Bartlett test reached a highly significant level (Sig. = 0.000). The scale also showed good internal consistency (α = 0.841 to 0.919; CR = 0.85 to 0.92; AVE = 0.592 to 0.743). Similarly, for the Confirmatory Factor Analysis, a measurement adjustment was carried out, obtaining excellent and acceptable fit indices for Model 2 (CMIN/DF = 3.223; CFI = 0.979; SRMR = 0.043; RMSEA = 0.079; Pclose = 0.017). Thus, the scale demonstrated robust psychometric properties through a comprehensive validation that included Exploratory Factor Analysis, Confirmatory Factor Analysis, and convergent and discriminant validity assessments.
The use of a brief and useful tool to measure organizational performance enriches knowledge about organizational theory by facilitating the comparison and validation of existing approaches or even by suggesting new dimensions that reflect the dynamic complexity of current organizations in Latin America. This study has been considered a relevant contribution to senior management and related sectors within the business environment, specifically within the framework of third-sector organizations in Latin America.
Author Contributions
Conceptualization, R.A.B.-C. and E.E.G.-S.; methodology, E.E.G.-S. and M.V.-G.; software, E.E.G.-S.; validation, E.E.G.-S. and M.V.-G.; formal analysis, E.E.G.-S.; investigation, E.E.G.-S. and M.V.-G.; resources, R.A.B.-C.; data curation, E.E.G.-S.; writing—original draft preparation, R.A.B.-C., E.E.G.-S. and M.V.-G.; writing—review and editing, R.A.B.-C., E.E.G.-S. and M.V.-G.; visualization, R.A.B.-C.; supervision, E.E.G.-S. and M.V.-G.; project administration, E.E.G.-S. and M.V.-G.; funding acquisition E.E.G.-S. and M.V.-G. All authors have read and agreed to the published version of the manuscript.
Funding
The Article Processing Charges (APC) was funded by “Universidad Peruana Unión” and “Universidad Autónoma del Perú”.
Institutional Review Board Statement
This study had the approval of the ethics committee of the Graduate School of the Universidad Peruana Unión at the time our project was approved. It should be noted that this manuscript is part of the results of a research project that has been approved and has the code number 2023-CE-EPG-00058.
Informed Consent Statement
Informed consent was obtained from all subjects involved in the study.
Data Availability Statement
Data availability can be requested by writing to the corresponding author of this publication.
Conflicts of Interest
The authors declare no conflicts of interest.
References
- ADRA. (2025). Adventist development and relief agency. Available online: https://adra.org/about-adra (accessed on 13 January 2025).
- Agbo, A. A. (2010). Cronbach’s alpha: Review of limitations and associated recommendations. Journal of Psychology in Africa, 20(2), 233–239. [Google Scholar] [CrossRef]
- Alharbi, G. L., & Aloud, M. E. (2024). The effects of knowledge management processes on service sector performance: Evidence from Saudi Arabia. Humanities and Social Sciences Communications, 11(1), 378. [Google Scholar] [CrossRef]
- Alhawamdeh, H., Hijazi, H. A., Fraihat, B. A. M., Alhawamdeh, A. M., Shiyyab, F. S., & Al-Okaily, M. (2024). The effect of knowledge management on organizational performance in the service sector: The role of transformational leadership as the moderating. Uncertain Supply Chain Management, 12(3), 2031–2040. [Google Scholar] [CrossRef]
- Al Rashdi, M., Akmal, S., & Al-Shami, S. (2019). Knowledge management and organizational performance: A research on systematic literature. International Journal of Innovative Technology and Exploring Engineering, 8(6S4), 757–762. [Google Scholar] [CrossRef]
- Alzghoul, A., Khaddam, A., Abousweilem, F., Irtaimeh, H., & Alshaar, Q. (2024). How business intelligence capability impacts decision-making speed, comprehensiveness, and firm performance. Information Development, 40(2), 220–233. [Google Scholar] [CrossRef]
- Ato, M., López, J. J., & Benavente, A. (2013). Un sistema de clasificación de los diseños de investigación en psicología. Anales de Psicologia, 29(3), 1038–1059. [Google Scholar] [CrossRef]
- Bagozzi, R. R., & Yi, Y. (1988). On the evaluation of structural equation models. Journal of Academy of Marketing Science, 16(1), 74–94. [Google Scholar] [CrossRef]
- Bano, A., Khatun, A., & Kumar, D. (2024). Employee-engagement level as a predictor of organizational performance: A study of information technology companies in Telangana-India. In Communications in computer and information science: Vol. 2198 CCIS. Springer Science and Business Media Deutschland GmbH. [Google Scholar] [CrossRef]
- Barberan, N., Bastidas, T., & Herrera, C. (2024). Estilos de liderazgo en el rendimiento financiero y no financiero de las microempresas. Revista Venezolana de Gerencia, 29(106), 730–744. [Google Scholar] [CrossRef]
- Barradas, M. d. R., Rodríguez, J., & Maya, I. (2021). Desempeño organizacional. Una revisión teórica de sus dimensiones y forma de medición. RECAI Revista de Estudios En Contaduría, Administración e Informática, 10(28), 1–21. [Google Scholar] [CrossRef]
- Baruch, Y., & Ramalho, N. (2006). Communalities and distinctions in the measurement of organizational performance and effectiveness across for-profit and nonprofit sectors. Nonprofit and Voluntary Sector Quarterly, 35(1), 39–65. [Google Scholar] [CrossRef]
- Bebbington, J., & Unerman, J. (2018). Achieving the United Nations Sustainable Development Goals: An enabling role for accounting research. Accounting, Auditing & Accountability Journal, 31(1), 2–24. [Google Scholar] [CrossRef]
- Bentler, P. M. (2006). EQS 6 structural equations program manual: Vol. I. Multivariate Software. [Google Scholar]
- Boxall, P., & Purcell, J. (2000). Strategic human resource management: Where have we come from and where should we be going? International Journal of Management Reviews, 2(2), 183–203. [Google Scholar] [CrossRef]
- Brown, T. A. (2006). Confirmatory factor analysis for applied research. Guildford. [Google Scholar]
- Brown, W. A. (2005). Exploring the association between board and organizational performance in nonprofit organizations. Nonprofit Management and Leadership, 15(3), 317–339. [Google Scholar] [CrossRef]
- Bryman, A. (2016). Social research methods (5th ed., Vol. 5). Oxford University Press. [Google Scholar]
- Cabrera-Luján, S. L., Sánchez-Lima, D. J., Guevara-Flores, S. A., Millones-Liza, D. Y., García-Salirrosas, E. E., & Villar-Guevara, M. (2023). Impact of corporate social responsibility, business ethics and corporate reputation on the retention of users of third-sector institutions. Sustainability, 15(3), 1781. [Google Scholar] [CrossRef]
- Callen, J. L., Klein, A., & Tinkelman, D. (2010). The contextual impact of nonprofit board composition and structure on organizational performance: Agency and resource dependence perspectives. Voluntas, 21(1), 101–125. [Google Scholar] [CrossRef]
- Campo-Arias, A., & Oviedo, H. (2008). Propiedades psicométricas de una escala: La consistencia interna. Revista de Salud Pública, 10(5), 831–839. [Google Scholar] [CrossRef] [PubMed]
- Cao, Y., & Hanafiah, M. (2024). Relationship between environmental, social and governance and corporate financial performance: A systematic literature review. Malaysian Journal of Consumer and Family Economics, 32(1), 574–602. [Google Scholar] [CrossRef]
- Caplow, T. (1976). How to run any organization: Vol. I (1st ed.). The Dryden Press. [Google Scholar]
- Choi, S., & Ko, Y. (2024). Top executives’ discretion and organizational performance: Analysis of quasi-governmental organizations in Korean government. International Review of Administrative Sciences, 90(2), 490–509. [Google Scholar] [CrossRef]
- Connelly, C. E., Fieseler, C., Černe, M., Giessner, S. R., & Wong, S. I. (2021). Working in the digitized economy: HRM theory & practice. Human Resource Management Review, 31(1), 100762. [Google Scholar] [CrossRef]
- Cupertino, S., Vitale, G., & Taticchi, P. (2023). Interdependencies between financial and non-financial performances: A holistic and short-term analytical perspective. International Journal of Productivity and Performance Management, 72(10), 3184–3207. [Google Scholar] [CrossRef]
- Dimple, T. (2024). Bridging the gap between high-performance work system and organizational performance: Role of organizational agility, transformational leadership, and human resource flexibility. Global Journal of Flexible Systems Management, 25(2), 369–393. [Google Scholar] [CrossRef]
- Dung, N. N. K., & Tuan, D. A. (2023). The organizational culture strategy SMEs during economic crises. Emerging Science Journal, 7(6), 2120–2132. [Google Scholar] [CrossRef]
- Dušek, J. (2023). Data boxes as a part of the strategic concept of computerization of public administration in the Czech Republic. Administrative Sciences, 13(6), 154. [Google Scholar] [CrossRef]
- Elbawab, R. (2024). Linking organisational learning, performance, and sustainable performance in universities: An empirical study in Europe. Humanities and Social Sciences Communications, 11(1), 626. [Google Scholar] [CrossRef]
- Ferrando, P. J., & Anguiano-Carrasco, C. (2010). El análisis factorial como técnica de investigación en psicología. Papeles Del Psicólogo, 31(1), 18–33. Available online: https://www.papelesdelpsicologo.es/pdf/1793.pdf (accessed on 15 January 2022).
- Fischer, M., Imgrund, F., Janiesch, C., & Winkelmann, A. (2020). Strategy archetypes for digital transformation: Defining meta objectives using business process management. Information and Management, 57(5), 103262. [Google Scholar] [CrossRef]
- Fornell, C., & Larcker, D. F. (1981). Evaluating structural equation models with unobservable variables and measurement error. Journal of Marketing Research, 18, 39–50. [Google Scholar] [CrossRef] [PubMed]
- Giuliano, R., Radermecker, L., & Godfroid, C. (2023). Staff turnover and organizational performance: The case of a microfinance organization. Journal of Economics and Management, 45(1), 413–440. [Google Scholar] [CrossRef]
- Grant, D., & Newell, S. (2013). Realizing the strategic potential of e-HRM. The Journal of Strategic Information Systems, 22(3), 187–192. [Google Scholar] [CrossRef]
- Gürlek, M., & Çemberci, M. (2020). Understanding the relationships among knowledge-oriented leadership, knowledge management capacity, innovation performance and organizational performance. Kybernetes, 49(11), 2819–2846. [Google Scholar] [CrossRef]
- Hair, J. F., Sarstedt, M., Hopkins, L., & Kuppelwieser, V. G. (2014). Partial least squares structural equation modeling (PLS-SEM): An emerging tool in business research. European Business Review, 26(2), 106–121. [Google Scholar] [CrossRef]
- Hancock, G. (2019). The reviewer’s guide to quantitative methods in the social sciences: Vol. I. Routledge. [Google Scholar]
- Harrison, J. S., & Wicks, A. C. (2013). Stakeholder theory, value, and firm performance. Business Ethics Quarterly, 23(1), 97–124. [Google Scholar] [CrossRef]
- Hasaj, A., & Kruja, D. (2023). The influence of brand orientation dimensions on organizational performance of non-profit organizations in Albania. Acta Polytechnica Hungarica, 20(3), 175–194. [Google Scholar] [CrossRef]
- Haylemariam, L. G., Oduro, S., & Tegegne, Z. L. (2024). Entrepreneurial agility and organizational performance of IT firms: A mediated moderation model. Journal of Entrepreneurship, Management and Innovation, 20(2), 75–92. [Google Scholar] [CrossRef]
- Henseler, J., Ringle, C. M., & Sarstedt, M. (2015). A new criterion for assessing discriminant validity in variance-based structural equation modeling. Journal of the Academy of Marketing Science, 43(1), 115–135. [Google Scholar] [CrossRef]
- Herman, R. D., & Renz, D. O. (1999). Theses on nonprofit organizational effectiveness. Nonprofit and Voluntary Sector Quarterly, 28(2), 107–126. [Google Scholar] [CrossRef]
- Hoai, T. T., Hung, B. Q., & Nguyen, N. P. (2022). The impact of internal control systems on the intensity of innovation and organizational performance of public sector organizations in Vietnam: The moderating role of transformational leadership. Heliyon, 8(2), e08954. [Google Scholar] [CrossRef] [PubMed]
- Hodges, J., & Howieson, B. (2017). The challenges of leadership in the third sector. European Management Journal, 35(1), 69–77. [Google Scholar] [CrossRef]
- Ikhwan, H. S., Himawati, D., Utomo, J., & Yanti, E. R. (2024). Design organizational health and organizational performance through the workplace spirituality, adaptive innovation capabilities and involvement HRM practices: An Indonesia cased study. International Review of Management and Marketing, 14(4), 113–121. [Google Scholar] [CrossRef]
- Jangbahadur, U., & Sharma, V. (2017). Employee development practices and sustainable organisational performance in Indian steel industries: Development and validation of scales. International Journal of Management Practice, 10(3), 224–253. [Google Scholar] [CrossRef]
- Jiao, L., Harrison, G., & Chen, J. (2022). Cultural transition and organizational performance: The non-profit context. Public Money and Management, 42(6), 442–451. [Google Scholar] [CrossRef]
- Jiao, L., Harrison, G., Dyball, M. C., & Chen, J. (2017). CEO values, stakeholder culture, and stakeholder-based performance. Asia Pacific Journal of Management, 34(4), 875–899. [Google Scholar] [CrossRef]
- Jiménez, M. (2018). Leadership style, organizational performance, and change through the lens of emotional intelligence. Foundations of Management, 10(1), 237–250. [Google Scholar] [CrossRef]
- Kaplan, R. S., & Norton, D. P. (1996). The balanced scoredcard: Translating strategy into action. Harvard Business School Press. [Google Scholar]
- Kaššaj, M., & Peráček, T. (2024). Sustainable connectivity—Integration of mobile roaming, WiFi4EU and smart city concept in the European Union. Sustainability, 16(2), 788. [Google Scholar] [CrossRef]
- Katou, A. A. (2013). The link between HR practices, psychological contract fulfilment, and organisational performance in Greece: An economic crisis perspective. Journal of Industrial Engineering and Management, 6(2), 568–594. [Google Scholar] [CrossRef]
- Klikauer, T. (2023). Philosophy, business ethics and organisation theory: A review article. Philosophy of Management, 12(1), 79–87. [Google Scholar] [CrossRef]
- Lebec, L., & Dudau, A. (2024). From the inside looking out: Towards an ecosystem paradigm of third sector organizational performance measurement. Public Management Review, 26(7), 1988–2013. [Google Scholar] [CrossRef]
- Lecy, J. D., Schmitz, H. P., & Swedlund, H. (2012). Non-governmental and not-for-profit organizational effectiveness: A modern synthesis. Voluntas, 23(2), 434–457. [Google Scholar] [CrossRef]
- Lindenberg, M. (2001). Are we at the cutting edge or the blunt edge?: Improving NGO organizational performance with private and public sector strategic management frameworks. Nonprofit Management and Leadership, 11(3), 247–270. [Google Scholar] [CrossRef]
- Lusthaus, C., Adrien, M., Anderson, G., Carden, F., & Plinio, G. (2002). Evaluación organizacional. Marco para mejorar el desempeño. Banco Interamericano de Desarrollo y Centro Internacional de Investigaciones para el Desarrollo. [Google Scholar]
- Macedo, I. M., Pinho, J. C., & Silva, A. M. (2016). Revisiting the link between mission statements and organizational performance in the non-profit sector: The mediating effect of organizational commitment. European Management Journal, 34(1), 36–46. [Google Scholar] [CrossRef]
- Maclean, M., Harvey, C., & Clegg, S. R. (2017). Organization theory in business and management history: Present status and future prospects. Business History Review, 91(3), 457–481. [Google Scholar] [CrossRef]
- Manzini, J. L. (2000). Declaración de Helsinki: Principios éticos para la investigación médica sobre sujetos humanos. Acta Bioethica, 6(2), 321–334. [Google Scholar] [CrossRef]
- Mohammad, H. (2019). Mediating effect of organizational learning and moderating role of environmental dynamism on the relationship between strategic change and firm performance. Journal of Strategy and Management, 12(2), 275–297. [Google Scholar] [CrossRef]
- Muafi, & Uyun, Q. (2019). The alignment of innovation strategy, Islamic Hrm (Ihrm) practices, and organizational performance: A contingency approach. Proceedings on Engineering Sciences, 1(2), 959–968. [Google Scholar] [CrossRef]
- Olivier, B. (2018). Psychometric validation of an organisational performance questionnaire (Opq) based on the burke-litwin model. Journal of Psychology in Africa, 28(1), 46–51. [Google Scholar] [CrossRef]
- Orlandini-González, I. E. (2021). Relationship between the female management profile, market orientation and organizational performance. Validation of a measuring instrument. Retos, 11(22), 333–346. [Google Scholar] [CrossRef]
- Otzen, T., & Manterola, C. (2017). Sampling techniques on a population study. International Journal of Morphology, 35(1), 227–232. [Google Scholar] [CrossRef]
- Pinho, J. C., Rodrigues, A. P., & Dibb, S. (2014). The role of corporate culture, market orientation and organisational commitment in organisational performance: The case of non-profit organisations. Journal of Management Development, 33(4), 374–398. [Google Scholar] [CrossRef]
- Porkodi, S. (2024). The effectiveness of agile leadership in practice: A comprehensive meta-analysis of empirical studies on organizational outcomes. Journal of Entrepreneurship, Management and Innovation, 20(2), 117–138. [Google Scholar] [CrossRef]
- Porter, M. E. (1991). Towards a dynamic theory of strategy. Strategic Management Journal, 12(2 S), 95–117. [Google Scholar] [CrossRef]
- Puri, K. S., Suresh, K. R., Gogtay, N. J., & Thatte, U. M. (2009). Declaration of Helsinki, 2008: Implications for stakeholders in research. Journal of Postgraduate Medicine, 55(2), 131–134. [Google Scholar] [CrossRef] [PubMed]
- Rahmaniati, N., & Ekawati, E. (2024). The role of Indonesian regulators on the effectiveness of ESG implementation in improving firms’ non-financial performance. Cogent Business & Management, 11(1), 2293302. [Google Scholar] [CrossRef]
- Ruiz, L., Benitez, J., Castillo, A., & Braojos, J. (2024). Digital human resource strategy: Conceptualization, theoretical development, and an empirical examination of its impact on firm performance. Information and Management, 61(4), 103966. [Google Scholar] [CrossRef]
- Ruoxi, L., Chutipattana, N., & Dongsheng, L. (2024). Research on the application of manager’s psychological capital in enterprise performance. International Journal of Religion, 5(5), 35–48. [Google Scholar] [CrossRef]
- Sayed, E., Mansour, K., & Hussainey, K. (2024). Intangible investment and non-financial performance of Egyptian firms: The moderating role of the COVID-19 pandemic. Journal of Financial Reporting and Accounting, 22(3), 608–633. [Google Scholar] [CrossRef]
- Schmid, H. (2006). Leadership styles and leadership change in human and community service organizations. Nonprofit Management and Leadership, 17(2), 179–194. [Google Scholar] [CrossRef]
- Seashore, S. E., & Yuchtman, E. (1967). Factorial analysis of organizational performance. Administrative Science Quarterly, 12(3), 377–395. [Google Scholar] [CrossRef]
- Shadish, W. R., Cook, T. D., & Campbell, D. T. (2002). Experimental and quasi-experimental designs for generalized causal inference. Houghton Mifflin Company. [Google Scholar]
- Shoham, A., Ruvio, A., Vigoda-Gadot, E., & Schwabsky, N. (2006). Market orientations in the nonprofit and voluntary sector: A meta-analysis of their relationships with organizational performance. Nonprofit and Voluntary Sector Quarterly, 35(3), 453–476. [Google Scholar] [CrossRef]
- Shortell, S. M. (2016). Applying organization theory to understanding the adoption and implementation of accountable care organizations: Commentary. Medical Care Research and Review, 73(6), 694–702. [Google Scholar] [CrossRef]
- Snell, S., & Morris, S. (2021). Time for realignment: The HR ecosystem. Academy of Management Perspectives, 35(2), 219–236. [Google Scholar] [CrossRef]
- Snell, S. A., Morris, S. S., & Serre, B. (2022). The human resource ecosystem: Reconciling alignment and disruption. In Research in personnel and human resources management (pp. 43–59). Emerald Publishing Limited. [Google Scholar] [CrossRef]
- Sowa, J. E., Selden, S. C., & Sandfort, J. R. (2004). No longer unmeasurable? A multidimensional integrated of nonprofit organizational effectiveness. Nonprofit and Voluntary Sector Quarterly, 33(4), 711–728. [Google Scholar] [CrossRef]
- Taylor, F. W. (1911). The principles of scientific management. NuVision Publications, LLC. [Google Scholar]
- Tortia, E. C., Sacchetti, S., & López-Arceiz, F. J. (2022). A human growth perspective on sustainable HRM practices, worker well-being and organizational performance. Sustainability, 14(17), 11064. [Google Scholar] [CrossRef]
- Tsang, A., Frost, T., & Cao, H. (2023). Environmental, social, and governance (ESG) disclosure: A literature review. The British Accounting Review, 55(1), 101–149. [Google Scholar] [CrossRef]
- Tseng, S.-M., & Lee, P.-S. (2014). The effect of knowledge management capability and dynamic capability on organizational performance. Journal of Enterprise Information Management, 27(2), 158–179. [Google Scholar] [CrossRef]
- Vaillant, Y., & Lafuente, E. (2024). Digital versus non-digital servitization for environmental and non-financial performance benefits. Journal of Cleaner Production, 450, 142078. [Google Scholar] [CrossRef]
- Wang, W., Fu, Y., Qiu, H., Moore, J. H., & Wang, Z. (2017). Corporate social responsibility and employee outcomes: A moderated mediation model of organizational identification and moral identity. Frontiers in Psychology, 8, 1906. [Google Scholar] [CrossRef]
- Wei, S., & Zhang, M. (2023). There are four-element orthogonal exponentials of planar self-affine measures with two digits. Complex Analysis and Operator Theory, 17(1), 1. [Google Scholar] [CrossRef]
- William, A.-A., & Singh, K. (2024). The impact work–life balance and flexible work arrangements on non-financial organisational performance. International Social Science Journal, 74(254), 1259–1279. [Google Scholar] [CrossRef]
- Wood, S., & Ogbonnaya, C. (2018). High-involvement management, economic recession, well-being, and organizational performance. Journal of Management, 44(8), 3070–3095. [Google Scholar] [CrossRef]
- Wu, H., Deng, H., & Gao, X. (2024). Corporate coupling coordination between ESG and financial performance: Evidence from China’s listed companies. Environmental Impact Assessment Review, 107, 107546. [Google Scholar] [CrossRef]
- Yang, D., & Babiak, K. (2023). A study on corporate foundation and philanthropy: Does governance matter for organizational performance? Nonprofit Management and Leadership, 34(1), 59–80. [Google Scholar] [CrossRef]
- Yuan, X., Ma, L., Wang, C., Yan, H., & Chen, Y. (2024). The internal organizational performance influence factors study—An empirical test. PLoS ONE, 19, e0298595. [Google Scholar] [CrossRef] [PubMed]
Disclaimer/Publisher’s Note: The statements, opinions and data contained in all publications are solely those of the individual author(s) and contributor(s) and not of MDPI and/or the editor(s). MDPI and/or the editor(s) disclaim responsibility for any injury to people or property resulting from any ideas, methods, instructions or products referred to in the content. |
© 2025 by the authors. Licensee MDPI, Basel, Switzerland. This article is an open access article distributed under the terms and conditions of the Creative Commons Attribution (CC BY) license (https://creativecommons.org/licenses/by/4.0/).