Abstract
Background: This study explored the interrelation between motor coordination abilities and cognitive functions in older adults, aiming to establish a preliminary diagnostic tool that may facilitate early detection of motor–cognitive decline. Methods: Utilizing a mixed-methods approach, we investigated the efficacy of the Stroop word test in conjunction with various motor coordination measurements to identify markers of cognitive aging in older adults. Results: The analysis revealed significant correlations between asymmetric spatial coordination (AC) and Stroop error effects (SEEs), indicating that better coordination correlates with reduced cognitive errors. Multiple-regression analysis showed that AC, simple reaction time (SRT), and anticipation time (AT) significantly predicted SEE (R2 = 0.635), with AC emerging as the strongest predictor (β = −0.475). These results underscore the significance of asymmetric spatial motor coordination as a predictive factor for executive cognitive abilities affected by aging. We propose a potential tool for individuals to monitor their motor–cognitive health. Conclusions: The findings of this study contribute to the growing body of evidence linking physical coordination to cognitive function, emphasizing the importance of integrated diagnostic approaches in the management of aging-related cognitive impairments.
1. Background
As awareness of health and welfare has recently increased, so has the interest in quality of life. The definition of health has expanded from merely being “free from illness” to a state of “physical, mental, and social well-being,” thereby occupying a crucial position in modern society (Office of Disease Prevention and Health Promotion, 2010). Research has reported that regular physical activity positively affects the realization of a welfare society and is closely linked to the improvement of individuals’ quality of life, emphasizing the importance of physical activity in order to maintain a healthy life for as long as possible (Fontaine et al., 2003).
This perspective, along with advancements in neuroscience, necessitates the application of neuroscience methodologies to exercise behavior. In particular, research on the cognitive and neurological changes involved in movement as they relate to aging is being conducted in various fields (Hillman et al., 2006). The interaction between the environment, tasks, and organisms involved in aging has highlighted the substantial role of the nervous system, without which smooth functioning of perception, cognition, and the musculoskeletal system is impossible (Carson & Kelso, 2004). Consequently, the need for neuromotor research related to aging has increased (Voelcker-Rehage et al., 2010).
Accordingly, this study aimed to comprehensively characterize motor control abilities among older adults based on the movement and cognitive control characteristics found in existing experiments and research. By determining the impact of integrated motor control abilities in older adults on the use of cognitive functions, we sought to examine in detail the neuromotor control characteristics induced by aging. Additionally, by simplifying the complex and varied measurement equipment and technologies into a single diagnostic tool that individuals can use, we aimed to make it easier to ascertain the degree of aging.
As the global population ages, diseases related to older adults have become a critical social issue. The transformation into an aging society has resulted in a growing older adult population (Harper, 2014; UN DESA, 2019), with many countries, including South Korea, projected to become super-aged societies in the coming decades. This phenomenon reflects middle-aged and older adults’ increasing need to engage in meaningful life activities during their senior years as the extension of their lifespan results in a higher proportion of older adults in the population (Hunter et al., 2016). Consequently, it is vital to develop specialized knowledge services, including functional-problem diagnosis and prevention technologies, to enrich the lives of older adults. Health issues among older adults can lead to an increased societal burden through medical costs, which suggests that suitable diagnostic and preventative technologies could have considerable economic benefits in the long term (Booth & Lees, 2006).
Human brain activity is closely connected to various behaviors (Kandel et al., 2000), and exercise significantly improves cognitive functions (Kim et al., 2007; Burpee & Stroll, 1936). This positive relationship extends to the older adult population; despite age-related declines in information processing speed and short-term memory (Castelli et al., 2007; Bäckman et al., 2010; Cabeza, 2001; Lövdén et al., 2010; D. C. Park & Reuter-Lorenz, 2009), significant differences in cognitive functions have been documented in groups participating in exercise (S. Colcombe & Kramer, 2003). Continuous exercise enhances cardiovascular function, physical balance, and muscle strength in older adults (Fatouros et al., 2002), while also stimulating the nervous system through increased blood flow to the brain, positively affecting brain function activation (Spirduso, 1980). This suggests a beneficial relationship between older adults’ exercise capabilities and cognitive function (S. J. Colcombe et al., 2004). Neurophysiological evidence supports the importance of physical activity in maintaining cognitive abilities in older adults, including angiogenesis, construction of new neural fibers, and adaptability of neurotransmitter systems (Black et al., 1990; van Praag et al., 2005). These mechanisms make cardiovascular training beneficial for cognitive function and show positive effects on brain cortical areas related to attention control (S. Colcombe & Kramer, 2003; Lustig et al., 2009).
The importance of physical activity in retaining and developing cognitive abilities in healthy older adult individuals (e.g., S. Colcombe & Kramer, 2003) has expanded from the classical perspective of the neurophysiological plasticity of cardiovascular exercise (Hillman et al., 2008) to include motor fitness aspects such as movement speed, balance maintenance, and coordination (Stojan et al., 2023; Voelcker-Rehage et al., 2010). In particular, various forms of movement coordination linked to daily activities are closely associated with the neurological activities of older adults, presenting evidence that coordination indirectly and directly affects not only their activities and lifestyles in old age but also their self-esteem and cognitive functions (Rosenbaum, 2005). This suggests that various forms of coordinated movement can serve as a foundation for determining older adults’ behavioral health habits, potentially acting as a basis for reducing the healthcare costs associated with aging (Rinn et al., 2023).
This cross-sectional study, thus, aimed to (1) examine associations between motor coordination abilities (temporal and spatial measures) and cognitive function (Stroop test performance) in community-dwelling older adults, and (2) develop a preliminary self-assessment model that could facilitate early identification of motor–cognitive decline. We hypothesized that different coordination tasks, such as (spatial–)temporal and (a)symmetric, would show different associations with executive function measures.
2. Methods
2.1. Motor (Coordination) Function in Older Adults
Owing to the newly discovered effects of exercise on cognitive function, research on the relationship between exercise and cognition has begun to attract attention from various perspectives. Significant positive effects have been observed not only in academic achievement but also in aging, which has recently become a major social issue (Trudeau & Shephard, 2008) (Figure 1).
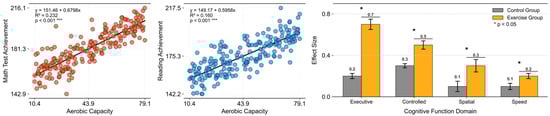
Figure 1.
Recreated effects of physical activity in cognitive function. Left = physical activity and academic performance in school-age children (data from the California Department of Education); right = meta-analytic findings of exercise-training effects on cognition in older adults (data from S. Colcombe & Kramer, 2003).
Although most studies have acknowledged the relationship between exercise and cognitive function, their findings have typically been limited to health-related physical fitness components. This approach has been criticized for overlooking the diverse effects of exercise by focusing solely on cardiorespiratory fitness aspects (Voelcker-Rehage et al., 2010). Notably, human motor behavior involves not only improvements in cardiorespiratory function and muscle strength, but also functional enhancements that cannot be fully explained by structural, anatomical, and physiological changes in the brain (Hillman et al., 2008).
2.2. Spatial Coordination Variables
Reports have indicated that aerobic and coordination exercises produce different enhancements in the cognitive functions of older adults. Coordination exercises are closely related to executive functions associated with attention, memory, spatial–temporal organization and maintenance, self-regulation, continuous action, flexibility, response inhibition, and planning (Kaplan et al., 2000). Therefore, the relationship between exercise and cognition may be examined from various angles to demonstrate the relationships among the acquisition of motor coordination, motor skills, and cognitive functions (Shi et al., 2020). However, the tools used to measure exercise coordination characteristics have methodological limitations. Based on classifications by Henry (1961), Fleishman (1972), Keele et al. (1987), and others, most prior studies have been limited to time-dependent motor responses, which limits the discussion on coordination details. Time-dependent measures commonly used in previous research (e.g., movement rate = speed of hand and foot movements) are limited in their ability to assess the coordination of limbs moving efficiently together. Accordingly, to verify the aging effects related to various motor functional abilities, this study measured not only the time-dependent eye and hand coordination used in previous studies, but also spatially dependent limb (a)symmetry coordination (Haken et al., 1985; C. Park, 2022) (Table 1). (See Appendix A.1 for details of the model.)

Table 1.
Categorization of the experimental motor coordination tasks.
2.3. Reaction Time Variable
Information received from the external environment enables behavioral regulation through appropriate neural actions. Neural activity is a primary factor regulating human movement, and studies related to the action of nerves have traditionally used reaction time (simple reaction time) as a measure (Fiani et al., 2021). Reaction times can vary substantially depending on the nature of the task and individual differences (Hick, 1952). Anticipation, which involves controlling the initiation of movement in response to external stimuli, plays a critical role in timing. If performed correctly, it can considerably improve efficiency in terms of timing, accuracy, and force applied. Further, having more time to process information through anticipation can enhance efficiency (Schmidt et al., 2018). From everyday actions (e.g., walking and running) to complex sports skills (e.g., swinging a golf club and performing gymnastics flips) all human movements require harmonious connections between physical elements (e.g., joints and muscles). Creating forms for various actions necessary in daily life and understanding the principles of movement coordination (Bernstein, 1967) and the process of change to achieve performance goals more effectively are the first steps in uncovering the information needed to understand aging. Such measurements are expected to not only validate the reliability of time-dependent measurement tools (simple reactions) used in previous studies aiming to explore the mechanisms of aging, but also provide a clearer understanding of the aging state of motor abilities through comparisons with spatially dependent limb coordination (inter-limb coordination) capabilities.
2.4. Cognitive (Executive) Function Measures
The Stroop task, which involves parallel processing of a color and the word representing the color and performing an interference, is an excellent tool for providing insights into interference and facilitation within the sensory-perception–action loop (Keele, 1972). The Stroop task is one of the most frequently used tools for measuring executive functioning in older adults (Hecht & Reiner, 2010) as it examines mental flexibility and the ability to suppress preferred responses when performing new actions (Kaplan et al., 2000), which is related to the demands of frontal-lobe function in extracting appropriate information, recognizing it, and controlling interferences (Stuss & Benson, 1986) (Figure 2).
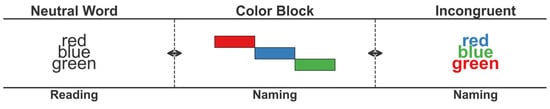
Figure 2.
Prototype of the task. Note: left = prototype of the Stroop task: Stroop 1 = reading the word, Stroop 2 = reading the color, Stroop 3 = reading the color and not the word (referenced from Keele, 1972; Hecht & Reiner, 2010).
Executive function refers to the ability to self-regulate, act continuously, exercise flexibility, respond to inhibition and planning, and appropriately organize one’s behavior (Friedman & Robbins, 2022). It differs from general cognitive abilities (e.g., attention and memory), primarily involving conscious neural regulation performed in the prefrontal cortex, which includes the integration, organization, maintenance, and flexibility of behavior (American Psychological Association, 2000; Kaplan et al., 2000). Executive function significantly correlates with age, and studies comparing executive function tasks across various age groups have reported clear differences in task scores with age. However, most research findings have limitations when applied to domestic situations due to certain variables, including sample selection criteria, experimental methods, and individual characteristics (education, attention, and memory abilities). Considering the limitations concerning the Stroop test in previous studies, this study sought to validate the correlations between variables in an experimental environment (Gajewski et al., 2020). To investigate the effects of age, gender, and education level on performance in the Stroop test as standard measurement data, we compared the different coordination effects related to Stroop test performance scores among older adult volunteers. As indicated in Appendix A.2, the Stroop test comprises three subtasks. We instructed participants to read the tasks included in each performance as quickly as possible without feeling pressured by time constraints. We measured the performance time for Tasks 1, 2, and 3, the interference (Stroop 3 − [(Stroop 1 + Stroop 2)/2]), and the frequency of errors. This formula isolates the interference effect by comparing incongruent trial performance to the average of congruent conditions, following standard procedures (MacLeod, 1991).
2.5. Participants and Recruitment Process
A total of 30 elderly participants (20 females, 10 males) took part in this cross-sectional experiment. The average age was 80 years (SD = 5, range 71–89). On average, participants had 11.3 years of education (SD = 2.77, range 9–16). They engaged in leisure and physical exercise activities for an average of 6.5 h per week (SD = 2.02, range 5–10). The average body mass index (BMI) was 23.85 kg/m2 (SD = 1.06). The average systolic blood pressure was 140.30 mm Hg (SD = 3.22) and diastolic blood pressure was 82.38 mm Hg (SD = 2.01).
All participants volunteered for the study and were screened for medical issues and health restrictions. Recruitment was done through the member registry of a college program for the elderly. Medical exams included assessments of general motor (cardiovascular, osteoarthritis, and arthrosis) and neurological functions (brain disorders, Parkinson’s disease, and stroke), which found no significant symptoms. Three participants withdrew (two males, one female). Additionally, three participants (two males, one female) were identified as outliers due to z-scores exceeding ±2.5 standard deviations from the mean (Ratcliff, 1993), with extreme values for SE or SEE (see Appendix A.2.2 for details), and were excluded from the analysis. Thus, data from 24 participants were analyzed.
Testing was conducted at a community center equipped with standardized laboratory devices and a computerized measurement system. Each participant completed all motor coordination tasks (SRT, AT, SC, AC) followed by the Stroop test in a single session, with brief rest periods provided between tasks as needed. All statistical analyses were performed using IBM SPSS Statistics (Version 29.0). Descriptive statistics, Pearson correlations, and multiple-regression analyses were conducted, with statistical significance set at p < 0.05.
The participants provided written informed consent to participate in this study (Clinical trial number: not applicable). The study was approved by the local ethics committee (SNUIRB No. 1509/002-002) and adhered to the ethical standards of the 1964 Declaration of Helsinki (CITI Program Record ID 20481572).
3. Results
3.1. Motor (Coordination) Function
As presented in Table 2, we analyzed the descriptive statistics for each variable, including simple reaction time (SRT), anticipation time (AT), Symmetrical Spatial Coordination Ability (SC), and Asymmetrical Spatial Coordination Ability (AC). The total number of participants in the experiment was 24 (after exclusions), of whom three were deemed outliers based on the criterion of quartile deviation from the mean value proposed by Ratcliff (1993) and were excluded from the analysis. The sex composition included both males and females, with ages ranging from 71 to 82 yrs. (see Appendix A.2.1 for more details.)
Table 2.
Descriptive statistics for each variable.
Examination of the mean (M) values and standard deviation (SD) for each variable showed that the average simple reaction time (SRT) was 7.93 s, with a standard deviation of 0.84 s. Anticipation Time (AT) was 2.51 s on average, with a standard deviation of 1.10 s. The index for Symmetrical Spatial Coordination Ability (SC) was 1.34 on average, with a standard deviation of 0.21, whereas that for Asymmetrical Spatial Coordination Ability (AC) was 0.36 on average, with a standard deviation of 0.24. Thus, the time- and space-based coordination abilities of participants varied significantly.
In particular, as depicted in Figure 3a, Asymmetrical Spatial Coordination Ability showed high variability in both average reaction times and indices, which suggests the presence of individual differences in cognitive and motor function during aging. The comparison in Figure 3b highlights the difference between the selected prototypical cases (ID = 19, index = 0.72; ID = 01, index = 0.05), which is useful for motor control and coordination pattern recognition. The results obtained through the analysis, excluding outliers, provide important insights for research on the motor and cognitive functions of the older adult population.
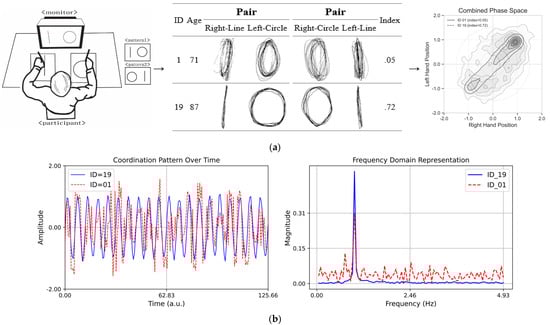
Figure 3.
(a) Schematic drawing of the asymmetrical bi-manual coordination tasks. (Left) A perfect independent would have a higher index score (perfect score = 1.0), and the worst independent would have a lower index score (worst score = 0.0). (Middle) Asymmetrical bi-manual drawing displacement in millimeters: the X (major) and Y (minor) axis dimensions of lines and circles when subjects performed dual tasks for a 20 s trial for each pair condition. (Right) Combined phase space representation of coordination dynamics showing density distributions for participants with contrasting stability indices. (b) Coordination patterns over time. The plot on the left side displays two sinusoidal time series with variations in different coordination complexities. The blue line (ID = 19, index = 0.72) represents stable coordination, while the red dashed line (ID = 01, index = 0.05) exhibits high variability, illustrating complexity. The plot on the right side presents the Fourier transform of the time series, highlighting the differences in frequency content. The red dashed line shows a broader frequency spectrum, indicating greater complexity compared to the more uniform blue line.
3.2. Cognitive (Executive) Function
Table 3 presents the descriptive statistics for executive function, cognitive function, the Stroop effect (SE), and the Stroop error effect (SEE) (data on participants’ sex, age, and cognitive function indicators). Three participants were excluded from the analysis based on outlier criteria using the quartile deviation from the mean value proposed by Ratcliff (1993). One participant scored 366.04 s (Z: 4.10) on the SE; the second scored 33.5 f (Z: 2.53) on the SEE, and the third scored 36.5 f (Z: 2.85) on the SEE. Owing to the possibility that they may not have come from the same population, they were excluded from the analysis. The exclusion rate (12.5%) is within an acceptable range for reaction time studies (Ratcliff, 1993), and preliminary inspection of the data indicated that the primary AC-SEE correlation pattern remained consistent in direction when examined with the full dataset, supporting the robustness of the findings.
Table 3.
Descriptive statistics for each variable.
The analysis results showed an average Stroop effect (SE) of 82.31 s (SD = 35.67) and an average Stroop error effect (SEE) frequency of 9.08 (SD = 6.31). These results provide an important foundation for exploring the relationship between SE and SEE in this older adult sample, and provide important insight for exploring changes in executive function during aging and the relationship between SE and SEE. In particular, the high SD for executive function scores and the frequency of SE and SEE suggested significant variability among the participants, which we interpreted as an important consideration in the study of cognitive function in the older adult population. Appendix A.2.2 provides detailed score information for all participants. The results obtained through this analysis, after excluding outliers, contribute to deepening our understanding of cognitive functions and SEE among older adults.
3.3. Correlation Between Motor and Cognitive Functions
The primary finding was a significant negative correlation between asymmetric spatial coordination (AC) and Stroop error effects (SEE) (r = −0.475, p = 0.033), indicating that better coordination was associated with fewer cognitive errors. To examine this and other motor–cognitive relationships, we analyzed the interrelationship between cognitive function measures (Stroop test) and various temporal and spatial coordination measures. Our aim was to identify the motor components most strongly associated with cognitive performance.
Figure 4 illustrates the strength and statistical significance of the correlations between the standardized variables through linear regression analysis, Pearson’s correlation coefficient (r), and p-values. The analysis was divided into six subsets, each representing a specific variable category: temporal (SRT and AT), spatial (SC and AC), and cognitive (SE and SEE). The first subset analyzed the temporal variables SRT and AT. The results, along with the linear regression, illustrate the relationships between the variables. The second subset focused on the spatial variables SC and AC. The correlation matrix shows the strength and significance of the linear relationships. The regression analysis highlights that these variables with significant correlations can predict each other’s spatial attributes. The annotated p-values and correlation coefficients provide a clear indication of the predictive power of SC and AC. The third subset evaluated the cognitive variables SE and SEE. The correlation analysis revealed the extent to which these cognitive measures were related. Significant correlations indicate a strong predictive relationship in which one cognitive measure can provide insights into another. The annotated statistical values emphasize the confidence levels of these relationships.
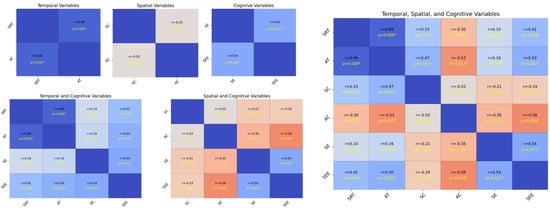
Figure 4.
Analysis of standardized variables. The plot on the upper left side consists of SRT, AT, SC, AC, SE, and SEE, and the plot on the bottom left side consists of SRT, AT, SE, SEE, SC, AC, SE, and SEE, while the plot on the right side includes all of them. Each cell shows the linear regression, with Pearson’s correlation coefficients (r) and p-values indicating the strength and statistical significance of the relationships, respectively. The scatter plots illustrate the pairwise relationships, and asterisks next to the p-values in the upper triangle denote the significance levels, p = < 0.05, p < 0.01, and p < 0.001, respectively. The regression varies according to the significance, assisting in establishing the correlation strength between variable pairs. The presence of significant correlations highlights potential predictive relationships, whereas non-significant correlations (no asterisks) indicate a lack of evidence for a linear predictive relationship between the respective pairs of variables.
Each subset included the Pearson’s correlation coefficient (r) and p-values as annotations; statistical significance is denoted as p < 0.05, p < 0.01, and p < 0.001. Significant correlations highlight potential predictive relationships, whereas non-significant correlations (with no asterisks) suggest insufficient evidence for a linear predictive relationship between pairs of variables. The temporal analysis subsets (SRT and AT) indicated that these variables could significantly influence each other’s temporal dynamics. The spatial analysis subsets (SC and AC) revealed that spatial characteristics were interrelated and had potential predictive capabilities. The cognitive analysis subsets (SE and SEE) showed that cognitive measures were strongly correlated, suggesting that they could predict cognitive performance. Overall, the presence of significant correlations in these analyses underscores the importance of considering these relationships in predictive modeling and further research (see Appendix A.2.3 for more details).
Next, we estimated the observed sample data for statistical testing using both traditional (descriptive statistics such as M and SD) and regression-based (regression coefficients) approaches to estimate the effect of physical activity participation on aging and to provide a self-diagnostic profile based on these estimates. Despite individual differences, we performed statistical estimation and prediction using the measured variables in both male and female subjects without cognitive issues in order to establish the age-related effects of the Stroop task.
Table 4 presents the statistics for simple reaction time (SRT), anticipation time (AT), Symmetrical Spatial Coordination Ability (SC), Asymmetrical Spatial Coordination Ability (AC), and SE. The analysis of M and SD for each variable showed that the average SRT was 7.93 s, and the AT was 2.51 s. The average index for SC was 1.34 on average, and that for AC was 0.36 on average. The average time for SE, representing executive function, was 82.31 s, and the average frequency for SEE was 9.08. The SDs for each variable were 0.84 s for SRT, 1.10 s for AT, 0.21 for SC, 0.24 for AC, 35.67 s for SE, and 6.31 for SEE. These results suggest diversity between time- and space-based coordination abilities and executive function during the aging process. Specifically, the variability in SE and SEE was interpreted as reflecting individual differences in cognitive function decline. (See Appendix A.3 for more details.)
Table 4.
Descriptive statistics for each variable.
In Figure 5, the regression analysis shows a more pronounced correlation between executive function and space-based coordination than time-based coordination. This is evident from the slopes and positions of the regression lines in both coordinations. A steeper slope in the spatial coordination signifies a stronger relationship, indicating that as executive function improves, the impact on spatial coordination abilities is more substantial. This finding suggests that interventions aimed at enhancing executive functioning may yield more substantial improvements in spatial coordination tasks than in temporal ones. This analysis provides insightful evidence of the differential impact of executive function on temporal versus spatial motor coordination.
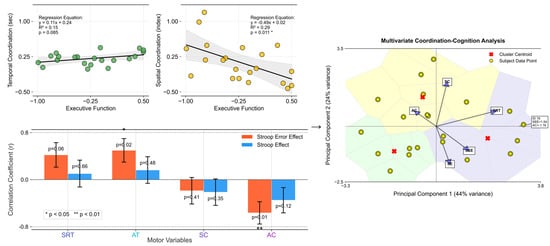
Figure 5.
Outcomes for time-based coordination (measured in seconds) and space-based coordination (indexed values) as a function of executive function (averaged SE and SEE scores). The upper left set: The left plot displays temporal coordination against executive function, showcasing a linear relationship with a regression line (black). The right plot delineates spatial coordination vs. executive function, also highlighted with a corresponding regression line. Both plots include scatter points (yellow with black edges) representing individual data points, set against a grid for enhanced readability. The bottom left set: The plot depicts the correlation coefficients between motor variables (SRT, AT, SC, AC) and executive functions (SEE, SE). The bars represent the correlation coefficients. Red bars correspond to correlations with SEE, while blue bars represent correlations with SE. Asterisks (*) denote statistical significance (p < 0.05, with an error bar). The right set: This presents the results of the multivariate coordination–cognition analysis using principal component analysis (PCA). This visualization maps participants (yellow circles) and variable contributions (blue vectors) in the reduced dimensionality space, with the first two principal components explaining 44% and 24% of variance, respectively. Color-coded regions represent clusters of similar coordination–cognition patterns, with red X markers indicating cluster centroids. The vectors’ directions and lengths illustrate the relative contribution of each motor (SRT, AC, SC) and cognitive (SEE, SE) variable to the principal components, highlighting the strong relationship between asymmetric coordination and executive function measures.
The stronger correlation observed for spatial coordination suggests a more integral role for executive cognitive processes in spatial task performance, highlighting the complexity and cognitive demands of spatial motor skills. This relationship emphasizes the cognitive–motor interface, where cognitive improvements can lead to enhanced motor coordination, particularly in tasks requiring spatial awareness and processing. This connection may reflect the cognitive demands of motor planning and execution, where higher executive dysfunction affects motor performance more profoundly. This, in turn, suggests a potential avenue for targeted interventions aimed at enhancing motor coordination through cognitive training, particularly focusing on reducing complex errors (SEE), which are strongly correlated with motor performance.
Table 5 and Figure 6 present the results of the multiple-regression analyses exploring the impact of spatial coordination and other variables on Stroop test performance, measured using interference time and error effects (See Appendix A.4 for more details). We conducted separate analyses for the two dependent variables: SE and SEE. For SE (R2 = 0.246), none of the predictor variables, including age, SRT, AT, SC, AC, and SEE, showed significant predictive value for Stroop interference time, as indicated by their p-values being above the significance threshold (p < 0.05). Conversely, the SEE model, which explained a larger proportion of the variance (R2 = 0.635), identified several significant predictors. Specifically, SRT positively predicted SEE (β = 0.359, p = 0.038), which indicates that longer simple reaction times are associated with more errors. AT negatively predicted the SEE (β = −0.388, p = 0.040), which suggests that quicker reaction times are linked to fewer Stroop test errors. Similarly, AC showed a significant negative relationship with SEE (β = −0.475, p = 0.033), which implies that better coordination correlates with reduced errors. Age, SC, and SE did not significantly predict SEE.
Table 5.
Multiple-regression analysis results for spatial coordination predicting the Stroop test interference time.
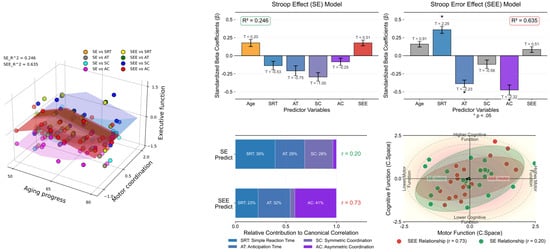
Figure 6.
Comparative analysis with multiple-regression models. The left panel 3D scatter plot illustrates the correlation between age, motor coordination (SRT, AT, SC, AC), and executive functions (SE and SEE), color-coded by task type. The upper right panel illustrates the coefficients and their standard errors (vertical error bar) for predicting Stroop effects (left), highlighting no significant predictors (R2 = 0.246), and Stroop error effects (right), with asterisks indicating variables (p < 0.05) signifying a statistically significant predictive relationship (R2 = 0.635). T-values are annotated above the corresponding bars to provide insights into the direction and magnitude of each variable’s effect. The left panel on the bottom right displays the relative contributions of motor variables (SRT, AT, SC, AC) to predicting executive functions (SEE and SE), with canonical correlation coefficients shown. The right panel visualizes the canonical space relationship between motor function (x-axis) and cognitive function (y-axis), featuring data points with confidence ellipses and directional vectors that demonstrate the strength and direction of these relationships. The visualization effectively illustrates how motor coordination variables collectively relate to executive performance measures in canonical space.
These results highlight the complex interplay between various cognitive and perceptual–motor skills that influence Stroop test performance, particularly error propensity. Specifically, the reaction time and coordination abilities (both auditory and attentional) significantly affected the likelihood of errors in the Stroop task, underscoring the multifaceted nature of cognitive interference and executive function.
4. Discussion
This study revealed a significant negative association between asymmetric spatial coordination (AC) and Stroop error effects (SEEs) (r = −0.475, p = 0.033) in community-dwelling older adults, with AC emerging as the strongest predictor in the regression model (β = −0.475, R2 = 0.635). These findings align with and extend previous work on motor–cognitive relationships. The stronger association of spatial coordination measures (particularly AC) with cognitive errors, compared to temporal measures, suggests that the ability to independently control bilateral limb movements may share underlying processes with executive inhibition. The asymmetric coordination task requires suppression of the natural tendency toward symmetric movement—a demand conceptually similar to the inhibition required in incongruent Stroop trials.
This study empirically supports the hypothesis that cardiovascular and coordination exercises are closely related to cognitive function. This context aligns with studies on adults with mild brain damage that focus on visuomotor processes and working memory tests (Mulder et al., 2002), and behavioral cross-sectional studies on preschool children that have found positive relationships between coordination exercise and cognitive abilities (Planinsec, 2002). The observation that coordination exercise ability is highly correlated with executive-function-related areas (parietal and inferior frontal cortices) in older adults at a neurophysiological level (Voelcker-Rehage et al., 2010) is significant. This suggests that coordination exercise tasks (e.g., lines and obstacles) can help with the sprouting and restructuring of neural synapses in the aging brain (Black et al., 1990; Smiley-Oyen et al., 2008), which provides empirical validation for the proposition and highlights the observed significant relationships between asymmetrical-coordination-exercise functions and the older adult population.
First, the physical location capabilities of the older adult brain are related to the prefrontal cortex and parietal/posterior cingulate cortex areas (Maguire et al., 1999) and are associated with the frontoparietal network (S. J. Colcombe et al., 2004, 2006; Marks et al., 2007), which suggests a close relationship with physical and cognitive activities in daily life (Hillman et al., 2008). The reasons for the changes in cognitive function due to physical activity should be further examined from a neurophysiological perspective. Exercise (i.e., cardiovascular training) facilitates angiogenesis (Black et al., 1990) and results in plasticity in new neurons or neurotransmitter systems (van Praag et al., 2005). Specifically, coordination tasks assist in the formation or reorganization of synapses (Black et al., 1990). The close relationship observed between asymmetrical coordination movements and cognitive function indicators in this sample suggests that better coordination performance may reflect preserved neural function (Cotman et al., 2007; Vaynman & Gomez-Pinilla, 2006). Finally, while exercise does not generally stimulate cognitive function, it does affect specific stages of information processing, such as the sensorimotor process (Audiffren, 2008). Coordination tasks may engage similar neural processes to cognitive tasks, which aligns with the hypothesis that exercise influences neurotransmitter activity, potentially enhancing task performance (Ferrer-Uris et al., 2022; McMorris, 2008). The reaction times and coordination exercise tasks measured in this experiment were related to the premotor cortex and supplementary motor areas, suggesting a model (profile) that could empirically complement the interrelations in these prior studies (Cotman et al., 2007; Vaynman & Gomez-Pinilla, 2006) as follows:
Figure 7a,b depicts the complex interactions between problematic behaviors observed in the older adult population, discomfort arising from these behaviors, and normal behaviors. S represents conflicting symptoms corresponding to the SEE and AC, which are of primary interest. P indicates problematic behaviors exhibited by older adults as symptoms of the issue, while I signifies the various discomforts stemming from these problematic behaviors. N refers to normal behavior, reflecting typical symptom types such as SRT and SEs. Understanding these interrelations through motor and neurological analyses may aid in creating a self-diagnostic profile of aging. First, a mismatch in asymmetric bi-manual coordination (symptom) is associated with SEE, which may indicate a decline in cognitive function. Second, discomfort (behavioral and cognitive) originates from problematic behaviors that degrade the quality of daily life, thus necessitating improvement. Third, normal behavior appears when spatial and temporal actions, along with cognitive function, are within the normal range, which should be considered a typical symptom. Finally, the mismatch between asymmetric bi-manual coordination and SEE can serve as an indicator of problematic behavior, providing essential information for cognitive and behavioral interventions in older adults (Table 6 and Table 7).
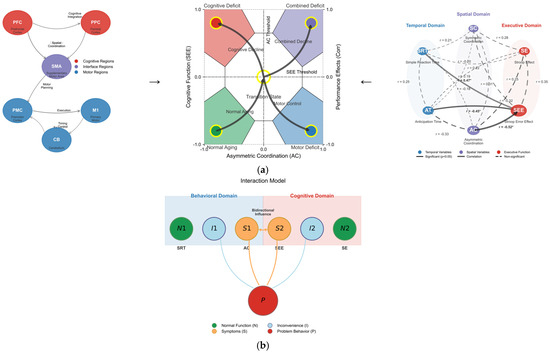
Figure 7.
(a) Comprehensive model of motor–cognitive interactions in aging. Left set: Neural pathway diagram showing brain regions supporting motor–cognitive control. Middle set: Behavioral-cognitive interaction model where S denotes the conflicting symptom (AC in motor domain, SEE in cognitive domain); P represents a problem behavior of older adults (symptoms of the problem); I is the inconvenience derived from P; and N denotes normal behavior (SRT, SE, which must be non-noticeable for the tests but considered a typical symptom). Right set: Correlation network visualizing the relationships between temporal, spatial, and executive variables with varying strengths. (b) Comprehensive illustration of interconnected interaction patterns. Symptom space mapping demonstrating how asymmetric coordination (AC) and the Stroop error effect (SEE) define four distinct functional states with transition pathways between them. The integrated model demonstrates how motor coordination abilities interact with and predict cognitive performance in aging, with asymmetric coordination serving as a critical predictor of executive function. Asterisks (*) denote statistical significance.
Table 6.
Self-check profile for cognitive and motor coordination.
Table 7.
Cognitive and motor coordination self-check sheet.
The self-diagnostic profile presented above was designed to help individuals easily assess their cognitive and motor coordination status and take the necessary actions. It is structured around five indicators: asymmetric bi-manual coordination ability, SEE, discomfort in daily activities, normal behavior, and problem behavior (See Appendix A.5 for more details of their interrelations). Each indicator describes the respective state, indicates potential concerns, and recommends appropriate actions. For example, difficulties in asymmetric bi-manual coordination can be seen as a sign of cognitive function decline, and consultation with a professional is recommended. The SEE serves as an indicator of cognitive interference, suggesting the need for cognitive and motor evaluations. Discomfort in daily activities can affect one’s quality of life, necessitating strategies for improvement through therapy or lifestyle changes, and actions are proposed for both normal and problem behaviors.
Physical activity in older adults positively affects various aspects of life, including their quality of life (Field et al., 2001; Hillman et al., 2008; Kim et al., 2007; Lindner, 2002). It positively affects all areas, including perceptual skills, intelligence quotient, achievement, verbal and math tests, and developmental levels (Sibley & Etnier, 2003). Specifically, complex coordination movements correlate highly with executive function (Castelli et al., 2007), which suggests that physical activity in old age is crucial for developing or maintaining cognitive functions (Hillman et al., 2008). This study aimed to elucidate the relationship between cognitive function and physical activity based on previous cognitive-motor research in older adults (Koulouri et al., 2022) in order to provide an effective self-diagnostic method for measuring cognitive function and offer a direct profile prototype for this population.
Although our findings indicate a positive relationship, particularly with executive functions, it is important to acknowledge several limitations. First, the sample size (n = 24) relative to the number of predictors in the regression models warrants caution in interpretation. While the participant-to-predictor ratio falls below commonly recommended thresholds (e.g., 10:1), the significant findings for AC, SRT, and AT predicting SEE provide preliminary evidence for targeted investigation in larger samples. The R2 value of 0.635 should be interpreted as potentially optimistic; future studies with larger samples should confirm these relationships. Second, the cross-sectional nature of the study makes it difficult to infer causality; therefore, future research should consider intervention studies and longitudinal designs to track cognitive changes over time. Third, this study did not control for potential confounders, including cognitive reserve (e.g., occupational complexity, lifetime intellectual engagement), color vision deficits, visual acuity, or depression, which may influence both motor coordination and Stroop test performance. Fourth, while formal sensitivity analyses were not conducted, the exclusion rate (12.5%) is within an acceptable range for reaction time studies (Ratcliff, 1993), and detailed outlier criteria are reported in Appendix A. In addition, integrating more quantitative measures of cognitive and motor abilities could refine our understanding of how specific types of physical activity contribute to cognitive resilience in an aging population. This would pave the way for tailored exercise programs that support cognitive health and quality of life among older adults.
5. Conclusions
Advancements in foundational research and technology necessary to understand and address issues related to aging have occurred across various fields such as medicine and cognitive science (brain imaging techniques, fMRI, and qualitative research methods). At the same time, artificial intelligence technologies needed to implement aging-related services through internet technology (IT) (Turnbull et al., 2022) have been developed. Integrated products that combine medical, behavioral psychology, education, and rehabilitation science have emerged (e.g., neurofeedback and therapy using virtual reality), particularly in the IT-based older adult cognitive rehabilitation service industry (e.g., SoftTools and Fast Forward). The industry has been formally developing since the 20th century, with a growing number of products and services centered on “wellness” and “anti-aging” concepts (Brink, 2023). Federal and state governments provide age-related information through various companies that participate in the formation of senior-related business models. Products mindful of older age groups are being launched, including functional games for older adults that activate dormant senses or abilities through direct actions to provide enjoyment and train the various capabilities required in daily life (Lau & Agius, 2021).
We also recognize the progressive aging situation. As the cognitive-related industry begins to receive attention, related products are being released, although they are still in the initial formation stage (e.g., the “Youthful Village” for dementia-related cognitive improvement, and the “Experiential Bicycle Game” being developed by several universities to enhance the physical strength and mobility of older adults). In particular, regarding cognitive measurement technology, programs remain limited to commercial levels for aptitude screening (e.g., memory and concentration tests for commercial drivers used by the Traffic Safety Corporation) and do not precisely match actual realities (Hoffman & Robertson, 2024). The content is not fully verified and remains at a simple level, offering only entertainment and route memorization. This reflects the rapid market growth of older-adult-related industry products and services owing to this population’s continuous increase through the Elderly-Friendly Industry Promotion Project (Gargon et al., 2014). However, sufficient discussion is not taking place. Specific diagnostic guidelines to address the complex interactions of various factors (psychological state, nutritional status, and lifestyle habits) targeting older adults (Barbour & Blumenthal, 2005) have not been established (Hillman et al., 2008).
Therefore, this study aimed to comprehensively characterize motor control abilities in older adults based on motor and cognitive control traits found in existing experiments and research. The findings can be employed to establish a detailed approach to assessing the neuromotor control traits that develop during aging by considering how older adults’ integrated motor control abilities affect the use of cognitive functions (Nshimiyimana et al., 2023). Second, we sought to develop a self-diagnostic integrated measurement technology to evaluate neuromotor control traits in older adults. Traditionally, developing a detailed understanding of the characteristics of neurological and motor control in older adults requires equipment, time, and human resources (Greenhalgh et al., 2013), which presents difficulties in terms of daily access, complexity, and high costs. Developing a unified measurement technology that allows for the self-diagnosis of aging-related neuromotor information using complex and diverse measurement equipment technologies will make it easier to assess and address aging-related diseases.
In summary, this cross-sectional study provides preliminary evidence for associations between motor coordination abilities and cognitive function in older adults. Asymmetric spatial coordination showed the strongest association with Stroop error effects, suggesting potential utility as a component of self-assessment tools. The proposed study should be considered a proof-of-concept requiring validation in larger, longitudinal studies before clinical application.
Author Contributions
Design—C.P.; data analysis—C.P.; writing and editing—C.P. and H.J.; submission—H.J. and T.L. All authors have read and agreed to the published version of the manuscript.
Funding
This research was supported by National University Development Project at Jeonbuk National University in 2023.
Institutional Review Board Statement
This study was approved by the local ethics committee (Seoul National University Institutional Review Board No. 1509/002-002, 14 September 2017) and adhered to the ethical standards of the 1964 Declaration of Helsinki (CITI Program Record ID 20481572).
Informed Consent Statement
The participants provided written informed consent to participate in this study.
Data Availability Statement
The data presented in this study are available on request from the corresponding author.
Acknowledgments
The authors sincerely thank the members of the local older adult community center and laboratory for their valuable support during the development of this data collection.
Conflicts of Interest
The authors declare no conflict of interest.
Appendix A
Appendix A.1. Asymmetry Bi-Manual Coordination Modeling
The potential of the difference between the asymmetry or spatially uncoupled bi-manual rhythmic components can be modeled as
where is the movement of the left () and right () individuals. If the relative phase between and were identical ( = 0), this pattern would be assumed to exhibit perfect symmetry. However, as the preferred movements of the individual oscillators are not the same (i.e., detuning), the expected stability of the rhythmical limb oscillation dynamics is no longer equal. Such a symmetry-breaking phenomenon is a fundamental feature of the coordinative system. From this dynamic, the different noise levels of the underlying subsystems (neural, muscular, and vascular) can be estimated around an equilibrium point. When conceptualizing the model, the operational definitions of each category are made with respect to which model has to consider the variability of the relative phase frequencies between two limbs:
The estimation between two oscillators’ relative traces () is captured by the parameter () of the preferred movement of the individual segment [] with the noise (). Given the equation of the preceding model (grouped as the kinematics of motor stability according to the coordination task of synchronization), this term has been used to capture purely functional dynamics regarding the equilibria and is usually confirmed by the time and temporal differences between an oscillating limb ( and ).
Appendix A.2. Experimental Cognitive Task

Figure A1.
Each set of prototypes (left set = English version, right set = Korean version) in the Stroop task: left = Stroop 1 (reading the word), middle = Stroop 2 (reading the color), right = Stroop 3 (reading the color, not the word) (referenced from Keele, 1972; Hecht & Reiner, 2010).
Figure A1.
Each set of prototypes (left set = English version, right set = Korean version) in the Stroop task: left = Stroop 1 (reading the word), middle = Stroop 2 (reading the color), right = Stroop 3 (reading the color, not the word) (referenced from Keele, 1972; Hecht & Reiner, 2010).

Appendix A.2.1
Table A1.
A summary of descriptive statistics pertaining to the motor coordination variable. The measures used to tap the two-target executive function (inhibition) indicators are presented in the table below.
Table A1.
A summary of descriptive statistics pertaining to the motor coordination variable. The measures used to tap the two-target executive function (inhibition) indicators are presented in the table below.
| Id | Sex | Age | Time-Based Coordination | Space-Based Coordination | ||
|---|---|---|---|---|---|---|
| SRT (s) | AT (s) | SC (Index) | AC (Index) | |||
| 1 | Female | 71 | 7.36 | 4.20 | 1.10 | 0.05 |
| 2 | Female | 72 | 8.24 | 1.69 | 1.39 | 0.47 |
| 3 | Female | 72 | 9.23 | 1.81 | 1.20 | 0.33 |
| 4 | Female | 73 | 8.51 | 1.83 | 1.30 | 0.24 |
| 5 | Male | 73 | 7.57 | 1.37 | 1.15 | 0.04 |
| 6 | Female | 78 | 6.67 | 2.45 | 1.58 | 0.5 |
| 7 | Female | 78 | 7.96 | 1.38 | 1.30 | 0.33 |
| 8 | Female | 79 | 7.98 | 2.98 | 1.25 | 0.21 |
| 9 | Female | 80 | 8.75 | 1.46 | 1.14 | 0.15 |
| 10 | Female | 80 | 6.72 | 1.29 | 1.60 | 0.5 |
| 11 | Male | 81 | 8.38 | 2.51 | 1.55 | 0.52 |
| 12 | Male | 81 | 8.21 | 2.60 | 1.10 | 0.04 |
| 13 | Male | 81 | 6.30 | 1.67 | 1.05 | 0.29 |
| 14 | Female | 82 | 8.14 | 3.14 | 1.38 | 0.02 |
| 15 | Female | 84 | 7.94 | 4.05 | 1.47 | 0.52 |
| 16 | Female | 84 | 7.49 | 1.30 | 1.63 | 0.75 |
| 17 | Female | 85 | 8.08 | 2.42 | 1.60 | 0.5 |
| 18 | Female | 87 | 8.16 | 4.13 | 1.70 | 0.63 |
| 19 | Female | 87 | 8.87 | 4.64 | 1.50 | 0.72 |
| 20 | Female | 89 | 8.95 | 4.28 | 1.23 | 0.05 |
| 21 | Female | 83 | 7.71 | 2.88 | 1.20 | 0.63 |
| 22 | Male | 78 | 9.16 | 1.70 | 1.07 | 0.05 |
| 23 | Male | 82 | 7.84 | 3.18 | 1.15 | 0.64 |
| 24 | Female | 80 | 6.20 | 1.32 | 1.54 | 0.51 |
| Averaged (M) | 7.93 | 2.51 | 1.34 | 0.36 | ||
| Variation (SD) | 0.84 | 1.10 | 0.21 | 0.24 | ||
Note. According to the cutoff score, three participants were considered outliers based on quartile deviation above the mean, and they were eliminated. See Appendix A.1 for details on participants’ scores. SRT = simple reaction time, AT = anticipation time, SC = symmetric spatial coordination, and AC = asymmetric spatial coordination.
Appendix A.2.2
Table A2.
A summary of descriptive statistics pertaining to the cognitive function variables. The measures used to tap the two-target executive function (inhibition) indicators are presented in the table below.
Table A2.
A summary of descriptive statistics pertaining to the cognitive function variables. The measures used to tap the two-target executive function (inhibition) indicators are presented in the table below.
| Id | Sex | Age | Executive Function | |
|---|---|---|---|---|
| SE (s) | SEE (Freq) | |||
| 1 | Female | 71 | 88.16 | 7.5 |
| 2 | Female | 72 | 23.13 | 2.5 |
| 3 | Female | 72 | 110.86 | 14 |
| 4 | Female | 73 | 58.15 | 20.5 |
| 5 | Male | 73 | 54.26 | 21.5 |
| 6 | Female | 78 | 72.84 | 1 |
| 7 | Female | 78 | 92.16 | 5 |
| 8 | Female | 79 | 77.49 | 10 |
| 9 | Female | 80 | 99.47 | 16 |
| 10 | Female | 80 | 60.66 | 8.5 |
| 11 | Male | 81 | 69.56 | 5.5 |
| 12 | Male | 81 | 148.05 | 11.5 |
| 13 | Male | 81 | 107.13 | 5 |
| 14 | Female | 82 | 74.19 | 10 |
| 15 | Female | 84 | 54.69 | 3 |
| 16 | Female | 84 | 105.2 | 10 |
| 17 | Female | 85 | 59 | 6 |
| 18 | Female | 87 | 68.96 | 0 |
| 19 | Female | 87 | 36.98 | 4 |
| 20 | Female | 89 | 86.49 | 18 |
| 21 | Female | 83 | 17.63 | 2 |
| 22 | Male | 78 | 149.04 | 19 |
| 23 | Male | 82 | 130.64 | 11 |
| 24 | Female | 80 | 130.7 | 6.5 |
| Averaged (M) | 82.31 | 9.08 | ||
| Variation (SD) | 35.67 | 6.31 | ||
Note. SEE = Stroop error effect, and SE = Stroop effect. According to the cutoff score, three participants were considered outliers based on quartile deviation above the mean, and they were eliminated. One participant scored 366.04 s (Z: 4.10) on the SE, another scored 33.5 f (Z: 2.53) on the SEE, and the last scored 36.5 f (Z: 2.85) on the SEE. As our data can be distorted by a greatly increased range, we considered that these three participants were not from the same population.
Appendix A.2.3. Predicted Stroop Interference Scores for Participants Based on SE (Left) and SEE (Right)

Figure A2.
Each subplot shows the linear regression line with Pearson’s correlation coefficients (r) and p values, indicating the strength and statistical significance of the relationships. The scatter plots illustrate the pairwise relationship, and asterisks on the kernel density estimation (KDE) plots in the upper triangle denote the significance levels p < 0.05, p < 0.01, and p < 0.001. The style of the regression lines varies according to the significance, assisting in visualizing the correlation strength between variable pairs. The presence of significant correlations (denoted with asterisks) highlights potential predictive relationships, whereas non-significant correlations (no asterisks) indicate a lack of evidence for a linear predictive relationship between the respective pairs of variables.

Appendix A.3
Table A3.
A summary of descriptive statistics pertaining to all the variables. The measures used to tap the two-target executive function (inhibition) indicators are presented in the table below.
Table A3.
A summary of descriptive statistics pertaining to all the variables. The measures used to tap the two-target executive function (inhibition) indicators are presented in the table below.
| Id | Sex | Age | Temporal-Based Coordination | Spatial-Based Coordination | Executive Function | |||||
|---|---|---|---|---|---|---|---|---|---|---|
| SRT (s) | AT (s) | SC (Index) | AC (Index) | SE (s) | SEE (Frequency) | |||||
| 1 | Female | 71 | 7.36 | 4.20 | 1.10 | 0.05 | 88.16 | 7.5 | ||
| 2 | Female | 72 | 8.24 | 1.69 | 1.39 | 0.47 | 23.13 | 2.5 | ||
| 3 | Female | 72 | 9.23 | 1.81 | 1.20 | 0.33 | 110.86 | 14 | ||
| 4 | Female | 73 | 8.51 | 1.83 | 1.30 | 0.24 | 58.15 | 20.5 | ||
| 5 | Male | 73 | 7.57 | 1.37 | 1.15 | 0.04 | 54.26 | 21.5 | ||
| 6 | Female | 78 | 6.67 | 2.45 | 1.58 | 0.5 | 72.84 | 1 | ||
| 7 | Female | 78 | 7.96 | 1.38 | 1.30 | 0.33 | 92.16 | 5 | ||
| 8 | Female | 79 | 7.98 | 2.98 | 1.25 | 0.21 | 77.49 | 10 | ||
| 9 | Female | 80 | 8.75 | 1.46 | 1.14 | 0.15 | 99.47 | 16 | ||
| 10 | Female | 80 | 6.72 | 1.29 | 1.60 | 0.5 | 60.66 | 8.5 | ||
| 11 | Male | 81 | 8.38 | 2.51 | 1.55 | 0.52 | 69.56 | 5.5 | ||
| 12 | Male | 81 | 8.21 | 2.60 | 1.10 | 0.04 | 148.05 | 11.5 | ||
| 13 | Male | 81 | 6.30 | 1.67 | 1.05 | 0.29 | 107.13 | 5 | ||
| 14 | Female | 82 | 8.14 | 3.14 | 1.38 | 0.02 | 74.19 | 10 | ||
| 15 | Female | 84 | 7.94 | 4.05 | 1.47 | 0.52 | 54.69 | 3 | ||
| 16 | Female | 84 | 7.49 | 1.30 | 1.63 | 0.75 | 105.2 | 10 | ||
| 17 | Female | 85 | 8.08 | 2.42 | 1.60 | 0.5 | 59 | 6 | ||
| 18 | Female | 87 | 8.16 | 4.13 | 1.70 | 0.63 | 68.96 | 0 | ||
| 19 | Female | 87 | 8.87 | 4.64 | 1.50 | 0.72 | 36.98 | 4 | ||
| 20 | Female | 89 | 8.95 | 4.28 | 1.23 | 0.05 | 86.49 | 18 | ||
| 21 | Female | 83 | 7.71 | 2.88 | 1.20 | 0.63 | 17.63 | 2 | ||
| 22 | Male | 78 | 9.16 | 1.70 | 1.07 | 0.05 | 149.04 | 19 | ||
| 23 | Male | 82 | 7.84 | 3.18 | 1.15 | 0.64 | 130.64 | 11 | ||
| 24 | Female | 80 | 6.20 | 1.32 | 1.54 | 0.51 | 130.7 | 6.5 | ||
| Mean | 7.93 | 2.51 | 1.34 | 0.36 | 82.31 | 9.08 | ||||
| Standard deviation | 0.84 | 1.10 | 0.21 | 0.24 | 35.67 | 6.31 | ||||
Note. SRT = simple reaction time, AT = anticipation time, SC = symmetric spatial coordination, AC = asymmetric spatial coordination, SEE = Stroop error effect, and SE = Stroop effect. Initially, 30 participants volunteered to participate in this experiment (female = 20, male = 10), but we eliminated six participants [3 opted out (two males, one female), 3 were outliers (two males, one female)]. Thus, the total data we analyzed consisted of 24 sets. (See the explanation given in the manuscript.) Specifically, according to the exclusion criteria score, which identified outliers based on quartile deviation above the mean, we decided to delete three data points. One participant scored 366.04 s (Z: 4.10) on the SE, another scored 33.5 f (Z: 2.53) on the SEE, and the last scored 36.5 f (Z: 2.85) on the SEE. Because our data can be distorted by a greatly increased range, we considered that these three were not from the same population.
Appendix A.4
Table A4.
Multiple-regression analyses for spatial coordination predicting the Stroop Test interference time.
Table A4.
Multiple-regression analyses for spatial coordination predicting the Stroop Test interference time.
| Variable | β | T | Significant t | R2 |
|---|---|---|---|---|
| Dependent variable: Stroop effects | 0.246 | |||
| Age | 0.177 | 0.196 | 0.452 | |
| SRT | −0.138 | −0.532 | 0.602 | |
| AT | −0.210 | −0.751 | 0.463 | |
| SC | −0.295 | −1.002 | 0.330 | |
| AC | −0.085 | −0.253 | 0.803 | |
| SEE | 0.177 | 0.512 | 0.518 | |
| Dependent variable: Stroop error effects | 0.635 | |||
| Age | 0.160 | 0.909 | 0.376 | |
| SRT | 0.359 | 2.250 | 0.038 * | |
| AT | −0.388 | −2.230 | 0.040 * | |
| SC | −0.120 | −0.576 | 0.572 | |
| AC | −0.475 | −2.321 | 0.033 * | |
| SE | 0.086 | 0.512 | 0.615 | |
Note. * p < 0.05; SRT = simple reaction time, AT = anticipation time, SC = symmetric spatial coordination, AC = asymmetric spatial coordination, SEE = Stroop error effect, and SE = Stroop effect. Using the regression-based approach, the raw scores of each independent variable were normalized to Z scores. The dependent variable was the Stroop interference score.
Appendix A.5. Predicting the Target Variables Using the Stroop Error Test

Figure A3.
The image presents two decision trees side-by-side for predicting the target variables SEE (left panel) and SE (right panel), both using the same set of predictors: SRT, AT, SC, and AC.
Figure A3.
The image presents two decision trees side-by-side for predicting the target variables SEE (left panel) and SE (right panel), both using the same set of predictors: SRT, AT, SC, and AC.

The decision nodes are color-coded according to the importance weights of the variables in each tree, with more vivid colors indicating a higher impact on the model’s decision-making process. The left panel predicting the Stroop error effect (SEE) uses variable AC (Accuracy) as the main splitting factor, highlighted with a bold red color, indicating its significance in error prediction. Nodes corresponding to SEE are shown in blue, marking their influence in error fluctuation predictions. The right panel predicting the Stroop effect (SE) highlights the AC variable again as a key indicator, represented in orange to distinguish it from the SEE model. Nodes associated with the SEE are marked with a distinct magenta color, showing the variance explained by these nodes. The data-driven simulation emphasizes the distinct roles of AC in both models, and the weights of each node are reflected in the proportional node size and color intensity. This visualization enables a clearer understanding of how feature importance and variable influence differ.
References
- American Psychological Association. (2000). Publication manual of the american psychological association (5th ed.). APA. [Google Scholar]
- Audiffren, M. (2008). Acute exercise and psychological functions: A cognitive-energetic approach. In T. McMorris, P. Tomporowski, & M. Audiffren (Eds.), Exercise and cognitive function (pp. 3–39). Wiley-Blackwell. [Google Scholar]
- Barbour, K. A., & Blumenthal, J. A. (2005). Exercise training and depression in older adults. Neurobiology of Aging, 26(Suppl. S1), 119–123. [Google Scholar] [CrossRef]
- Bäckman, L., Lindenberger, U., Li, S. C., & Nyberg, L. (2010). Linking cognitive aging to alterations in dopamine neurotransmitter functioning: Recent data and future avenues. Neuroscience and Biobehavioral Reviews, 34(5), 670–677. [Google Scholar] [CrossRef] [PubMed]
- Beek, P. J., & Turvey, M. T. (1992). Temporal patterning in cascade juggling. Journal of Experimental Psychology. Human Perception and Performance, 18(4), 934–947. [Google Scholar] [CrossRef] [PubMed]
- Bernstein, N. A. (1967). The coordination and regulation of movements. Pergamon Press. [Google Scholar]
- Black, J. E., Isaacs, K. R., Anderson, B. J., Alcantara, A. A., & Greenough, W. T. (1990). Learning causes synaptogenesis, whereas motor activity causes angiogenesis, in cerebellar cortex of adult rats. Proceedings of the National Academy of Sciences of the United States of America, 87(14), 5568–5572. [Google Scholar] [CrossRef] [PubMed]
- Booth, F. W., & Lees, S. J. (2006). Physically active subjects should be the control group. Medicine and Science in Sports and Exercise, 38(3), 405–406. [Google Scholar] [CrossRef]
- Brink, S. (2023). The longevity dividend: Later life, lifelong learning and productive societies (Vol. 39). Springer Nature. [Google Scholar]
- Burpee, R. H., & Stroll, W. (1936). Measuring reaction time of athletes. Research Quarterly. American Physical Education Association, 7(1), 110–118. [Google Scholar] [CrossRef]
- Cabeza, R. (2001). Cognitive neuroscience of aging: Contributions of functional neuroimaging. Scandinavian Journal of Psychology, 42(3), 277–286. [Google Scholar] [CrossRef]
- Carson, R. G., & Kelso, J. A. (2004). Governing coordination: Behavioural principles and neural correlates. Experimental Brain Research, 154(3), 267–274. [Google Scholar] [CrossRef]
- Castelli, D. M., Hillman, C. H., Buck, S. M., & Erwin, H. E. (2007). Physical fitness and academic achievement in third and fifth grade students. Journal of Sport and Exercise Psychology, 29(2), 239–252. [Google Scholar] [CrossRef]
- Colcombe, S., & Kramer, A. F. (2003). Fitness effects on the cognitive function of older adults: A meta-analytic study. Psychological Science, 14(2), 125–130. [Google Scholar] [CrossRef]
- Colcombe, S. J., Erickson, K. I., Scalf, P. E., Kim, J. S., Prakash, R., McAuley, E., Elavsky, S., Marquez, D. X., Hu, L., & Kramer, A. F. (2006). Aerobic exercise training increases brain volume in aging humans. Journals of Gerontology. Series A, Biological Sciences and Medical Sciences, 61(11), 1166–1170. [Google Scholar] [CrossRef] [PubMed]
- Colcombe, S. J., Kramer, A. F., Erickson, K. I., Scalf, P., McAuley, E., Cohen, N. J., Webb, A., Jerome, G. J., Marquez, D. X., & Elavsky, S. (2004). Cardiovascular fitness, cortical plasticity, and aging. Proceedings of the National Academy of Sciences of the United States of America, 101(9), 3316–3321. [Google Scholar] [CrossRef] [PubMed]
- Cotman, C. W., Berchtold, N. C., & Christie, L. A. (2007). Exercise builds brain health: Key roles of growth factor cascades and inflammation. Trends in Neurosciences, 30(9), 464–472. [Google Scholar] [CrossRef] [PubMed]
- Fatouros, I. G., Taxildaris, K., Tokmakidis, S. P., Kalapotharakos, V., Aggelousis, N., Athanasopoulos, S., Zeeris, I., & Katrabasas, I. (2002). The effects of strength training, cardiovascular training and their combination on flexibility of inactive older adults. International Journal of Sports Medicine, 23(2), 112–119. [Google Scholar] [CrossRef]
- Ferrer-Uris, B., Ramos, M. A., Busquets, A., & Angulo-Barroso, R. (2022). Can exercise shape your brain? A review of aerobic exercise effects on cognitive function and neuro-physiological underpinning mechanisms. AIMS Neuroscience, 9(2), 150–174. [Google Scholar] [CrossRef]
- Fiani, B., Zhu, L., Musch, B. L., Briceno, S., Andel, R., Sadeq, N., & Ansari, A. Z. (2021). The neurophysiology of caffeine as a central nervous system stimulant and the resultant effects on cognitive function. Cureus, 13(5), e15032. [Google Scholar] [CrossRef]
- Field, T., Diego, M., & Sanders, C. E. (2001). Exercise is positively related to adolescents’ relationships and academics. Adolescence, 36(141), 105–110. [Google Scholar]
- Fleishman, E. A. (1972). On the relation between abilities, learning, and human performance. American Psychologist, 27(11), 1017–1032. [Google Scholar] [CrossRef]
- Fontaine, K. R., Redden, D. T., Wang, C., Westfall, A. O., & Allison, D. B. (2003). Years of life lost due to obesity. JAMA, 289(2), 187–193. [Google Scholar] [CrossRef]
- Friedman, N. P., & Robbins, T. W. (2022). The role of prefrontal cortex in cognitive control and executive function. Neuropsychopharmacology, 47(1), 72–89. [Google Scholar] [CrossRef]
- Gajewski, P. D., Falkenstein, M., Thönes, S., & Wascher, E. (2020). Stroop task performance across the lifespan: High cognitive reserve in older age is associated with enhanced proactive and reactive interference control. NeuroImage, 207, 116430. [Google Scholar] [CrossRef] [PubMed]
- Gargon, E., Gurung, B., Medley, N., Altman, D. G., Blazeby, J. M., Clarke, M., & Williamson, P. R. (2014). Choosing important health outcomes for comparative effectiveness research: A systematic review. PLoS ONE, 9(6), e99111. [Google Scholar] [CrossRef] [PubMed]
- Greenhalgh, T., Wherton, J., Sugarhood, P., Hinder, S., Procter, R., & Stones, R. (2013). What matters to older people with assisted living needs? A phenomenological analysis of the use and non-use of telehealth and telecare. Social Science and Medicine, 93, 86–94. [Google Scholar] [CrossRef] [PubMed]
- Haken, H., Kelso, J. A., & Bunz, H. (1985). A theoretical model of phase transitions in human hand movements. Biological Cybernetics, 51(5), 347–356. [Google Scholar] [CrossRef]
- Harper, S. (2014). Economic and social implications of aging societies. Science, 346(6209), 587–591. [Google Scholar] [CrossRef]
- Hecht, D., & Reiner, M. (2010). Stroop interference and facilitation effects in kinesthetic and haptic tasks. Advances in Human-Computer Interaction, 2010, 852420. [Google Scholar] [CrossRef]
- Henry, F. M. (1961). Reaction time—Movement time correlations. Perceptual and Motor Skills, 12(1), 63–66. [Google Scholar] [CrossRef]
- Hick, W. E. (1952). On the rate of gain of information. Quarterly Journal of Experimental Psychology, 4(1), 11–26. [Google Scholar] [CrossRef]
- Hillman, C. H., Erickson, K. I., & Kramer, A. F. (2008). Be smart, exercise your heart: Exercise effects on brain and cognition. Nature Reviews. Neuroscience, 9(1), 58–65. [Google Scholar] [CrossRef]
- Hillman, C. H., Motl, R. W., Pontifex, M. B., Posthuma, D., Stubbe, J. H., Boomsma, D. I., & de Geus, E. J. C. (2006). Physical activity and cognitive function in a cross-section of younger and older community-dwelling individuals. Health Psychology, 25(6), 678–687. [Google Scholar] [CrossRef]
- Hoffman, S., & Robertson, C. B. (2024). Patient autonomy, public safety, and drivers with cognitive decline. UC Irvine Law Review [in press]. Case Legal Studies Res Pap (Vol. 3). Available online: https://scholarlycommons.law.case.edu/faculty_publications/2245 (accessed on 10 February 2026).
- Hunter, S. K., Pereira, H. M., & Keenan, K. G. (2016). The aging neuromuscular system and motor performance. Journal of Applied Physiology, 121(4), 982–995. [Google Scholar] [CrossRef] [PubMed]
- Kandel, E. R., Schwartz, J. H., Jessell, T. M., Siegelbaum, S. A., Hudspeth, A. J., & Mack, S. (Eds.). (2000). Principles of neural science (4th ed.). McGraw-Hill. [Google Scholar]
- Kaplan, H., Hill, K., Lancaster, J., & Hurtado, A. M. (2000). A theory of human life history evolution: Diet, intelligence, and longevity. Evolutionary Anthropology: Issues, News, and Reviews: Issues, News, and Reviews, 9(4), 156–185. [Google Scholar] [CrossRef]
- Keele, S. W. (1972). Attention demands of memory retrieval. Journal of Experimental Psychology, 93(2), 245–248. [Google Scholar] [CrossRef] [PubMed]
- Keele, S. W., Ivry, R. I., & Pokorny, R. A. (1987). Force control and its relation to timing. Journal of Motor Behavior, 19(1), 96–114. [Google Scholar] [CrossRef]
- Kim, H., Lee, S. H., Kim, S. S., Yoo, J. H., & Kim, C. J. (2007). The influence of maternal treadmill running during pregnancy on short-term memory and hippocampal cell survival in rat pups. International Journal of Developmental Neuroscience, 25(4), 243–249. [Google Scholar] [CrossRef]
- Koulouri, T., Macredie, R. D., & Olakitan, D. (2022). Chatbots to support young adults’ mental health: An exploratory study of acceptability. ACM Transactions on Interactive Intelligent Systems, 12(2), 1–39. [Google Scholar] [CrossRef]
- Lau, S. Y. J., & Agius, H. (2021). A framework and immersive serious game for mild cognitive impairment. Multimedia Tools and Applications, 80(20), 31183–31237. [Google Scholar] [CrossRef]
- Lindner, K. J. (2002). The physical activity participation-academic performance relationship revisited: Perceived and actual performance and the effect of banding (academic tracking). Pediatric Exercise Science, 14(2), 155–169. [Google Scholar] [CrossRef]
- Lövdén, M., Bäckman, L., Lindenberger, U., Schaefer, S., & Schmiedek, F. (2010). A theoretical framework for the study of adult cognitive plasticity. Psychological Bulletin, 136(4), 659–676. [Google Scholar] [CrossRef]
- Lustig, C., Shah, P., Seidler, R., & Reuter-Lorenz, P. A. (2009). Aging, training, and the brain: A review and future directions. Neuropsychology Review, 19(4), 504–522. [Google Scholar] [CrossRef]
- MacLeod, C. M. (1991). Half a century of research on the Stroop effect: An integrative review. Psychological Bulletin, 109(2), 163–203. [Google Scholar] [CrossRef] [PubMed]
- Maguire, E. A., Frith, C. D., & Morris, R. G. (1999). The functional neuroanatomy of comprehension and memory: The importance of prior knowledge. Brain, 122(10), 1839–1850. [Google Scholar] [CrossRef] [PubMed]
- Marks, B. L., Madden, D. J., Bucur, B., Provenzale, J. M., White, L. E., Cabeza, R., & Huettel, S. A. (2007). Role of aerobic fitness and aging on cerebral white matter integrity. Annals of the New York Academy of Sciences, 1097(1), 171–174. [Google Scholar] [CrossRef] [PubMed]
- McMorris, T. (2008). Exercise and cognitive function: A neuroendocrinological explanation. In P. D. T. Terry, & M. Audiffren (Eds.), Exercise and cognitive function (pp. 41–68). Wiley-Blackwell. [Google Scholar]
- Mulder, T., Zijlstra, W., & Geurts, A. (2002). Assessment of motor recovery and decline. Gait and Posture, 16(2), 198–210. [Google Scholar] [CrossRef][Green Version]
- Nshimiyimana, J., Uwihoreye, P., Muhigirwa, J. C., & Niyonsega, T. (2023). Neurofunctional intervention approaches. In H. Nakano (Ed.), Neurorehabilitation and physical therapy. IntechOpen. [Google Scholar] [CrossRef]
- Office of Disease Prevention and Health Promotion. (2010). Department of health and human services. Healthy People, 2, 15–28. [Google Scholar]
- Park, C. (2022). Eigenproperties of perception (dynamic touch) and action (phase dynamic) out of diversities. Human Movement Science, 85, 102999. [Google Scholar] [CrossRef]
- Park, D. C., & Reuter-Lorenz, P. A. (2009). The adaptive brain: Aging and neurocognitive scaffolding. Annual Review of Psychology, 60, 173–196. [Google Scholar] [CrossRef]
- Pelz, J., Hayhoe, M., & Loeber, R. (2001). The coordination of eye, head, and hand movements in a natural task. Experimental Brain Research, 139(3), 266–277. [Google Scholar] [CrossRef]
- Planinsec, J. (2002). Relations between the motor and cognitive dimensions of preschool girls and boys. Perceptual and Motor Skills, 94(2), 415–423. [Google Scholar] [CrossRef]
- Ratcliff, R. (1993). Methods for dealing with reaction time outliers. Psychological Bulletin, 114(3), 510–532. [Google Scholar] [CrossRef]
- Rinn, R., Keller, F. M., Peters, M., Pischke, C. R., Voelcker-Rehage, C., & Lippke, S. (2023). Physical activity and social participation in older adults in a cross-over intervention trial. Zeitschrift für Psychologie, 231(4), 265–277. [Google Scholar] [CrossRef]
- Rose, D. K., & Winstein, C. J. (2013). Temporal coupling is more robust than spatial coupling: An investigation of interlimb coordination after stroke. Journal of Motor Behavior, 45(4), 313–324. [Google Scholar] [CrossRef] [PubMed]
- Rosenbaum, D. A. (2005). The Cinderella of psychology: The neglect of motor control in the science of mental life and behavior. American Psychologist, 60(4), 308–317. [Google Scholar] [CrossRef] [PubMed]
- Schmidt, R. A., Lee, T. D., Winstein, C., Wulf, G., & Zelaznik, H. N. (2018). Motor control and learning: A behavioral emphasis. Human Kinetics. [Google Scholar]
- Shi, J., Wang, J., Lang, J., Zhang, Z., Bi, Y., Liu, R., Jiang, S., & Hou, L. (2020). Effect of different motor skills training on motor control network in the frontal lobe and basal ganglia. Biology of Sport, 37(4), 405–413. [Google Scholar] [CrossRef] [PubMed]
- Sibley, B. A., & Etnier, J. L. (2003). The relationship between physical activity and cognition in children: A meta-analysis. Pediatric Exercise Science, 15(3), 243–256. [Google Scholar] [CrossRef]
- Smiley-Oyen, A. L., Lowry, K. A., Francois, S. J., Kohut, M. L., & Ekkekakis, P. (2008). Exercise, fitness, and neurocognitive function in older adults: The “selective improvement” and “cardiovascular fitness” hypotheses. Annals of Behavioral Medicine, 36(3), 280–291. [Google Scholar] [CrossRef]
- Spirduso, W. W. (1980). Physical fitness, aging, and psychomotor speed: A review. Journal of Gerontology, 35(6), 850–865. [Google Scholar] [CrossRef]
- Stojan, R., Mack, M., Bock, O., & Voelcker-Rehage, C. (2023). Inefficient frontal and parietal brain activation during dual-task walking in a virtual environment in older adults. NeuroImage, 273, 120070. [Google Scholar] [CrossRef]
- Stuss, D. T., & Benson, D. F. (1986). The frontal lobes. Raven Press. [Google Scholar]
- Trudeau, F., & Shephard, R. J. (2008). Physical education, school physical activity, school sports and academic performance. International Journal of Behavioral Nutrition and Physical Activity, 5(1), 10. [Google Scholar] [CrossRef]
- Turnbull, A., Kaplan, R. M., Adeli, E., & Lin, F. V. (2022). A novel explainability approach for technology-driven translational research on brain aging. Journal of Alzheimer’s Disease, 88(4), 1229–1239. [Google Scholar] [CrossRef]
- UN DESA. (2019). Population division. World population prospects 2019: Highlights. Un ST/ESA/SER A/423. Available online: https://population.un.org/wpp/Publications/Files/WPP2019_Highlights.pdf (accessed on 10 February 2026).
- van Praag, H., Shubert, T., Zhao, C., & Gage, F. H. (2005). Exercise enhances learning and hippocampal neurogenesis in aged mice. Journal of Neuroscience, 25(38), 8680–8685. [Google Scholar] [CrossRef]
- Vaynman, S., & Gomez-Pinilla, F. (2006). Revenge of the “sit”: How lifestyle impacts neuronal and cognitive health through molecular systems that interface energy metabolism with neuronal plasticity. Journal of Neuroscience Research, 84(4), 699–715. [Google Scholar] [CrossRef]
- Voelcker-Rehage, C., Godde, B., & Staudinger, U. M. (2010). Physical and motor fitness are both related to cognition in old age. European Journal of Neuroscience, 31(1), 167–176. [Google Scholar] [CrossRef]


Disclaimer/Publisher’s Note: The statements, opinions and data contained in all publications are solely those of the individual author(s) and contributor(s) and not of MDPI and/or the editor(s). MDPI and/or the editor(s) disclaim responsibility for any injury to people or property resulting from any ideas, methods, instructions or products referred to in the content. |
© 2026 by the authors. Licensee MDPI, Basel, Switzerland. This article is an open access article distributed under the terms and conditions of the Creative Commons Attribution (CC BY) license.