Abstract
Sandstones and many carbonates (e.g., oolitic limestone and other grainstones), comprise solid particulates (grains) and pores, which have a given pore network architecture relationship, and associated porosity—permeability values. Over time, through the process of diagenesis, the pore network architecture may be extensively altered. Changes can include compaction, particle deformation, cementation, dissolution and fracturing, with the pathway followed after deposition depending on factors such as the energy level, rate of burial, degree of biological activity, local heat flow, sediment composition, Eh, pH and the presence or absence of organic materials. Any method that provides a means of modelling changes is therefore highly desirable, in particular, allowing a prediction of changes in porosity and permeability with time. The current work illustrates a simple method that uses freely available open source image analysis software to model the development of cement phases within an oolitic limestone in three-dimensions. As well as cementation, it demonstrates the modelling of fracture development and dissolution processes, and records how porosity and permeability change during such processes.
Keywords:
three-dimensional modelling; oolite; cementation; fracturing; dissolution; porosity; permeability 1. Introduction
Oolitic limestones are geologically common, particularly within the Jurassic of Europe [1,2,3,4,5], and also common within the Carboniferous [5,6,7], Permo-Triassic [8] and with recent to modern oolitic sands forming within the Bahaman Banks area [9,10]. Such limestones are highly variable in both porosity and permeability [7,8], but are commonly well cemented [11].
Oolitic limestones are relatively simple in terms of diagenesis. First, one or more radially developed rimming cements grow directly on top of the ooid surface (typically up to 30 microns thick), followed by a coarser pore filling sparry cement that occludes the majority of the remaining pore space [11,12].
Oolites are particularly of interest due to their significance as reservoirs for oil and gas, and potential to form reservoirs for CO2 storage, all of which require a detailed prediction of the evolution of porosity and permeability.
Numerous publications have dealt with the 3D modelling of geological porous media, such as sandstones and carbonates, producing stochastically constructed binary models of solid and pore distribution [13,14,15,16,17,18]. Such models typically use specialised software, require substantial computational effort and use training images based on pore-grain relationships recorded optically, or through scanning electron microscopy (SEM). As such they do not offer the possibility to model changes in cement formation, or the effects of dissolution with time, but are essentially frozen snap shots, from which porosity, permeability and other physical parameters can be reconstructed. A few notable exceptions to this [19,20] have attempted to model and illustrate various stages, or styles, of cementation. In particular, Kameda [20] used MATLAB (MathWorks, Natick, MA, USA) to model grain-bridging, random pore fillings, quartz overgrowths and patchy cement formation.
Here we use a simple, widely available method to test the potential for modelling cementation, fracturing and dissolution of oolitic limestone, with particular emphasis in illustrating changes to porosity and permeability. Ooids are treated as simple structures with no internal structure (no intraparticulate or moldic porosity), and no attempt has been made to actively take compaction into account. Nevertheless, results are interesting, and the technique can be further developed in the future. The technique can be used to produce zones of cementation that bear a close resemblance to the morphologies observed within many sedimentary rock systems, yet does not require specialised software or hardware, and is easy to use with no need for knowledge of scripting or programming.
2. Materials and Methods
2.1. Base Models
Virtual oolitic limestones base models were constructed using two methods: (i) A digitally constructed binary cartoon was drawn using Photoshop (Adobe Systems, San Jose, CA, USA), with dimensions of 400 pixels × 400 pixels (Figure 1A), which was then input into an in-house software: Pore Architecture Reconstruction software (PAR [18]), formatted as 400 pixels × 400 pixels × 400 pixels, to produce a representative 3D reconstruction of an oolitic limestone (Figure 1D). (ii) From loose Bahamian ooids (Figure 1B), typically 400–900 µm in size, placed within a mould and stabilised with superglue, prior to scanning by X-ray tomography (XRT), using a Nikon XTH225 kV cabinet system (Nikon Corporation, Tokyo, Japan). The latter was then reconstructed and saved as a binary TIFF image stack (400 pixels × 400 pixels × 400 pixels), which was used as the second 3D model (Figure 1E). In both cases pores were represented in black (Figure 1D,E). Both models were modified using the following workflow.
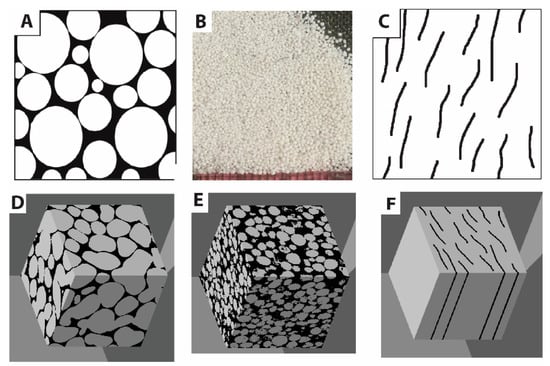
Figure 1.
Examples of materials used to construct base images: (A) Binary 2D cartoon of nominal oolitic limestone structure, (B) loose grains of Bahamian ooids (ruler along base graduated in mm), (C) binary 2D cartoon of idealized simple fracture system. Additionally, (D–F) binary 3D models of solid (grey) versus pore/fracture (black), developed from (A–C), respectively. Note (D) and (E) represent the base models of oolitic limestone architecture prior to modification, and (F) is the base fracture network that was utilized to superimpose on (D) and (E) after the addition of cement. Scales in (A), (C) was 400 pixels × 400 pixels and in (D–F) was 400 voxels × 400 voxels × 400 voxels.
2.2. Addition of Cement
Image stacks were uploaded to the image analysis software FIJI (open source software, Wayne Rasband, National Institutes of Health, USA), and underwent the addition of cement by applying a global dilation to each image slice within the stack (Figure 2B,C), adding white pixels at black-white boundaries, using the binary ‘options’ submenu. Essentially, using a ‘count’ of one result in the addition of a simple rimming style cement (Figure 2B), while a ‘count’ of three produced the addition of material in a fashion that mimics sparry cement, with angular crystal style terminations (see Figure 2C). Each stage was saved as a binary 3D RAW image stack.
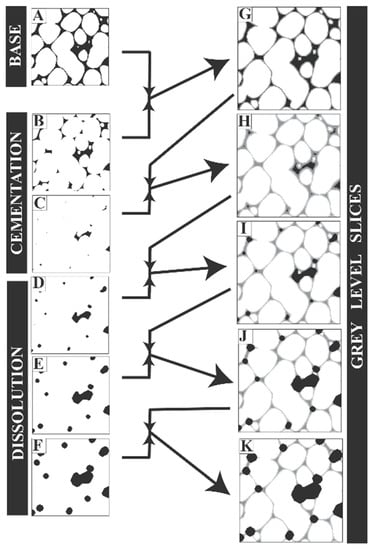
Figure 2.
Representative workflow used for cementation and dissolution phases of modelling. (A) Horizontal binary slice (2D) through cartoon based 3D model of the base oolite (solid grains and pores only, no cement, etc.). (B) and (C) same slice as in (A), but after the respective addition of phase 1 and phase 2 cement. (D–F) As in previous slices, but with the sequential dissolution of pore walls. (G–K) Grayscale slices (based on binary slices in (A–F)), taken from 3D grayscale models; resulting from sequential averaging of consecutive slices/models (i.e., A + B = G, C + G = H, D + H = I, …). 3D grayscale models developed to visualise the development of cement and pores. Note that fractures and fracture/pore dissolution was also developed using this method but not illustrated. All slices were 400 voxels × 400 voxels.
2.3. Dissolution
After cementation, using the same process, dissolution was mimicked by applying a global “erode” (with a ‘count’ of three) to each image slice within the stack (Figure 2D–F), adding black pixels at black-white boundaries; having the effect of opening up pores. Each stage was again saved as a binary 3D RAW image stack.
2.4. Fracturing
A binary image of a simplified fracture system was digitally drawn using Photoshop (Figure 1C), and saved in the same 400 pixels × 400 pixels format of the previous models. The image was placed within a folder, and duplicated to produce 400 identical images. The image sequence was then imported into FIJI as an image stack, and saved as a 3D binary RAW file (Figure 1F). This results in the production of a series of vertical fractures, represented as black fractures within a white background. Fracture models (stacks) were merged with the cartoon diagenesis models (stacks), using the ‘Image Calculator’ within FIJI (using image1 ‘min’ image2), with each result saved as a binary 3D model (RAW file). In addition, prior to merging, the fracture model was twice systematically enlarged, using the binary ‘options’ submenu, applying a global ‘erode’ with a ‘count’ of three. Both resulting fracture networks were merged with the cement model, and also saved as binary 3D models.
2.5. Fracturing and Dissolution
Finally, the binary cemented cartoon model that incorporated the base fracture model (from 2.4) was modified by progressively increasing both fracture and pore size, using the global ‘erode’ method (also with a ‘count’ of three) to mimic the effect of dissolution on both fractures and pores. All generated models were again saved as binary 3D models.
2.6. Visualization (Non-Binary)
After each stage (2.2 to 2.5), FIJI was used to merge each new iteration of the model stack with that from the previous, using the ‘Image Calculator’ function within the ‘Process’ menu (using image1 ‘average’ image2). This results in an image stack comprising grayscale images that illustrate the distribution of grain, cement, pore, enhanced dissolution pores and fractures. Examples of individual slices, for the cementation and pore dissolution stages are illustrated in Figure 2G–K. All constructed models were saved as 3D grayscale models in the RAW format. For purposes of clarity, these were later opened within SLICER version 1.1 (Fortner Research LLC, Sterling, VA, USA) to produce false coloured 3D models utilizing the ‘Rainbow’ LUT (Figure 3), and these were used for illustrative purposes throughout the paper.
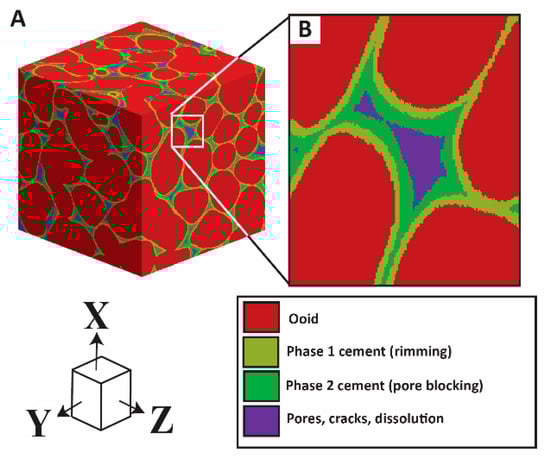
Figure 3.
Key to coloured 3D models (colourised using ‘Rainbow’ LUT in Slicer software). Note that due to the vagaries of the software, that though phase 1 cement is colourised yellow here, it appears green in models where only phase 1 is present.
2.7. Porosity, Permeability Modelling
At each stage (cementation, dissolution, fracturing, fracturing and dissolution), model results were saved as binary (porosity versus solid) 3D RAW files, which were processed using the in-house Pore Analysis Tools software (PAT), to extract permeability values for the X, Y and Z directions, as well as porosity. This followed the procedure of extracting a geometrical/topological network, representative of the pore network structure earlier constructed by the PAR software, by the stochastic generation of spherical nodes (representing pore space) and connecting bonds (pore throats). Further details on this method can be found elsewhere [14,16,17].
3. Results and Discussion
Both methods successfully mimicked the initial rimming cement phase and subsequent coarser sparry pore filling cements (Figure 4 and Figure 5). Although the technique does not directly replicate the detailed microstructure of these cements (fibrous radial and mosaic of larger equant crystals [12]), it does simulate the distribution of each phase; forming a simple rim that conforms to the shape of the ooid (phase 1) and terminating with residual pores with well-developed crystal faces (phase 2; compare Figure 3; Figure 4B,C; Figure 5B,C with Figure 6). Porosity and permeability values obtained are within the common ranges of many Jurassic and Triassic oolitic limestones [12], suggesting that the values obtained for modelling cement formation are realistic.
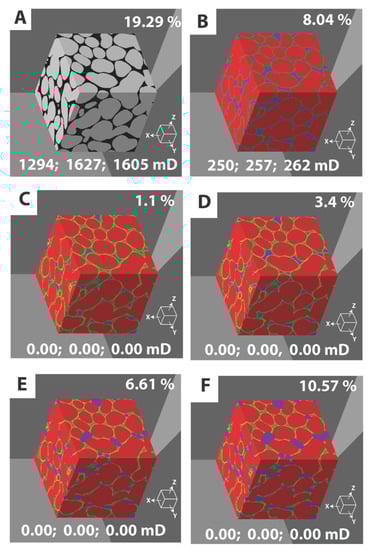
Figure 4.
Three-dimensional models of oolitic limestone, developed from a cartoon based 2D image. (A) Base binary model of carbonate grains (ooids) and interparticle pores; (B) and (C) colourised grayscale 3D images representing phase 1 (riming) and phase 2 (pore blocking) cements; (D–F) as in (B), (C), but illustrating progressive pore dissolution. All images also show recorded porosity (top right), and permeability in the X, Y and Z directions (bottom); with results obtained through the use of the PAT software.
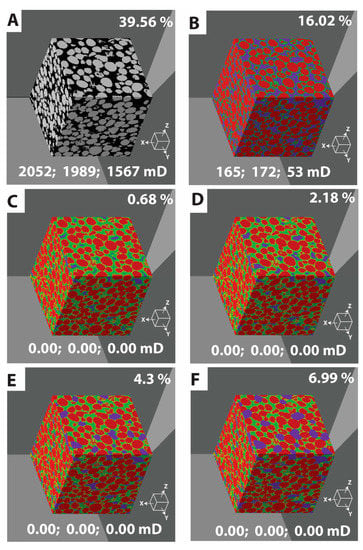
Figure 5.
Three-dimensional models of oolitic limestone, developed from an X-ray tomography (XRT) scan of Bahamian ooids. (A) Base binary model of carbonate grains (ooids) and interparticle pores; (B) and (C) colourised grayscale 3D images representing phase 1 (riming) and phase 2 (pore blocking) cements; (D–F) as in (B), (C), but illustrating progressive pore dissolution. All images also show recorded porosity (top right), and permeability in the X, Y and Z directions (bottom); with results obtained through the use of the PAT software.
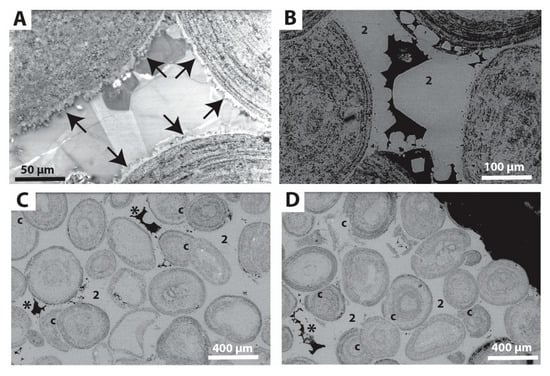
Figure 6.
Scanning Electron Microscope (SEM) images of a typical Jurassic oolitic limestone, from a polished thin section. (A) Charge contrast image, illustrating rimming cement (arrows), and equant pore blocking cement; (B) backscattered (BSE) image illustrating pore blocking cement (2), and angular residual pores (black); (C) and (D) BSE images, with wider field of views, illustrating pore blocking cement (2), angular residual pores (*) and compacted grains (c). All images obtained in low-vacuum mode using an FEI Quanta FEG 650 SEM.
Vertical fractures were also successfully added to the cartoon based cemented model structure, with three sizes of fracture applied (Figure 7A–C) imitating fracking, and two further models simulating dissolution (acidisation) of both cracks and pores (Figure 7D,E). Fracture morphology is overly simplified, but not necessarily non-representative of the real world. Future improvements could be made by extracting real fracture networks from XRT and superimposing over similar scaled rock models. Enlargement/dissolution of the modelled cracks produced realistic images, however no method was available to produce more random shaped dissolution of pores, nor the ability to only select pores connected to the fracture network; introducing a degree of departure from the real-world.
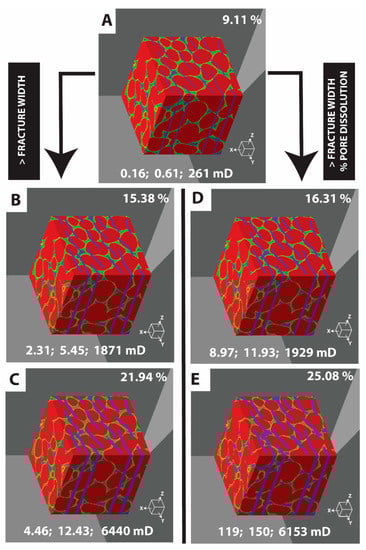
Figure 7.
Three-dimensional colourised grayscale models of oolitic limestone, developed from a cartoon based 2D image. (A) Model with two phases of cement, and superimposed simple fracture system. (B) and (C) as in (A), but with progressively wider fractures. (D) and (E) as in (A), but with fractures and pores progressively enlarged by dissolution. All images also show recorded porosity (top right), and permeability in the X, Y and Z directions (bottom); with results obtained through the use of the PAT software.
For both sets of models, a large drop in permeability was produced (for X, Y and Z directions) with the introduction of the rimming phase 1 cement (Figure 4B and Figure 5B). This would be expected, as a small amount of cement added in this way would quickly occlude pore throats. In addition, both models indicate that after the formation of the sparry second phase of cement, that permeability would be minimal (0.00), which would be expected given the isolated disconnected nature of the residual pores typically formed during this phase (Figure 4C and Figure 5C). In reality it is unlikely that permeability would be reduced to absolute zero, as open pathways would be required to allow replenishment of the cementing media.
Following dissolution (both models), up to 10.57% porosity was produced, representing an increase of 9.47%, which in the case of the cartoon model is greater than original porosity left after the formation of the phase 1 rimming cement. However, despite the increase in porosity, none of the models showed an improvement in permeability (=0.00). This prediction is expected, as despite the increase in porosity, these pores are mainly isolated and disconnected (Figure 8). This particular model is therefore not representative of wormhole development, or dissolution of grain/pore surfaces found along naturally occurring permeability pathways. The latter being capable of increasing permeability from ~3D to 60–111D within the Ketton (oolitic) Limestone [21].
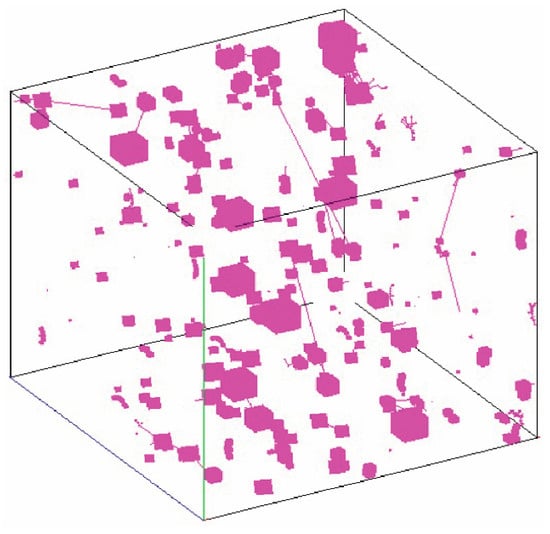
Figure 8.
Three-dimensional model of the cartoon based oolitic limestone, after three phases of dissolution, showing the disconnected nature of the pores (pink). Note some pores are connected to each other (pink lines), but no connections pass through the sample, and therefore no permeability.
Vertically orientated fractures of the cemented models showed progressively increasing porosity (on widening of the fractures), producing an increase in permeability in all directions, but most noticeably in the Z direction, parallel to the fractures (Figure 7A–C). The small increase in permeability in the X and Y directions (compared to the previous non-fractured models) indicates a degree of connectivity between pores introduced through the vertical fractures. In addition, the flow in the X direction was perpendicular to the fracture orientation, giving less assistance in connecting pores, while flow in the Y direction could partly flow along fractures, but required a connection to the open pores to jump between fractures.
For models with dissolution of fractures and pores (Figure 7D,E), results were generally similar to those models that had undergone fracturing only. However, there was a notable small increase (compared to the fracture only models Figure 7B,C) of permeability in the X and Y directions, owing to the increased connectivity between fractures due to dissolution enlargement of pores.
These results were significant, in terms of oolitic limestones, for both oil and gas reservoirs, as well as the potential for CO2 storage, indicating that for both extraction and storage, fracturing and artificial dissolution (acidisation) might be required. The addition of information on intra-particulate or moldic porosity (incorporating detailed information on the internal ooid structure) to the style of models produced herein has the potential to unlock information on the fuller range of porosities and permeabilities observed within oolites. As would the addition of more realistic fracture models, derived from XRT imaging.
Importantly, this modelling method has the potential to better understand the wettability of various fluids (oil and brine) as they interact with the different surfaces and cements exposed within the sample due to dissolution; which is possible due to the information within the RAW data files, contained within the grey level of the images. The information on the distribution of cement types, as opposed to just pore versus solid distribution, contained within the models also unlocks the further possibility of utilizing information on strength, acoustic attenuation properties, etc. within digital rock physics (DRP).
The method does not currently allow for the effect of localised grain compaction and dissolution (stylolite formation), which can be an important factor in the diagenesis of oolitic limestones (Figure 6C,D). Interestingly, a closer inspection of the model developed through the cartoon workflow displays particles that bear a close similarity to compacted grains observed in SEM micrographs, although this is purely an artefact rather than through design. In some cases, compaction can lead to large-scale dissolution through the formation of stylolites, which is not covered within the current model workflow. Such compaction could in all likelihood with some further careful thought be added to these models.
It is also worth noting that due to computing considerations, the current models are constrained to 400 pixels × 400 pixels × 400 pixels (voxels), therefore the resolution that any 3D model is constructed at needs to be carefully considered, especially if it is desired to represent micron thick cements.
4. Conclusions
This is a simple method for the modelling of oolitic limestone cementation, fracturing and dissolution. Its importance lies in the fact that it can be performed on standard desktop or laptop computers, and that the majority of modelling is carried out using open source software (FIJI). In addition, no knowledge of either scripting or programming is required. Calculation of porosity and relative permeability were based upon in-house software (PAT), although other packages are also available to perform this function. The models produced using the methods outlined herein produce realistic results for cementation and are useful in respect to both oil and gas reservoirs, as well as in terms of CO2 storage. Information extracted from the superimposition of fractures was of interest, but could be much improved through the addition of more realistic/complex fracture networks scanned via XRT. Although acting as a useful starting point, and demonstration of the technique, the method applied for dissolution within the models lacked more precise means of implementation, and would require further development, to simulate observed forms of dissolution within carbonates. The technique can be readily applied to other carbonates, as well as to sandstones and mudstones. Finally, the ability to create 3D models that contain information on the distribution of cement phases (and potentially different grain compositions) opens up the potential for the more detailed implementation of wettability into flow models, and the introduction of factors such as variability in strength into DRP investigations.
Author Contributions
Conceptualization, methodology, SEM analysis, image processing, writing, review and editing, J.B. X-ray Tomography acquisition, review and editing, S.H.
Funding
This research received no external funding.
Acknowledgments
J.B. acknowledges Zeyun Jiang and Tianshen Huang (Heriot-Watt University) for use of PAR and PAT software, Eugene Rankey (University of Kansas) and Helen Lewis (Heriot-Watt University) for the Bahamian ooid particles used, and the Institute of Petroleum Engineering (Heriot-Watt University) for use of the scanning electron microscopy and digital imaging hub facilities. S.H. acknowledges permission from Research Centre for Carbon Solutions (Heriot-Watt University) for access to X-ray Tomography facilities.
Conflicts of Interest
The authors declare no conflict of interest.
References
- Fronteau, G.; Scheider-Thomachot, C.; Chopin, E.; Barbin, V.; Mouze, D.M.; Pascal, A. Black-crust growth and interaction with underlying limestone microfacies. In Natural Stone Resources for Historical Monuments; Prikryl, R., Török, A., Eds.; Geological Society: London, UK, 2010; Volume 333, pp. 25–34. [Google Scholar]
- Ingham, J. Geomaterials under the Microscope: A Colour Guide; Academic Press: Cambridge, MA, USA, 2010. [Google Scholar]
- Lebedev, M.; Zhang, Y.; Sarmadivaleh, M.; Barifcani, A.; Al-Khdheeawi, E.; Iglauer, S. Carbon geosequestration in limestone: Pore-scale dissolution and geomechanical weakening. Int. J. Greenh. Gas Control 2017, 66, 106–119. [Google Scholar] [CrossRef]
- Preto, N.; Breda, A.; Dal Corso, J.; Franceschi, M.; Rocca, F.; Spada, C.; Roghi, G. The Loppio Oolitic Limestone (Early Jurassic, Southern Alps): A prograding oolitic body with high original porosity originated by a carbonate platform crisis and recovery. Mar. Petrol. Geol. 2017, 79, 394–411. [Google Scholar] [CrossRef]
- Loughlin, G.F. Indiana Oolitic Limestone: Relation of its natural features to its commercial grading. Contrib. Econ. Geol. Bull. 1929, 811, 113–202. [Google Scholar]
- Jones, W.B. The oolitic limestone deposits of Franklin County, Alabahma. Econ. Geol. 1939, 34, 573–580. [Google Scholar] [CrossRef]
- Byrnes, A.P.; Franseen, E.K.; Watney, W.L.; Dubois, M.K. The Role of Moldic Porosity in Paleozoic Kansas Reservoirs and the Association of Original Depositional Facies and Early Diagenesis with Reservoir Properties. Kansas Geological Survey; Open-file Report 2003-32; Kansas Geological Survey: Lawrence, KS, USA, 2003. [Google Scholar]
- Esrafili-Dizaji, B.; Rahimpour-Bonab, H. Effects of depositional and diagenetic characteristics on carbonate reservoir quality: A case study from the South Pars gas field in the Persian Gulf. Petrol. Geosci. 2009, 15, 325–344. [Google Scholar] [CrossRef]
- Newell, N.D.; Purdy, E.G.; Imbrie, J. Bahamian oölitic sand. J. Geol. 1960, 68, 481–497. [Google Scholar] [CrossRef]
- Kornicker, L.S. The Bahama Banks: A “living” fossil-environment. J. Geol. Educ. 1963, 11, 17–25. [Google Scholar] [CrossRef]
- Charalampidou, E.-M.; Garcia, S.; Buckman, J.; Cordoba, P.; Lewis, H.; Maroto-Valer, M. Impact of CO2-induced geochemical reactions on the mechanical integrity of carbonate rocks. Energy Proced. 2017, 114, 3150–3156. [Google Scholar] [CrossRef]
- Buckman, J.; Charalampidou, E.; Zihms, S.; Lewis, H.; Corbett, P.; Couples, G.; Jiang, Z.; Huang, T. High-resolution large area scanning electron microscopy: An imaging tool for porosity and diagenesis of carbonate rock systems. In Carbonate Pore Systems: New Developments and Case Studies; SEPM Society for Sedimentary Geology: Tulsa, OK, USA, 2019. [Google Scholar]
- Wu, K.; Van Dijke, M.I.J.; Couples, G.D.; Jiang, Z.; Ma, J.; Sorbie, K.S.; Crawford, J.; Young, I.; Zhang, X. 3D stochastic modelling of heterogeneous porous media – applications to reservoir rocks. Transp. Porous Med. 2006, 65, 443–467. [Google Scholar] [CrossRef]
- Jiang, Z.; Wu, K.; Couples, G.; van Dijke, M.; Sorbie, K.S.; Ma, J. Efficient extraction of pore networks from three-dimensional porous media. Water Resour. Res. 2007, 43, 2578–2584. [Google Scholar] [CrossRef]
- Van Dijke, M.I.J.; Jiang, Z.; Wu, K.; Wang, C.; Al-Abri, M.; Sorbie, K.; Couples, G. Prediction of multi-phase flow properties of heterogeneous rocks based on stochastic pore-network generation. In Proceedings of the International Conference on Flows and Mechanics in Natural Porous Media from Pore to Field Scale—Pore2Field, IFP Energies Nouvelles/Rueil-Malmaison, Paris, France, 16–18 November 2011. [Google Scholar]
- Jiang, Z.; van Dijke, M.I.J.; Wu, K.; Couples, G.D.; Sorbie, K.S.; Ma, J. Stochastic pore network generation from 3D rock images. Transp. Porous Med. 2012, 94, 571–593. [Google Scholar] [CrossRef]
- Jiang, Z.; van Dijke, M.I.J.; Sorbie, K.S.; Couples, G.D. Representation of multiscale heterogeneity via multiscale pore networks. Water Resour. Res. 2013, 49, 5437–5449. [Google Scholar] [CrossRef]
- Huang, T.; Jiang, Z.; van Dijke, R.; Geiger, S.; Petrovskyy, D. Reconstruction of complex 3D pore structure in carbonates from 2D images using global optimization. In Proceedings of the InterPore 10th Annual Meeting and Jubilee, New Orleans, LA, USA, 14–17 May 2018. [Google Scholar]
- Keehm, Y.; Mukerji, T.; Nur, A. Computational rock physics at the pore scale: Transport properties and diagenesis in realistic pore geometries. Lead. Edge 2001, 20, 180–183. [Google Scholar] [CrossRef]
- Kameda, A. Permeability Evolution in Sandstone: Digital Rock Approach. Ph.D. Thesis, Stanford University, Stanford, CA, USA, 2004. [Google Scholar]
- Singh, K.; Anabaraonye, B.U.; Blunt, M.J.; Crawshaw, J. Partial dissolution of carbonate rock grains during reactive CO2-saturated brine injection under reservoir conditions. Adv. Water Resour. 2018, 122, 27–36. [Google Scholar] [CrossRef]
© 2019 by the authors. Licensee MDPI, Basel, Switzerland. This article is an open access article distributed under the terms and conditions of the Creative Commons Attribution (CC BY) license (http://creativecommons.org/licenses/by/4.0/).